Embed Size (px)
Citation preview

Investor PresentationMarch 2018
| 2
Forward Looking Statements
OUTSTANDING
EXECUTION &
DELIVERY
DISCIPLINED
CAPITAL
ALLOCATION
BROAD PORTFOLIO
OF DIFFERENTIATED
SOLUTIONS
This presentation contains forward-looking statements within the meaning of the Private Securities Litigation Reform Act of 1995, including but not limited to
the statements on the slides entitled “Q1 FY18 Key Highlights”, “Full-Year 2018 Guidance”, “Long-Term Growth FY18-FY22”, “Acquisition of KapStone Paper
& Packaging”, “KapStone Brings Enhanced Scale and Expanded Product Offering”, “Expected KapStone Synergies”, “Acquisition of Plymouth Packaging”,
“Synergy and Performance Improvements”, and “Mill Maintenance Schedule”, that give guidance or estimates for future periods as well as statements
regarding, among other things, that we expect to realize $150 million of additional adjusted operating cash flow due to the Tax Cuts and Jobs Act; our
integration of MPS is on track; we expect 10% revenue growth (to >$16.3 billion), 25% to 30% adjusted operating cash flow growth (to > $2.45 billion) and
20% adjusted segment EBITDA growth (to >$2.8 billion) in fiscal 2018 compared to fiscal 2017; we will generate adjusted segment EBITDA of more than $2.8
billion in fiscal 2018, more than $3.3 billion under the base case and more than $4 billion in fiscal 2022; the acquisition of KapStone (a) creates opportunity for
approximately $200 million in cost synergies and performance improvements, (b) strengthens WestRock’s presence on the West Coast, (c) broadens
WestRock’s portfolio of differentiated paper and packaging solutions with the addition of attractive paper grades and distribution capabilities, (d) increases mix
of virgin fiber based paper in WestRock’s paper portfolio and (e) is expected to be immediately accretive to WestRock’s adjusted earnings and cash flow,
inclusive of purchase accounting adjustments; the combined company will be positioned to generate strong cash flow for rapid debt paydown that should
allow the leverage ratio to return to 2.25x to 2.50x target by the end of fiscal 2019; the transaction is expected to close in the quarter ending September 30,
2018; we expect fiscal 2018 combined net sales of approximately $20 billion, with 63% from corrugated packaging and 37% from consumer packaging; we
expect the full run rate of synergies and performance improvements by the end of fiscal 2021 and the allocation of synergies and performance improvements
as presented on slide 12; the acquisition of Plymouth Packaging (i) further develops our innovation platform and our differentiation strategy, (ii) enhances our
automated packaging systems business and our differentiation in e-commerce and other custom applications where on-site box making is needed and (iii)
improves our margin profile and growth prospects, and moves us closer to our 80% integration goal; we are on track to achieve our $1 billion synergy and
performance improvement target by the end of the third quarter of fiscal 2018; and we expect our mill maintenance schedule in fiscal 2018 to be executed as
presented on slide 18.
Forward-looking statements are based on our current expectations, beliefs, plans or forecasts and are typically identified by words or phrases such as "may,"
"will," "could," "should," "would," "anticipate," "estimate," "expect," "project," "intend," "plan," "believe," "target," "prospects," "potential" and "forecast," and
other words, terms and phrases of similar meaning. Forward-looking statements involve estimates, expectations, projections, goals, forecasts, assumptions,
risks and uncertainties. WestRock cautions readers that a forward-looking statement is not a guarantee of future performance and that actual results could
differ materially from those contained in the forward-looking statement. With respect to forward-looking statements, WestRock has made assumptions
regarding, among other things, the results and impacts of the acquisition of KapStone; whether and when the waiting period under the Hart-Scott-Rodino
Antitrust Improvements Act will expire or terminate; whether and when antitrust approvals in Austria, Germany and Mexico are obtained; whether and when
the other conditions to the completion of the KapStone acquisition, including the receipt of KapStone stockholder approval, will be satisfied; economic,
competitive and market conditions generally; volumes and price levels of purchases by customers; competitive conditions in WestRock’s businesses and
possible adverse actions of their customers, competitors and suppliers. Further, WestRock’s businesses are subject to a number of general risks that would
affect any such forward-looking statements. Such risks and other factors that may impact management's assumptions are more particularly described in our
filings with the Securities and Exchange Commission, including in Item 1A under the caption "Risk Factors" in our Annual Report on Form 10-K for the year
ended September 30, 2017 and our Quarterly Report on Form 10-Q for the quarter ended December 31, 2017. The information contained herein speaks as of
the date hereof and WestRock does not have or undertake any obligation to update or revise its forward-looking statements, whether as a result of new
information, future events or otherwise.
| 3
Additional Information
OUTSTANDING
EXECUTION &
DELIVERY
DISCIPLINED
CAPITAL
ALLOCATION
BROAD PORTFOLIO
OF DIFFERENTIATED
SOLUTIONS
Additional Information and Where to Find It
This communication may be deemed to be solicitation material in respect of the proposed transaction among Whiskey Holdco, Inc., a Delaware corporation
(“Holdco”), WestRock, a Delaware corporation (“WestRock”), and KapStone Paper and Packaging Corporation, a Delaware corporation (“KapStone”). In
connection with the proposed transaction, Holdco intends to file with the SEC the registration statement on Form S-4 (the “Registration Statement”) which will
include a prospectus with respect to shares of Holdco’s common stock to be issued in the proposed transaction and a proxy sta tement for KapStone’s
stockholders (the “Proxy Statement”) and KapStone will mail the Proxy Statement to its stockholders and file other documents regarding the proposed
acquisition with the SEC. Stockholders of WestRock and KapStone are urged to read all relevant documents filed with the SEC, including the
Registration Statement and the Proxy Statement, because they will contain important information about the proposed transaction. Investors and
security holders are able to obtain the documents (once available) free of charge at the SEC’s web site, http://www.sec.gov. Such documents are not
currently available.
Participants in Solicitation
WestRock, Holdco and KapStone and their respective directors and executive officers, may be deemed to be participants in the solicitation of proxies from
the holders of shares of KapStone common stock in respect of the proposed transaction. Information about the directors and executive officers of WestRock
is set forth in the proxy statement for WestRock’s 2018 Annual Meeting of stockholders, which was filed with the SEC on December 19, 2017. Information
about the directors and executive officers of KapStone is set forth in the proxy statement for KapStone’s 2017 Annual Meeting of stockholders, which was
filed with the SEC on April 5, 2017. Investors may obtain additional information regarding the interest of such participants by reading the Registration
Statement and the Proxy Statement (once available).
No Offer or Solicitation
This communication is neither an offer to sell, nor a solicitation of an offer to buy any securities, the solicitation of any vote or approval in any jurisdiction
pursuant to or in connection with the proposed transaction or otherwise, nor shall there be any sale, issuance or transfer of securities in any jurisdiction in
contravention of applicable law. No offer of securities shall be made except by means of a prospectus meeting the requirements of Section 10 of the
Securities Act of 1933, as amended (the “Securities Act”), and otherwise in accordance with applicable law.
| 4
Disclaimer; Non-GAAP Financial Measures
OUTSTANDING
EXECUTION &
DELIVERY
DISCIPLINED
CAPITAL
ALLOCATION
BROAD PORTFOLIO
OF DIFFERENTIATED
SOLUTIONS
We may from time to time be in possession of certain information regarding WestRock that applicable law would not require us to disclose to the public in the
ordinary course of business, but would require us to disclose if we were engaged in the purchase or sale of our securities. This presentation shall not be
considered to be part of any solicitation of an offer to buy or sell WestRock securities. This presentation also may not include all of the information regarding
WestRock that you may need to make an investment decision regarding WestRock securities. Any investment decision should be made on the basis of the
total mix of information regarding WestRock that is publicly available as of the date of the investment decision.
We report our financial results in accordance with accounting principles generally accepted in the United States ("GAAP"). However, management believes
certain non-GAAP financial measures provide users with additional meaningful financial information that should be considered when assessing our ongoing
performance. Management also uses these non-GAAP financial measures in making financial, operating and planning decisions and in evaluating our
performance. Non-GAAP financial measures should be viewed in addition to, and not as an alternative for, our GAAP results. The non-GAAP financial
measures we present may differ from similarly captioned measures presented by other companies. See the Appendix for details about these non-GAAP
financial measures, as well as the required reconciliations.
| 5
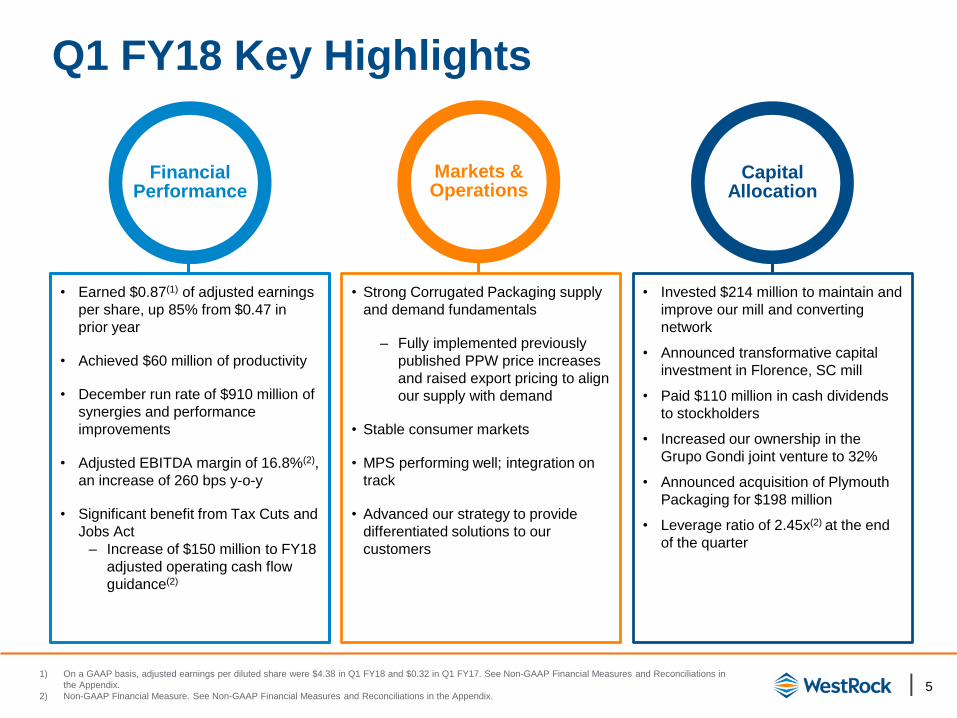
Q1 FY18 Key Highlights
1) On a GAAP basis, adjusted earnings per diluted share were $4.38 in Q1 FY18 and $0.32 in Q1 FY17. See Non-GAAP Financial Measures and Reconciliations in
the Appendix.
2) Non-GAAP Financial Measure. See Non-GAAP Financial Measures and Reconciliations in the Appendix.
• Strong Corrugated Packaging supply
and demand fundamentals
‒ Fully implemented previously
published PPW price increases
and raised export pricing to align
our supply with demand
• Stable consumer markets
• MPS performing well; integration on
track
• Advanced our strategy to provide
differentiated solutions to our
customers
• Invested $214 million to maintain and
improve our mill and converting
network
• Announced transformative capital
investment in Florence, SC mill
• Paid $110 million in cash dividends
to stockholders
• Increased our ownership in the
Grupo Gondi joint venture to 32%
• Announced acquisition of Plymouth
Packaging for $198 million
• Leverage ratio of 2.45x(2) at the end
of the quarter
• Earned $0.87(1) of adjusted earnings
per share, up 85% from $0.47 in
prior year
• Achieved $60 million of productivity
• December run rate of $910 million of
synergies and performance
improvements
• Adjusted EBITDA margin of 16.8%(2),
an increase of 260 bps y-o-y
• Significant benefit from Tax Cuts and
Jobs Act
‒ Increase of $150 million to FY18
adjusted operating cash flow
guidance(2)
Financial Performance
Markets & Operations
Capital Allocation
| 6
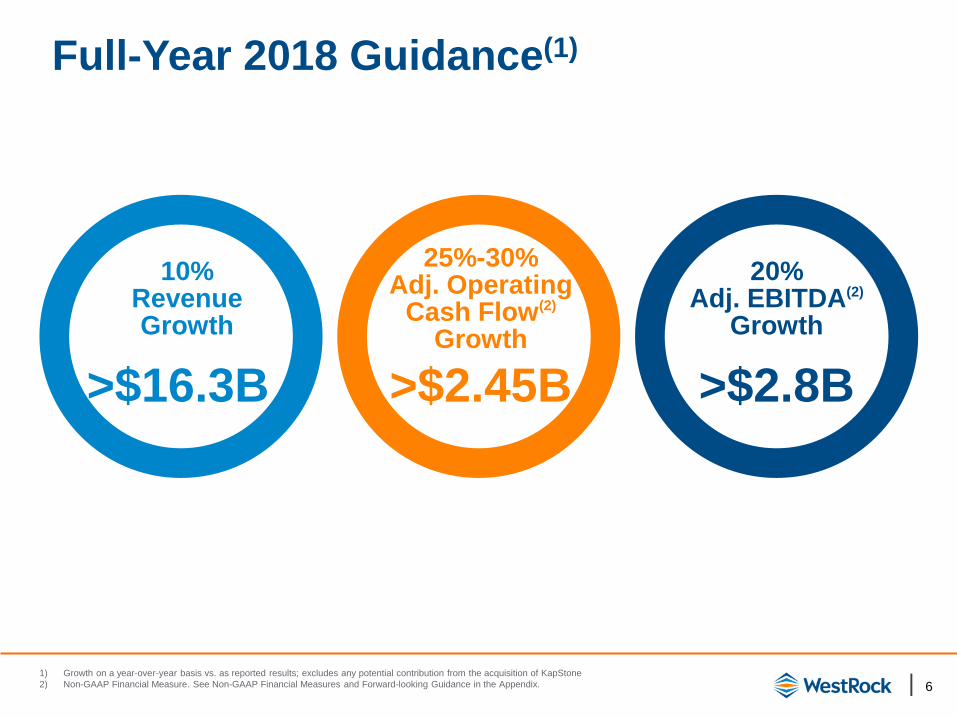
Full-Year 2018 Guidance(1)
10%Revenue Growth
>$16.3B
20%Adj. EBITDA(2)
Growth
>$2.8B
25%-30% Adj. Operating
Cash Flow(2)
Growth
>$2.45B
1) Growth on a year-over-year basis vs. as reported results; excludes any potential contribution from the acquisition of KapStone
2) Non-GAAP Financial Measure. See Non-GAAP Financial Measures and Forward-looking Guidance in the Appendix.
| 7
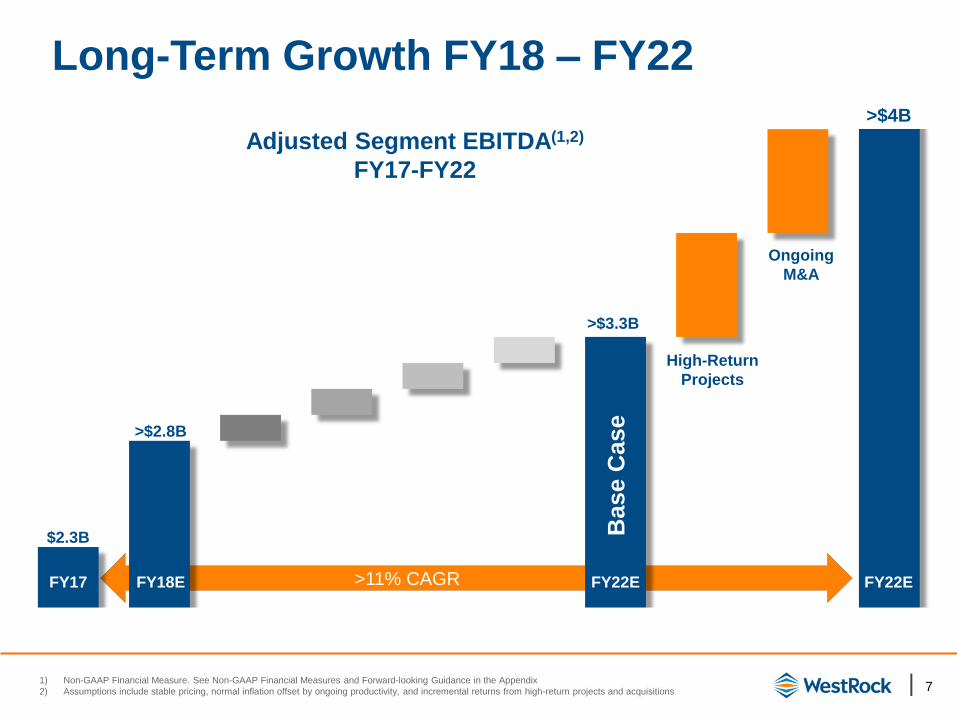
>11% CAGR
Long-Term Growth FY18 – FY22
1) Non-GAAP Financial Measure. See Non-GAAP Financial Measures and Forward-looking Guidance in the Appendix
2) Assumptions include stable pricing, normal inflation offset by ongoing productivity, and incremental returns from high-return projects and acquisitions
$2.
3B
>$4B
Ongoing
M&A
High-Return
Projects
>$2.8B
$2.3B
FY18E FY22EFY17
Base C
ase
>$3.3B
Adjusted Segment EBITDA(1,2)
FY17-FY22
FY22E
| 8
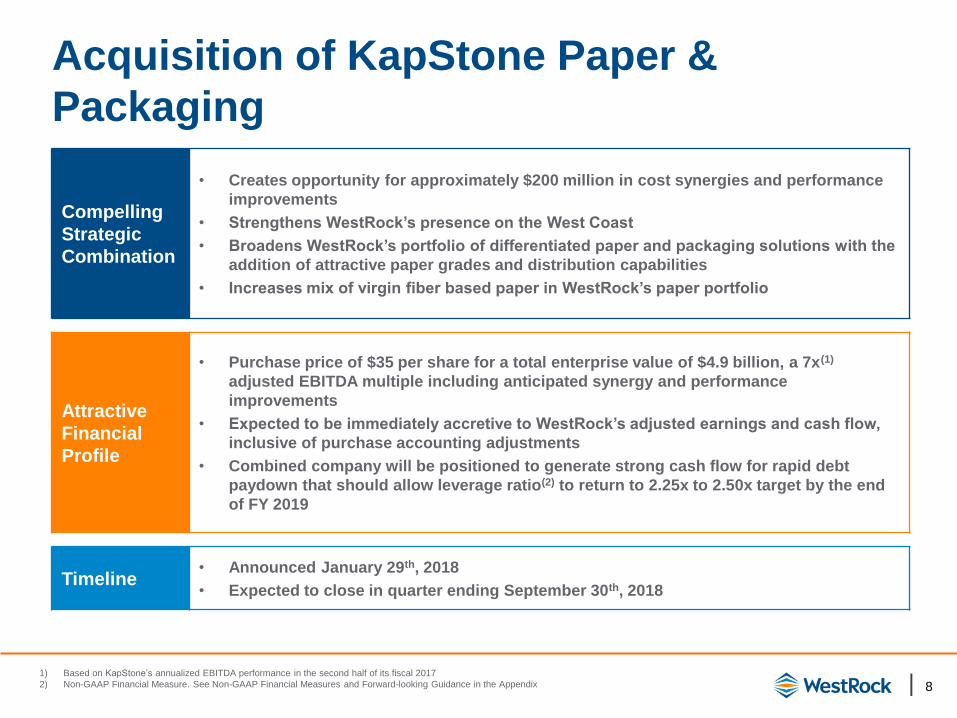
Acquisition of KapStone Paper &
Packaging
1) Based on KapStone’s annualized EBITDA performance in the second half of its fiscal 2017
2) Non-GAAP Financial Measure. See Non-GAAP Financial Measures and Forward-looking Guidance in the Appendix
Compelling
Strategic
Combination
• Creates opportunity for approximately $200 million in cost synergies and performance
improvements
• Strengthens WestRock’s presence on the West Coast
• Broadens WestRock’s portfolio of differentiated paper and packaging solutions with the
addition of attractive paper grades and distribution capabilities
• Increases mix of virgin fiber based paper in WestRock’s paper portfolio
Attractive
Financial
Profile
• Purchase price of $35 per share for a total enterprise value of $4.9 billion, a 7x(1)
adjusted EBITDA multiple including anticipated synergy and performance
improvements
• Expected to be immediately accretive to WestRock’s adjusted earnings and cash flow,
inclusive of purchase accounting adjustments
• Combined company will be positioned to generate strong cash flow for rapid debt
paydown that should allow leverage ratio(2) to return to 2.25x to 2.50x target by the end
of FY 2019
Timeline• Announced January 29th, 2018
• Expected to close in quarter ending September 30th, 2018
| 9
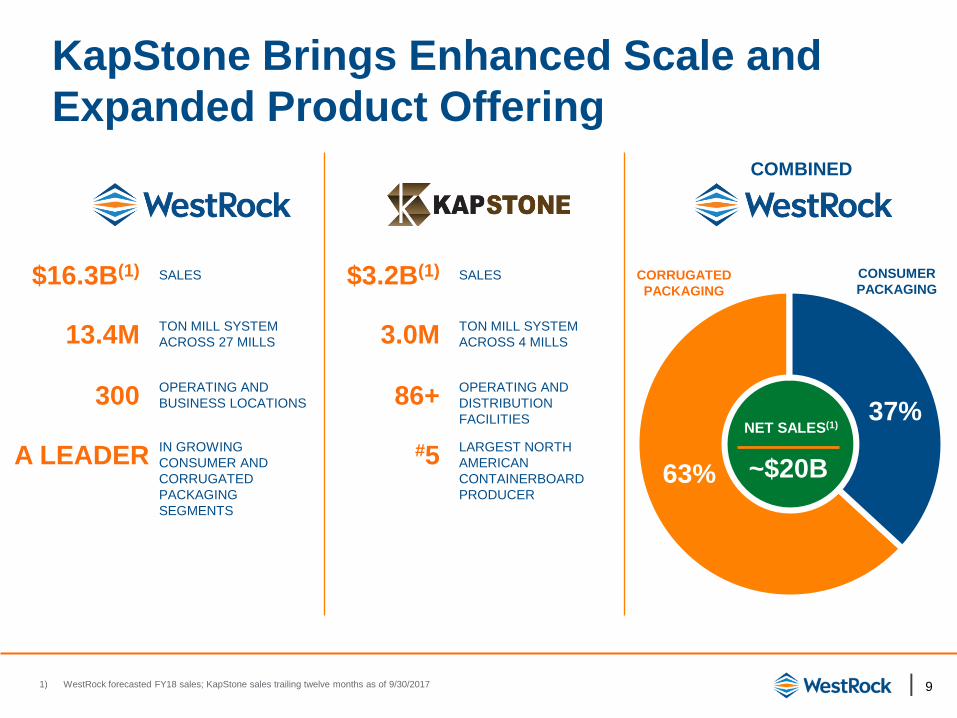
KapStone Brings Enhanced Scale and
Expanded Product Offering
1) WestRock forecasted FY18 sales; KapStone sales trailing twelve months as of 9/30/2017
COMBINED
$16.3B(1) SALES $3.2B(1) SALES
13.4MTON MILL SYSTEM
ACROSS 27 MILLS 3.0MTON MILL SYSTEM
ACROSS 4 MILLS
300OPERATING AND
BUSINESS LOCATIONS 86+OPERATING AND
DISTRIBUTION
FACILITIES
A LEADER IN GROWING
CONSUMER AND
CORRUGATED
PACKAGING
SEGMENTS
#5LARGEST NORTH
AMERICAN
CONTAINERBOARD
PRODUCER
~$20B
37%
63%
NET SALES(1)
CORRUGATED
PACKAGING
CONSUMER
PACKAGING
| 10
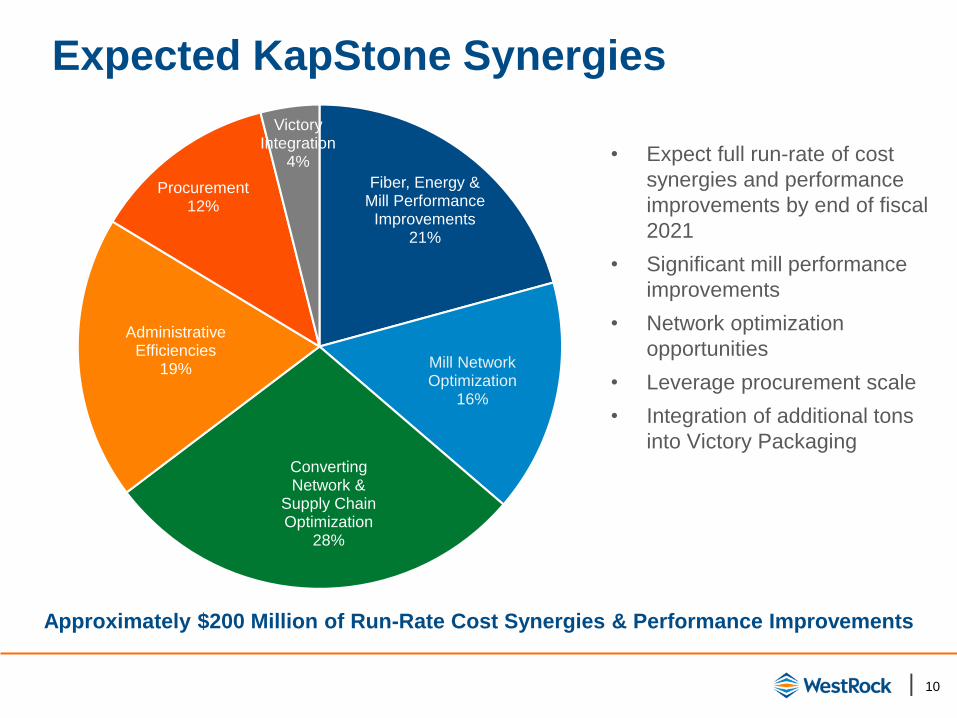
Expected KapStone Synergies
Fiber, Energy & Mill Performance
Improvements21%
Mill Network Optimization
16%
Converting Network &
Supply Chain Optimization
28%
Administrative Efficiencies
19%
Procurement12%
Victory Integration
4% • Expect full run-rate of cost
synergies and performance
improvements by end of fiscal
2021
• Significant mill performance
improvements
• Network optimization
opportunities
• Leverage procurement scale
• Integration of additional tons
into Victory Packaging
Approximately $200 Million of Run-Rate Cost Synergies & Performance Improvements
| 11
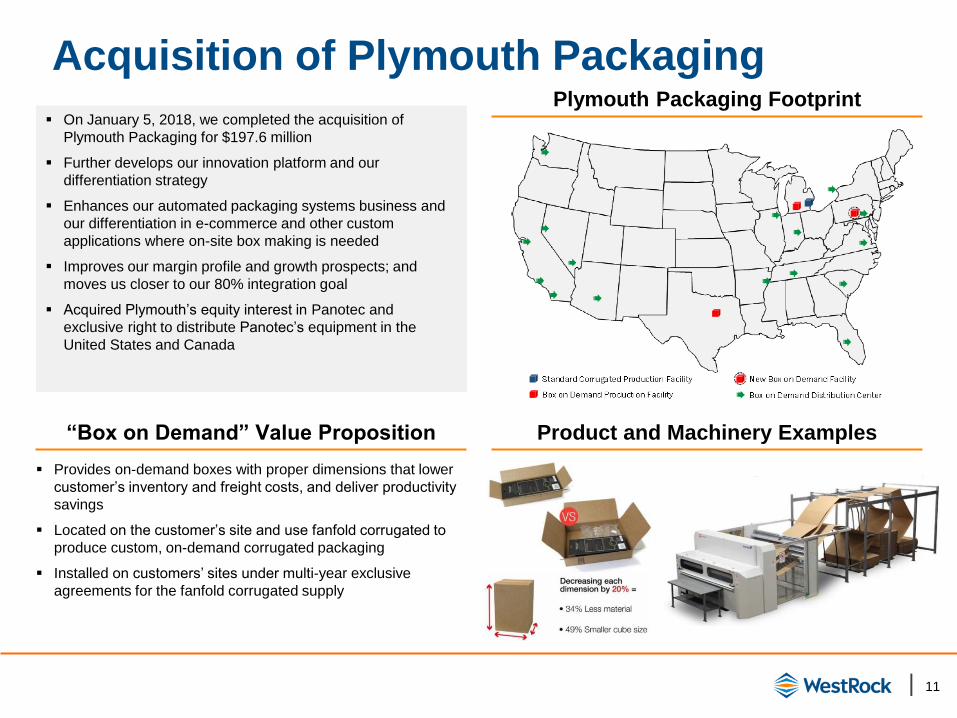
Acquisition of Plymouth Packaging
OUTSTANDING
EXECUTION &
DELIVERY
DISCIPLINED
CAPITAL
ALLOCATION
BROAD PORTFOLIO
OF DIFFERENTIATED
SOLUTIONS
▪ On January 5, 2018, we completed the acquisition of
Plymouth Packaging for $197.6 million
▪ Further develops our innovation platform and our
differentiation strategy
▪ Enhances our automated packaging systems business and
our differentiation in e-commerce and other custom
applications where on-site box making is needed
▪ Improves our margin profile and growth prospects; and
moves us closer to our 80% integration goal
▪ Acquired Plymouth’s equity interest in Panotec and
exclusive right to distribute Panotec’s equipment in the
United States and Canada
▪ Provides on-demand boxes with proper dimensions that lower
customer’s inventory and freight costs, and deliver productivity
savings
▪ Located on the customer’s site and use fanfold corrugated to
produce custom, on-demand corrugated packaging
▪ Installed on customers’ sites under multi-year exclusive
agreements for the fanfold corrugated supply
“Box on Demand” Value Proposition
Plymouth Packaging Footprint
Product and Machinery Examples
| 12
WestRock: Creating Shareholder Value
OUTSTANDING
EXECUTION &
DELIVERY
DISCIPLINED
CAPITAL
ALLOCATION
BROAD PORTFOLIO
OF DIFFERENTIATED
SOLUTIONS
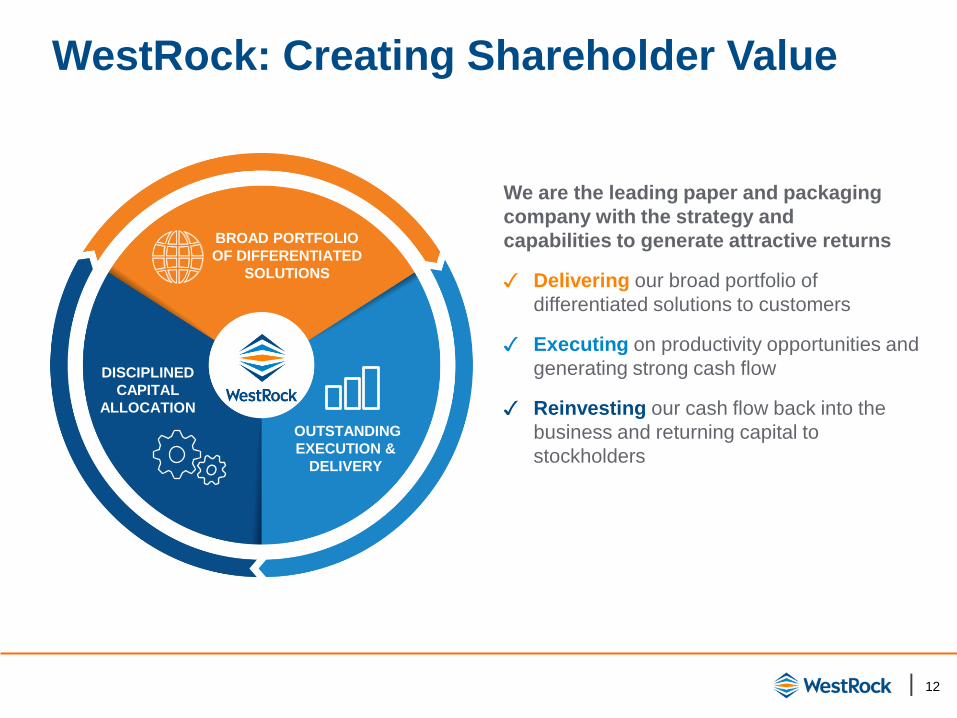
We are the leading paper and packaging
company with the strategy and
capabilities to generate attractive returns
✓ Delivering our broad portfolio of
differentiated solutions to customers
✓ Executing on productivity opportunities and
generating strong cash flow
✓ Reinvesting our cash flow back into the
business and returning capital to
stockholders
Appendix
| 14
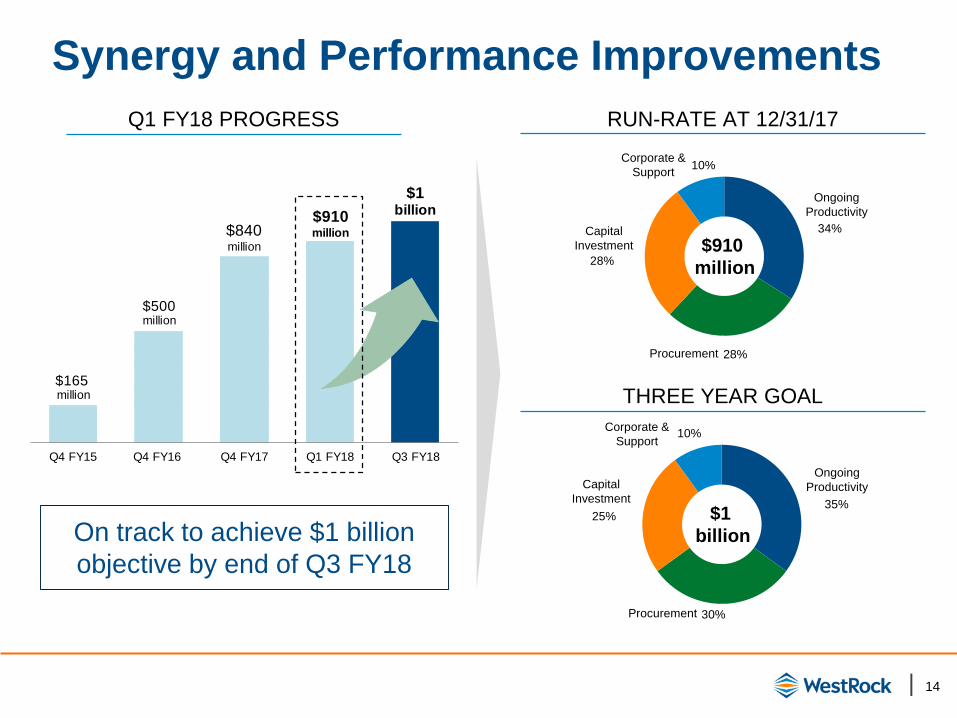
Synergy and Performance Improvements
$165million
$840 million
$910million
$1billion
$500million
Q4 FY15 Q4 FY16 Q4 FY17 Q1 FY18 Q3 FY18
On track to achieve $1 billion
objective by end of Q3 FY18
Q1 FY18 PROGRESS
(1)
(1)
34%
28%
28%
10%
Procurement
Capital
Investment
Ongoing
Productivity
Corporate &
Support
$1
billion
RUN-RATE AT 12/31/17
THREE YEAR GOAL
$910
million
10%
25%
30%
35%
Corporate &
Support
Capital
Investment
Ongoing
Productivity
Procurement
| 15
N.A. Corrugated End Market Mix / Examples
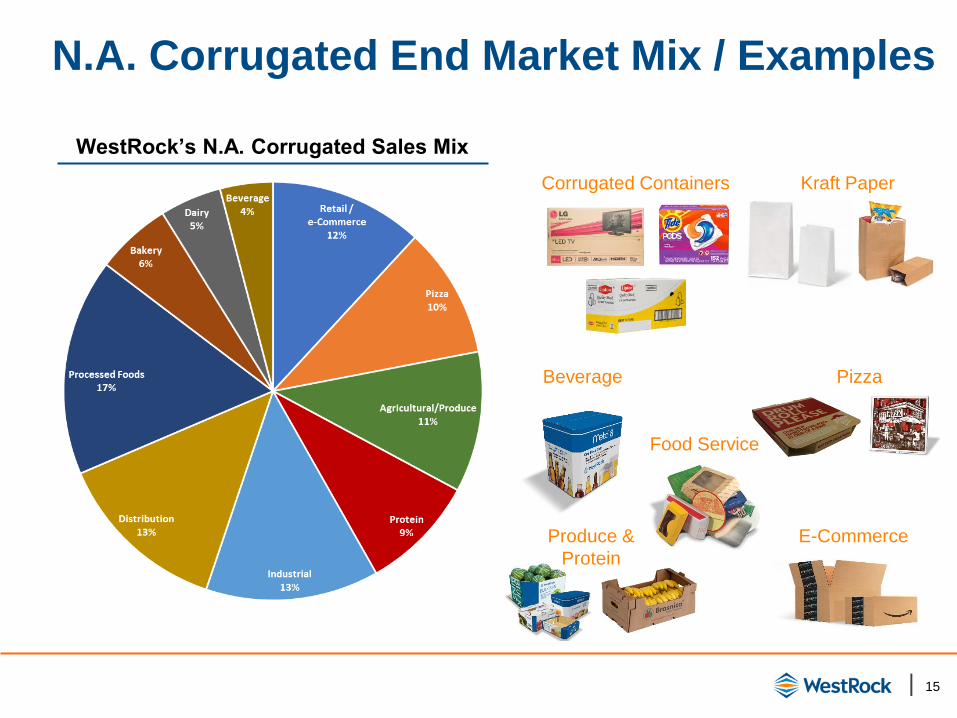
WestRock’s N.A. Corrugated Sales Mix
Corrugated Containers Kraft Paper
PizzaBeverage
Food Service
E-CommerceProduce &
Protein
| 16
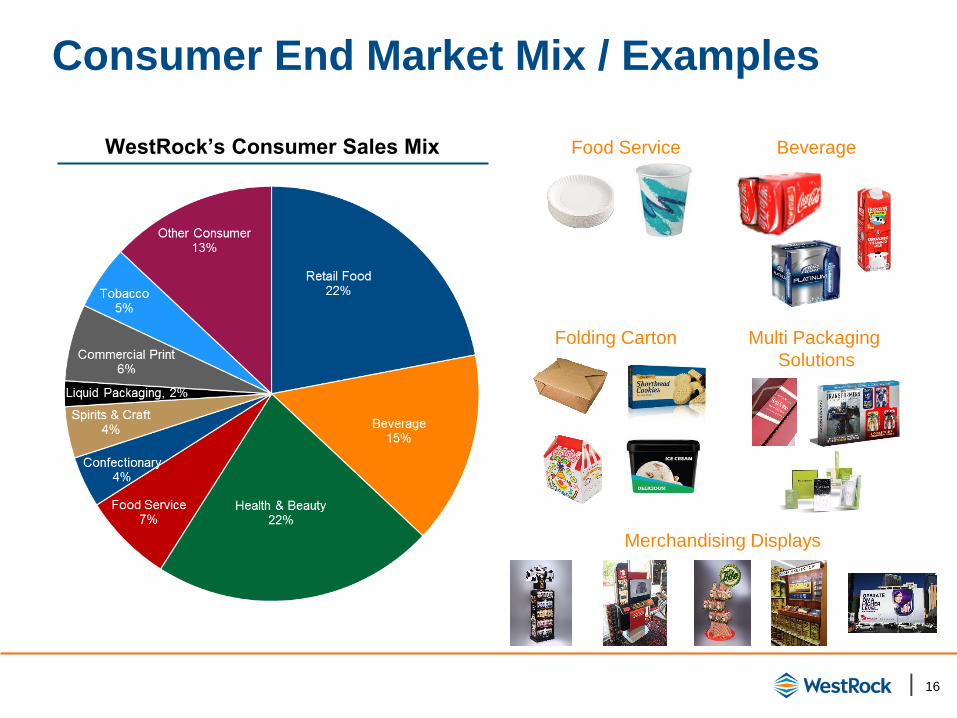
Consumer End Market Mix / Examples
WestRock’s Consumer Sales Mix Food Service Beverage
Folding Carton
Merchandising Displays
Multi Packaging
Solutions

| 17
Key Commodity Annual Consumption
Volumes and FX by Currency(1)
Commodity Category Volume
Recycled Fiber (tons millions) 4.9
Wood (tons millions) 32
Natural Gas (cubic feet billions) 67
Diesel (gallons millions) 88
Electricity (kwh billions) 4.7
Polyethylene (lbs millions) 44
Caustic Soda (tons thousands) 202
Starch (lbs millions) 526
Annual Consumption Volumes FX By Currency in Q1 FY18
Sensitivity Analysis
CategoryIncrease in Spot
Price
Annual EPS
Impact
Recycled Fiber (tons millions) +$10.00 / ton ($0.14)
Natural Gas (cubic feet billions) +$0.25 / MMBTU ($0.05)
FX Translation Impact+10% USD
Appreciation($0.07 - $0.08)
Revenue by
Transaction
Currency
80% USD
7% CAD
3% EUR
3% BRL
3% GBP
4% Other
1) All data is WestRock only and excludes KapStone
| 18
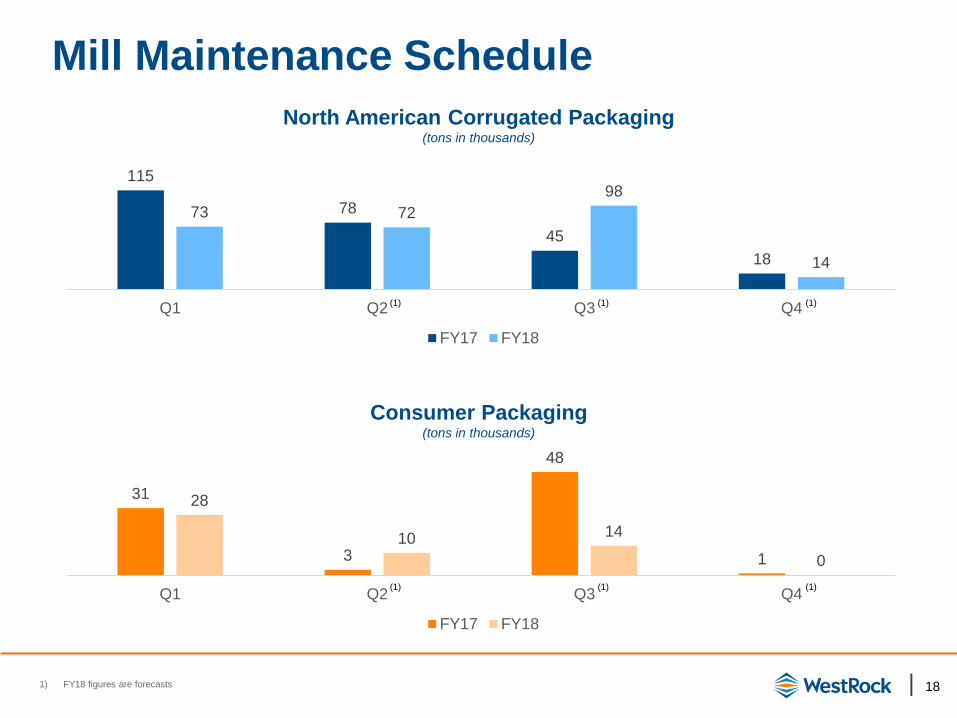
Mill Maintenance Schedule
115
78
45
18
73 72
98
14
Q1 Q2 Q3 Q4
FY17 FY18
North American Corrugated Packaging(tons in thousands)
Consumer Packaging(tons in thousands)
31
3
48
1
28
10 14
0
Q1 Q2 Q3 Q4
FY17 FY18
1) FY18 figures are forecasts
(1) (1) (1)
(1) (1) (1)
| 19
Non-GAAP Financial Measures
Adjusted Earnings Per Diluted Share
We use the non-GAAP financial measure “adjusted earnings per diluted share,” also referred to as “adjusted earnings per share” or “Adjusted
EPS” because we believe this measure provides our board of directors, investors, potential investors, securities analysts and others with useful
information to evaluate our performance since it excludes restructuring and other costs, net, and other specific items that we believe are not
indicative of our ongoing operating results. Our management and board of directors use this information to evaluate our performance relative to
other periods.
Adjusted Operating Cash Flow
We use the non-GAAP financial measure “adjusted operating cash flow” because we believe this measure provides our board of directors,
investors, potential investors, securities analysts and others with useful information to evaluate our performance since it excludes restructuring
and other costs, net, and other specific items that we believe are not indicative of our ongoing operating results. While this measure is similar to
adjusted free cash flow, we believe it provides greater comparability across periods when capital expenditures are changing since it excludes an
adjustment for capital expenditures. We believe the most directly comparable GAAP measure is net cash provided by operating activities.
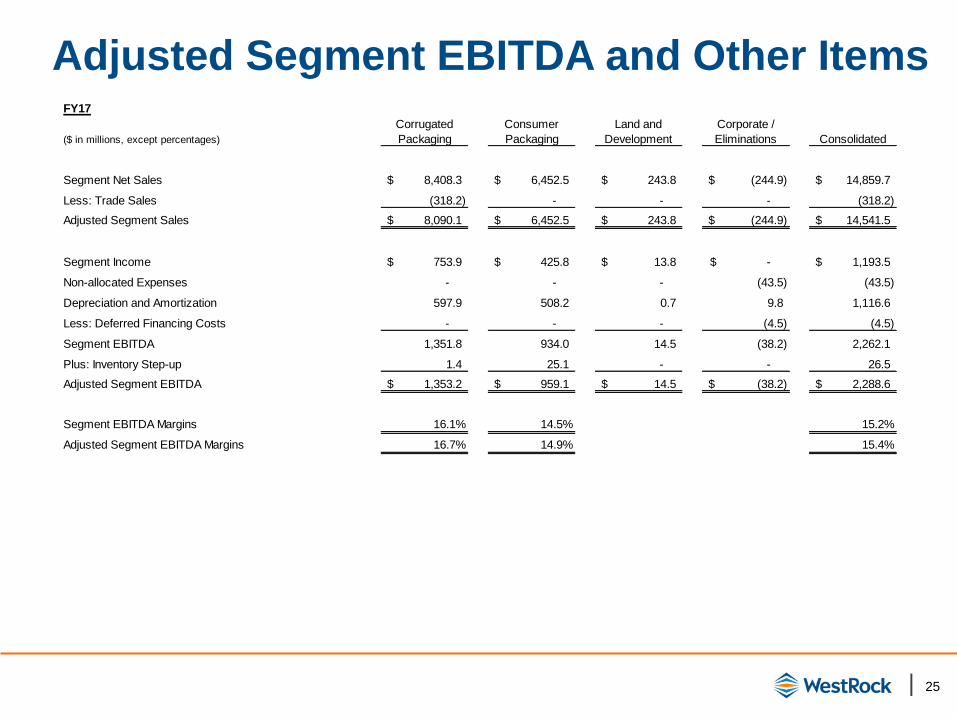
Adjusted Segment EBITDA and Adjusted Segment EBITDA Margins
We use the non-GAAP financial measures “adjusted segment EBITDA” and “adjusted segment EBITDA margins”, along with other factors, to
evaluate our segment performance against the performance of our peers. We believe that investors also use these measures to evaluate our
performance relative to our peers. We calculate adjusted segment EBITDA for each segment by adding that segment’s adjusted segment
income to its depreciation, depletion and amortization. We calculate adjusted segment EBITDA margin for each segment by dividing that
segment’s adjusted segment EBITDA by its adjusted segment sales.
| 20
Non-GAAP Financial Measures (cont.)
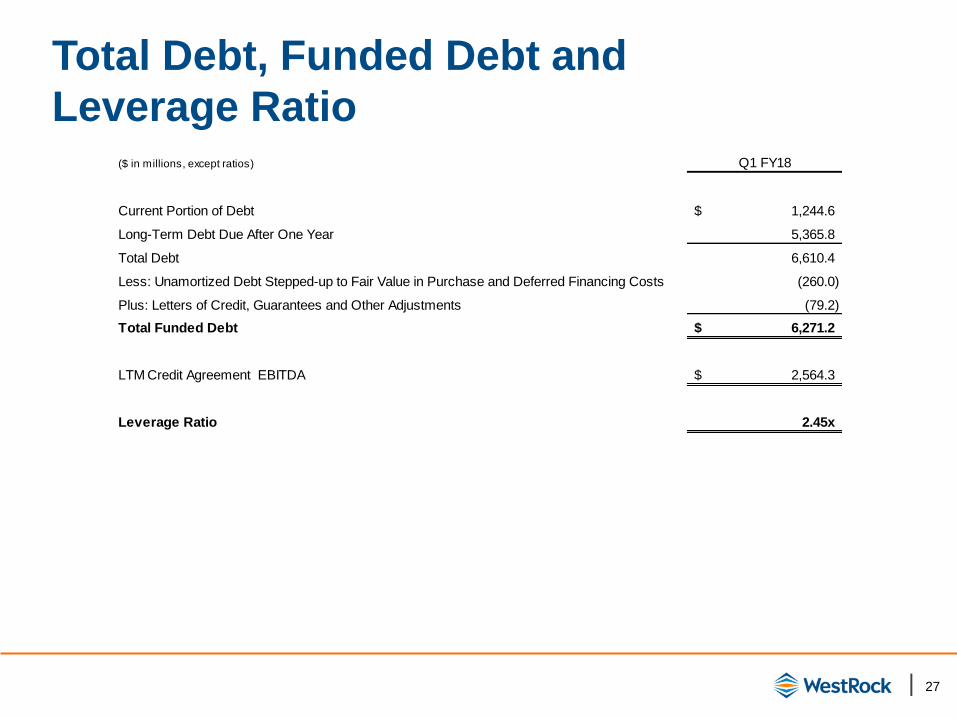
Leverage Ratio
We use the non-GAAP financial measure “leverage ratio” as a measurement of our operating performance and to compare to our publicly
disclosed target leverage ratio, and because we believe investors use this measure to evaluate our available borrowing capacity. We define
leverage ratio as our Total Funded Debt divided by our Credit Agreement EBITDA, each of which term is defined in our credit agreement, dated
July 1, 2015. Borrowing capacity under our credit agreement depends on, in addition to other measures, the Credit Agreement Debt/EBITDA
ratio or the leverage ratio. As of the December 31, 2017 calculation, our leverage ratio was 2.45 times. While the leverage ratio under our credit
agreement determines the credit spread on our debt, we are not subject to a leverage ratio cap. Our credit agreement is subject to a Debt to
Capitalization and Consolidated Interest Coverage Ratio, as defined therein.
Forward-looking Guidance
We are not providing forward-looking guidance for U.S. GAAP reported financial measures or a reconciliation of forward-looking non-GAAP
financial measures to the most directly comparable U.S. GAAP measure because we are unable to predict with reasonable certainty the ultimate
outcome of certain significant items without unreasonable effort. These items include, but are not limited to, merger and acquisition-related
expenses, restructuring expenses, asset impairments, litigation settlements, changes to contingent consideration and certain other gains or
losses. These items are uncertain, depend on various factors, and could have a material impact on U.S. GAAP reported results for the guidance
period.
| 21
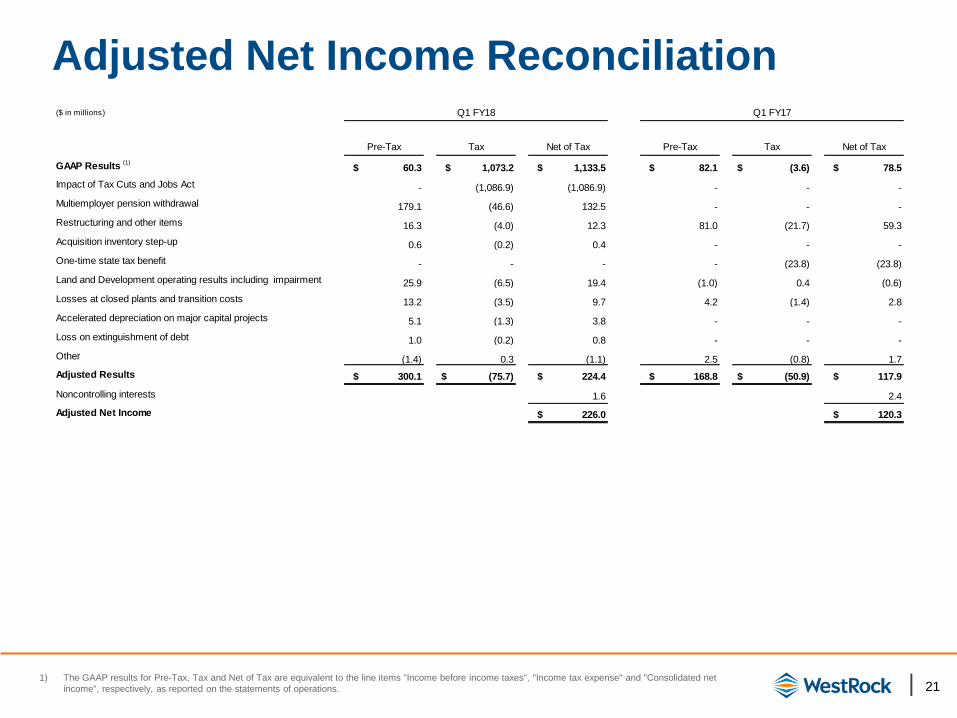
Adjusted Net Income Reconciliation($ in millions) Q1 FY18 Q1 FY17
Pre-Tax Tax Net of Tax Pre-Tax Tax Net of Tax
GAAP Results (1) $ 60.3 $ 1,073.2 $ 1,133.5 $ 82.1 $ (3.6) $ 78.5
Impact of Tax Cuts and Jobs Act - (1,086.9) (1,086.9) - - -
Multiemployer pension withdrawal 179.1 (46.6) 132.5 - - -
Restructuring and other items 16.3 (4.0) 12.3 81.0 (21.7) 59.3
Acquisition inventory step-up 0.6 (0.2) 0.4 - - -
One-time state tax benefit - - - - (23.8) (23.8)
Land and Development operating results including impairment 25.9 (6.5) 19.4 (1.0) 0.4 (0.6)
Losses at closed plants and transition costs 13.2 (3.5) 9.7 4.2 (1.4) 2.8
Accelerated depreciation on major capital projects 5.1 (1.3) 3.8 - - -
Loss on extinguishment of debt 1.0 (0.2) 0.8 - - -
Other (1.4) 0.3 (1.1) 2.5 (0.8) 1.7
Adjusted Results $ 300.1 $ (75.7) $ 224.4 $ 168.8 $ (50.9) $ 117.9
Noncontrolling interests 1.6 2.4
Adjusted Net Income $ 226.0 $ 120.3
1) The GAAP results for Pre-Tax, Tax and Net of Tax are equivalent to the line items "Income before income taxes", "Income tax expense" and "Consolidated net
income", respectively, as reported on the statements of operations.
| 22
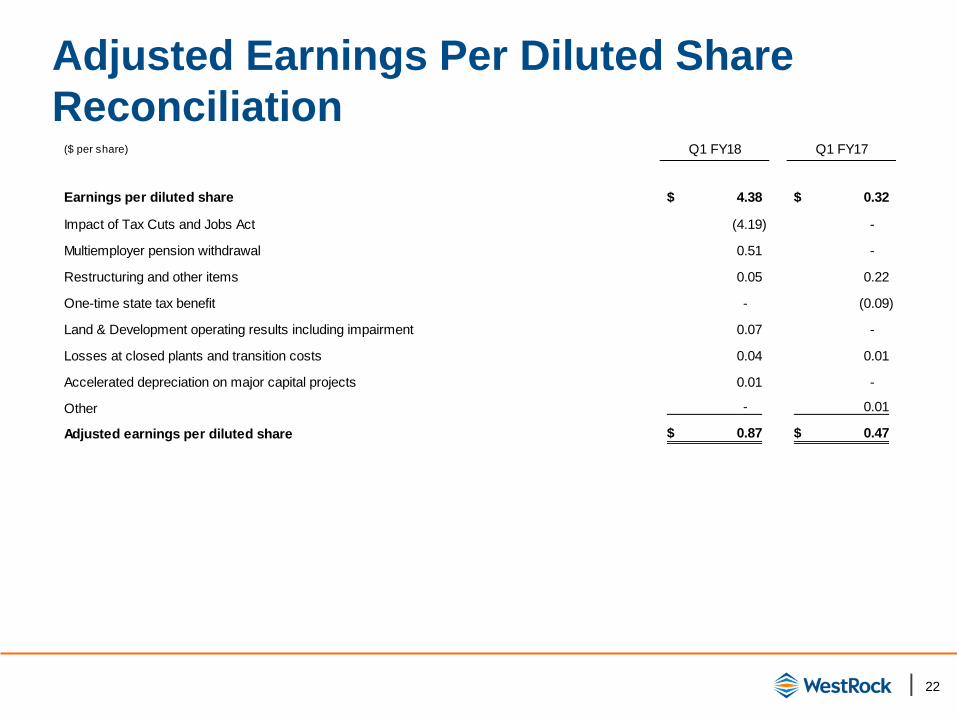
Adjusted Earnings Per Diluted Share
Reconciliation($ per share) Q1 FY18 Q1 FY17
Earnings per diluted share 4.38$ 0.32$
Impact of Tax Cuts and Jobs Act (4.19) -
Multiemployer pension withdrawal 0.51 -
Restructuring and other items 0.05 0.22
One-time state tax benefit - (0.09)
Land & Development operating results including impairment 0.07 -
Losses at closed plants and transition costs 0.04 0.01
Accelerated depreciation on major capital projects 0.01 -
Other - 0.01
Adjusted earnings per diluted share 0.87$ 0.47$
| 23
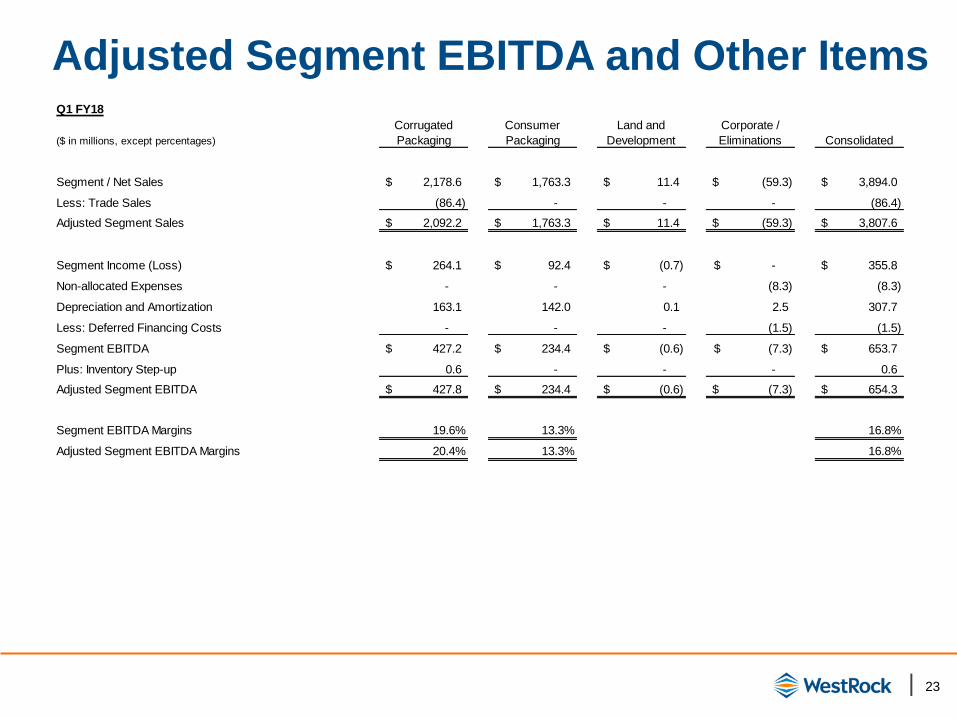
Adjusted Segment EBITDA and Other ItemsQ1 FY18
($ in millions, except percentages)
Corrugated
Packaging
Consumer
Packaging
Land and
Development
Corporate /
Eliminations Consolidated
Segment / Net Sales 2,178.6$ 1,763.3$ 11.4$ (59.3)$ 3,894.0$
Less: Trade Sales (86.4) - - - (86.4)
Adjusted Segment Sales 2,092.2$ 1,763.3$ 11.4$ (59.3)$ 3,807.6$
Segment Income (Loss) 264.1$ 92.4$ (0.7)$ -$ 355.8$
Non-allocated Expenses - - - (8.3) (8.3)
Depreciation and Amortization 163.1 142.0 0.1 2.5 307.7
Less: Deferred Financing Costs - - - (1.5) (1.5)
Segment EBITDA 427.2$ 234.4$ (0.6)$ (7.3)$ 653.7$
Plus: Inventory Step-up 0.6 - - - 0.6
Adjusted Segment EBITDA 427.8$ 234.4$ (0.6)$ (7.3)$ 654.3$
Segment EBITDA Margins 19.6% 13.3% 16.8%
Adjusted Segment EBITDA Margins 20.4% 13.3% 16.8%
| 24
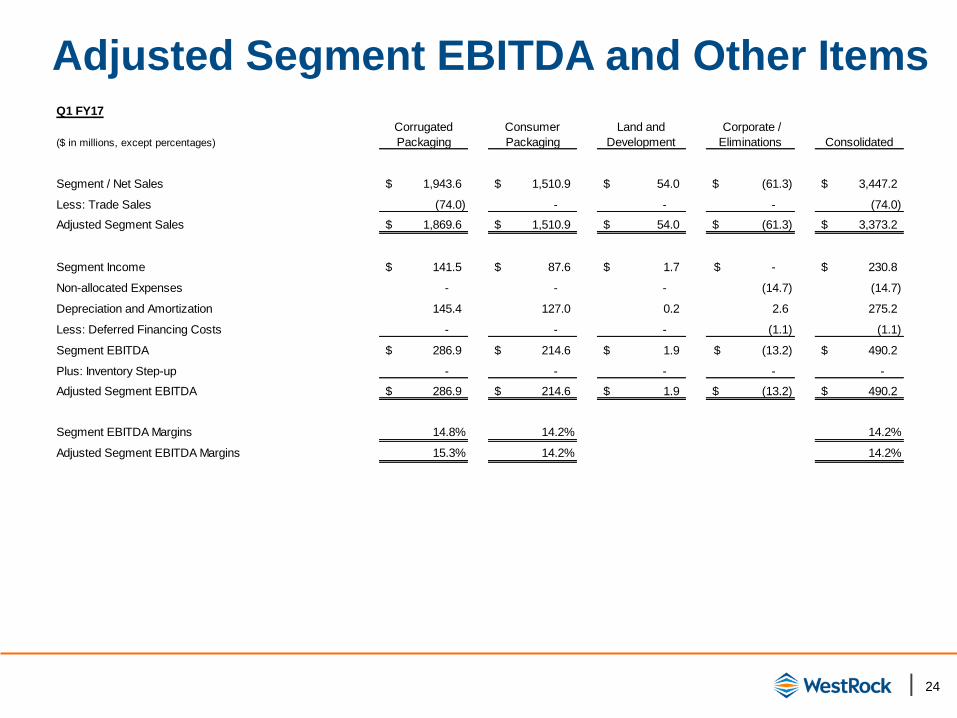
Adjusted Segment EBITDA and Other ItemsQ1 FY17
($ in millions, except percentages)
Corrugated
Packaging
Consumer
Packaging
Land and
Development
Corporate /
Eliminations Consolidated
Segment / Net Sales 1,943.6$ 1,510.9$ 54.0$ (61.3)$ 3,447.2$
Less: Trade Sales (74.0) - - - (74.0)
Adjusted Segment Sales 1,869.6$ 1,510.9$ 54.0$ (61.3)$ 3,373.2$
Segment Income 141.5$ 87.6$ 1.7$ -$ 230.8$
Non-allocated Expenses - - - (14.7) (14.7)
Depreciation and Amortization 145.4 127.0 0.2 2.6 275.2
Less: Deferred Financing Costs - - - (1.1) (1.1)
Segment EBITDA 286.9$ 214.6$ 1.9$ (13.2)$ 490.2$
Plus: Inventory Step-up - - - - -
Adjusted Segment EBITDA 286.9$ 214.6$ 1.9$ (13.2)$ 490.2$
Segment EBITDA Margins 14.8% 14.2% 14.2%
Adjusted Segment EBITDA Margins 15.3% 14.2% 14.2%
| 25
Adjusted Segment EBITDA and Other ItemsFY17
($ in millions, except percentages)
Corrugated
Packaging
Consumer
Packaging
Land and
Development
Corporate /
Eliminations Consolidated
Segment Net Sales 8,408.3$ 6,452.5$ 243.8$ (244.9)$ 14,859.7$
Less: Trade Sales (318.2) - - - (318.2)
Adjusted Segment Sales 8,090.1$ 6,452.5$ 243.8$ (244.9)$ 14,541.5$
Segment Income 753.9$ 425.8$ 13.8$ -$ 1,193.5$
Non-allocated Expenses - - - (43.5) (43.5)
Depreciation and Amortization 597.9 508.2 0.7 9.8 1,116.6
Less: Deferred Financing Costs - - - (4.5) (4.5)
Segment EBITDA 1,351.8 934.0 14.5 (38.2) 2,262.1
Plus: Inventory Step-up 1.4 25.1 - - 26.5
Adjusted Segment EBITDA 1,353.2$ 959.1$ 14.5$ (38.2)$ 2,288.6$
Segment EBITDA Margins 16.1% 14.5% 15.2%
Adjusted Segment EBITDA Margins 16.7% 14.9% 15.4%
| 26
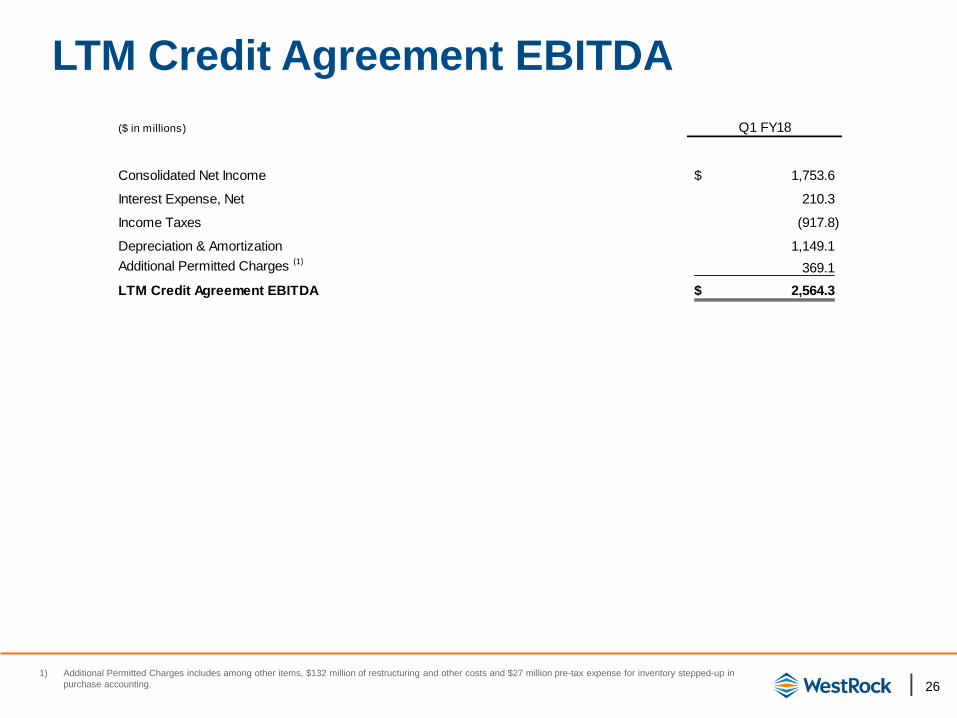
LTM Credit Agreement EBITDA
($ in millions) Q1 FY18
Consolidated Net Income 1,753.6$
Interest Expense, Net 210.3
Income Taxes (917.8)
Depreciation & Amortization 1,149.1
Additional Permitted Charges (1) 369.1
LTM Credit Agreement EBITDA 2,564.3$
1) Additional Permitted Charges includes among other items, $132 million of restructuring and other costs and $27 million pre-tax expense for inventory stepped-up in
purchase accounting.
| 27
Total Debt, Funded Debt and
Leverage Ratio($ in millions, except ratios) Q1 FY18
Current Portion of Debt 1,244.6$
Long-Term Debt Due After One Year 5,365.8
Total Debt 6,610.4
Less: Unamortized Debt Stepped-up to Fair Value in Purchase and Deferred Financing Costs (260.0)
Plus: Letters of Credit, Guarantees and Other Adjustments (79.2)
Total Funded Debt 6,271.2$
LTM Credit Agreement EBITDA 2,564.3$
Leverage Ratio 2.45x