Embed Size (px)
Citation preview
2/23/2018
1
© STRATEGIC ASSET ALLIANCE, INC. Document not to be reproduced without the explicit consent of SAA.
Presented by:
March 4th, 2018
Dan Smereck, Managing Director & Principal
Pool Investment Strategies for Today and Tomorrow
Investment income: Is a cornerstone to the risk transfer business model, and maximizing investment income can mean the difference between remaining competitive or losing members to aggressive pricing.
1) How much can you expect to earn?
2) How much risk are you willing to prudently take?
2
Session Introduction
Session Introduction - Investment Performance Objectives
Where do you fall on this objective continuum and why?
Book yield ‘or’
Income Only
Total return
Constrained total return
3
Most Risk Pools & Insurers
2/23/2018
2
SETTING THE STAGE
4
5
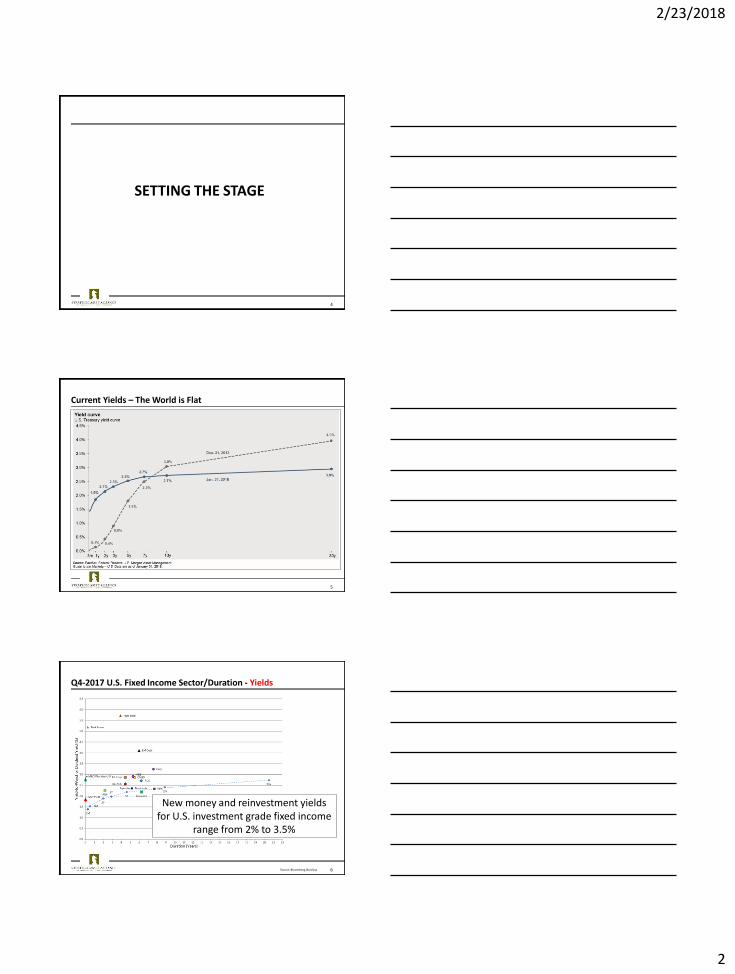
Current Yields – The World is Flat
6
Q4-2017 U.S. Fixed Income Sector/Duration - Yields
Source: Bloomberg, Barclays
New money and reinvestment yields for U.S. investment grade fixed income
range from 2% to 3.5%
2/23/2018
3
7
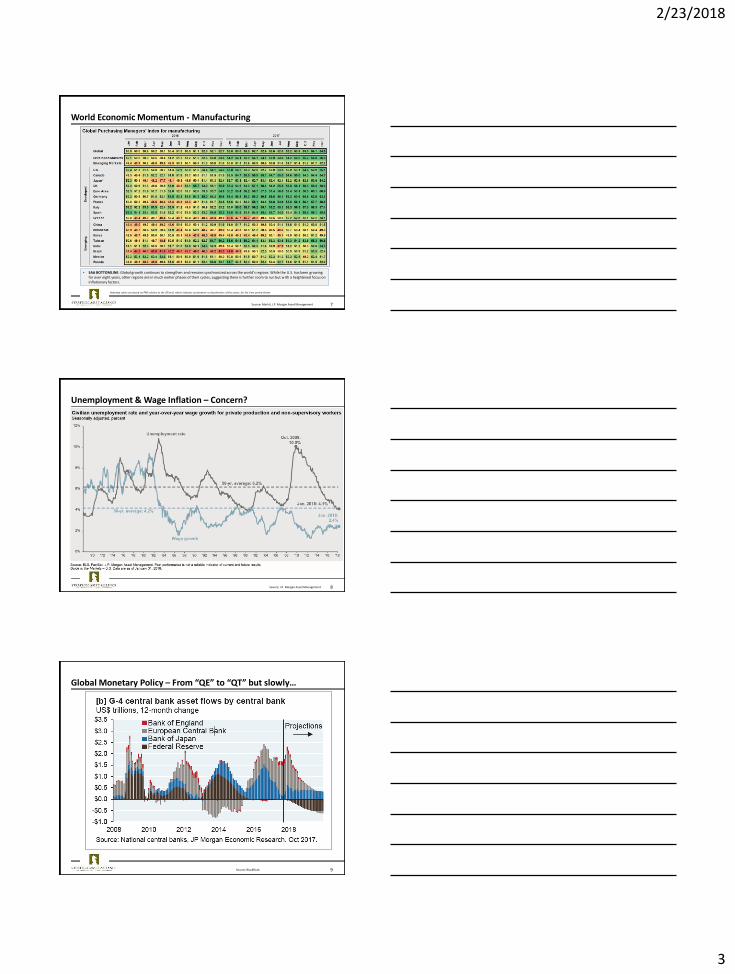
World Economic Momentum - Manufacturing
Source: Markit, J.P. Morgan Asset Management
• SAA BOTTOMLINE: Global growth continues to strengthen and remains synchronized across the world’s regions. While the U.S. has been growing for over eight years, other regions are in much earlier phases of their cycles, suggesting there is further room to run but with a heightened focus on inflationary factors.
Heatmap colors are based on PMI relative to the 50 level, which indicates acceleration or deceleration of the sector, for the time period shown
8
Unemployment & Wage Inflation – Concern?
Source: J.P. Morgan Asset Management
9
Global Monetary Policy – From “QE” to “QT” but slowly…
Source: BlackRock
2/23/2018
4
10
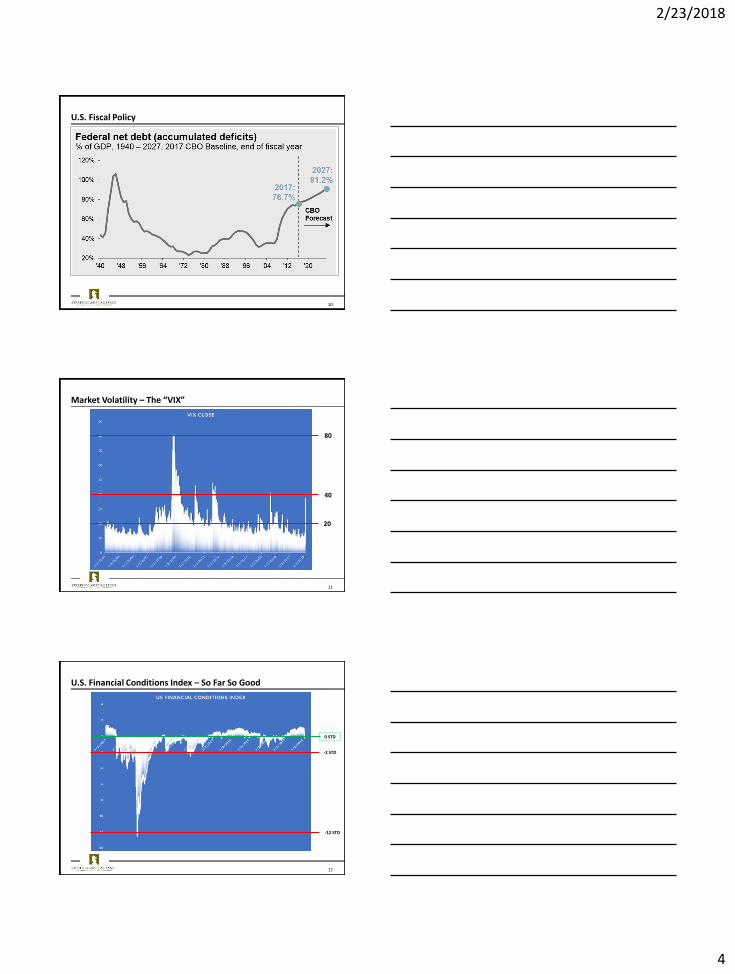
U.S. Fiscal Policy
11
Market Volatility – The “VIX”
80
40
20
12
U.S. Financial Conditions Index – So Far So Good
-12 STD
-2 STD
0 STD
2/23/2018
5
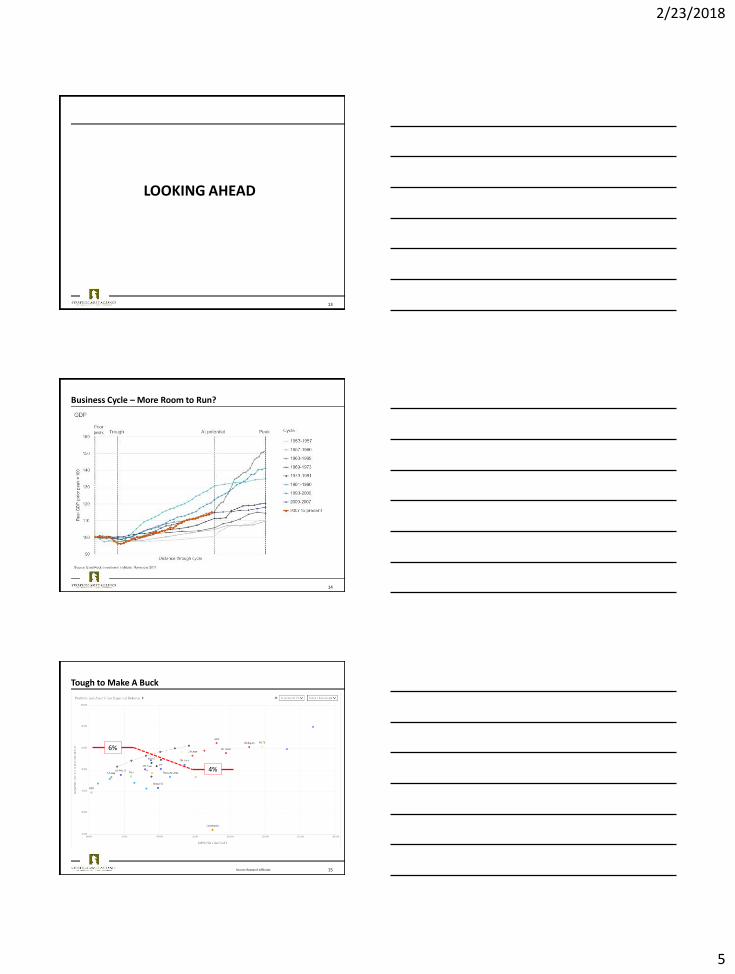
LOOKING AHEAD
13
14
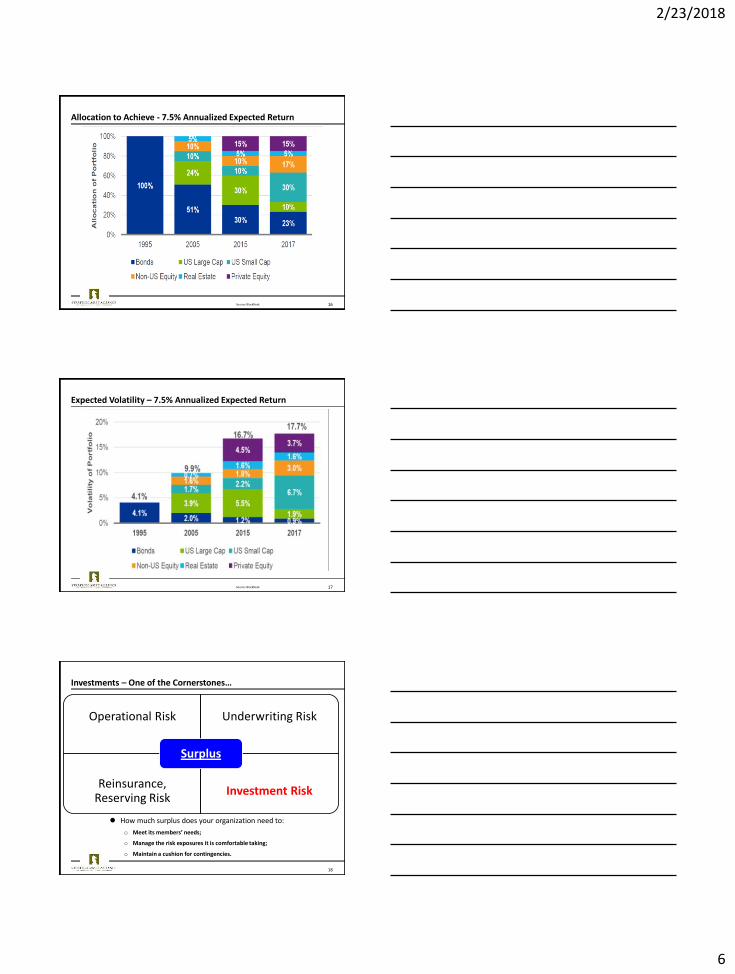
Business Cycle – More Room to Run?
15
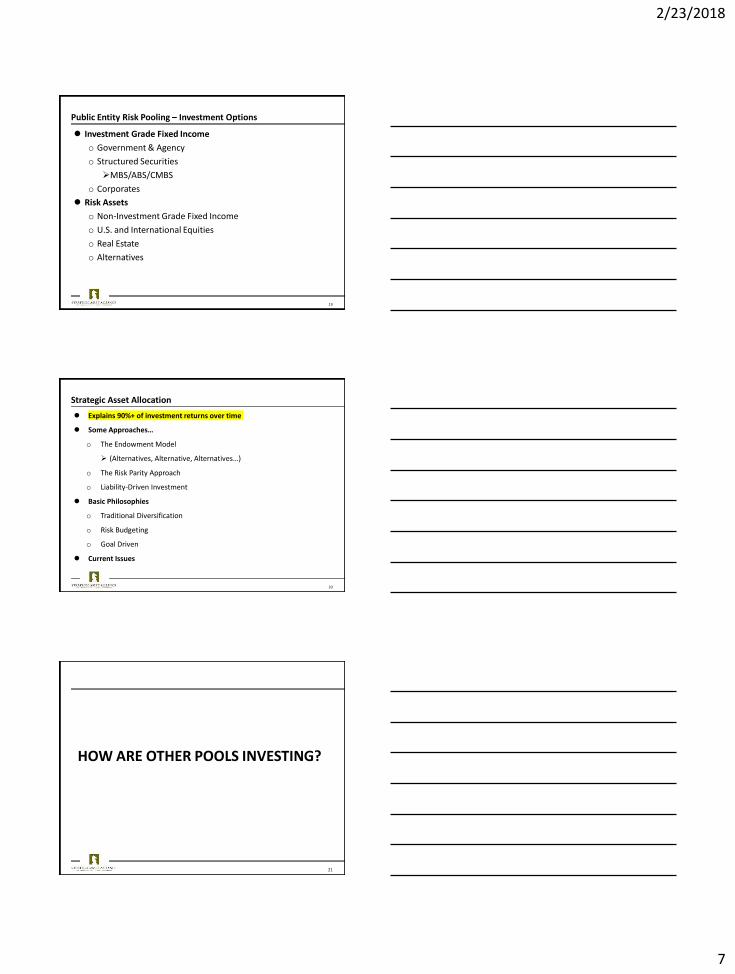
Tough to Make A Buck
6%
4%
Source: Research Affiliates
2/23/2018
6
16
Allocation to Achieve - 7.5% Annualized Expected Return
Source: BlackRock
17
Expected Volatility – 7.5% Annualized Expected Return
Source: BlackRock
How much surplus does your organization need to:
o Meet its members’ needs;
o Manage the risk exposures it is comfortable taking;
o Maintain a cushion for contingencies.
18
Investments – One of the Cornerstones…
Operational Risk Underwriting Risk
Reinsurance, Reserving Risk
Investment Risk
Surplus
2/23/2018
7
Investment Grade Fixed Income
o Government & Agency
o Structured Securities
MBS/ABS/CMBS
o Corporates
Risk Assets
o Non-Investment Grade Fixed Income
o U.S. and International Equities
o Real Estate
o Alternatives
19
Public Entity Risk Pooling – Investment Options
20
Strategic Asset Allocation
Explains 90%+ of investment returns over time
Some Approaches…
o The Endowment Model
(Alternatives, Alternative, Alternatives…)
o The Risk Parity Approach
o Liability-Driven Investment
Basic Philosophies
o Traditional Diversification
o Risk Budgeting
o Goal Driven
Current Issues
HOW ARE OTHER POOLS INVESTING?
21
2/23/2018
8
SAA Governmental Pooling Clients
Data as of 9/30/2017
18 Clients
25 Portfolios (19 Primary / 6 Reinsurance)
$3.00B In Assets
$2.54B Core Fixed Income (84.6%)
$0.46B Risk Assets (15.4%)
22
Peer Analysis Overview
CORE FIXED INCOME ALLOCATION
23
24
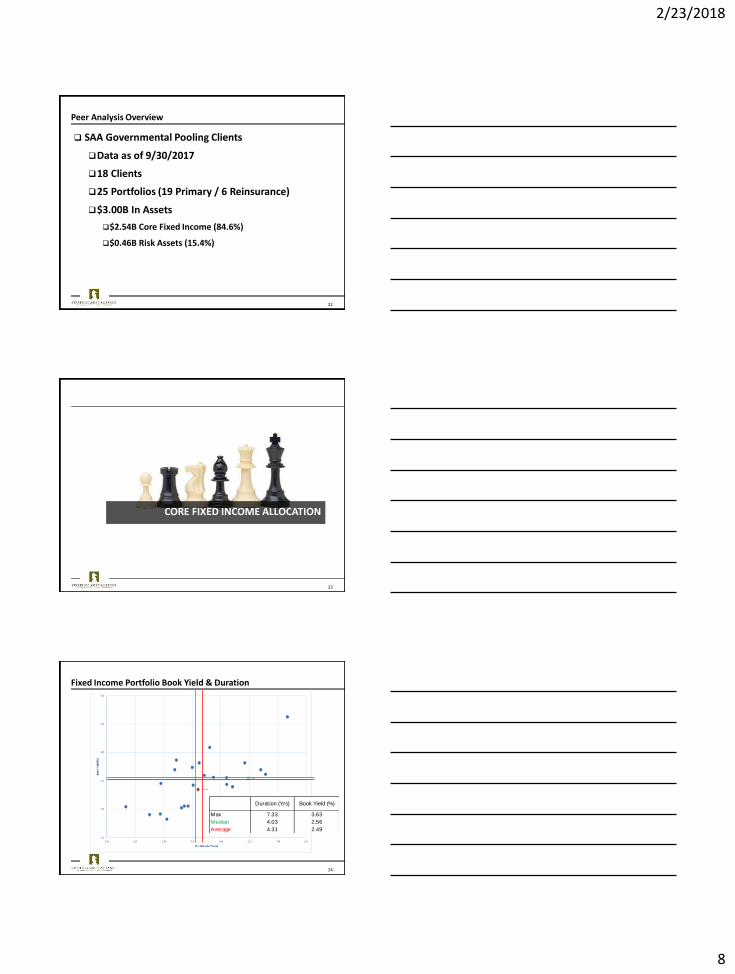
Fixed Income Portfolio Book Yield & Duration
Duration (Yrs) Book Yield (%)
Max 7.33 3.63
Median 4.03 2.56
Average 4.31 2.49
2/23/2018
9
25
Fixed Income Allocation By Sector
Sorted by largest exposures to corporate and structured securities.
ST/ MMF (%) UST & US Agency (%) Agency MBS (%) ABS/ CMBS (%)Corporate & Taxable
Muni (%)
Max 26.0% 68.2% 52.0% 30.9% 61.2%
Median 1.5% 15.0% 19.0% 12.9% 45.5%
Average 4.1% 21.5% 20.3% 14.2% 39.8%
RISK ASSET ALLOCATION
26
27
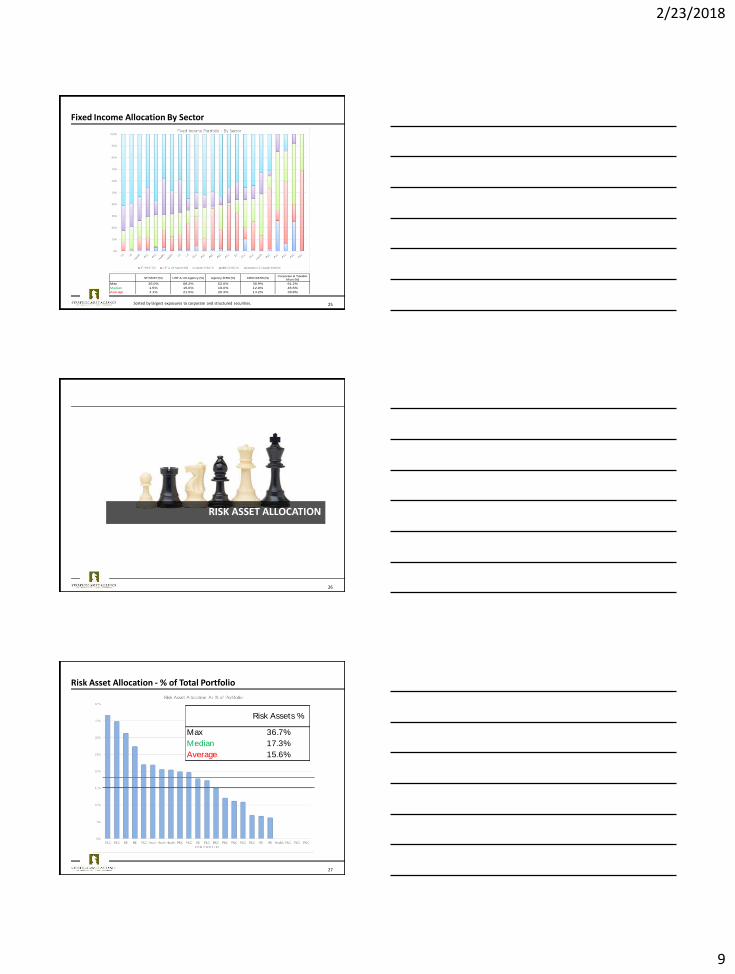
Risk Asset Allocation - % of Total Portfolio
Risk Assets %
Max 36.7%
Median 17.3%
Average 15.6%
2/23/2018
10
28
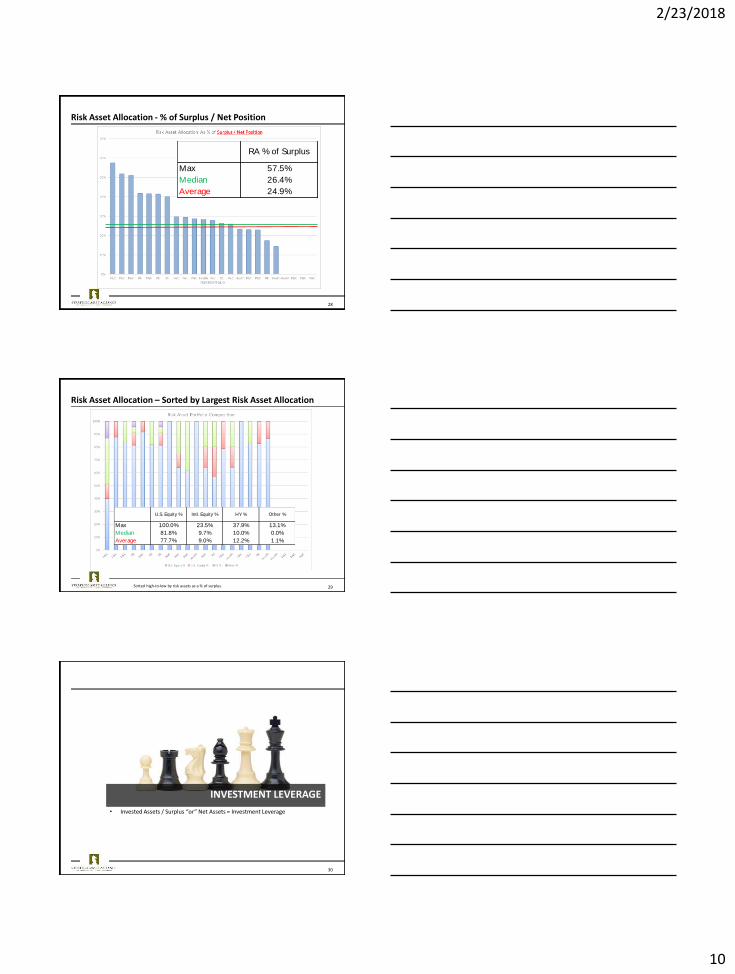
Risk Asset Allocation - % of Surplus / Net Position
RA % of Surplus
Max 57.5%
Median 26.4%
Average 24.9%
29
Risk Asset Allocation – Sorted by Largest Risk Asset Allocation
U.S. Equity % Intl. Equity % HY % Other %
Max 100.0% 23.5% 37.9% 13.1%
Median 81.8% 9.7% 10.0% 0.0%
Average 77.7% 9.0% 12.2% 1.1%
Sorted high-to-low by risk assets as a % of surplus.
INVESTMENT LEVERAGE
30
• Invested Assets / Surplus “or” Net Assets = Investment Leverage
2/23/2018
11
31
Investment Leverage
Inv Assets/ Surplus
Max 393.8%
Median 140.6%
Average 173.7%
32
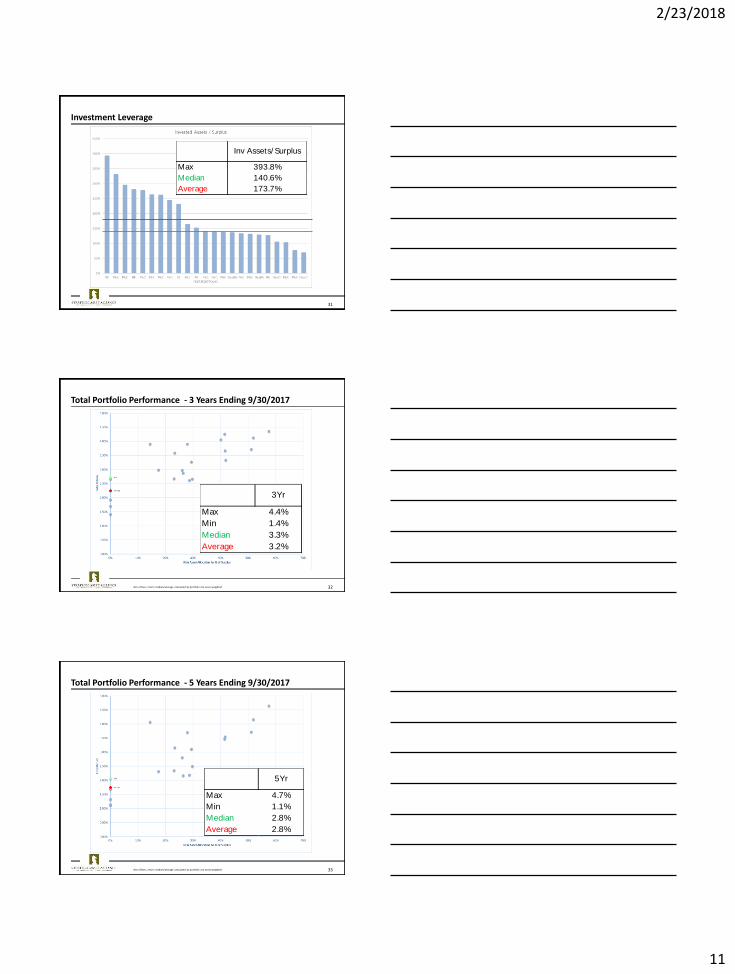
Total Portfolio Performance - 3 Years Ending 9/30/2017
3Yr
Max 4.4%
Min 1.4%
Median 3.3%
Average 3.2%
Net of fees; return median/average calculated by portfolio not asset-weighted
33
Total Portfolio Performance - 5 Years Ending 9/30/2017
5Yr
Max 4.7%
Min 1.1%
Median 2.8%
Average 2.8%
Net of fees; return median/average calculated by portfolio not asset-weighted
2/23/2018
12
34
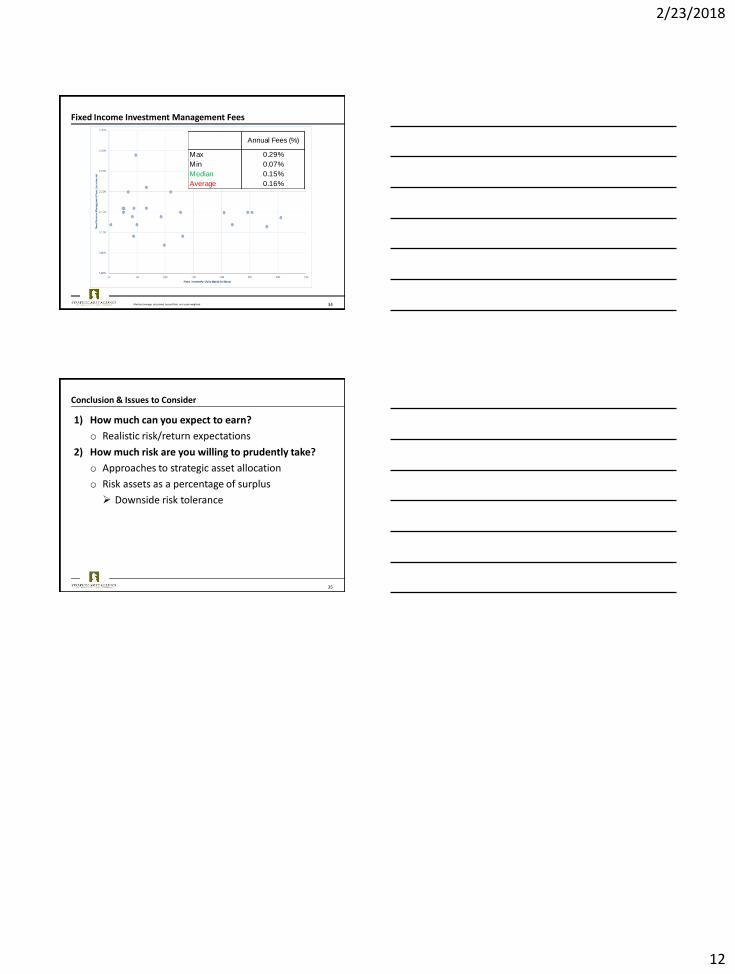
Fixed Income Investment Management Fees
Annual Fees (%)
Max 0.29%
Min 0.07%
Median 0.15%
Average 0.16%
Median/average calculated by portfolio not asset-weighted
1) How much can you expect to earn?
o Realistic risk/return expectations
2) How much risk are you willing to prudently take?
o Approaches to strategic asset allocation
o Risk assets as a percentage of surplus
Downside risk tolerance
35
Conclusion & Issues to Consider

![arXiv:1909.01203v1 [cs.CV] 3 Sep 2019 · 2019-09-04 · arXiv:1909.01203v1 [cs.CV] 3 Sep 2019. fusion layer camera 1 camera 2 gt heatmap detected heatmap detected heatmap fused fused](https://img.pdfslide.us/doc/110x75/5f1d4476c377703551130c2e/arxiv190901203v1-cscv-3-sep-2019-2019-09-04-arxiv190901203v1-cscv-3.jpg)