Embed Size (px)
Citation preview

Pharmaceutical Sector Country Profiles
Experiences and Plans
Dr Gilles ForteDr Gilles Forte
Dr Richard LaingDr Richard LaingEssential Medicines and Health
Products Department
WHO HQ

WHO/GF Pharmaceutical Sector Country Profiles | May 5, 20232 |
Issues to address
A vast amount of information exists on the pharmaceutical sector of countries;
BUT this information is often not available to the public or even to decision makers in the countries involved;
Duplication of efforts with multiple data collection initiatives in the same country; not always endorsed;
This information is not always reliable.

WHO/GF Pharmaceutical Sector Country Profiles | May 5, 20233 |
WHO Pharmaceutical Sector Monitoring Tools
Level III Indicators for specific components of the pharmaceutical sector: Pricing Rational useHuman Resources Assessing regulatory capacityProcurement and Supply
Level II Core outcome/impact indicators
& household survey
CPHigh-level
informationMostly structures
and policies
High-level policy information (Country Profiles), through a global survey•Questionnaire to Ministry of Health•Indicators on structures, policies and outcomes;•Carried out every four years
Health facility and household surveys (Level II)•Surveys based on interviews•Indicators on policy outcome•Upon country request
Topic-specific studies (Level III)•More detailed indicators for monitoring and evaluating specific areas/components•Upon country request
WHO/GF Pharmaceutical Sector Country Profiles | May 5, 20234 |
Content of the Country Profile questionnaireContent of the Country Profile questionnaire
The questionnaire is divided into 9 chapters:– Health and Demographic data.– Health Services.– Policy Issues.– Medicines Trade and Production.– Medicines Regulation.– Medicines Financing.– Pharmaceutical Procurement and Distribution.– Selection and Rational Use.– Household data/access.
WHO/GF Pharmaceutical Sector Country Profiles | May 5, 20235 |
Rationale for Country Profiles
Assist countries produce reliable indicators and information on structures, processes and outcomes; using existing data e.g. pricing & availability;
Support countries to establish a unique and reliable source of information for identifying gaps, carrying out policy dialogue and policy formulation;
Information available for coordination of international partners in countries;
Global survey in 193 Member States every four years; comparisons among large number of countries (156 in 2007; 130 in 2011), regions and income groups;
Systematic data collection allows comparison over time (2003,2007,2011);

WHO/GF Pharmaceutical Sector Country Profiles | May 5, 20236 |
2011 Survey: ensure quality of information2011 Survey: ensure quality of information Year and source of each piece of information is recordedYear and source of each piece of information is recorded and key documents are provided and stored
in the WHO Medicines Library. Fields for comments are provided to allow respondents to provide more nuanced information;
A manualmanual with instructions to fill in the questionnaire has been developed to guide data collection; English, French and Spanish;
A glossaryglossary with definitions of key items has been produced to make sure questions are interpreted consistently across countries and regions;
Names and contacts of respondents are collected and interactions with WHO are taking place for data quality checking;
Data is endorsedData is endorsed by a senior Official at the Ministry of Health as official country information and authorisation for disclosure granted;
Quality checking of information is supported by WHO at HQ and Regional Offices. This is done through:– Checking with previous information available for the country;– Checking for consistency within the questionnaire;– Cross checking with other sources and profiles (for example, National Health Accounts);

WHO/GF Pharmaceutical Sector Country Profiles | May 5, 20237 |
2011 Survey: r2011 Survey: reduce burden of data collection in countries
Core and supplementary indicators defined; Mostly Yes/No questions; limited financial and human resources needed;
Questionnaires have been prefilled for 193 Member States with all information available at WHO HQ. About 50% of each questionnaire has been prefilled. Countries are asked to verify the information provided and fill in gaps; WHO support provided for quality checking;
The Country Profile is meant to be an official and unique source on pharmaceutical sector information in the country for national and international experts; It is expected that the availability of reliable information will reduce data collection initiatives in countries;
The questionnaire has been endorsed by The Global Fund to replace GF Health Products Management (PHPM) Profile. In 2011, It has been an important source of information and step for GF grant signing; Joint data collection between WHO and GF has been carried out in countries;
Discussions are ongoing to align the questionnaire with other International agencies e.g. Unicef, World Bank;
WHO/GF Pharmaceutical Sector Country Profiles | May 5, 20238 |
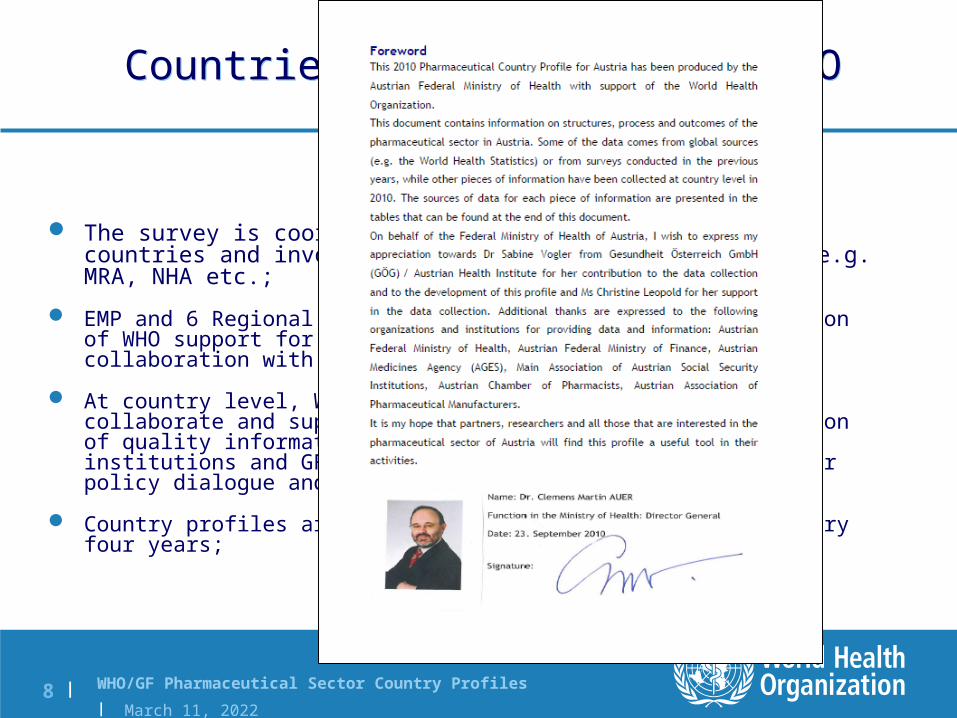
Countries involvement and WHO support
The survey is coordinated by the Ministry of Health in countries and involves relevant national institutions e.g. MRA, NHA etc.;
EMP and 6 Regional Advisers are involved in the coordination of WHO support for country profiles completion and for collaboration with GF;;
At country level, WHO Medicines and Health systems experts collaborate and support the Ministry of Heath for collection of quality information, coordination with national institutions and GF representatives and for use of data for policy dialogue and formulation;
Country profiles are meant to be updated and published every four years;

WHO/GF Pharmaceutical Sector Country Profiles | May 5, 20239 |
Regional Office AFRO Regional Office EMRO
Regional Office EURO Regional Office WPRO
Regional Office SEARO Regional Office AMRO
WHO: 193 Member States WHO: 193 Member States 6 Regional Offices6 Regional Offices
(Source: http://www.who.int/about/regions/en/index.html)
WHO HQ Geneva
=Medicines Adviser
=Collaborating Centre
WHO/GF Pharmaceutical Sector Country Profiles | May 5, 202310 |
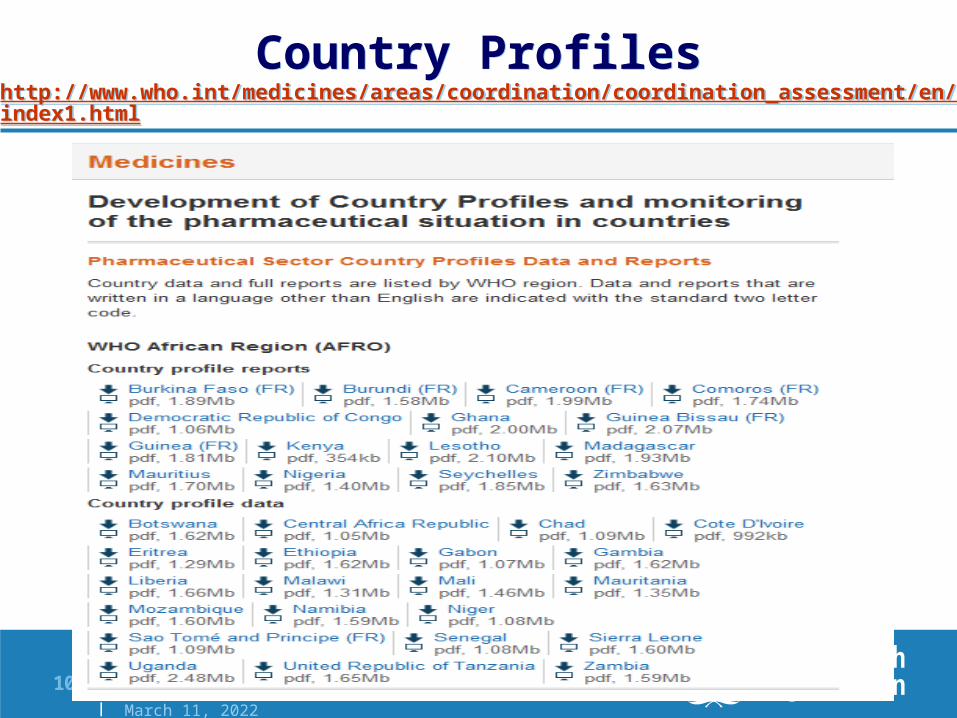
Country Profileshttp://www.who.int/medicines/areas/coordination/coordination_assessment/en/index1.html
WHO/GF Pharmaceutical Sector Country Profiles | May 5, 202311 |
Regional, Global and Technical reports
Africa, Europe, Western Pacific, Americas, Caribbean and Eastern Mediterranean Regions
Technical include Financing and Pricing, Selection Rational Use & ? Regulation
Global report

WHO/GF Pharmaceutical Sector Country Profiles | May 5, 202312 |
RESULTSRESULTS
WHO/GF Pharmaceutical Sector Country Profiles | May 5, 202313 |
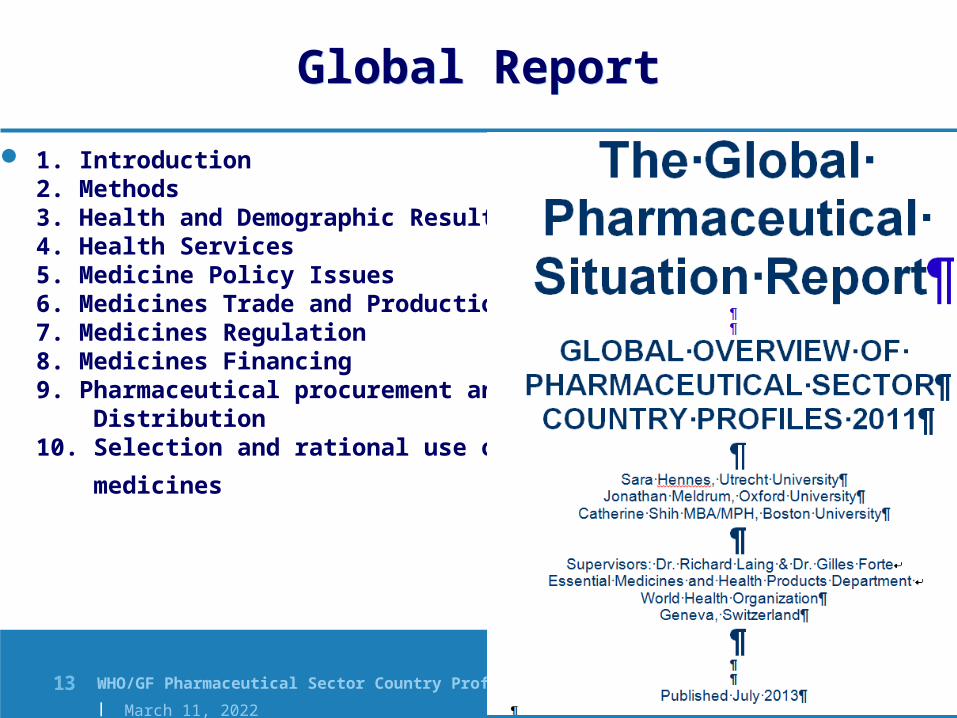
Global Report 1. Introduction
2. Methods3. Health and Demographic Results4. Health Services5. Medicine Policy Issues6. Medicines Trade and Production7. Medicines Regulation8. Medicines Financing9. Pharmaceutical procurement and Distribution10. Selection and rational use of medicines

WHO/GF Pharmaceutical Sector Country Profiles | May 5, 202314 |
Health expenditure as % of govt budget
WHO/GF Pharmaceutical Sector Country Profiles | May 5, 202315 |
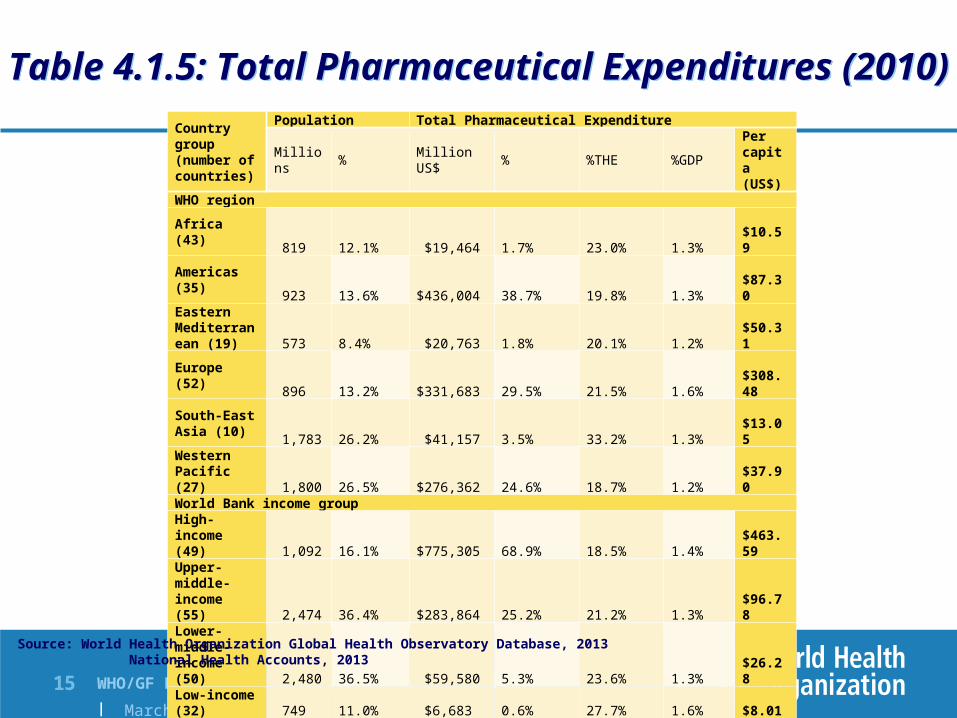
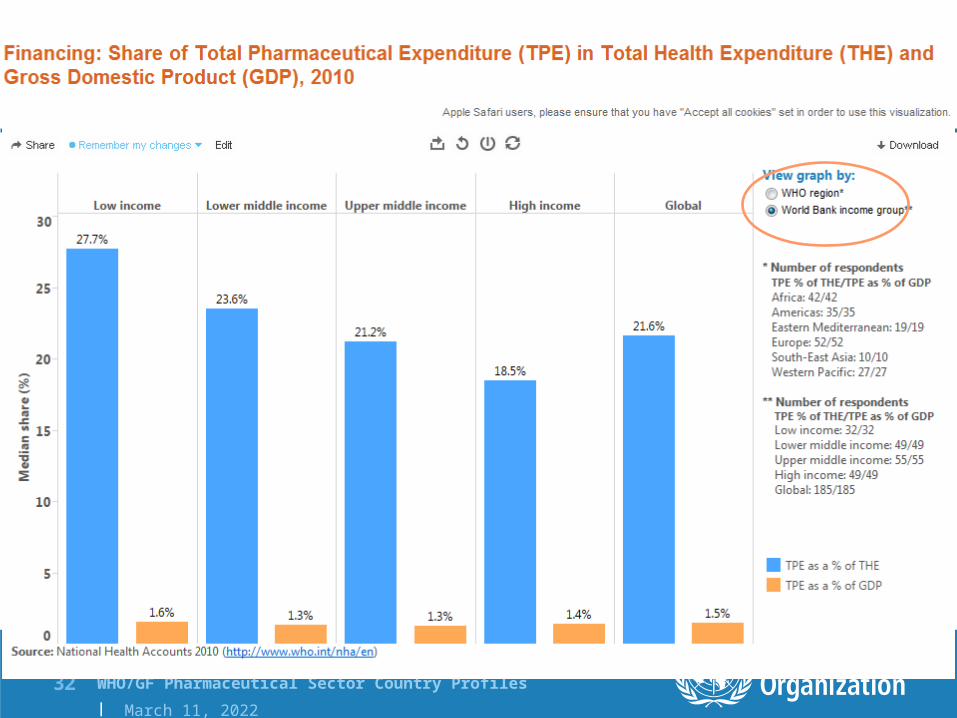
Table 4.1.5: Total Pharmaceutical Expenditures (2010)Country group (number of countries)
Population Total Pharmaceutical Expenditure
Millions % Million US$ % %THE %GDPPer capita (US$)
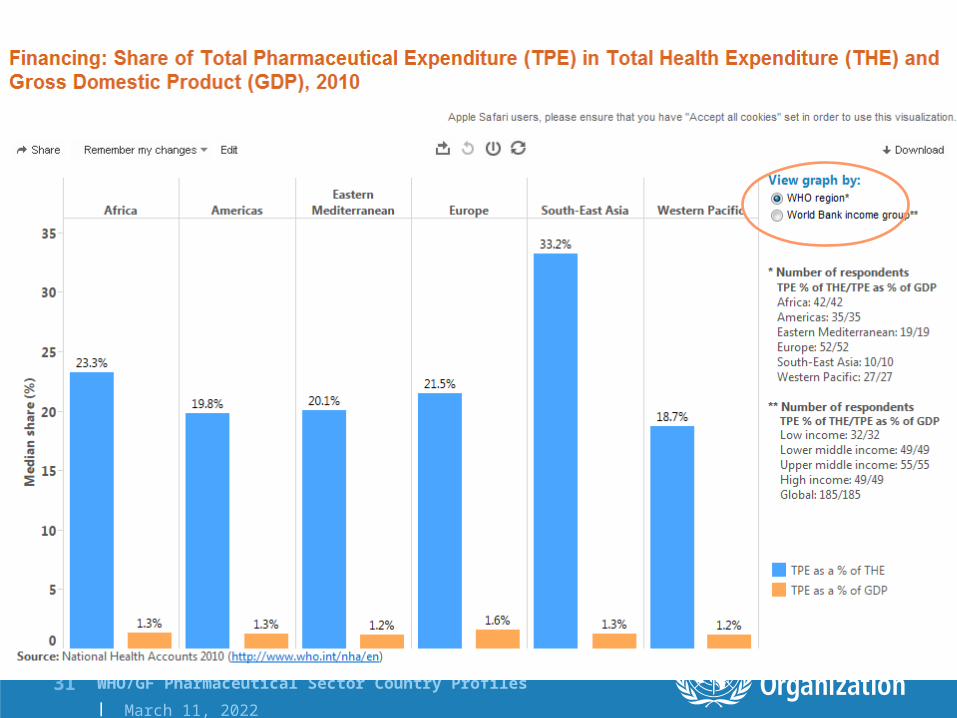
WHO regionAfrica (43) 819 12.1% $19,464 1.7% 23.0% 1.3% $10.59 Americas (35) 923 13.6% $436,004 38.7% 19.8% 1.3% $87.30 Eastern Mediterranean (19) 573 8.4% $20,763 1.8% 20.1% 1.2% $50.31
Europe (52) 896 13.2% $331,683 29.5% 21.5% 1.6%
$308.48
South-East Asia (10) 1,783 26.2% $41,157 3.5% 33.2% 1.3% $13.05Western Pacific (27) 1,800 26.5% $276,362 24.6% 18.7% 1.2% $37.90 World Bank income group
High-income (49) 1,092 16.1% $775,305 68.9% 18.5% 1.4%
$463.59
Upper-middle-income (55) 2,474 36.4% $283,864 25.2% 21.2% 1.3% $96.78 Lower-middle-income (50) 2,480 36.5% $59,580 5.3% 23.6% 1.3% $26.28Low-income (32) 749 11.0% $6,683 0.6% 27.7% 1.6% $8.01 GlobalGlobal (186) 6,795 $1,125,433 20.8% 1.4% $68.78
Source: World Health Organization Global Health Observatory Database, 2013 National Health Accounts, 2013
WHO/GF Pharmaceutical Sector Country Profiles | May 5, 202316 |
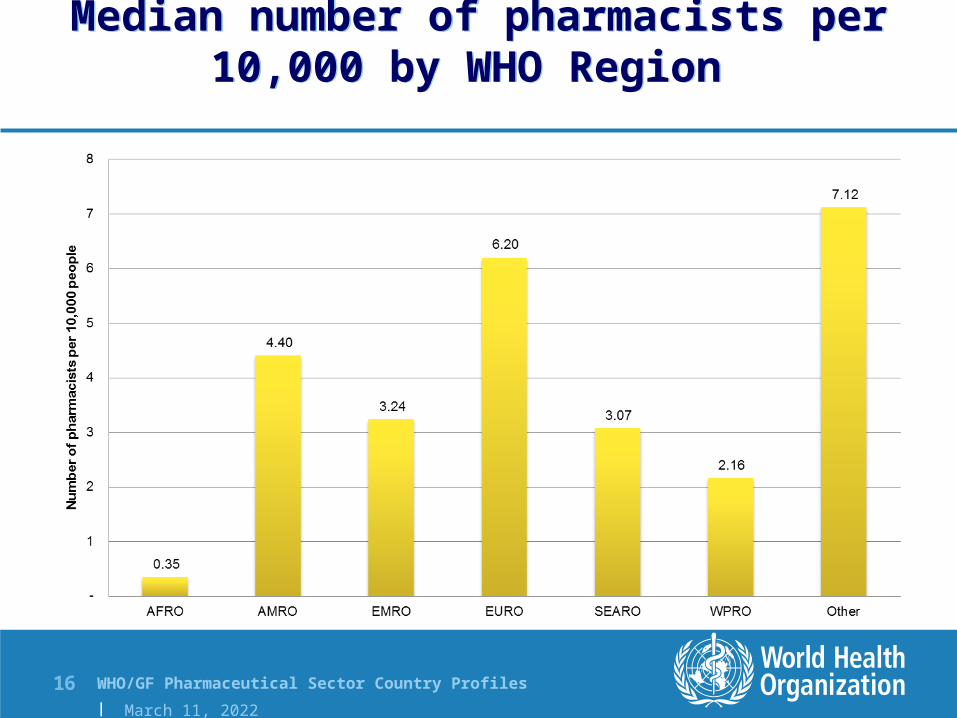
Median number of pharmacists per 10,000 by WHO Region
N
WHO/GF Pharmaceutical Sector Country Profiles | May 5, 202317 |
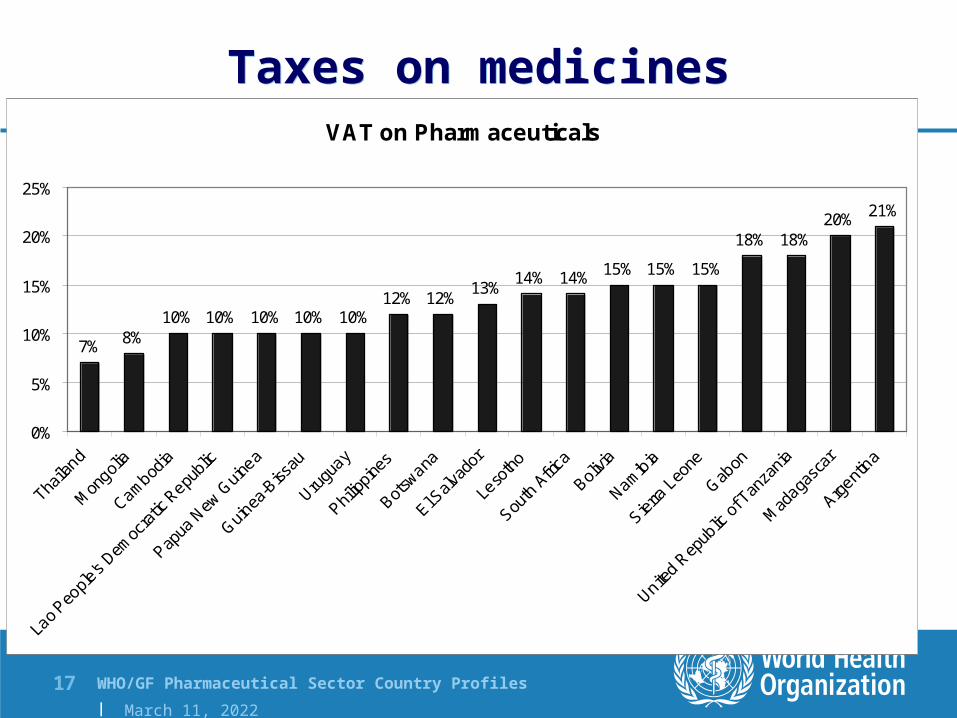
Taxes on medicinesVAT on Pharmaceuticals
7% 8%10% 10% 10% 10% 10%
12% 12% 13% 14% 14% 15% 15% 15%
18% 18%20% 21%
0%
5%
10%
15%
20%
25%
WHO/GF Pharmaceutical Sector Country Profiles | May 5, 202318 |
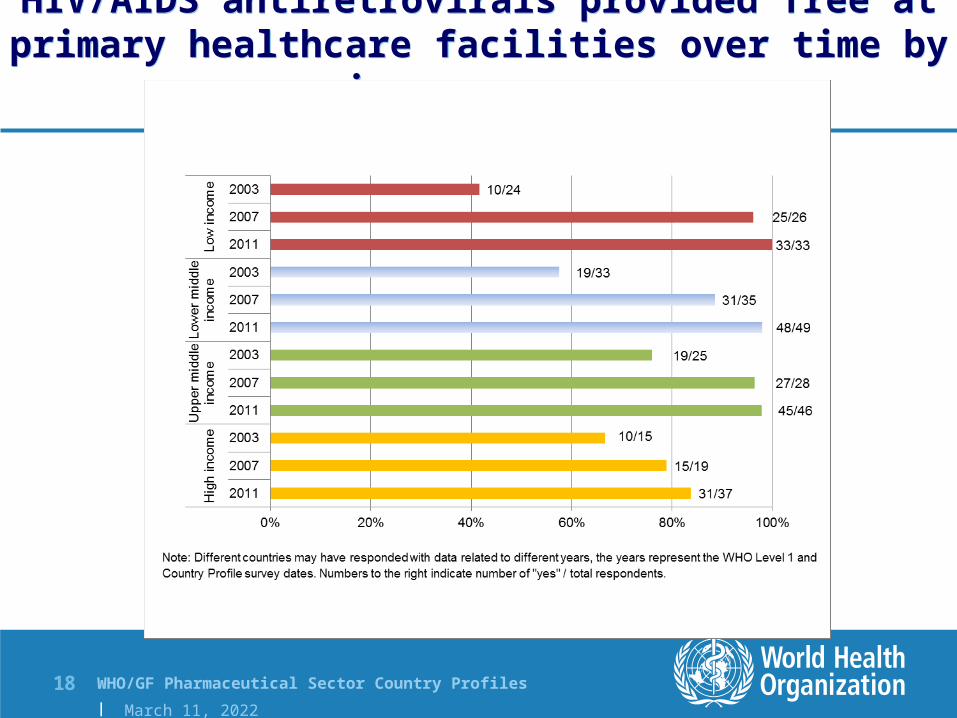
HIV/AIDS antiretrovirals provided free at primary healthcare facilities over time by income group

WHO/GF Pharmaceutical Sector Country Profiles | May 5, 202319 |
Global,Regional and Technical Reports Web Publications of Country Profiles and
Data available at: http://www.who.int/medicines/areas/coordination/coordination_assessment/en/index1.html
Regional Reports for AFRO, EURO, WPRO produced by Regional Offices and Utrecht University CC
Global Report produced by HQ Team, University of Utrecht CC, Jonny Meldrum, Catherine Shih
Technical Reports on – Financing and pricing– Selection– Rational Use

WHO/GF Pharmaceutical Sector Country Profiles | May 5, 202320 |
Evaluation of 2011 PCP Survey
Quantitative Evaluation– Data from 143 responders and 54 prefilled– Response rates over 60% for the core indicator questions
highest was Health and Demographic data, 84% and was lower for Procurement (57%), Medicines Financing (48%) and Household data (22%)
– 324 questions out of the 493 core and supplementary questions were prefilled, representing a 66% average prefill rate for the entire questionnaire.
– Of these 324 prefilled questions, 208 were changed by one or more of the respondents, representing an average change rate of 65% for the entire set of prefilled questions
WHO/GF Pharmaceutical Sector Country Profiles | May 5, 202321 |
Qualitative Evaluation– 37 respondents replied with follow up in depth telephone interviews
were undertaken with 7 respondents. A conference call was also made with the EMRO senior staff.
– Prefilling was recognized as being helpful and efficient in the validation and completion of the questionnaire and focussed country attention on data to be checked and/or changed.
– The length of the questionnaire was considered reasonable. – The Instruction Manual and Glossary were not always thought to be
useful in their current format– There was frequent criticism of the use of the Word based instrument
including problems with macros with strong support for the use of a web based software for the next survey.
WHO/GF Pharmaceutical Sector Country Profiles | May 5, 202322 |
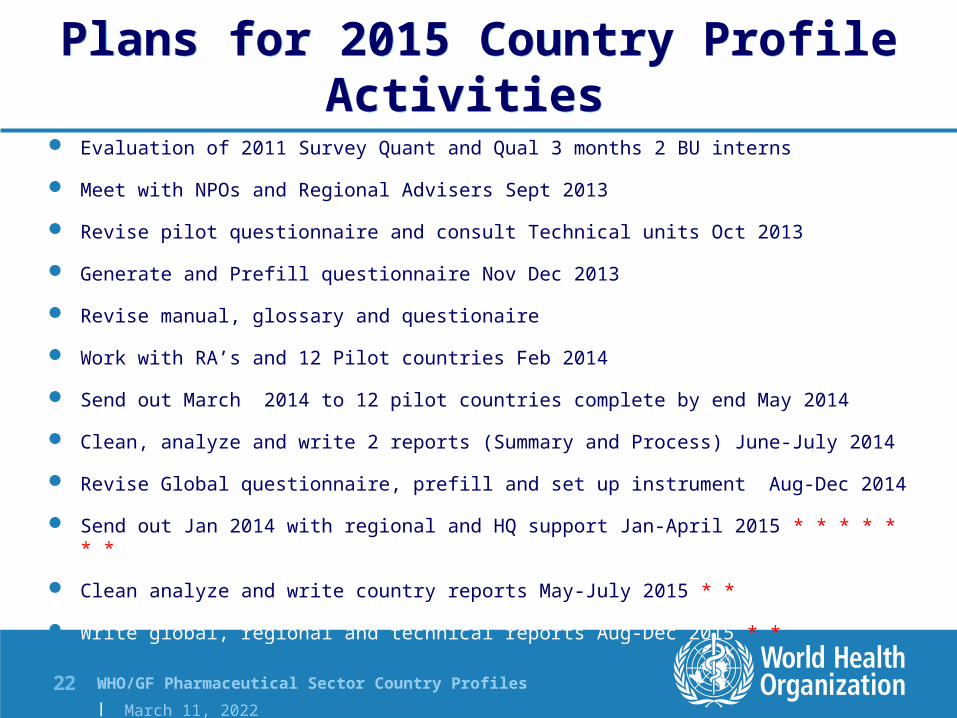
Plans for 2015 Country Profile Activities Evaluation of 2011 Survey Quant and Qual 3 months 2 BU interns
Meet with NPOs and Regional Advisers Sept 2013
Revise pilot questionnaire and consult Technical units Oct 2013
Generate and Prefill questionnaire Nov Dec 2013
Revise manual, glossary and questionaire
Work with RA’s and 12 Pilot countries Feb 2014
Send out March 2014 to 12 pilot countries complete by end May 2014
Clean, analyze and write 2 reports (Summary and Process) June-July 2014
Revise Global questionnaire, prefill and set up instrument Aug-Dec 2014
Send out Jan 2014 with regional and HQ support Jan-April 2015 * * * * * * *
Clean analyze and write country reports May-July 2015 * *
Write global, regional and technical reports Aug-Dec 2015 * *
WHO/GF Pharmaceutical Sector Country Profiles | May 5, 202323 |
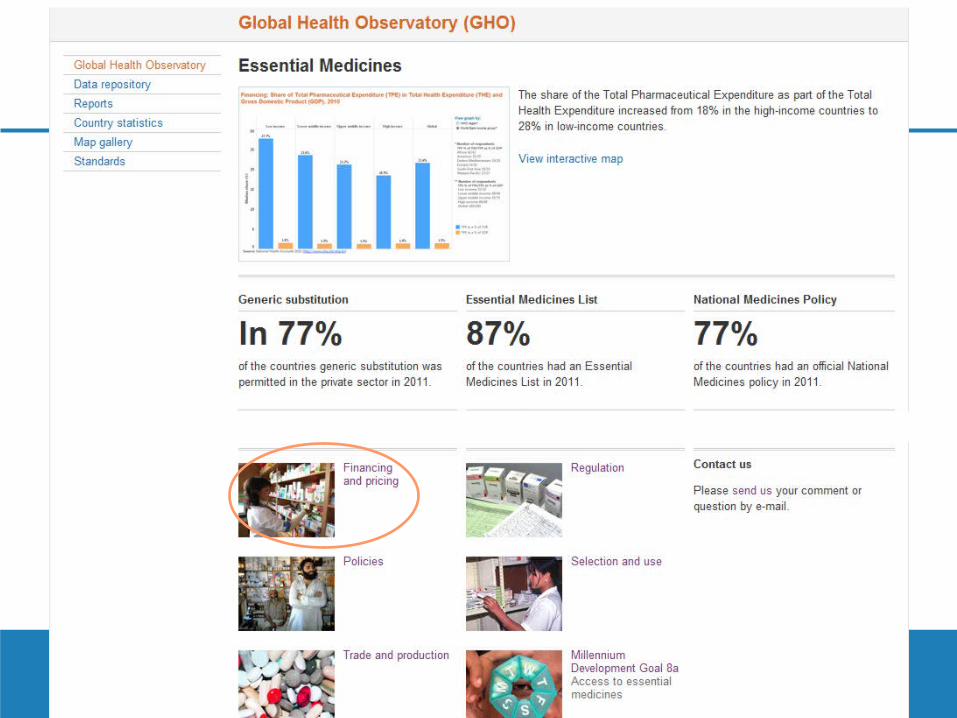
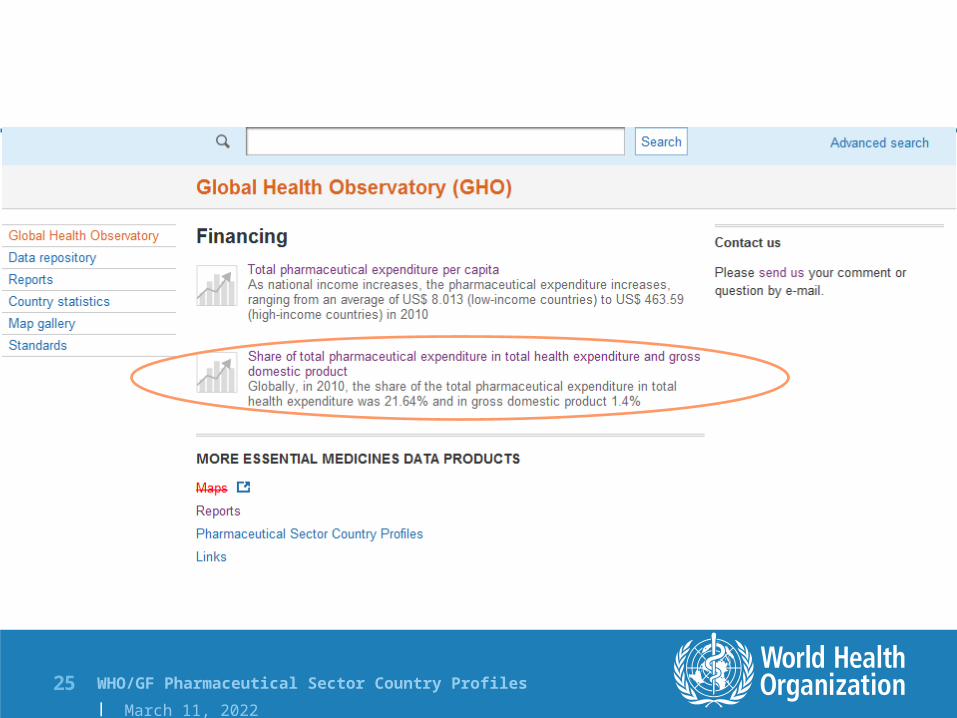
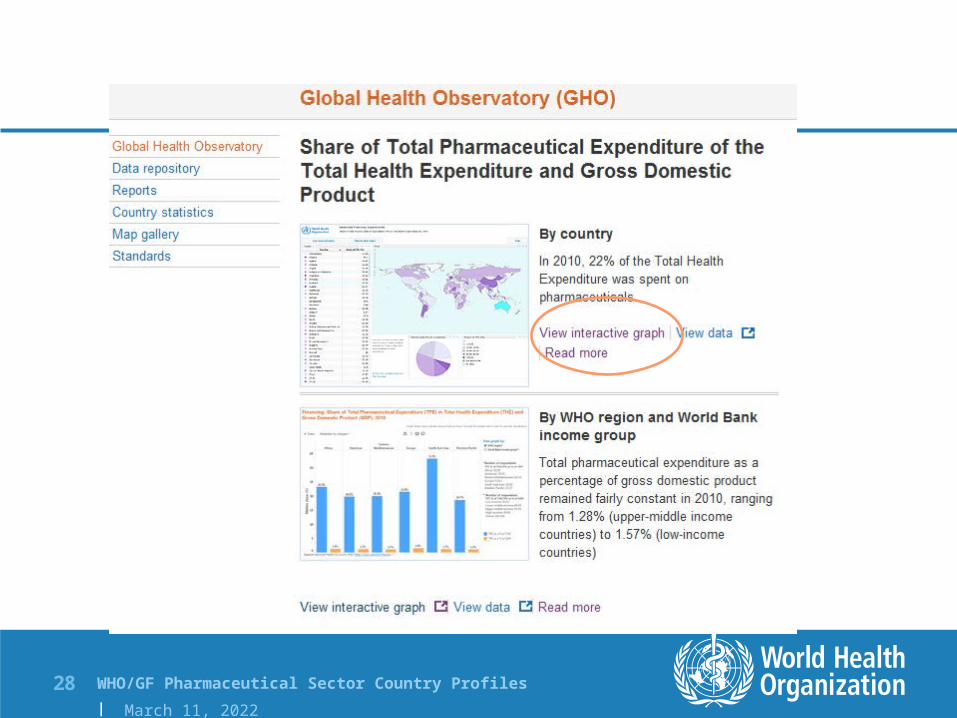
Global Health Observatory
WHO/GF Pharmaceutical Sector Country Profiles | May 5, 202324 |
WHO/GF Pharmaceutical Sector Country Profiles | May 5, 202325 |

WHO/GF Pharmaceutical Sector Country Profiles | May 5, 202326 |

WHO/GF Pharmaceutical Sector Country Profiles | May 5, 202327 |
WHO/GF Pharmaceutical Sector Country Profiles | May 5, 202328 |
WHO/GF Pharmaceutical Sector Country Profiles | May 5, 202331 |
WHO/GF Pharmaceutical Sector Country Profiles | May 5, 202332 |

WHO/GF Pharmaceutical Sector Country Profiles | May 5, 202333 |
WHO/GF Pharmaceutical Sector Country Profiles | May 5, 202334 |


![Barnstead Water Purification Systems [ES]tools.thermofisher.com/content/sfs/brochures/BRWPOVERVIEW-ES-0413.pdf · Cina +800 810 5118 or +400 650 5118 Francia +33 2 2803 2180 Germania](https://img.pdfslide.us/doc/110x75/5c5c0bbf09d3f25e368cdf3c/barnstead-water-purification-systems-estools-cina-800-810-5118-or-400-650.jpg)