Embed Size (px)
Citation preview

Q1 2017 was the last quarter with a redemption value of 5 cents. As such, redemption declined towards the end of the quarter as people held their containers for the redemption increase.
Q1 2017

Basic Facts:
• Processes ~1.1 billion containers/year (as of 2016)• 86 members and participants (only distributors of beverages)• 300 Oregon Employees• 5 processing plants in Oregon
• Portland, Eugene, Medford, Redmond, Hermiston• Trucks collect empties from ~2,500 Oregon retail locations• Annual operating budget of ~$34 million dollars (2016)• Partner in ORPET (St. Helens operation processing all Oregon PET)• All with ZERO taxpayer dollars• MORE INFO: www.obrc.com www.bottledropcenters.com

3,900,000
188,966,824
628,290,705 299,402,355
1,116,659,884

Redemption Center
Glass Bottles Aluminum Cans Plastic Bottles Totals
Albany 540,471 3,032,796 1,561,677 5,134,944 Bend 1,068,136 3,162,094 920,553 5,150,783 Delta Park - PDX 1,612,029 4,804,392 2,552,839 8,969,260 Eugene 1,297,652 4,042,374 1,624,321 6,964,347 Forest Grove 365,658 1,683,305 792,398 2,841,361 Glisan - Portland 1,897,427 5,735,664 3,865,128 11,498,219 Grants Pass 553,154 2,374,815 1,070,619 3,998,588 Gresham 940,938 3,658,158 2,117,124 6,716,220 Hermiston 279,526 1,569,292 983,846 2,832,664 Klamath Falls 451,458 2,592,370 1,100,463 4,144,291 Lancaster-Salem 996,909 4,378,041 2,726,037 8,100,987 Medford 1,108,511 4,466,940 2,184,635 7,760,086 Milwaukie 703,834 2,223,232 1,216,583 4,143,649 NE Salem 613,793 2,629,986 1,515,144 4,758,923 Oregon City 708,792 3,296,518 1,482,218 5,487,528 Redmond 473,708 1,981,435 701,136 3,156,279 South Salem 680,032 2,743,926 1,429,481 4,853,439 Tigard 1,021,497 3,172,489 1,915,560 6,109,546 Wood Village 622,821 2,470,719 1,404,386 4,497,926 Totals 15,936,346 60,018,546 31,164,148 107,119,040

The total weight of all containers processed this quarter equals
123 Gray whales!

6,673
902
490
272
1,048
9,385
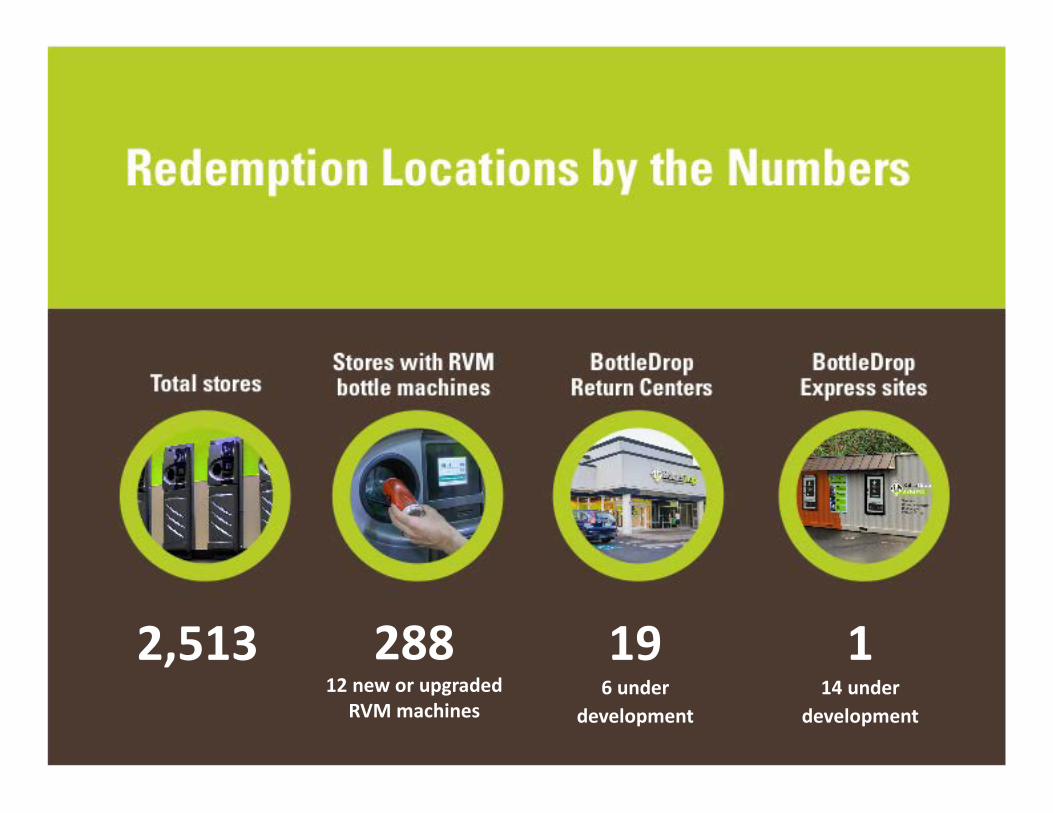
2,513 28812 new or upgraded
RVM machines
196 under
development
114 under
development

Glisan
64%*
OLCC data as of last report
50%
#1 BottleDrop site by volume of containers
Q1 2017
Projected for this quarter

0
0.05
0.1
0.15
0.2
0.25
0.3
0.35
1,050,000,000
1,060,000,000
1,070,000,000
1,080,000,000
1,090,000,000
1,100,000,000
1,110,000,000
1,120,000,000
2012 2013 2014 2015
Total containers redeemed % returns through BottleDrop
Based on OLCC data

1,293
$109,608
Humane Society of RedmondForest Grove HS Grad Night Committee
1672

3,917,771 lbs.