Embed Size (px)
Citation preview

H1 2017
31 August 2017

2
Financial highlights Q2 2017
In € mlnQ2 -2017 Q2 -2016
Real Estate (3.3) (6.3)
Water Infrastructure (discontinued operations*) 1.3 1.9
Banking and Retail Lending (sold operations)- 2.6
Other – Banking and Retail Lending (continuing operations) 0.7 3.3
Total Operations (1.3) 1.5
Holding (Corporate Finance and G&A) (0.8) (9.3)
Total (2.1) (7.8)
Comprehensive Income (expense) (14.6) (1.4)
Total Comprehensive Income (loss) (16.7) (9.2)
* Presented as Held for Sale/ Discontinued operations as from Q1 2017

3
Financial highlights H1 2017
In € mlnH1 -2017 H1-2016
Real Estate (5.2) (8.3)
Water Infrastructure (discontinued operations*) 2.2 1.6
Banking and Retail Lending (sold operations)- 6.5
Other – Banking and Retail Lending (continuing operations) 1.4 3.3
Total Operations (1.6) 3.1
Holding (Corporate Finance and G&A) (18.3) (9.0)
Total (19.9) (5.9)
Comprehensive Income (expense) (16.4) (11.3)
Total Comprehensive Income (loss) (36.3) (17.2)
* Presented as Held for Sale/ Discontinued operations as from Q1 2017

4
Highlights Q2 and H1 2017
• Kardan’s real estate and water infrastructure activities continued their positive operational performance in Q2 2017
• Positive foreign exchange impact of € 5.3 mn of the revaluation of the EUR versus the NIS and the Israeli CPI on the Company’s debentures in Q2 2017 (Q2 2016: € 2.0 mn), partially offset negative impact of € 11.5 mn in Q1 2017.
• Resulting in € 19.9 mn loss to equity holders for H1 2017 (H1 2016: net loss of € 5.9 mn) predominantly due to higher financing costs, including a total negative € 6.2 mnimpact of foreign exchange and CPI on the Company’s debentures

5
Highlights Q2 and H1 2017
• Real estate operations generated a loss of € 3.3 mn in Q2 2017 (Q2 2016: loss of €6.3 mn), leading to a net loss of € 5.2 mn in H1 2017 due to high financing costs –mainly related to the Galleria Dalian loan (H1 2016: net loss of € 8.3 mn) o Equity earnings increased substantially due to delivery of apartmentso Improvement in revenue from delivery of units in the Dalian projecto Continued gradual improvement in rental revenues Galleria Dalian
• Water Infrastructure operations contributed a net profit of € 1.3 mn (Q2 2016: € 1.9 mn) leading to a profit of € 2.2 mn in H1 2017 (H1 2016: € 1.6 mn).o Revenues increased by 17% following progress in new and existing projectso Tahal won various new contracts recently (after 30 June 2017)
• Other – banking and retail lending – Avis Ukraine showed a strong performance and contributed equity earnings of € 1.6 mn in H1 2017

6
Equity position
Kardan N.V.(company only, in € mln) 30 June 2017
31 December 2016
Total Assets 388.7 409.7
Total Equity 1.1 37.3
Equity/Total assets (%) 0.3% 9%

7
Real Estate – H1 2017 highlights
Result: • € 5.2 mn net loss (H1 2016: € 8.3 mn net loss) o High financing expenses due to the Galleria Dalian loan and
following devaluation of RMB vs EUR (negative FX impact of € 2.7 mn vs € 1.0 mn in H1 2016)
• Result from operations: € 4.3 mn profit (H1 2016: € 4.7 mn loss)
Revenues: • Increased from € 4.0 mn in H1 2016 to € 4.3 mn in H1 2017o Increase in rental revenues as a result of continuous
improvement in the operational indicators of Galleria Dalian
o Increase in revenues from sales of apartments o Decrease in management fees due to expiry of Galleria
Chengdu contract
Equity Earnings: • Contributed a profit of € 8.4 mn (H1 2016 € 0.3 mn loss) o Considerable increase in delivery of apartments and related
revenues (€ 41.5 mn vs € 19.3 mn in H1 2016)o Gross margin improved to 32% (H1 2016: 28%)

8
Real Estate – H1 2017 highlights (continued)
Sale of apartments:
• 741 units sold in H1 2017 (H1 2016: 749, 1,323 in FY 2016). • Rate of unsold completed units in inventory decreased to 15%
(17% at year-end 2016)• Total unsold apartments in inventory decreased to 519 (vs 718 at
year-end 2016), including inventory of joint venture projects
Finance expenses:
• Amounted to € 8.5 mn (H1 2016 € 7.3 mn)• Negative FX impact of € 2.7 mn due to devaluation of RMB vs EUR
(H1 2016: negative impact of € 1.0 mn)
Loans and borrowings
• KLC works diligently on its refinancing requirements, and isconfident regarding its ability to reach agreement on the refinancing

9
Real Estate H1 2017 highlights (continued)
H1 2017 H1 2016 FY 2016
Total apartments sold in period 741 749 1,323
Total apartments delivered in period 913 520 1,417
Apartments Dalian sold in period 16 2 14
Apartments Dalian delivered in period 12 2 3
Total apartments sold, not yet delivered 1,906 2,434 2,114

10
Water Infrastructure – H1 2017 highlights
• Presented as Held for Sale/ Discontinued operations as from Q1 2017
• Contributed a profit of € 2.2 mn vs € 1.6 mn in H1 2016
• Revenues increased to € 74.2 mn (H1 2016: € 63.5 mn)
• Gross margin decreased from 15% in H1 2016 to 12% in H1 2017o Due to high initial costs in relation to start of Quiminha project in Angola
• The backlog remained stable at USD 605 mn
• TGI signed a number of new contracts (after 30 June 2017):• A multipurpose agriculture and water project in Zambia ($ 176 mn)• Three water infrastructure design-build projects in Angola ($ 291 mn in
total)• The new projects in Zambia and Angola were signed together with TGI
50% partner

11
Maturity of liabilities
(€ million) 2017 2018 2019 2020 Total
Debentures - Series A* - 48.6 - - 48.6
Debentures - Series B* - 50.2 100.4 100.4 251.0
Total - 98.8 100.4 100.4 299.6
Company Only – Kardan N.V. (principal only, June 30, 2017)
(*) Net of debentures held by subsidiaries

12
Cash flow forecast Kardan
Company only - Kardan N.V. July 1, 2017– June 30, 2019
Sources € millions
Cash & ST investments as at 1.7.2017 1.6Repayment of loan to subsidiary 5.0Sale of assets 240.9Total sources 247.5
UsesSeries A debentures (principal) 48.6Series B debentures (principal) 150.6Interest expenses 33.7G&A expenses less management fees 7.4Total uses 240.3
Expected cash & short term investments at 30.6.2019: 7.2

13
Outlook
• Focus remains on generating liquidity to meet our repayment obligation, while strengthening the performance of our operating subsidiaries.
• Kardan has signed an agreement for the sale of our stake in Star Pumped Storage, which is expected to be finalized in the coming months.
• Moreover, the Company further advanced the process to sell Tahal. We believe that the sale of Tahal will enable us to meet our 2018 debt repayment obligations as well as to strengthen our equity.
• The Company’s results are to a large extent dependent on currency movements* and therefore the Company cannot give guidance on its 2017 results.
* Kardan is exposed to the currency movements of the NIS and the RMB versus the Euro – as its liabilities are in NIS, its
assets are predominantly in RMB and it reports in EUR

14
Investor relations contact details
Floor van Maaren/ Eva Lindner
Office: +31 20 305 0010
Kardan N.V.
Claude Debussylaan 30Viñoly Building, 13th floor1082 MD AmsterdamThe Netherlands
www.kardan.nl
Ohad Lev
Office: + 972 3 608 3444
Mobile: + 972 54 333 0830
Kardan N.V.
154 Menachem Begin Rd.Tel Aviv 64921Israel
The Netherlands Israel

15
Appendix
H1 2017 financials

16
Consolidated Income Statement Kardan N.V.
Total Total Total Total Total H1 - 2017 H1 - 2016 Q2 - 2017 Q2 - 2016 12M - 2016
Total revenues 4.3 6.6 2.7 4.6 11.1 Total expenses 10.7 10.3 6.1 4.9 21.8
Loss from operations before fair value adjustments, disposal of assets and financial expenses
(6.4)
(3.7)
(3.4) (0.3)
(10.7)
Loss from fair value adjustments and disposal of assets and investments, net
- (0.3) - (0.4) (4.2)
Result from operations before finance expenses
(6.4) (4.0) (3.4) (0.7) (14.9)
Financing expenses, net (24.5) (13.4) (4.6) (10.1) (47.3) Equity earnings 10.0 - 4.6 (3.4) 3.9
Loss before income tax (20.9) (17.4) (3.4) (14.2) (58.3) Income tax (expenses)/benefit (1.2) 3.4 - 1.9 4.5
Loss from continuing operations (22.1) (14.0) (3.4) (12.3) (53.8) Profit from discontinued operations *) 2.2 8.1 1.3 4.5 22.5
Loss for the period attributable to Kardan equity holder
(19.9)
(5.9)
(2.1) (7.8)
(31.3)
Other comprehensive income (loss) (16.4)
(11.3)
(14.6) (1.4)
(2.5)
Total Comprehensive Income / (loss) attributable to Kardan equity holders
(36.3)
(17.2)
(16.7) (9.2)
(33.8)
For the six and three month periods ended June 30, 2017 (in € million)
17
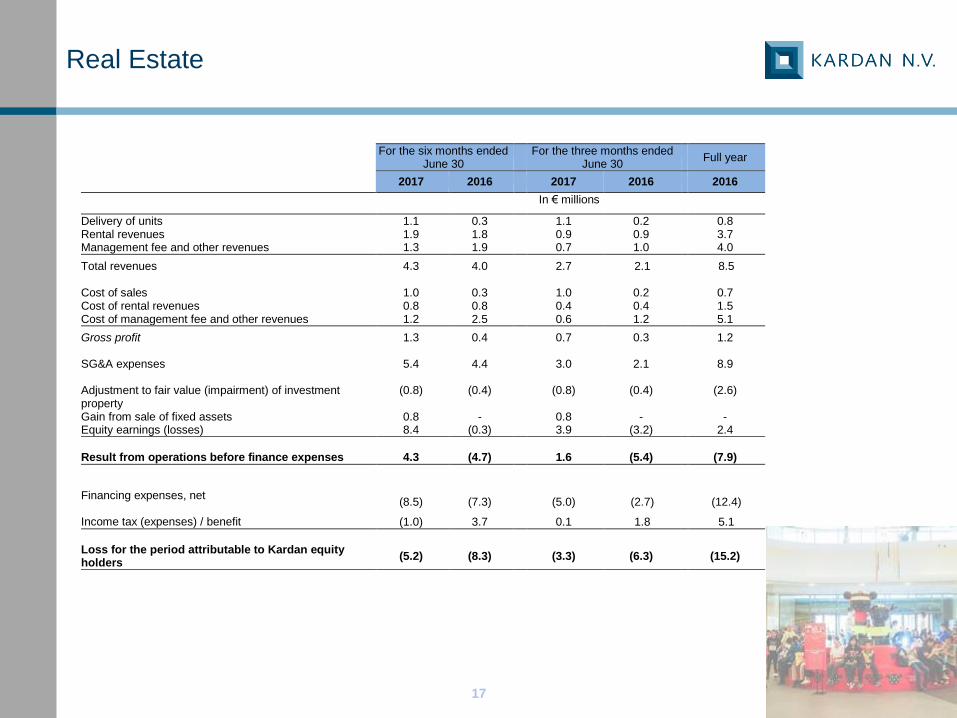
Real Estate
For the six months ended June 30
For the three months ended June 30
Full year
2017 2016 2017 2016 2016
In € millions
Delivery of units 1.1 0.3 1.1 0.2 0.8 Rental revenues 1.9 1.8 0.9 0.9 3.7 Management fee and other revenues 1.3 1.9 0.7 1.0 4.0
Total revenues 4.3 4.0 2.7 2.1 8.5 Cost of sales 1.0 0.3 1.0 0.2 0.7 Cost of rental revenues 0.8 0.8 0.4 0.4 1.5 Cost of management fee and other revenues 1.2 2.5 0.6 1.2 5.1
Gross profit 1.3 0.4 0.7 0.3 1.2 SG&A expenses 5.4 4.4 3.0 2.1 8.9 Adjustment to fair value (impairment) of investment property
(0.8) (0.4) (0.8) (0.4) (2.6)
Gain from sale of fixed assets 0.8 - 0.8 - - Equity earnings (losses) 8.4 (0.3) 3.9 (3.2) 2.4
Result from operations before finance expenses 4.3 (4.7) 1.6 (5.4) (7.9)
Financing expenses, net
(8.5) (7.3) (5.0) (2.7) (12.4)
Income tax (expenses) / benefit (1.0) 3.7 0.1 1.8 5.1
Loss for the period attributable to Kardan equity holders
(5.2) (8.3) (3.3) (6.3) (15.2)

18
Water Infrastructure (discontinued operations)
For the six months ended
June 30,
For the three months ended
June 30,
Full Year
2017 2016 2017 2016 2016
In € millions
Contract revenues 74.2 63.5 * 43.1 31.9 * 138.5 *
Contract cost 65.3 53.9 * 38.3 27.1 * 117.4 *
Gross profit 8.9 9.6 4.8 4.8 21.1
SG&A expenses 7.1 7.0 3.7 3.4 14.2
Equity earnings / (losses) (0.5) - (0.2) 0.1 (1.1)
Gain on disposal of assets and other income - 1.0 - 1.1 0.5
Result from operations before financing expenses 1.3 3.6 0.9 2.6 6.3
Financing income (expenses), net 0.3 0.3 0.5 (0.3) (1.9)
Income tax expenses (0.2) (2.2) (0.5) (1.5) (3.4)
Profit (loss) from continuing operations 1.4 1.7 0.9 0.8 1.0
Net profit (loss) from discontinued operations - KWIG - (0.1) - 1.3 (0.1)
Net profit 1.4 1.6 0.9 2.1 0.9
Attributable to:
Non-controlling interest holders (0.8) - (0.4) 0.2 -
Equity holders (Kardan N.V.) 2.2 1.6 1.3 1.9 0.9
* Reclassified (no impact on net profit).

19
Corporate holding and other
For the six months ended
June 30,
For the three months ended
June 30, Full Year
2017 2016 2017 2016 2016
In € millions
Corporate expenses:
General and administration expenses (2.1) (1.8) (1.1) (0.9) (3.7)
Financing income (expense), net (16.0) (6.9) 0.4 (8.4) (35.7)
Gain on disposal of assets and other income - - - (0.1) -
Income tax expenses (0.2) (0.3) (0.1)0.1 (0.6)
(18.3) (9.0) (0.8) (9.3) (40.0)
Continuing operations of the former ‘banking and retail
lending’ segment:
Gain on disposal of assets and other income - 2.7 - 2.6 (1.6)
Financing income (expense), net - 0.8 - 1.0 -
Equity earnings 1.6 0.3 0.8 (0.2) 1.5
Other expenses, net (0.2) (0.5) (0.1) (0.1) 1.5
1.4 3.3 0.7 3.3 1.4

Disclaimer
This presentation has been prepared on behalf of Kardan N.V. solely for information purposes. It is not an investment advice or
an offer or solicitation for the purchase or sale of any financial instrument. While reasonable care has been taken to ensure that
the information contained herein is not untrue or misleading at the date of the presentation, Kardan N.V. makes no
representation that it is accurate or complete. The information contained herein is subject to change without notice.
Neither Kardan N.V. nor any of its officers or employees accepts any liability for any direct or consequential loss arising from any
use of this presentation or its contents. Copyright and database rights protection exist in this presentation and it may not be
reproduced, distributed or published by any person for any purpose without the prior express consent of Kardan N.V.
All rights are reserved.
Thank you
20