Embed Size (px)
Citation preview
Lumenis Investor Presentation June 2015
NASDAQ: LMNS
Safe Harbor
2
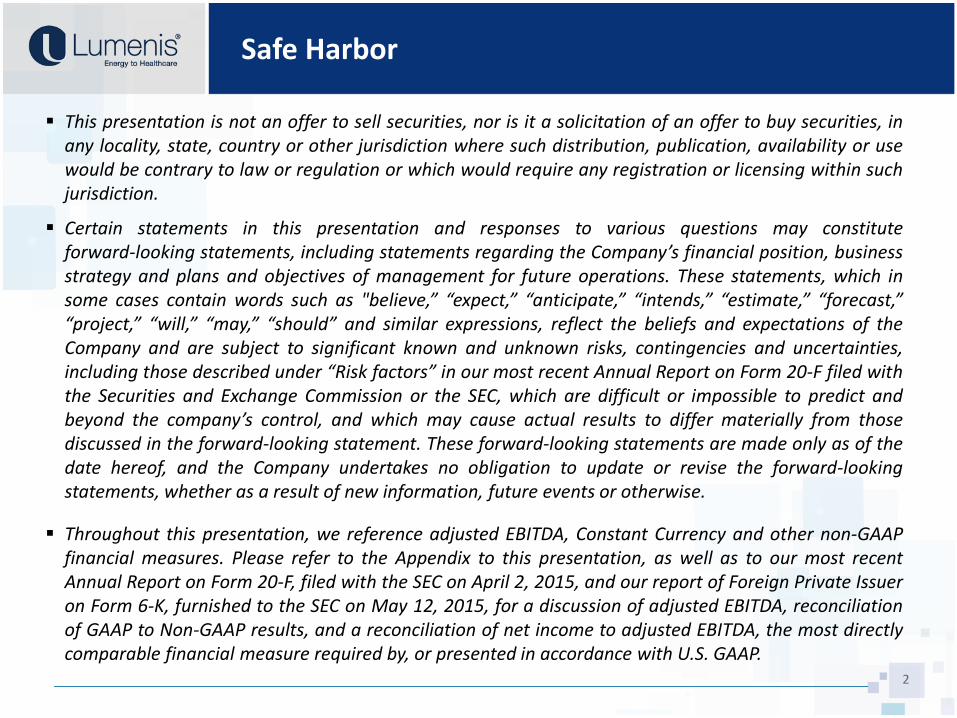
This presentation is not an offer to sell securities, nor is it a solicitation of an offer to buy securities, inany locality, state, country or other jurisdiction where such distribution, publication, availability or usewould be contrary to law or regulation or which would require any registration or licensing within suchjurisdiction.
Certain statements in this presentation and responses to various questions may constituteforward‐looking statements, including statements regarding the Company’s financial position, businessstrategy and plans and objectives of management for future operations. These statements, which insome cases contain words such as "believe,” “expect,” “anticipate,” “intends,” “estimate,” “forecast,”“project,” “will,” “may,” “should” and similar expressions, reflect the beliefs and expectations of theCompany and are subject to significant known and unknown risks, contingencies and uncertainties,including those described under “Risk factors” in our most recent Annual Report on Form 20-F filed withthe Securities and Exchange Commission or the SEC, which are difficult or impossible to predict andbeyond the company’s control, and which may cause actual results to differ materially from thosediscussed in the forward-looking statement. These forward-looking statements are made only as of thedate hereof, and the Company undertakes no obligation to update or revise the forward-lookingstatements, whether as a result of new information, future events or otherwise.
Throughout this presentation, we reference adjusted EBITDA, Constant Currency and other non-GAAPfinancial measures. Please refer to the Appendix to this presentation, as well as to our most recentAnnual Report on Form 20-F, filed with the SEC on April 2, 2015, and our report of Foreign Private Issueron Form 6-K, furnished to the SEC on May 12, 2015, for a discussion of adjusted EBITDA, reconciliationof GAAP to Non-GAAP results, and a reconciliation of net income to adjusted EBITDA, the most directlycomparable financial measure required by, or presented in accordance with U.S. GAAP.
Who we are
3
Well-positioned across multiple attractive end markets
4
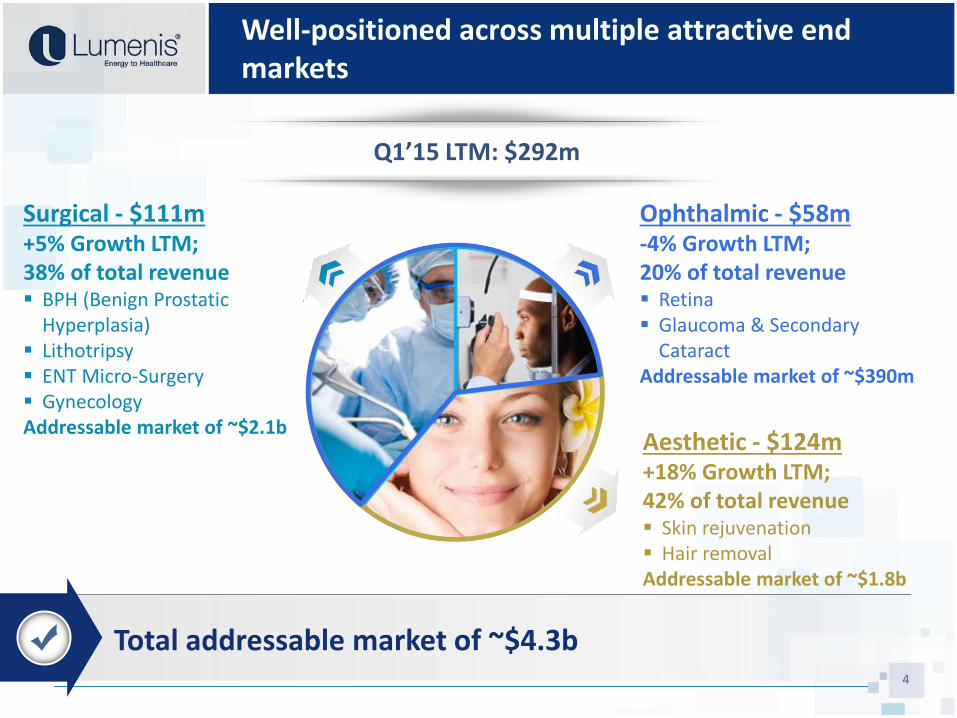
Q1’15 LTM: $292m
Ophthalmic - $58m -4% Growth LTM;20% of total revenue Retina Glaucoma & Secondary
CataractAddressable market of ~$390m
Aesthetic - $124m +18% Growth LTM; 42% of total revenue Skin rejuvenation Hair removalAddressable market of ~$1.8b
Surgical - $111m +5% Growth LTM; 38% of total revenue BPH (Benign Prostatic
Hyperplasia) Lithotripsy ENT Micro-Surgery Gynecology Addressable market of ~$2.1b
Total addressable market of ~$4.3b
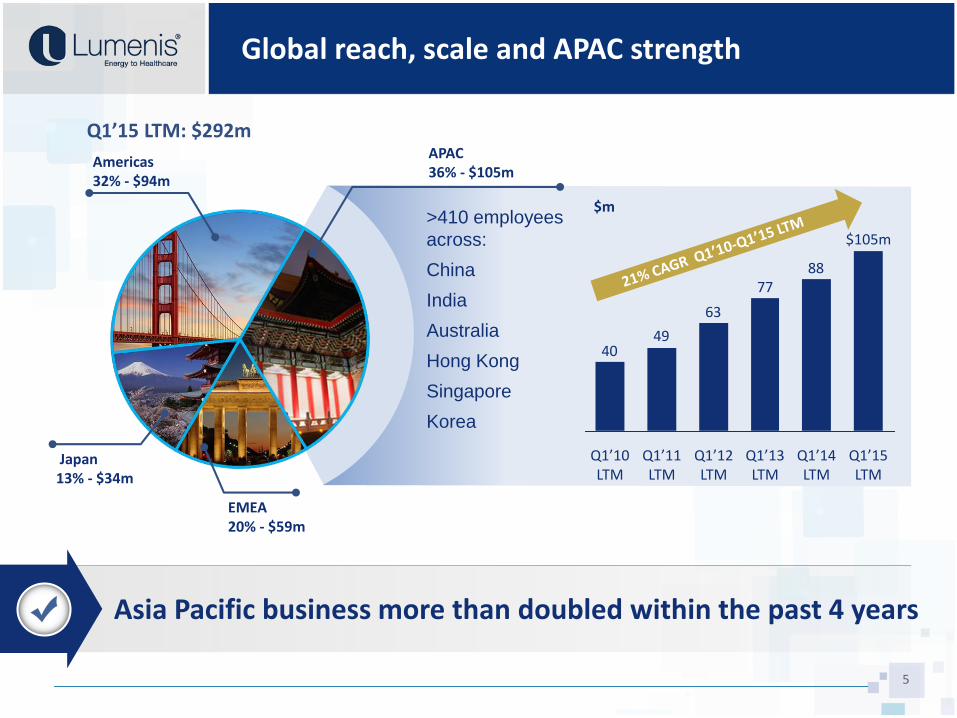
Global reach, scale and APAC strength
5
Asia Pacific business more than doubled within the past 4 years
Q1’15 LTM: $292m
>410 employees
across:
China
India
Australia
Hong Kong
Singapore
Korea
Americas32% - $94m
Japan13% - $34m
EMEA20% - $59m
APAC36% - $105m
$m
8877
63
4940
Q1’14 LTM
Q1’13 LTM
Q1’12 LTM
Q1’11 LTM
Q1’10 LTM
Q1’15 LTM
$105m
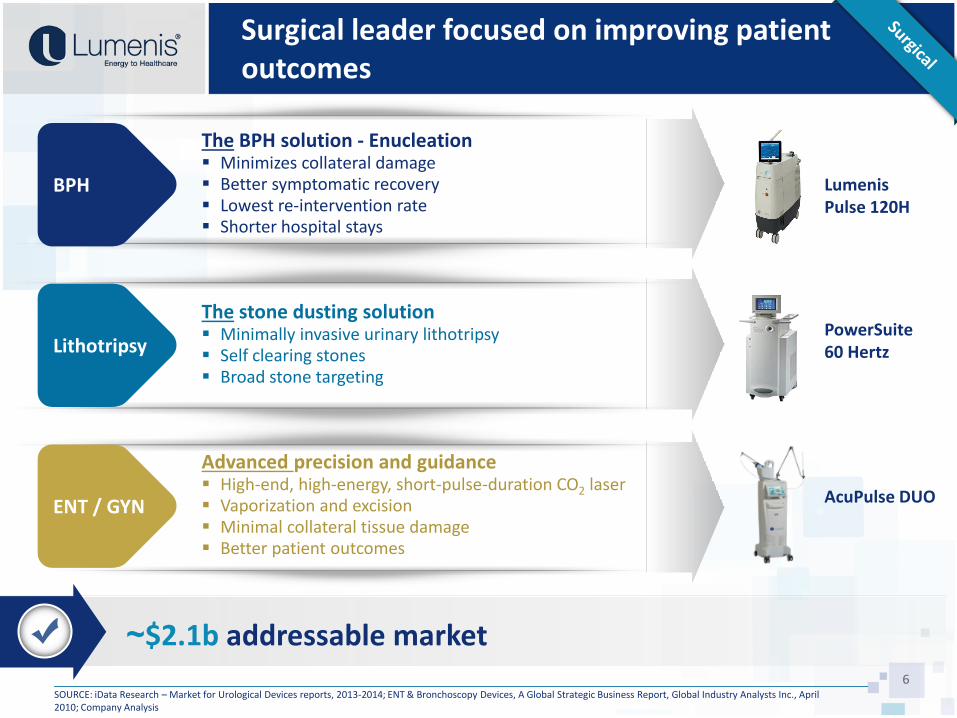
Surgical leader focused on improving patient outcomes
6
~$2.1b addressable market
BPH
The BPH solution - Enucleation Minimizes collateral damage Better symptomatic recovery Lowest re-intervention rate Shorter hospital stays
Lumenis Pulse 120H
Lithotripsy
The stone dusting solution Minimally invasive urinary lithotripsy Self clearing stones Broad stone targeting
PowerSuite 60 Hertz
ENT / GYN
Advanced precision and guidance High-end, high-energy, short-pulse-duration CO2 laser Vaporization and excision Minimal collateral tissue damage Better patient outcomes
AcuPulse DUO
SOURCE: iData Research – Market for Urological Devices reports, 2013-2014; ENT & Bronchoscopy Devices, A Global Strategic Business Report, Global Industry Analysts Inc., April 2010; Company Analysis
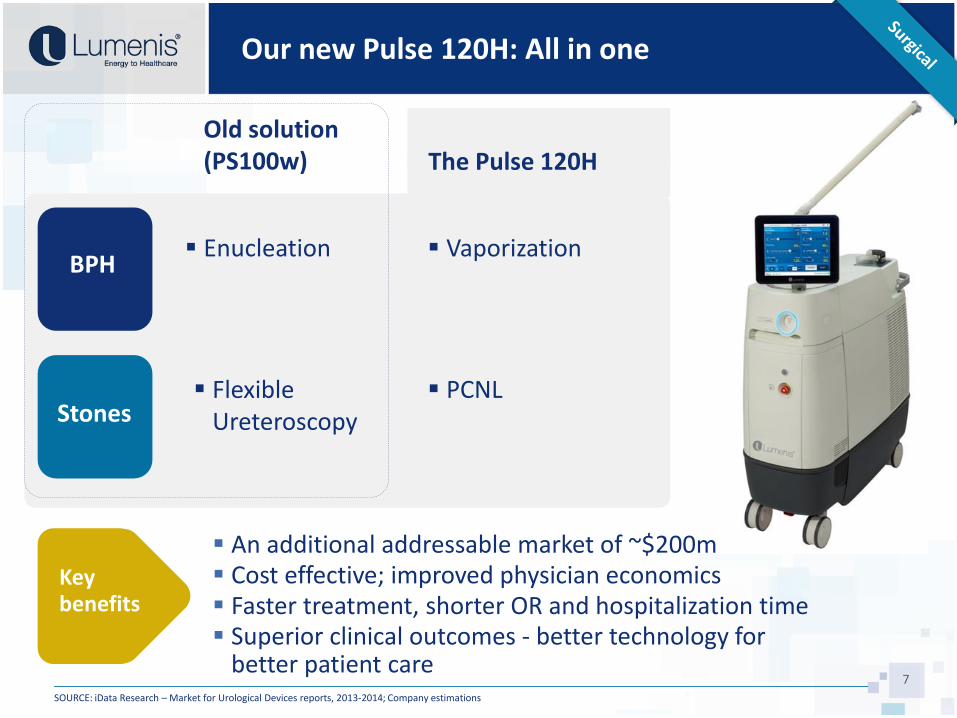
Our new Pulse 120H: All in one
7
BPH
Stones
Enucleation
Flexible Ureteroscopy
Vaporization
PCNL
An additional addressable market of ~$200m Cost effective; improved physician economics Faster treatment, shorter OR and hospitalization time Superior clinical outcomes - better technology for
better patient care
Key benefits
Old solution (PS100w) The Pulse 120H
SOURCE: iData Research – Market for Urological Devices reports, 2013-2014; Company estimations
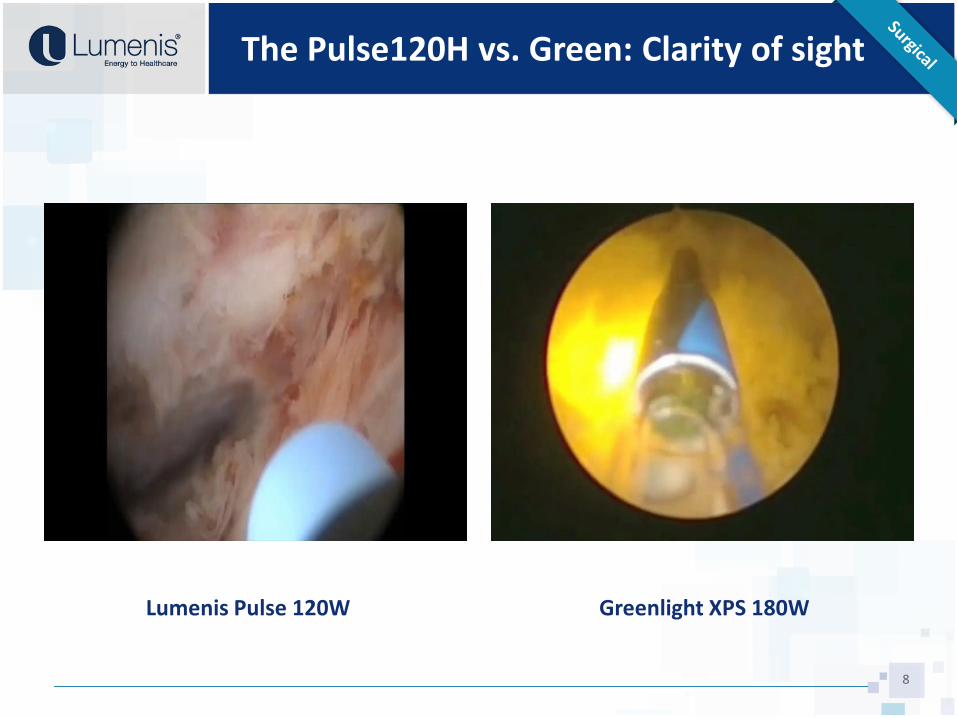
The Pulse120H vs. Green: Clarity of sight
Greenlight XPS 180WLumenis Pulse 120W
8
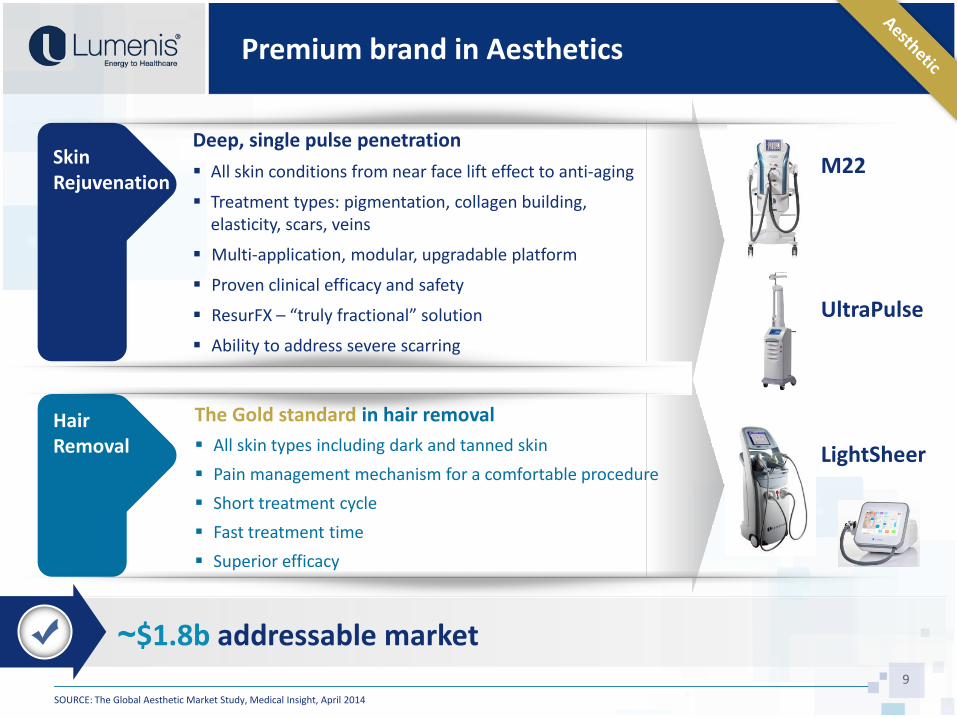
Premium brand in Aesthetics
9
~$1.8b addressable market
Skin Rejuvenation
Deep, single pulse penetration
All skin conditions from near face lift effect to anti-aging
Treatment types: pigmentation, collagen building, elasticity, scars, veins
Multi-application, modular, upgradable platform
Proven clinical efficacy and safety
ResurFX – “truly fractional” solution
Ability to address severe scarring
M22
UltraPulse
HairRemoval
The Gold standard in hair removal
All skin types including dark and tanned skin
Pain management mechanism for a comfortable procedure
Short treatment cycle
Fast treatment time
Superior efficacy
LightSheer
SOURCE: The Global Aesthetic Market Study, Medical Insight, April 2014
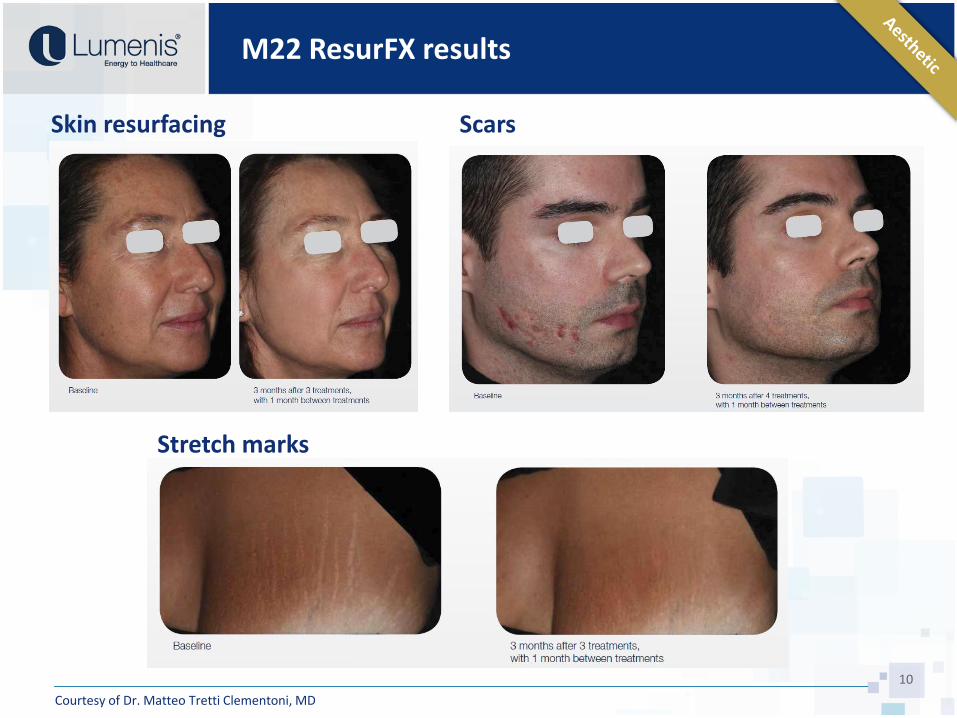
M22 ResurFX results
10
Courtesy of Dr. Matteo Tretti Clementoni, MD
Skin resurfacing
Stretch marks
Scars

UltraPulse results
11
UltraPulse – Scars and range of motion
UltraPulse Deep FX – Fractional skin resurfacing
Courtesy of Dr. Jill Waibel, MD Courtesy of Dr. Jill Waibel, MD
Courtesy of Suzanne Kilmer, MD
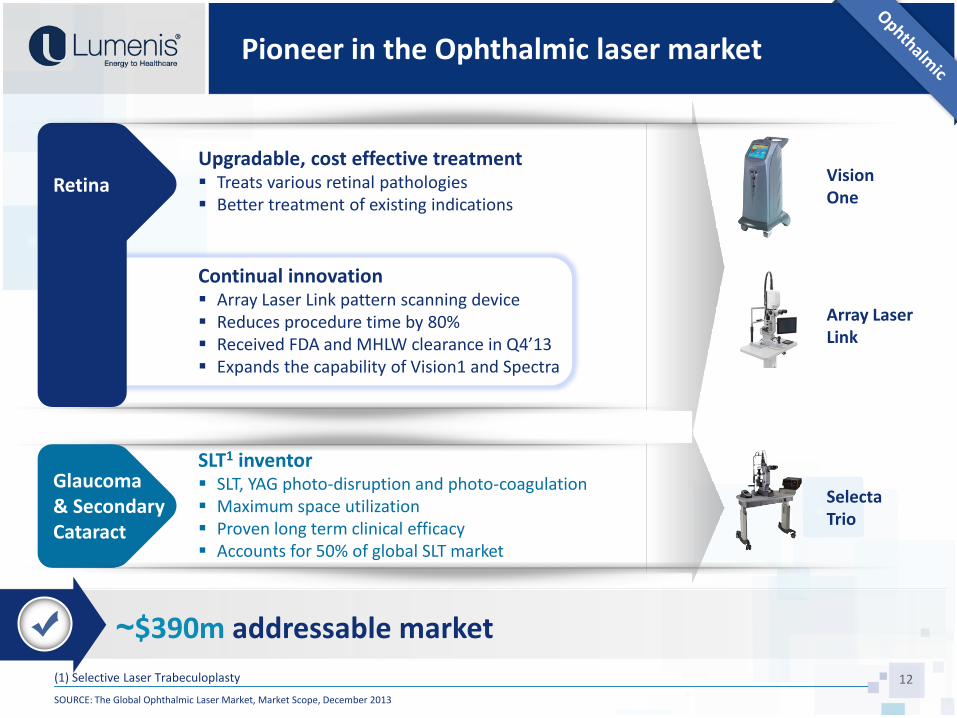
Pioneer in the Ophthalmic laser market
12
~$390m addressable market
Retina
Upgradable, cost effective treatment Treats various retinal pathologies Better treatment of existing indications
Vision One
Array Laser Link
Glaucoma& Secondary Cataract
SLT1 inventor SLT, YAG photo-disruption and photo-coagulation Maximum space utilization Proven long term clinical efficacy Accounts for 50% of global SLT market
Selecta Trio
Continual innovation Array Laser Link pattern scanning device Reduces procedure time by 80% Received FDA and MHLW clearance in Q4’13 Expands the capability of Vision1 and Spectra
(1) Selective Laser Trabeculoplasty
SOURCE: The Global Ophthalmic Laser Market, Market Scope, December 2013

Innovation as key growth driver
2008 2009 20142010 2011 2012 2013
AcuPulse DUO
ResurFX LightSheer Desire
LightSheer Infinity
Pulse 120H
Scanning Laser Link
VisionOne
M22
AcuPulse VP20
LightSheer Duet
Innovation is a significant driver of our company growth
Me
dic
al
Product releases 2007-2014 New products1 generated over 20% of product revenues in Q1’15
Ae
sth
eti
c
(1) Products launched in the past 2 years
2007
13
Financial review

New management
Realigned organization
Revitalized R&D processes and pipeline
Culture of accountability and success
Focus on execution
15
Continued strong growth
265
Q3
245
Q1
277
271
Q4 Q2Q1Q4
247
Q2
249
292290
Q3
284
Q3 Q4
257
Q1
251
245
261
Q2 Q1
6.7%
2.4%
4.7%
5.3%
0.7%
2012 LTM 2013 LTM
7.9%
2014 LTM
8.0%
$m
8.8%
9.2%7.9%
2015 LTM
X LTM Growth, YoY
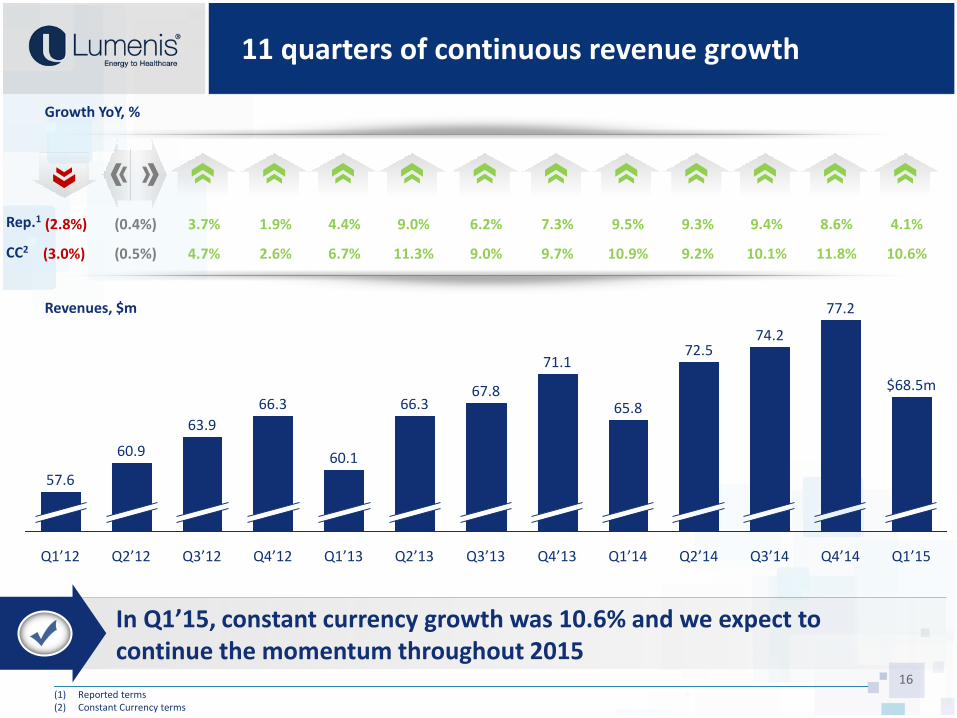
In Q1’15, constant currency growth was 10.6% and we expect to continue the momentum throughout 2015
11 quarters of continuous revenue growth
16
3.7%(0.4%)
72.5
Q1’15Q3’14
$68.5m
77.2
Q4’14
74.2
Q2’14Q4’12
66.367.8
Q1’14Q4’13
63.9
Q3’13Q1’12 Q2’12
60.1
66.3
Q3’12
57.6
71.1
Q2’13
60.9
65.8
Q1’13
(2.8%) 1.9% 4.4% 9.0% 6.2% 7.3% 9.5%
Revenues, $m
9.3% 9.4% 8.6% 4.1%
4.7%(0.5%)(3.0%) 2.6% 6.7% 11.3% 9.0% 9.7% 10.9% 9.2% 10.1% 11.8% 10.6%
Rep.1
CC2
Growth YoY, %
(1) Reported terms(2) Constant Currency terms
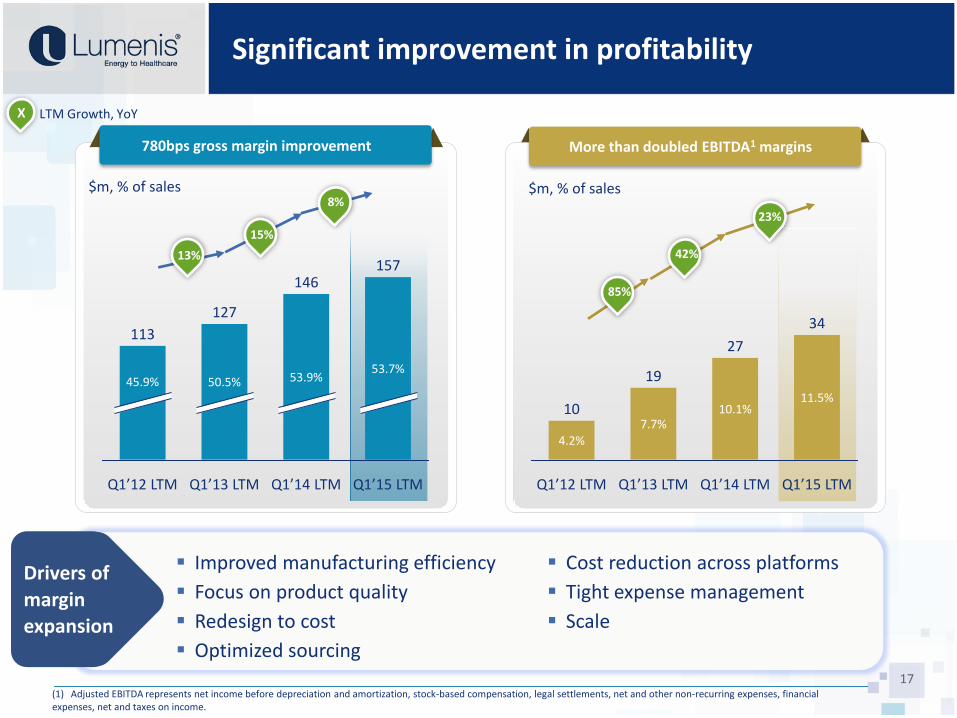
Significant improvement in profitability
17(1) Adjusted EBITDA represents net income before depreciation and amortization, stock-based compensation, legal settlements, net and other non-recurring expenses, financial expenses, net and taxes on income.
780bps gross margin improvement More than doubled EBITDA1 margins
8%
15%
23%
42%
$m, % of sales $m, % of sales
Q1’14 LTM
157
Q1’13 LTM
53.7%50.5%
Q1’12 LTM
53.9%
Q1’15 LTM
127
113
146
45.9%11.5%
19
10
Q1’15 LTMQ1’12 LTM
4.2%
Q1’14 LTM
10.1%7.7%
Q1’13 LTM
27
34
13%
85%
Cost reduction across platforms
Tight expense management
Scale
Improved manufacturing efficiency
Focus on product quality
Redesign to cost
Optimized sourcing
Drivers of
margin expansion
X LTM Growth, YoY
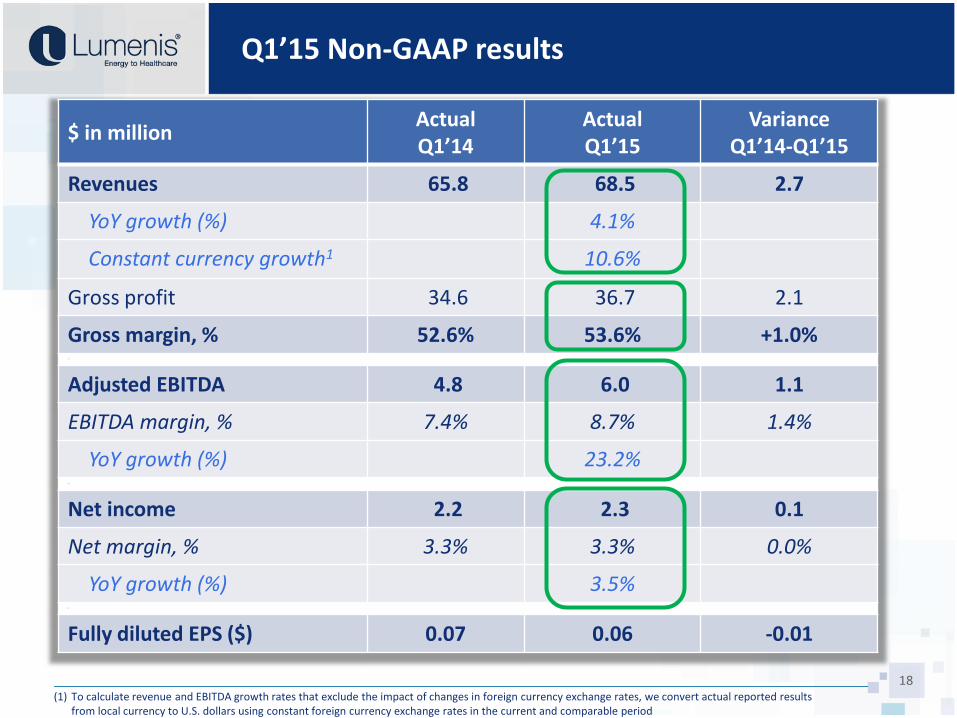
Q1’15 Non-GAAP results
18
$ in millionActual Q1’14
Actual Q1’15
Variance Q1’14-Q1’15
Revenues 65.8 68.5 2.7
YoY growth (%) 4.1%
Constant currency growth1 10.6%
Gross profit 34.6 36.7 2.1
Gross margin, % 52.6% 53.6% +1.0%Ad
Adjusted EBITDA 4.8 6.0 1.1
EBITDA margin, % 7.4% 8.7% 1.4%
YoY growth (%) 23.2%Ad
Net income 2.2 2.3 0.1
Net margin, % 3.3% 3.3% 0.0%
YoY growth (%) 3.5%ad
Fully diluted EPS ($) 0.07 0.06 -0.01
(1) To calculate revenue and EBITDA growth rates that exclude the impact of changes in foreign currency exchange rates, we convert actual reported results from local currency to U.S. dollars using constant foreign currency exchange rates in the current and comparable period
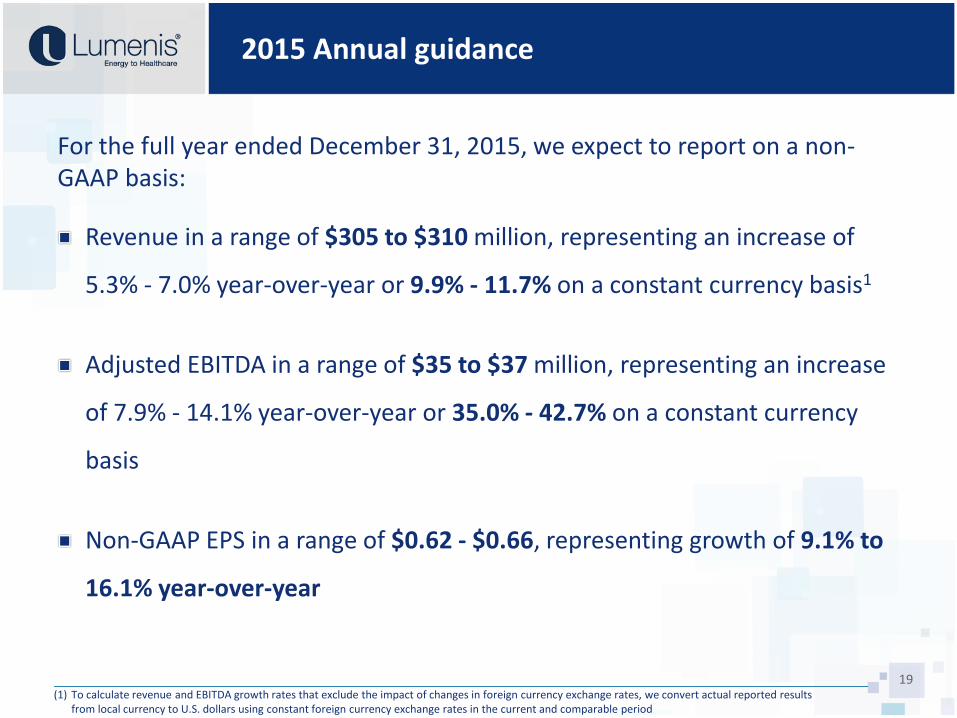
2015 Annual guidance
19
For the full year ended December 31, 2015, we expect to report on a non-GAAP basis:
Revenue in a range of $305 to $310 million, representing an increase of
5.3% - 7.0% year-over-year or 9.9% - 11.7% on a constant currency basis1
Adjusted EBITDA in a range of $35 to $37 million, representing an increase
of 7.9% - 14.1% year-over-year or 35.0% - 42.7% on a constant currency
basis
Non-GAAP EPS in a range of $0.62 - $0.66, representing growth of 9.1% to
16.1% year-over-year
(1) To calculate revenue and EBITDA growth rates that exclude the impact of changes in foreign currency exchange rates, we convert actual reported results from local currency to U.S. dollars using constant foreign currency exchange rates in the current and comparable period
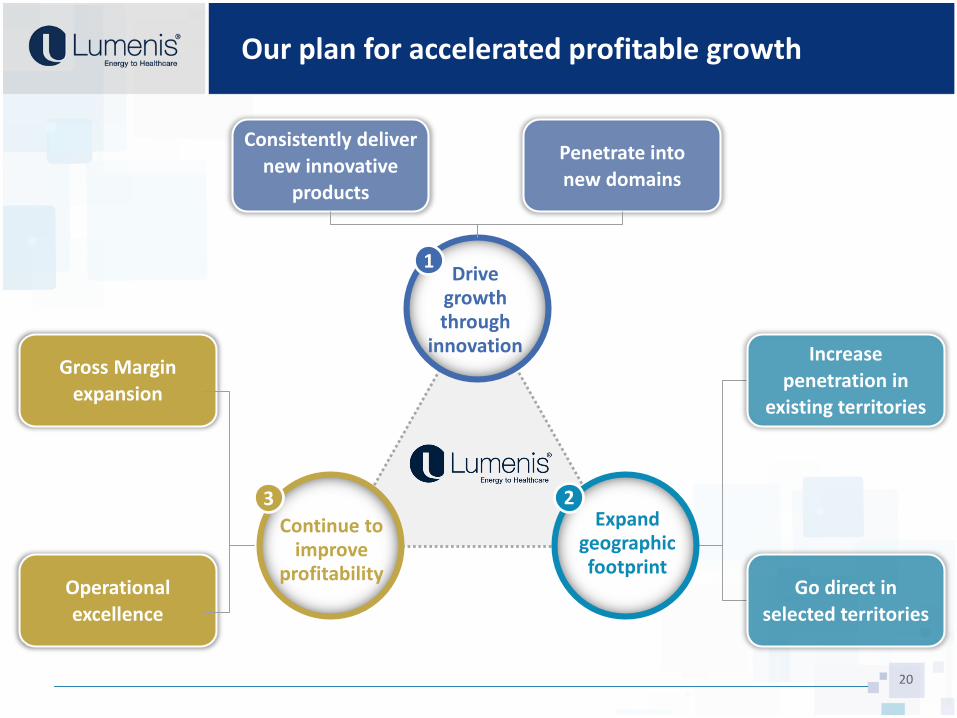
Increase
penetration in existing territories
Go direct in
selected territories
Consistently deliver
new innovative products
Penetrate into
new domains
Our plan for accelerated profitable growth
20
3
Continue to improve
profitability
2Expand
geographic footprint
1Drive
growth through
innovationGross Margin
expansion
Operational
excellence
21
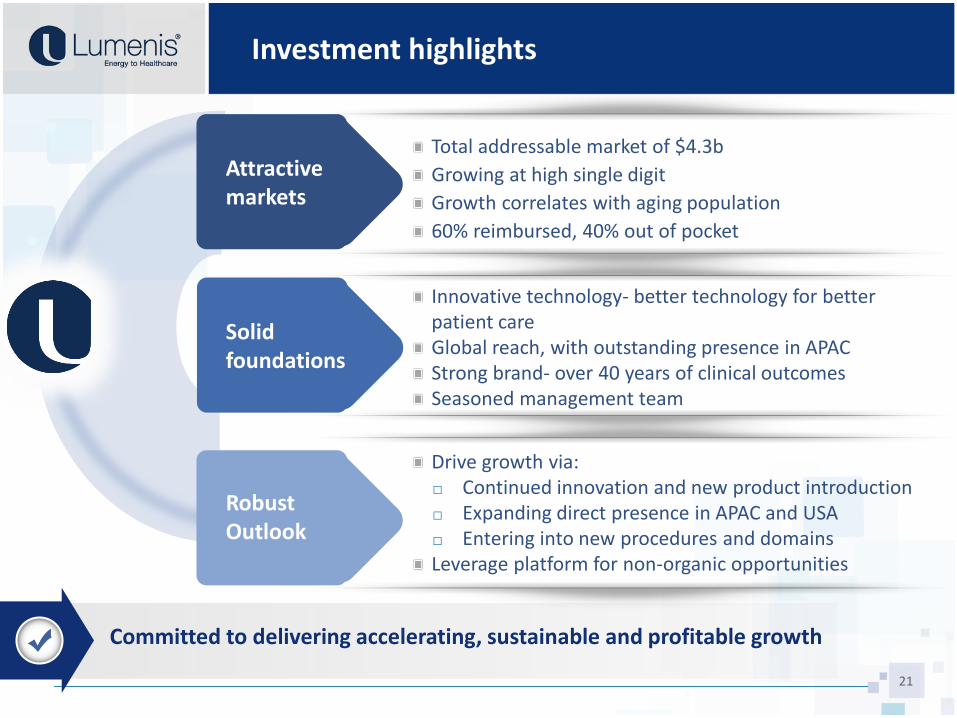
Investment highlights
Total addressable market of $4.3b
Growing at high single digit
Growth correlates with aging population
60% reimbursed, 40% out of pocket
Innovative technology- better technology for better patient careGlobal reach, with outstanding presence in APACStrong brand- over 40 years of clinical outcomesSeasoned management team
Drive growth via: □ Continued innovation and new product introduction□ Expanding direct presence in APAC and USA□ Entering into new procedures and domainsLeverage platform for non-organic opportunities
Robust Outlook
Solid foundations
Strong foundationAttractive markets
Committed to delivering accelerating, sustainable and profitable growth
Thank You
www.lumenis.com
APPENDIX
23
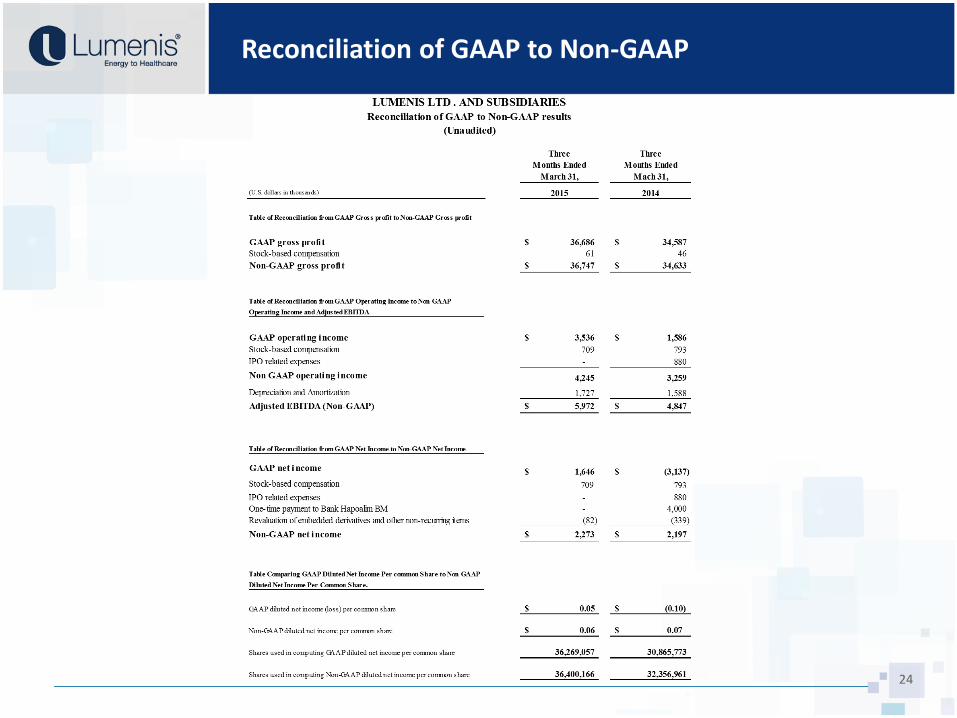
Reconciliation of GAAP to Non-GAAP
24
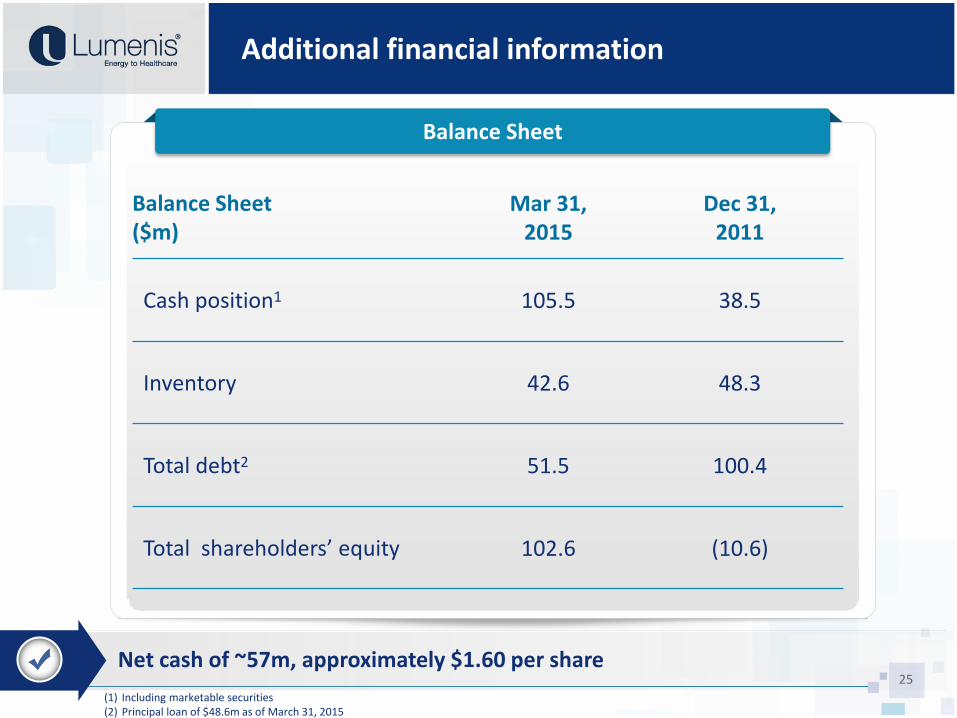
Additional financial information
25
Balance Sheet
Balance Sheet($m)
Mar 31, 2015
Dec 31, 2011
Cash position1 105.5 38.5
Inventory 42.6 48.3
Total debt2 51.5 100.4
Total shareholders’ equity 102.6 (10.6)
Net cash of ~57m, approximately $1.60 per share
(1) Including marketable securities(2) Principal loan of $48.6m as of March 31, 2015