Embed Size (px)
Citation preview

Domestic dominance
Regional leadership
Global ambitions
June 2017

At a Glance Strategy Competitive Position Performance Organisation Risk Management Outlook Appendix
2
Founded in 1964, Qatar Insurance Company (QIC) is the largest insurance powerhouse in the MENA region

QIC - KEY FACTS AND FIGURES – June 2017
3
Solid foundation
Strong financials
Five pillar strategy
Stable sources of income
Strong financial strength
High risk maturity
QIC steadily evolved from a domestic player to a regional leader on to global ambitions over 50 years
GWP: QAR 6.23 billion
Net profit: QAR 505 million
Direct insurance
Specialty insurance
Consistent underwriting performance over 50 years
Outstanding investment contribution
‘A’ (Excellent) AM Best financial strength rating
‘A’ / Stable outlook, Standard & Poor’s financial strength rating
Best in class Enterprise Risk Management practices
ROE: 12.3%
Market Capitalization: QAR 18.6 billion
Reinsurance Life and Medical Asset Management
At a Glance Strategy Competitive Position Performance Organisation Risk Management Outlook Appendix

At a Glance Strategy Competitive Position Performance Organisation Risk Management Outlook Appendix
52 YEARS OF OPERATIONAL EXCELLENCE
QIC established
Current Senior Management
appointed
KQIC (Kuwait) and OQIC (Oman) established
Qatar Re established
50th Anniversary and acquisition of
Antares
MENA: QIC No 1 of 116 companies Asia Pacific: QIC No 10 of 264 – excl. L&H World: QIC No 109 of 375 companies
En route to establishing a global footprint based on domestic dominance and regional leadership
4
1964 1968 1986 2002 2004 2006 2009 2011 2014
Q-Life & Medical established
Dubai branch established
Abu Dhabi branch established
QIC International established
QIC Europe Ltd established in
Malta
2015
Antares established Antares Asia in
Singapore
Qatar Re re-domiciled to Bermuda and
established branch in Dubai
Source: S&P CAPITAL IQ

At a Glance Strategy Competitive Position Performance Organisation Risk Management Outlook Appendix
SUSTAINED GROWTH FROM DIVERSIFIED SOURCES
17.1
18.4
18.1
14.7
12.3
8,541
14,545
15,139
20,449
18,691
Market Capitalization in QAR million
753
1,001
1,044
1,034
505
2016
2015
2014
2013
June 2016: Financial strength rating ‘A’ (strong), outlook stablewww.standardandpoors.com
Jan 2017: Financial strength rating of ‘A’ (excellent)www.ambest.com
Net profit (attributable to parent)
in QAR million
Return on Equityin %
Earnings per sharein QAR
5
3.12
4.15
4.84
4.48
1.89
QIC
DirectInsurance
Antares
Specialty Insurance
Qatar Life & Medical
Life & Medical
Qatar Re
Reinsurance
QIC Asset Management
Asset Management
QIC Real Estate
Real Estate
QIC Group: Well diversified multi-pillar business set-up
2017 H1
At a Glance Strategy Competitive Position Performance Organisation Risk Management Outlook Appendix
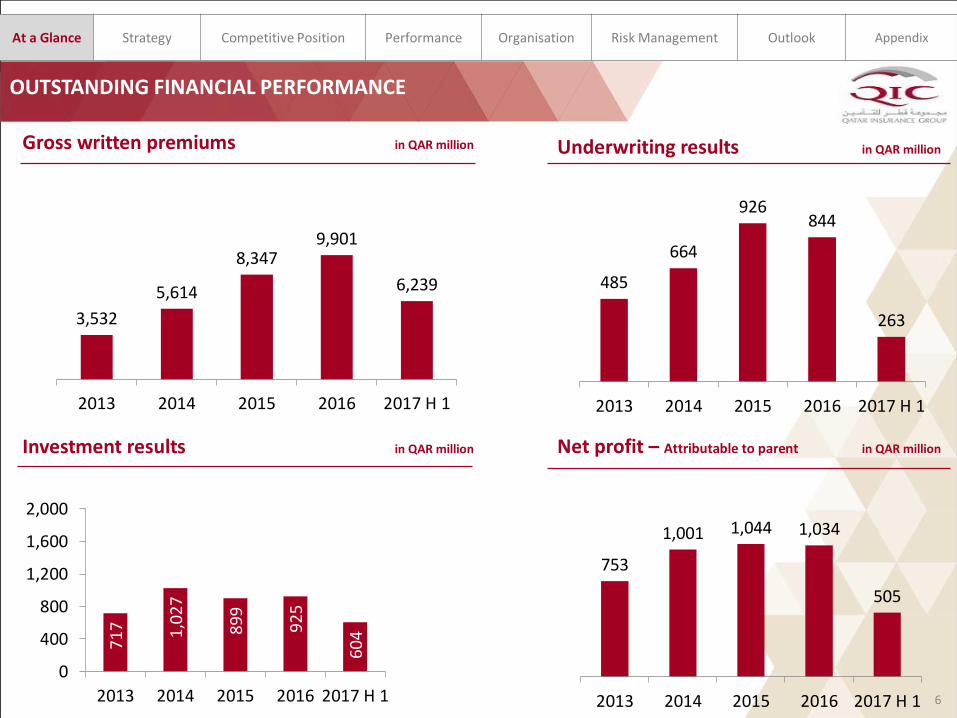
OUTSTANDING FINANCIAL PERFORMANCE7
17 1,02
7
89
9
92
5
60
4
0
400
800
1,200
1,600
2,000
2013 2014 2015 2016 2017 H 1
3,532
5,614
8,3479,901
6,239
2013 2014 2015 2016 2017 H 1
485
664
926844
263
2013 2014 2015 2016 2017 H 1
Investment results in QAR million
753
1,001 1,044 1,034
505
2013 2014 2015 2016 2017 H 1
Net profit – Attributable to parent in QAR million
Gross written premiums in QAR million Underwriting results in QAR million
6

At a Glance Strategy Competitive Position Performance Organisation Risk Management Outlook Appendix
Strategy
7

At a Glance Strategy Competitive Position Performance Organisation Risk Management Outlook Appendix
Bermuda London Zurich Malta Singapore
• Qatar Re US & NatCat
• Qatar Re HQ
• QIC Europe Ltd • Qatar Re Asia Branch
• Antares Asia
Doha Dubai
• QIC direct insurance operations (UAE)
• Qatar Re DIFC Branch
• QIC Group’s HQ and domestic operations
• QIC Capital
• Oman Qatar Insurance Company
8
Kuwait
• Kuwait Qatar Insurance Company
• QIC direct insurance operations (UAE)
EXPANDING GLOBALLY AND CONSOLIDATING REGIONAL LEADERSHIP
• Qatar Re Continental Europe and global operations
• Antares Group Holdings
• Antares Lloyds 1274 Syndicate
• Qatar Re Rep. Office
MuscatAbu Dhabi

At a Glance Strategy Competitive Position Performance Organisation Risk Management Outlook Appendix
QIC Domestic Reinsurance Specialty Life & Medical Asset Management
• Personal lines
o Motor
o Home
o Travel
o PAB
• Commercial lines
o Energy
o Marine & Aviation
o Medical
o Motor
o Property & Commercial
• Agriculture
• Credit & Surety
• Energy
• Engineering
• Facultative
• Marine & Aviation
• Motor
• Property
• Structured Finance
• Aviation
• Financial Institutions
• Marine
• Political and Financial Risk
• Professional indemnity
• Property Excess of Loss
• Terrorism
• Group Life
• Credit Life
• Mortgage Life
• Group Medical
• Proprietary asset management
• Third party asset management
• Collateralized reinsurance (CATCO)
BERMUDA
ZURICH
DOHA
SINGAPORE
LONDON
EXPERIENCED FOR THE FUTURE QATAR RE WORLDWIDE
LATEST NEWS PRODUCTS & SERVICES QATAR RE HUBS
QATAR RE
ANNOUNCES NEW
MANAGEMENT TEAM
Doha, Qatar – 13 May 2013
Lorem ipsum dolor sit amet consectetur
adipiscing elit videst empera de quae
aceribus volestibus adigendelita.
READ MORE READ MORE READ MORE
Qatar Re supports its clients with lead
quotations based on proprietary pricing
capabilities and superior underwriting skills.
Legals ©2014, Qatar Re. LLC
HOME QATAR RE HUBS
Doha
London
Zurich
ABOUT US
Introduction
Management
Corporate Strategy
Capitalization & Ratings
Risk Management
Regulatory Notice
The QIC Group
Careers
NEWS & MEDIAPRODUCTS
Agriculture
Credit & Survey
Energy
Engineering
Marine & Aviation
Motor XL
Property
CONTACT US
SEARCH JOINLOG IN
HOME ABOUT US PRODUCTS QATAR RE HUBS NEWS & MEDIA CONTACT US
“WE ARE COM M I TTED TO BUI LDI NG THE FI RST GLOBAL REI NSURANCE FRANCHI SE, BASED ON
EM ERGI NG M ARKET CAPITAL”
GUNTHER SAACKE
Chief Executive Of cer
BROAD SPECTRUM OF CAPABILITIES
9

At a Glance Strategy Competitive Position Performance Organisation Risk Management Outlook Appendix
Competitive Position
10

DOMINANT POSITION IN THE MENA REGION
At a Glance Strategy Competitive Position Performance Organisation Risk Management Outlook Appendix
Regional comparison (FY 2016) in QAR million
QIC consistently outperforms major regional insurance and reinsurance groups due to its focus on
Technical excellence in underwriting and asset management
Diversified growth across business segments and geographies11
28
,71
5
13,0
79
6,56
5
7,19
0
6,4
30
6,94
5
4,88
6
3,36
0
4,4
58
9,9
01
7,8
18
2,5
58
3,52
3
2,3
54
7,70
5
2,77
2
771 3,
100
1,03
4
777
300
80 203
612
156
-197
48
-5,000
0
5,000
10,000
15,000
20,000
25,000
30,000
35,000
QIC Tawuniya Orient Oman Ins. Co ADNIC Bupa Arabia Gulf Ins. Co Salama Med Gulf
Total Assets Gross premium Net profit attributable to parent

At a Glance Strategy Competitive Position Performance Organisation Risk Management Outlook Appendix
SIGNIFICANT POTENTIAL FOR GLOBAL AND REGIONAL GROWTH
QIC Domestic and regional o Dominant market share in Qatar and ahead
of its peers in MENAo Significant growth potential in rapidly
growing MENA insurance markets
QIC domestic/regional GWP
USD 804 million
MENA Life & Non-Life
USD 50 billion
Qatar Re o Ranked 35th amongst top 50 global reinsurers o Aspires to become a Top 10 reinsurer by 2025o Continues to expand geographically and by line
of business
USD 1.24 billion USD 6 billion
Qatar Re GWP GWP Top 10 reinsurer
Antareso Established as independent Managing
Agent at Lloyd’s, the world’s global insurance and reinsurance market of choice
o Ranks no. 32 within Lloyd’s by GWPo Synergies with QIC have potential to enhance growth
Antares GWP GWP Lloyd’s
USD 453 million USD 40 billion
QIC Group o Aspires to become a Top 50 international composite
insurance groupo Well diversified by geography, lines of business and
sectorso Ranked 109 worldwide by market cap
QIC Group GWP Global Non-Life GWP
USD 2.72 billion USD 1.4 trillion12
BERMUDA
ZURICH
DOHA
SINGAPORE
LONDON
EXPERIENCED FOR THE FUTURE QATAR RE WORLDWIDE
LATEST NEWS PRODUCTS & SERVICES QATAR RE HUBS
QATAR RE
ANNOUNCES NEW
MANAGEMENT TEAM
Doha, Qatar – 13 May 2013
Lorem ipsum dolor sit amet consectetur
adipiscing elit videst empera de quae
aceribus volestibus adigendelita.
READ MORE READ MORE READ MORE
Qatar Re supports its clients with lead
quotations based on proprietary pricing
capabilities and superior underwriting skills.
Legals ©2014, Qatar Re. LLC
HOME QATAR RE HUBS
Doha
London
Zurich
ABOUT US
Introduction
Management
Corporate Strategy
Capitalization & Ratings
Risk Management
Regulatory Notice
The QIC Group
Careers
NEWS & MEDIAPRODUCTS
Agriculture
Credit & Survey
Energy
Engineering
Marine & Aviation
Motor XL
Property
CONTACT US
SEARCH JOINLOG IN
HOME ABOUT US PRODUCTS QATAR RE HUBS NEWS & MEDIA CONTACT US
“WE ARE COM M I TTED TO BUI LDI NG THE FI RST GLOBAL REI NSURANCE FRANCHI SE, BASED ON
EM ERGI NG M ARKET CAPI TAL”
GUNTHER SAACKE
Chief Executive Of cer

At a Glance Strategy Competitive Position Performance Organisation Risk Management Outlook Appendix
Performance
13

At a Glance Strategy Competitive Position Performance Organisation Risk Management Outlook Appendix
STRONG TRACK RECORD OF TOP AND BOTTOM-LINE GROWTH..
254442
755
1,966
1,471
2012 2013 2014 2015 2016
Key Highlights (QAR million) 2013 2014 2015 2016 2017 H 1
Gross premium 3,532 5,614 8,347 9,901 6,239
Underwriting results 485 664 926 844 263
Net profit (attributable to parent) 753 1,001 1,044 1,034 505
Investment and other income 717 1,027 899 925 604
Earnings per share (restated) 3.12 4.15 4.84 4.48 1.89
Cash dividend per share 2.5 2.5 2.5 1.5 ---
Bonus share 25% 15% 10% 15% ---
Share price at 31 December 66.5 90.6 82 85 67
Operating Free Cash Flow growth in QAR million Total Assets in QAR million
CAGR 55%
11,633 16,332
23,673 28,715
32,629
2013 2014 2015 2016 2017 H1
CAGR 37%
14

At a Glance Strategy Competitive Position Performance Organisation Risk Management Outlook Appendix
…AND SHAREHOLDER VALUE CREATION
Dividends in QAR Return on Equity %
Market Value in QAR million
15
QIC shares outperformed QE Index and QE Insurance index
2.50 2.50 2.50 2.501.50
2.00 2.501.50 1.00
1.50
2012 2013 2014 2015 2016
Pay-out ratio
70%66% 85% 64% 62%
Dividend per share Bonus per share
8,541
14,545 15,139
20,449 18,691
5,187 5,705 5,8128,236 8,161
2013 2014 2015 2016 2017 H 1
Market Cap Book Value
17.5 17.1 18.4 18.114.7
12.4
2012 2013 2014 2015 2016 2017 H 1

At a Glance Strategy Competitive Position Performance Organisation Risk Management Outlook Appendix
CONSISTENT UNDERWRITING PERFORMANCE
CAGR 25%CAGR 40%
Combined ratio
Gross Premiums In QAR million Net Underwriting Results In QAR million
65%
65%
67%
69%
72%
11%
17%
17%
21%
22%
18%
16%
11%
8%
8%
2013 93%
2014 98%
2015 95%
2016 98%
2017 H 1 102%
Loss ratio Acquisition costExpense Ratio
93%
98%95%
98%
102%
2013 2014 2015 2016 2017 H1
Combined ratio16
2,5593,532
5,614
8,3479,901
2012 2013 2014 2015 2016
343484
664
926 844
2012 2013 2014 2015 2016

At a Glance Strategy Competitive Position Performance Organisation Risk Management Outlook Appendix
WELL DIVERSIFIED PORTFOLIO ENHANCES CAPITAL EFFICIENCY
Gross premiums, split by region 2017 H1 Gross premiums, split by line of business 2017 H1
17
Superior geographical and product diversification translates into high capital efficiency
QIC is the only MENA composite insurer with a sizeable international footprint: Qatar Re, Antares and QIC Europe account for 71% of QIC’s total GWP in 2017 H1
Motor business generates 37% of the total GWP
European and Asian business poised for particularly strong growth (based on newly established QIC Europe and Singapore offices of Qatar Re and Antares)
Domestic16%
Regional13%
International71%
Motor 37%
Health & Life14%
Property23%
Energy 5%
Agriculture2%
Marine & Aviation10%
Credit & Surety2%
Liability 5%

At a Glance Strategy Competitive Position Performance Organisation Risk Management Outlook Appendix
STRONG TECHNICAL PERFORMANCE IN A HIGHLY COMPETITIVE ENVIRONMENT
Marine and Aviation 2015 2016
Gross premium 943 1,171
Underwriting Results 140 118
Loss ratio 62% 65%
Operating profit 14.9% 10.1%
Property & Casualty 2015 2016
Gross premium 6,489 7,471
Underwriting Results 694 624
Loss ratio 65% 66%
Operating profit 10.7% 8.4%
Life & Medical 2015 2016
Gross premium 915 1,259
Underwriting Results 82 94
Loss ratio 79% 86%
Operating profit 9% 7%
24%
15% (10%)
(16%)
38%15%
in QAR million
in QAR million
in QAR million
18
Gross premium
2015 2016
Underwriting Results
2015 2016
Gross premium
2015 2016
Underwriting Results
2015 2016
Gross premium
2015 2016
Underwriting Results
2015 2016

At a Glance Strategy Competitive Position Performance Organisation Risk Management Outlook Appendix
STRONG INVESTMENT YIELD DESPITE LOW INTEREST RATE ENVIRONMENT
Investment portfolio composition 2017 H 1
Investment versus underwriting incomeInvested Assets versus investment income
19
8,28
3
9,56
7
11,4
24 15,4
11
17,4
66
717
1,02
7
899
925
604
-2,500
1,500
5,500
9,500
13,500
17,500
2013 2014 2015 2016 2017 HI
Invested Assets Investment income
in QAR million
40% 39% 46% 48%30%
60% 61% 54% 52%70%
2013 2014 2015 2016 2017 H 1
Underwriting income Investment income
Bonds 45%
Cash 39%
Equity 5%
Private Equity & Funds 8%
Real Estate 3%

At a Glance Strategy Competitive Position Performance Organisation Risk Management Outlook Appendix
FOCUS ON SECTOR BALANCE AND SECURITY OF INVESTMENTS
20
Equity: Industry exposure Equity: Currency exposure
Fixed income: Rating Fixed income: Mix by sectorFixed income: Geographic mix
51%
11%
11%
10%
5%
4%4% 3% 1% Financial
Utilities
Basic Materials
Industrial
Consumer, Cyclical
Energy
Communications
Consumer, Non-cyclical
Diversified
71%
24%
3% 2%
A- & Above BBB- to BBB+Not Rated Below BBB-
29%
27%18%
12%
10%
3% 1%
ME-ex Qatar Qatar
Europe North America
Asia Australia
Africa LATAM
54%
23%
9%
5%
4% 3% 2%
Financial GovernmentOthers UtilitiesCommunications Basic MaterialsEnergy Consumer Non-Cyclical
89%
4%
4%2% 1%
QAR
SAR
OMR
KWD
AED
USD

At a Glance Strategy Competitive Position Performance Organisation Risk Management Outlook Appendix
HEALTHY INCOME EMANATING FROM QIC ASSET MANAGEMENT
104.8 110.4123.1
51.3
4.7
2013 2014 2015 2016 2017 H 1
Advisory fee income in QAR million
1,19
0
1,67
8
1,80
9
1,75
4
859
717 1,
027
89
9
92
5
60
4
59.2% 61.2%
49.0%
52.0%
70%
0.0%
10.0%
20.0%
30.0%
40.0%
50.0%
60.0%
70.0%
0
600
1,200
1,800
2,400
2013 2014 2015 2016 2017 H1
Total income Investment income
Contribution of investment income in % and QAR million
21
QIC Asset Management consistently contributes about 70% to the Group’s total income
Third party asset management has become a growing and sizable source of income
Efficient treasury function managing the liquidity and balance sheet assets and liabilities
Function provides efficient asset and risk diversification to the Group’s balance sheet

At a Glance Strategy Competitive Position Performance Organisation Risk Management Outlook Appendix
EXCELLENT FINANCIAL STRENGTH RATIOS
% 2013 2014 2015 2016
Invested assets to total assets 71% 59% 62% 67%
Invested assets to net technical reserves 339% 188% 119% 139%
Cash and bank deposits to net technical reserves 137% 52% 37% 63%
2013 2014 2015 2016
Eligible Capital 5,688 6,071 7,217 8,066
Solvency Ratio 133% 121% 115% 134%
Solvency: Increased capital utilization, ratio remains strong
Assets
22
133%
121%
115%
134%
2013 2014 2015 2016
Solvency Ratio

At a Glance Strategy Competitive Position Performance Organisation Risk Management Outlook Appendix
STRONG FINANCIAL STRENGTH
2015 2016 2017 H 1
Share capital 1,846.21 2,411.39 2773.09
Legal reserve and Share Premium 1,514.14 3145.62 3250.47
General reserve 287.00 287.00 287.00
Catastrophe special reserve 277.34 329.53 381.23
Fair value reserve 139.20 110.87 (109.65)
Retained earnings 1,748.39 1,951.70 1579.60
Equity attributable to parent 5,812.28 8,236.11 8161.74
Non-controlling interest 181.79 232.11 243.14
Total equity 5,994.07 8,468.22 8404.88
Financial strength rating for QIC
QIC Group equity in QAR million
Rating: ‘A’ / StableOutlook: Stable
o “We view QIC as an increasingly diversified insurance group with relatively mature operations in the still-growing Gulf Cooperation Council region, and with rapidly expanding reinsurance operations in Europe.”
Rating: ‘A’/ (Excellent)Outlook: Stable
o “The ratings for Qatar Insurance Company S.A.Q. (QIC) reflect its very strong risk-adjusted capitalisation, robust underwriting performance and global business diversification.”
23

Organisation
At a Glance Strategy Competitive Position Performance Organisation Risk Management Outlook Appendix
24

STRONG GEOGRAPHIC AND SECTOR DIVERSIFICATION
At a Glance Strategy Competitive Position Performance Organisation Risk Management Outlook Appendix
25
BERMUDA
ZURICH
DOHA
SINGAPORE
LONDON
EXPERIENCED FOR THE FUTURE QATAR RE WORLDWIDE
LATEST NEWS PRODUCTS & SERVICES QATAR RE HUBS
QATAR RE
ANNOUNCES NEW
MANAGEMENT TEAM
Doha, Qatar – 13 May 2013
Lorem ipsum dolor sit amet consectetur
adipiscing elit videst empera de quae
aceribus volestibus adigendelita.
READ MORE READ MORE READ MORE
Qatar Re supports its clients with lead
quotations based on proprietary pricing
capabilities and superior underwriting skills.
Legals ©2014, Qatar Re. LLC
HOME QATAR RE HUBS
Doha
London
Zurich
ABOUT US
Introduction
Management
Corporate Strategy
Capitalization & Ratings
Risk Management
Regulatory Notice
The QIC Group
Careers
NEWS & MEDIAPRODUCTS
Agriculture
Credit & Survey
Energy
Engineering
Marine & Aviation
Motor XL
Property
CONTACT US
SEARCH JOINLOG IN
HOME ABOUT US PRODUCTS QATAR RE HUBS NEWS & MEDIA CONTACT US
“WE ARE COM M I TTED TO BUI LDI NG THE FI RST GLOBAL REI NSURANCE FRANCHI SE, BASED ON
EM ERGI NG M ARKET CAPITAL”
GUNTHER SAACKE
Chief Executive Of cer
Group level
Operations
Direct Insurance:
• Personal Lines• Commercial Lines
Qatar
GCC
Europe
Reinsurance:
• Property & Casualty
• Facultative Lines
Global
Specialty Re/insurance:
• Commercial Lines
Global
Life and Medical:
• Medical Lines
• Life Lines
Qatar
GCC
Asset management:
• Proprietary and TP asset management
Global
Sector
Geography

Risk Management
26
At a Glance Strategy Competitive Position Performance Organisation Risk Management Outlook Appendix

STRICT ADHERANCE TO CLEARLY DEFINED ERM PROCEDURES
27
At a Glance Strategy Competitive Position Performance Organisation Risk Management Outlook Appendix
1. Establishing Goals: Risk Appetite & Tolerance statement, Strategy & Business Plan for the year
2. Identifying Risks: Risk Registers
3. Analyzing Risks: Risk Score
4. Prioritizing Risks: Risk Prioritization Matrix
5. Risk Mitigation: Control Analysis 6.
Co
mm
un
ica
tin
g an
d C
on
sult
ing
Gro
up
Ris
k St
eeri
ng
Co
mm
itte
es,
En
tity
Bo
ard
, En
tity
R
isk
Co
mm
itte
e,
Au
dit
Ris
k C
om
mit
tee
7. M
on
ito
rin
g an
d R
evie
win
gO
ngo
ing
Pro
cess
o ERM is broken down into Risk Management, Capital Management and Exposure monitoring
o Governance structure follows the three lines of defence model with dedicated Risk Committees in each entity of the company
o Each entity committee reports into the group’s risk steering committee, which reports to the Group’s Board and Audit committee
o Risks are monitored and maintained according to risk categories such as insurance, market, credit, operational and group
o Each risk is assessed for impact and probability along with the controls in place to mitigate
o Risk are reviewed quarterly
o QIC has in place a full-blown stress and scenario testing framework
o QIC conducts analysis into emerging risks
o Risk appetite and tolerance set at the group and entity level with the position against these metrics monitored on an on-going basis
Risk Management at QIC Enterprise risk management cycle

Outlook
28
At a Glance Strategy Competitive Position Performance Organisation Risk Management Outlook Appendix

ASPIRING TO BECOME A GLOBAL TOP 50 COMPOSITE INSURER
29
At a Glance Strategy Competitive Position Performance Organisation Risk Management Outlook Appendix
Well-diversified business mix Balanced geographical mix Distinct sources of income
A portfolio of powerful franchises
Continue to capitalize on transactional opportunities
Grow QIC Europe
Expand into Asia / Pacific on the back of Qatar and Antares
Further grow medical and life lines in the domestic and regional market
Further build 3rd party investment capabilities
Continue to generate investment income above index and peers
QIC Europe Ltd: Become a common platform for QIC’s entrée into the European insurance markets
Use synergies with Qatar Re in reinsurance and Antares in specialty insurance
Qatar Re: Leverage acknowledged market and product expertise to expand on a global scale, broaden product offering
Antares: Capitalize on Lloyd’s expansion and leverage synergies with Qatar Re
BERMUDA
ZURICH
DOHA
SINGAPORE
LONDON
EXPERIENCED FOR THE FUTURE QATAR RE WORLDWIDE
LATEST NEWS PRODUCTS & SERVICES QATAR RE HUBS
QATAR RE
ANNOUNCES NEW
MANAGEMENT TEAM
Doha, Qatar – 13 May 2013
Lorem ipsum dolor sit amet consectetur
adipiscing elit videst empera de quae
aceribus volestibus adigendelita.
READ MORE READ MORE READ MORE
Qatar Re supports its clients with lead
quotations based on proprietary pricing
capabilities and superior underwriting skills.
Legals ©2014, Qatar Re. LLC
HOME QATAR RE HUBS
Doha
London
Zurich
ABOUT US
Introduction
Management
Corporate Strategy
Capitalization & Ratings
Risk Management
Regulatory Notice
The QIC Group
Careers
NEWS & MEDIAPRODUCTS
Agriculture
Credit & Survey
Energy
Engineering
Marine & Aviation
Motor XL
Property
CONTACT US
SEARCH JOINLOG IN
HOME ABOUT US PRODUCTS QATAR RE HUBS NEWS & MEDIA CONTACT US
“WE ARE COM M I TTED TO BUI LDI NG THE FI RST GLOBAL REI NSURANCE FRANCHI SE, BASED ON
EM ERGING M ARKET CAPI TAL”
GUNTHER SAACKE
Chief Executive Of cer
Domestic17%
Regional13%
International70%
Third party Asset Management 3%
Investments49%
Re/ Insurance
48%Motor38%
Health & Life 13%
Property13%
Energy 5%
Agriculture2%
Marine & Aviation 12%
Credit & Surety 9%
Liability8%

30
At a Glance Strategy Competitive Position Performance Organisation Risk Management Outlook Appendix

PROFIT AND LOSS ACCOUNT, 2013 – 2017 H 1
31
At a Glance Strategy Competitive Position Performance Organisation Risk Management Outlook Appendix
Income Statement (QAR ‘000) 2013 2014 2015 2016Growth ( YOY)
CAGR 2017 H 1
Gross Written Premium 3,531,707 5,613,767 8,347,210 9,901,394 19% 40% 6,239,181
Net earned premium 1,974,085 3,678,344 5,787,173 8,359,887 44% 54% 4,081,465
Net claims incurred (1,280,266) (2,394,403) (3,862,113) (5,761,487) 49% 54% (2,925,698)
Net commission (211,301) (620,093) (999,317) (1,754,717) 76% 92% (892,952)
Net underwriting income 482,518 663,848 925,743 843,683 -9% 25% 262,815
Investment and Other Income 719,622 1,027,488 898,596 924,851 3% 14% 604,210
G&A Expenses (423,783) (665,926) (760,350) (716,956) -6% 27% (347,690)
Net profit 778,357 1,025,410 1,063,989 1,051,578 -1% 14% 504,904
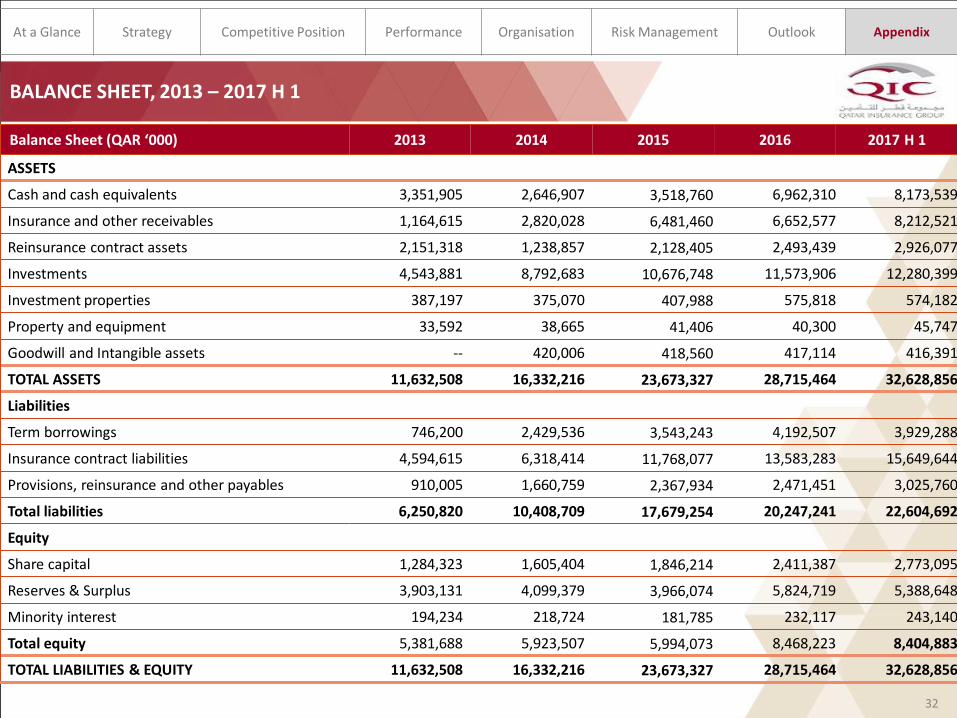
BALANCE SHEET, 2013 – 2017 H 1
32
At a Glance Strategy Competitive Position Performance Organisation Risk Management Outlook Appendix
Balance Sheet (QAR ‘000) 2013 2014 2015 2016 2017 H 1
ASSETS
Cash and cash equivalents 3,351,905 2,646,907 3,518,760 6,962,310 8,173,539
Insurance and other receivables 1,164,615 2,820,028 6,481,460 6,652,577 8,212,521
Reinsurance contract assets 2,151,318 1,238,857 2,128,405 2,493,439 2,926,077
Investments 4,543,881 8,792,683 10,676,748 11,573,906 12,280,399
Investment properties 387,197 375,070 407,988 575,818 574,182
Property and equipment 33,592 38,665 41,406 40,300 45,747
Goodwill and Intangible assets -- 420,006 418,560 417,114 416,391
TOTAL ASSETS 11,632,508 16,332,216 23,673,327 28,715,464 32,628,856
Liabilities
Term borrowings 746,200 2,429,536 3,543,243 4,192,507 3,929,288
Insurance contract liabilities 4,594,615 6,318,414 11,768,077 13,583,283 15,649,644
Provisions, reinsurance and other payables 910,005 1,660,759 2,367,934 2,471,451 3,025,760
Total liabilities 6,250,820 10,408,709 17,679,254 20,247,241 22,604,692
Equity
Share capital 1,284,323 1,605,404 1,846,214 2,411,387 2,773,095
Reserves & Surplus 3,903,131 4,099,379 3,966,074 5,824,719 5,388,648
Minority interest 194,234 218,724 181,785 232,117 243,140
Total equity 5,381,688 5,923,507 5,994,073 8,468,223 8,404,883
TOTAL LIABILITIES & EQUITY 11,632,508 16,332,216 23,673,327 28,715,464 32,628,856

QATAR: A THRIVING ECONOMY
33
At a Glance Strategy Competitive Position Performance Organisation Risk Management Outlook Appendix
125.
1
16
9.8
190.
3
201.
9
210.
1
174.
6
19.6%
13.4%
4.9%4.6% 4.0%
4.7%
2.00%
6.00%
10.00%
14.00%
18.00%
22.00%
0
50
100
150
200
250
2010 2011 2012 2013 2014 2015**
GDP Growth rate
GDP and real GDP growth in USD billion*
*Source: IMF 2015, ** Projections
Budget surplus 9.1% per annum over the past 5 years
Highest credit rating in the GCC S&P: AA; Fitch: AA;Moody’s: Aa2
Strong population growth Tripled since 2003, 2.6 million in 20162.8
million by 2020
World‘s highest GDP per capita USD 145,000 in 2014
Hydrocarbon vs. Non-hydrocarbon sectors in GDP*
Hydrocarbon reserves ≈ USD 25 trillion
World largest exporter of LNG 77 million tonnesper annum
Investments into infrastructure ≈ USD 150 billionby 2020
National Rail Project ≈ USD 40 billion
*Source: QNB Qatar Economic Insight, 2015
Strong fundamentals Diversifying the economy
125 170 190 202 210
53% 58% 57% 54% 51%
47% 42% 43% 46% 49%
2010 2011 2012 2013 2014

34
At a Glance Strategy Competitive Position Performance Organisation Risk Management Outlook Appendix
QATAR’S GROWING INSURANCE SECTOR
878
1,197
1,516
1,9942,200
2010 2011 2012 2013 2014
Total premiums in USD million*
*Source: Swiss Re SIGMA
Insurance Penetration 2015
Source: Swiss Re, Central Bank of Bahrain, EIU Country Data via BVDep
Insurance regulation
BahrainChina
Germany
India
Japan
KuwaitOman Qatar
KSAUAE
UK
USA
0%
2%
4%
6%
8%
10%
12%
1,000 10,000 100,000Pre
miu
ms
as %
of
GD
P
GDP per Capita (Log scale) in USD
Qatar Central Bank (QCB) is the single financial regulator for financial institutions in Qatar
QCB has responsibility for the design and implementation of policies relating to the regulation, control and supervision of financial services and financial markets in Qatar
QCB pursues a consistent risk-based micro-prudential framework in line with global regulatory standards
QIC International and QLM are regulated by the Qatar Financial Centre Regulatory Authority, which is in charge of the insurance sector regulation, reporting to the QCB
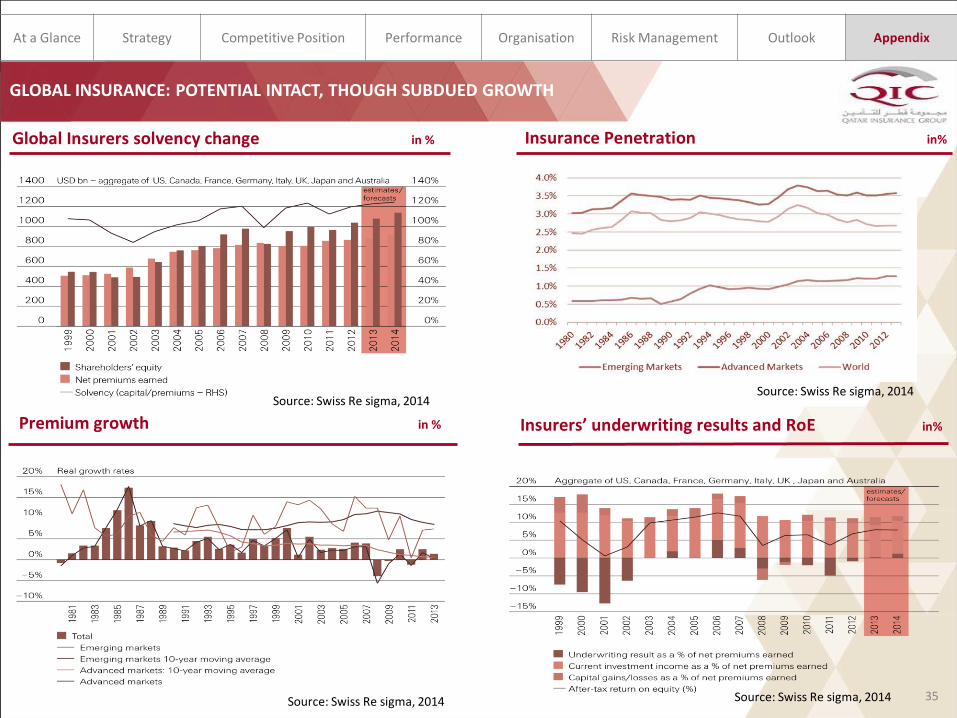
GLOBAL INSURANCE: POTENTIAL INTACT, THOUGH SUBDUED GROWTH
35
At a Glance Strategy Competitive Position Performance Organisation Risk Management Outlook Appendix
Global Insurers solvency change in % Insurance Penetration in%
Source: Swiss Re sigma, 2014 Source: Swiss Re sigma, 2014
Source: Swiss Re sigma, 2014 Source: Swiss Re sigma, 2014
Premium growth in % Insurers’ underwriting results and RoE in%

QIC MANAGEMENT TEAM
36
At a Glance Strategy Competitive Position Performance Organisation Risk Management Outlook Appendix
Khalifa A. Al SubaeyGroup President & CEO
Ali Saleh Al FadalaSr. Deputy Group President
& CEO
Sunil TalwarGroup CEO - InternationalAhmed El Tabbakh
SVP Group Finance and Advisor to the Group President & CEO
Salem Al-MannaiDeputy Group President & CEO-Mena Region
P.E. Alexander Advisor to the Group President & CEO
Varghese David Group Chief Financial Officer
Stephen RedmondManaging Director-Antares
Sandeep Nanda Group Chief Investment Officer
Gunther SaackeCEO - Qatar Re
Navin KumarCEO-OQIC
Andy RossCEO-QEL
Mark GrahamGroup Chief Risk Officer
Ilango T.COO-UAE Operations
Hassan H. Al JaidahCEO-KQIC

QIC BOARD OF DIRECTORS AND MAJOR SHAREHOLDERS
37
At a Glance Strategy Competitive Position Performance Organisation Risk Management Outlook Appendix
QIC shareholders in %
o Government of 13.92%Qatar
o Qatari Royal 13.71%Family and Associates
o Foreign 9.53%Institutional Investors
o Free Float Remainder
Sheikh Khalid bin Mohammed bin Ali Al-ThaniChairman & Managing Director
Abdullah bin Khalifa Al-AttiyaDeputy Chairman
Khalifa A. Al SubaeyGroup President & CEO
Hussain Ibrahim Al-FardanBoard Member
Jassim Mohammed Al-JaidahBoard Member
Sheikh Hamad bin Faisal bin Thani Al ThaniBoard Member
Sheikh Jassim bin Hamad bin Jassim bin Jabor Al ThaniBoard Member
Sheikh Faisal bin Thani bin Faisal Al-ThaniBoard Member
Sheikh Saoud bin Khalid bin Hamad Al ThaniBoard Member
Khalaf Ahmed Al-MannalBoard Member
The shareholders in its AGM held on 19th Feb 2017 appointed 2 additional directors :1. Sheikh Abdulrahman bin Saud bin Fahad Al Thani2. Ali Youssef Hussein Ali Kamal

THANK YOU
38