Embed Size (px)
Citation preview


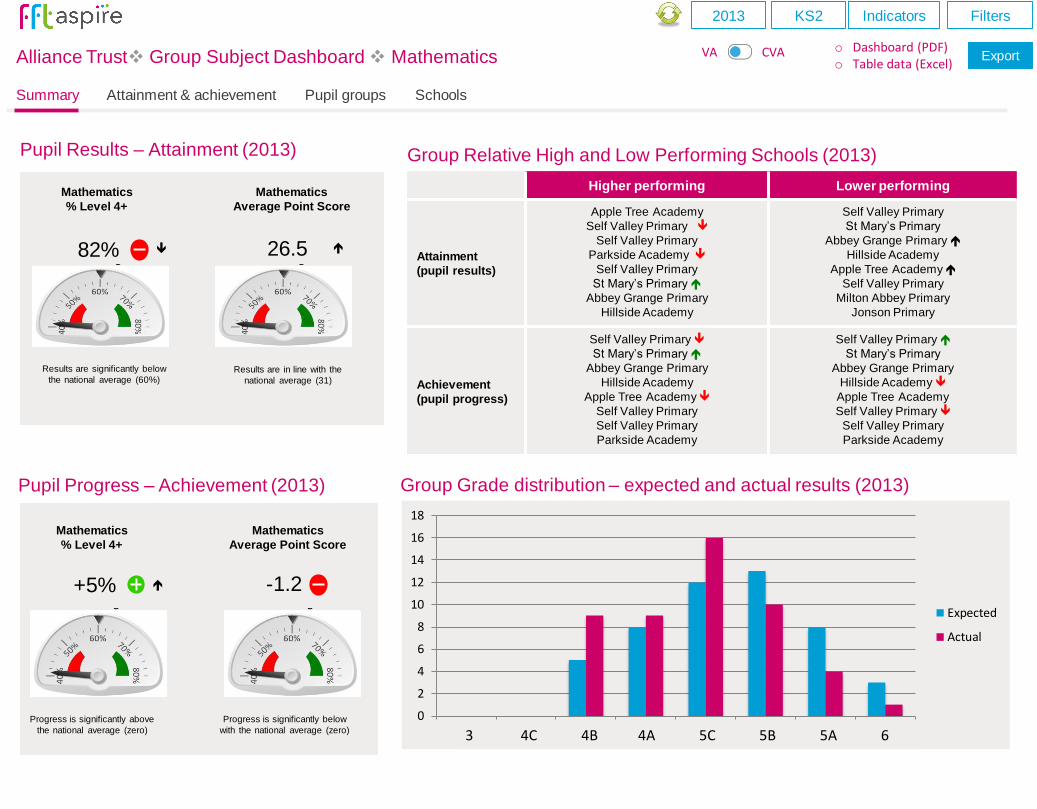
Pupil Results – Attainment (2013)
Pupil Progress – Achievement (2013)
% Level 4+
Reading Writing & Maths
Average Point Score
(Reading, Writing & Maths)
Progress is significantly above
the national average (zero)
Progress is significantly below
with the national average (zero)
% Level 4+
Reading Writing & Maths
Average Point Score
(Reading, Writing & Maths)
Results are significantly below
the national average (60%)Results are in line with the
national average (31)
82% 26.5
+5% -1.2
Dyson Perrins CofE Sports College (2013)2
Pupil Results - Attainment (2013)
Pupil Progress - Achievement (2013)
Relative Strengths and Weaknesses (3 years)
Key Stage 4 Performance Summary
Key Stage 4 Headline Performance
% 5+ A*-C incl Eng & Maths Average Point Score (best 8)
Actual Results Pupil Progress (Act vs Est)
2011 2012 2013 2011 2012 2013
Number of Pupils 150 159 153 - - -
% 5+ A*-C incl Eng & Maths 53% 57% 41% -9% -5% -18%
Average Point Score (best 8) 344 333 303 0 -19 -40
Average Grade (GCSE only) C- C- D+ -0.3 -0.3 -0.5
% pupils achieving 5+ A*-A 10% 10% 5% -5% -6% -7%
% 3 Levels Progress - English 71% 71% 49% -4% 0% -23%
% 3 Levels Progress - Maths 56% 58% 55% -12% -13% -17%
Stronger Areas Weaker Areas
Pupil Groups Middle ability
Not SEN
Not FSM (in last 6 yrs)
SEN School Action +
SEN Statement
FSM (in last 6 yrs)
Subjects Art & Design
D&T Food Technology
D&T Textiles Technology
D&T Electronic Products
Religious Studies
Psychology
% 5+ A*-C incl Eng & Maths
41%Results are significantly below the
national average (60%)
Average Point Score (best 8)
303Results are significantly below the
national average (339)
% 5+ A*-C incl Eng & Maths
-18%Progress is significantly below the
national average of zero
Average Point Score (best 8)
-40Progress is significantly below the
national average of zero
Summary Attainment & achievement Pupil groups Schools Subjects Pupil premium Schools Pupil Premium Group context
Alliance Trust Self Evaluation: Group Dashboard
2013 KS2 Indicators
o Dashboard (PDF)o Table data (Excel)
ExportVA CVA
Filters
Stronger Weaker
Attainment
(pupil results)
Higher ability
First Language not English
Not Pupil Premium (FSM)
Indian
Pupil Premium (FSM)
SEN School Action +
Lower ability
White other
Achievement
(pupil progress)
Higher ability
First Language not English
Not Pupil Premium (FSM)
Indian
Pupil Premium (FSM)
SEN School Action +
Lower ability
White other
Group Relative Strengths and Weaknesses (2013)
Relative High and Low Performing Schools (2013)
Higher performing Lower performing
Attainment
(pupil results)
Apple Tree Academy
Self Valley Primary
Self Valley Primary
Parkside Academy
Self Valley Primary
St Mary’s Primary
Abbey Grange Primary
Hillside Academy
Parkside Academy
Self Valley Primary
Self Valley Primary
St Mary’s Primary
Abbey Grange Primary
Hillside Academy
Apple Tree Academy
Self Valley Primary
Self Valley Primary
Parkside Academy
Parkside Academy
Self Valley Primary
Achievement
(pupil progress)
Self Valley Primary
St Mary’s Primary
Abbey Grange Primary
Hillside Academy
Apple Tree Academy
Self Valley Primary
Self Valley Primary
Parkside Academy
Parkside Academy
Self Valley Primary
Self Valley Primary
St Mary’s Primary
Abbey Grange Primary
Hillside Academy
Apple Tree Academy
Self Valley Primary
Self Valley Primary
Parkside Academy
Parkside Academy
Self Valley Primary

Group Key Stage 2 Performance Summary
Actual ResultsPupil Progress
(Act vs Est)
2012 2013 2014 2012 2013 2014
Number of Pupils (% match) 59 58 61 95% 95% 95%
% Level 4+ (Re, Wr, Ma) 53% 57% 62% +9% -2%
4%
% Level 4B+ (Re, Wr, Ma) 53% 57% 62% -9% -2% 4%
% Level 5+ (Re, Wr, Ma) 53% 57% 62% -9% -2% 4%
Average Point Score (Re, Wr,
Ma)10% 10% 15% -5% -4% 1%
Reading: % 2 Levels Progress 71% 71% 78% -2% -2% 1%
Reading: % 3 Levels Progress 26% 28% 34% -8% -9% -1%
Writing: % 2 Levels Progress 71% 71% 78% -2% 1% 1%
Writing: % 3 Levels Progress 26% 28% 34% -8% -9% -1%
Maths: % 2 Levels Progress 71% 71% 78% -2% -2% 1%
Maths: % 3 Levels Progress 26% 28% 34% -8% -9% -1%Group Pupil Progress – Achievement (2013)
FFT
Rank
High80 60 40 20Low
43- 1.2
Significantly above the
national average (zero)
Significantly below the
national average (zero)
Group Pupil results – Attainment (2013)
82%60% 70% 80%
National Average(all pupils)
Similar Schools(all pupils)
Your School
Significantly above the
national average (57%)
29.560% 65% 70% 75% 80%
National Average
Similar Schools
Your School
In line with the the national
average (342)
+ 6%
Average Point Score (Re, Wr, Ma)
% Level 4+ (Re, Wr, Ma)
45%
47%
49%
51%
53%
55%
57%
59%
61%
63%
65%
2010 2011 2012 2013 2014 290
300
310
320
330
340
350
2010 2011 2012 2013 2014
School
SimilarSchools
NationalAverage
Average Point Score (Re, Wr, Ma)% Level 4+ (Re, Wr, Ma)
Low 80 60 40 20 High
31FFT
Rank
Low 80 60 40 20 High
55FFT
Rank
Low 80 60 40 20 High
18FFT
Rank
Low 80 60 40 20 High
92FFT
Rank
% Level 4+ (Re, Wr, Ma)
Average Point Score (Re, Wr, Ma)
Summary Attainment & achievement Pupil groups Schools Subjects Pupil premium Schools Pupil Premium Group context
Alliance Trust Self Evaluation: Group Dashboard
2013 KS2 Indicators
o Dashboard (PDF)o Table data (Excel)
ExportVA CVA
Filters

Pupil group performance (2013)
` Actual Results Pupil Progress
Pupils
APS
(Re, Wr,
Ma)
% Level 4+
(Re, Wr,
Ma)
% Level 5+
(Re, Wr,
Ma)
APS
(Re, Wr,
Ma)
% Level 4+
(Re, Wr,
Ma)
% Level 5+
(Re, Wr,
Ma)
Summary
All Pupils 59 28.6 51% 51% 0.1 -3% +3%
Boys 31 27.3 45% 45% 0.2 +3% +3%
Girls * 28 27.5 54% 54% -0.3 +2% +2%
Prior
Attainment
Higher ability 45 28.6 90% 90% 0.4 +5% +5%
Middle ability 53 27.3 49% 49% 0.1 -1% -1%
Lower ability 43 27.5 9% 9% -0.2 -8% -8%
SEN
SEN School Action 23 28.6 25% 25% -0.5 -2% +3%
SEN Action + 10 27.3 12% 12% -1.0 +3% +3%
SEN Statement 6 27.5 11% 11% -0.2 +2% +2%
Not SEN 96 28.6 60% 60% 0.6 +3% +3%
Pupil
Premium
FSM (in last 6
years)45 27.5 18% 18% -0.2 -8% -8%
Not FSM 103 28.6 59% 59% 0.4 +5% +5%
Ethnicity
White 100 27.5 51% 51% 0.3 +3% +3%
Black Caribbean 10 28.6 42% 42% 0.3 -8% -8%
Black African 25 27.5 41% 41% 0.3 -5% +2%
Bangladeshi 12 28.6 64% 64% -0.4 +3% +3%
Other Asian 3 27.5 50% 50% 0.3 +3% +3%
Any other 5 28.6 32% 32% 0.3 +2% -2%
First
Language
Not English 34 27.5 52% 52% 0.3 +3% +3%
English 112 28.6 51% 51% 0.3 +3% +3%
Mobility Joined in Y10/11 15 28.5 52% 52% 0.3 +2% +2%-50 0 50
FSM (in last 6 years) (45)
SEN School Action + (10)
All Pupils (152)
Lower ability (43)
Boys (74)
White (100)
Girls (76)
Middle ability (53)
SEN Statement (6)
Not SEN (96)
Black Caribbean (10)
Joined school in Yr 10/11 (15)
Not FSM (in last 6 years) (103)
Black African (25)
First Language English (112)
SEN School Action (23)
First Language not English (34)
Other Asian (3)
Any other (5)
Higher ability (45)
Bangladeshi (12)
Achievement summary (2013)
Pupil ProgressAverage Point Score (Re, Wr, Ma)
Summary Attainment & achievement Pupil groups Schools Subjects Pupil premium Schools Pupil Premium Group context
Alliance Trust Self Evaluation: Group Dashboard
2013 KS2 Indicators
o Dashboard (PDF)o Table data (Excel)
ExportVA CVA
Filters

Pupil group performance by School (2013)
`Actual Results Pupil Progress
Pupils
APS
(Re, Wr,
Ma)
% Level 4+
(Re, Wr,
Ma)
% Level 5+
(Re, Wr,
Ma)
APS
(Re, Wr,
Ma)
% Level 4+
(Re, Wr,
Ma)
% Level 5+
(Re, Wr,
Ma)
Alliance Trust 59 28.6 51% 51% 0.1 -3% +3%
Self Valley Primary * 31 27.3 45% 45% 0.2 +3% +3%
Self Dale Primary 28 27.5 54% 54% -0.3 +2% +2%
Parkside Academy 45 28.6 90% 90% 0.4 +5% +5%
Self Valley Academy 53 27.3 49% 49% 0.1 -1% -1%
St Mary’s Primary 43 27.5 9% 9% -0.2 -8% -8%
Abbey Grange Primary 23 28.6 25% 25% -0.5 -2% +3%
Hillside Academy 10 27.3 12% 12% -1.0 +3% +3%
Apple Tree Academy 6 27.5 11% 11% -0.2 +2% +2%
Self Valley Primary 96 28.6 60% 60% 0.6 +3% +3%
Self Valley Primary 45 27.5 18% 18% -0.2 -8% -8%
Parkside Academy 103 28.6 59% 59% 0.4 +5% +5%
Self Valley Academy 100 27.5 51% 51% 0.3 +3% +3%
St Mary’s Primary 10 28.6 42% 42% 0.3 -8% -8%
Parkside Academy 25 27.5 41% 41% 0.3 -5% +2%
Self Valley Academy 12 28.6 64% 64% -0.4 +3% +3%
St Mary’s Primary 3 27.5 50% 50% 0.3 +3% +3%
Abbey Grange Primary 5 28.6 32% 32% 0.3 +2% -2% -50 0 50
FSM (in last 6 years) (45)
SEN School Action + (10)
All Pupils (152)
Lower ability (43)
Boys (74)
White (100)
Girls (76)
Middle ability (53)
SEN Statement (6)
Not SEN (96)
Black Caribbean (10)
Joined school in Yr 10/11 (15)
Not FSM (in last 6 years) (103)
Black African (25)
First Language English (112)
SEN School Action (23)
First Language not English (34)
Other Asian (3)
Any other (5)
Higher ability (45)
Bangladeshi (12)
Group Achievement summary (2013)
Pupil ProgressAverage Point Score (Re, Wr, Ma)
Summary Attainment & achievement Pupil groups Schools Subjects Pupil premium Schools Pupil Premium Group context
Alliance Trust Self Evaluation: Group Dashboard
2013 KS2 Indicators
o Dashboard (PDF)o Table data (Excel)
ExportVA CVA
Filters
Apple Tree Academy
Self Valley Primary
Self Valley Primary
Parkside Academy
Self Valley Academy
St Mary’s Primary
Abbey Grange Primary
Hillside Academy
Apple Tree Academy
Self Valley Primary
Self Valley Primary
Self Valley Primary
Parkside Academy
Self Valley Primary
Parkside Academy
Self Valley Academy
St Mary’s Primary
Apple Tree Academy
Self Valley Primary
Self Valley Primary
Parkside Academy

Key Stage 2 subject performance (2013)
Actual Results Pupil Progress
2011 2012 2013 2011 2012 2013
Pupils (% matched) 58 59 60 95% 96% 94%
Reading
% Level 4+ 75% 75% 75% 5% 5% 5%
% Level 4B+ 54% 54% 54% -4% -4% -4%
% Level 5+ 32% 32% 32% -8% -8% -8%
Average Point Score 28% 28% 28% -0.2 -0.2 -0.2
% 2 Levels Progress 80% 80% 80% -5% -5% +5%
% 3 Levels Progress 25% 25% 25% -4% -4% -4%
Writing
% Level 4+ 75% 75% 75% 5% 5% 5%
% Level 4B+ 54% 54% 54% -4% -4% -4%
% Level 5+ 32% 32% 32% -8% -8% -8%
Average Point Score 28% 28% 28% -0.2 -0.2 -0.2
% 2 Levels Progress 80% 80% 80% -5% -5% -5%
% 3 Levels Progress 25% 25% 25% -4% -4% -4%
Mathematics
% Level 4+ 75% 75% 75% 5% 5% 5%
% Level 4B+ 54% 54% 54% -4% -4% -4%
% Level 5+ 32% 32% 32% -8% -8% -8%
Average Point Score 28% 28% 28% -0.2 -0.2 -0.2
% 2 Levels Progress 80% 80% 80% -5% -5% -5%
% 3 Levels Progress 25% 25% 25% -4% -4% -4%
290
300
310
320
330
340
350
2010 2011 2012 2013 2014
SchoolSimilar SchoolsNational Average
290
300
310
320
330
340
350
2010 2011 2012 2013 2014
290
300
310
320
330
340
350
2010 2011 2012 2013 2014
Reading: Level 4+
Writing: Level 4+
Mathematics: Level 4+
Summary Attainment & achievement Pupil groups Schools Subjects Pupil premium Schools Pupil Premium Group context
Alliance Trust Self Evaluation: Group Dashboard
2013 KS2 Indicators
o Dashboard (PDF)o Table data (Excel)
ExportVA CVA
Filters

Pupil
Premium
Not Pupil
Premium
Actual Results Pupil Progress
APS (Re, Wr, Ma) APS (Re, Wr, Ma)
Pupil
Premium
Not Pupil
PremiumGap
Pupil
Premium
Not Pupil
PremiumGap
Summary
All Pupils 30 120 28.6 28.6 -0.5 0.1 0.1 0.3
Boys 16 60 27.3 27.3 -1.3 0.2 0.2 -0.4
Girls 14 60 27.5 27.5 -0.1 -0.3 -0.3 -0.1
Prior
Attainment
Boys - Higher Ability 4 23 28.6 28.6 -0.1 0.4 0.4 -0.6
Boys - Middle Ability 12 32 27.3 27.3 -1.1 0.1 0.1 0.3
Boys - Lower Ability * 32 34 27.5 27.5 -0.4 -0.2 -0.2 0
Girls - Higher Ability 15 23 28.6 28.6 -0.4 -0.5 -0.5 -0.3
Girls - Middle Ability 12 43 27.3 27.3 -0.3 -1 -1 -0.8
Girls - Lower Ability 4 23 27.5 27.5 -0.2 -0.2 -0.2 0
KS2 Level
Level 2 or below 3 5 28.6 28.6 -0.1 0.6 0.6 0.8
Level 3C 2 10 27.3 27.3 -1.1 -0.2 -0.2 0
Level 3B 21 15 27.5 27.5 -0.4 0.4 0.4 -0.6
Level 3A 3 12 28.6 28.6 -0.4 0.3 0.3 -0.5
Level 4C 12 12 27.3 27.3 +0.2 0.3 0.3 0.5
Level 4B 12 25 27.5 27.5 -0.2 0.3 0.3 -0.5
Level 4A 3 25 28.6 28.6 -0.1 0.3 0.3 0.5
Level 5 2 25 27.3 27.3 -1.1 0.3 0.3 -0.5
Level 6 1 10 27.5 27.5 -0.4 0.3 0.3 0.5
SEN
School Action 7 12 28.6 28.6 -0.1 0.3 0.3 0.5
School Action + 6 25 27.3 27.3 -1.1 0.3 0.3 0.5
Statement 3 6 27.5 27.5 -0.4 0.3 0.3 0.5
Not SEN 5 123 28.6 28.6 0 0.3 0.3 0.5
-1 -0.5 0 0.5
KS2 Level 3B
KS2 Level 4C
Boys - Lower Ability
KS2 Level 3C
School Action
Boys
School Action +
All Pupils
KS2 Level 3A
Girls
Girls - Lower Ability
Boys - Middle Ability
KS2 Level 2
KS2 Level 4B
Statement
Not SEN
Girls - Middle Ability
KS2 Level 4A
Boys - Higher Ability
KS2 Level 6
Girls - Higher Ability
KS2 Level 5
Pupil Progress Gap
APS (Re, Wr, Ma)
Pupil Premium Pupils (2013)Pupil Premium – Closing the Gap
Summary Attainment & achievement Pupil groups Schools Subjects Pupil premium Schools Pupil Premium Group context
Alliance Trust Self Evaluation: Group Dashboard
2013 KS2 Indicators
o Dashboard (PDF)o Table data (Excel)
ExportVA CVA
Filters

Summary Attainment & achievement Pupil groups Schools Subjects Pupil premium Schools Pupil Premium Group context
Alliance Trust Self Evaluation: Group Dashboard
2013 KS2 Indicators
o Dashboard (PDF)o Table data (Excel)
ExportVA CVA
Filters
Pupil
Premium
Not
Pupil
Premium
Actual ResultsAPS (Re, Wr, Ma)
Pupil ProgressAPS (Re, Wr, Ma)
SchoolPupil
Premium
Not Pupil
PremiumGap
Pupil
Premium
Not Pupil
PremiumGap
Alliance Trust 152 152 28.6 28.6 -0.1 0.4 0.1 0.3
Self Valley Primary 174 174 27.5 28.6 -0.1 0.6 -0.5 0.8
Milton Abbey Primary 176 176 28.6 27.3 -1.1 -0.2 -1 0
Parkside Academy 145 145 27.3 27.5 -0.4 0.4 -0.2 -0.6
Self Valley Academy 153 153 27.5 28.6 -0.4 0.3 0.6 -0.5
St Mary’s Primary 143 143 28.6 27.3 +0.2 0.3 -0.2 0.5
Abbey Grange Primary 123 123 27.3 27.5 -0.2 0.3 0.4 -0.5
Hillside Academy 110 110 27.5 28.6 -0.1 0.3 0.3 0.5
Apple Tree Academy 116 116 28.6 27.3 -1.1 0.3 0.3 -0.5
Self Valley Primary 196 196 27.3 27.5 -0.4 0.3 0.3 0.5
Milton Abbey Primary 145 145 27.5 28.6 -0.1 0.3 0.3 0.5
Parkside Academy 103 103 28.6 27.3 -1.1 0.3 0.3 0.5
Self Valley Academy 100 100 27.3 27.5 -0.4 0.3 0.3 0.5
St Mary’s Primary 110 110 27.5 28.6 0 0.3 0.3 0.5
-40 -20 0 20
APS (Re, Wr, Ma)
Apple Tree Academy
Self Valley Primary
Self Valley Primary
Parkside Academy
Self Valley Academy
St Mary’s Primary
Abbey Grange Primary
Hillside Academy
Apple Tree Academy
Self Valley Primary
Self Valley Primary
Self Valley Primary
Parkside Academy
Self Valley Primary
Parkside Academy
Self Valley Academy
St Mary’s Primary
Pupil Premium Gap (2013)Pupil Premium by School – Closing the Gap

Group Context: all pupils (Year 1 to Year 6) Group Absence: all pupils (Year 1 to Year 6)
Summary Attainment & achievement Pupil groups Schools Subjects Pupil premium Schools Pupil Premium Group context
Alliance Trust Self Evaluation: Group Dashboard
2013 KS2 Indicators
o Dashboard (PDF)o Table data (Excel)
ExportVA CVA
Filters
Pupil Results – Attainment (2013)
Pupil Progress – Achievement (2013)
Mathematics
% Level 4+
Mathematics
Average Point Score
Progress is significantly above
the national average (zero)
Progress is significantly below
with the national average (zero)
Mathematics
% Level 4+
Mathematics
Average Point Score
Results are significantly below
the national average (60%)Results are in line with the
national average (31)
82% 26.5
+5% -1.2
Dyson Perrins CofE Sports College (2013)2
Pupil Results - Attainment (2013)
Pupil Progress - Achievement (2013)
Relative Strengths and Weaknesses (3 years)
Key Stage 4 Performance Summary
Key Stage 4 Headline Performance
% 5+ A*-C incl Eng & Maths Average Point Score (best 8)
Actual Results Pupil Progress (Act vs Est)
2011 2012 2013 2011 2012 2013
Number of Pupils 150 159 153 - - -
% 5+ A*-C incl Eng & Maths 53% 57% 41% -9% -5% -18%
Average Point Score (best 8) 344 333 303 0 -19 -40
Average Grade (GCSE only) C- C- D+ -0.3 -0.3 -0.5
% pupils achieving 5+ A*-A 10% 10% 5% -5% -6% -7%
% 3 Levels Progress - English 71% 71% 49% -4% 0% -23%
% 3 Levels Progress - Maths 56% 58% 55% -12% -13% -17%
Stronger Areas Weaker Areas
Pupil Groups Middle ability
Not SEN
Not FSM (in last 6 yrs)
SEN School Action +
SEN Statement
FSM (in last 6 yrs)
Subjects Art & Design
D&T Food Technology
D&T Textiles Technology
D&T Electronic Products
Religious Studies
Psychology
% 5+ A*-C incl Eng & Maths
41%Results are significantly below the
national average (60%)
Average Point Score (best 8)
303Results are significantly below the
national average (339)
% 5+ A*-C incl Eng & Maths
-18%Progress is significantly below the
national average of zero
Average Point Score (best 8)
-40Progress is significantly below the
national average of zero
Dyson Perrins CofE Sports College (2013)2
Pupil Results - Attainment (2013)
Pupil Progress - Achievement (2013)
Relative Strengths and Weaknesses (3 years)
Key Stage 4 Performance Summary
Key Stage 4 Headline Performance
% 5+ A*-C incl Eng & Maths Average Point Score (best 8)
Actual Results Pupil Progress (Act vs Est)
2011 2012 2013 2011 2012 2013
Number of Pupils 150 159 153 - - -
% 5+ A*-C incl Eng & Maths 53% 57% 41% -9% -5% -18%
Average Point Score (best 8) 344 333 303 0 -19 -40
Average Grade (GCSE only) C- C- D+ -0.3 -0.3 -0.5
% pupils achieving 5+ A*-A 10% 10% 5% -5% -6% -7%
% 3 Levels Progress - English 71% 71% 49% -4% 0% -23%
% 3 Levels Progress - Maths 56% 58% 55% -12% -13% -17%
Stronger Areas Weaker Areas
Pupil Groups Middle ability
Not SEN
Not FSM (in last 6 yrs)
SEN School Action +
SEN Statement
FSM (in last 6 yrs)
Subjects Art & Design
D&T Food Technology
D&T Textiles Technology
D&T Electronic Products
Religious Studies
Psychology
% 5+ A*-C incl Eng & Maths
41%Results are significantly below the
national average (60%)
Average Point Score (best 8)
303Results are significantly below the
national average (339)
% 5+ A*-C incl Eng & Maths
-18%Progress is significantly below the
national average of zero
Average Point Score (best 8)
-40Progress is significantly below the
national average of zero
Dyson Perrins CofE Sports College (2013)2
Pupil Results - Attainment (2013)
Pupil Progress - Achievement (2013)
Relative Strengths and Weaknesses (3 years)
Key Stage 4 Performance Summary
Key Stage 4 Headline Performance
% 5+ A*-C incl Eng & Maths Average Point Score (best 8)
Actual Results Pupil Progress (Act vs Est)
2011 2012 2013 2011 2012 2013
Number of Pupils 150 159 153 - - -
% 5+ A*-C incl Eng & Maths 53% 57% 41% -9% -5% -18%
Average Point Score (best 8) 344 333 303 0 -19 -40
Average Grade (GCSE only) C- C- D+ -0.3 -0.3 -0.5
% pupils achieving 5+ A*-A 10% 10% 5% -5% -6% -7%
% 3 Levels Progress - English 71% 71% 49% -4% 0% -23%
% 3 Levels Progress - Maths 56% 58% 55% -12% -13% -17%
Stronger Areas Weaker Areas
Pupil Groups Middle ability
Not SEN
Not FSM (in last 6 yrs)
SEN School Action +
SEN Statement
FSM (in last 6 yrs)
Subjects Art & Design
D&T Food Technology
D&T Textiles Technology
D&T Electronic Products
Religious Studies
Psychology
% 5+ A*-C incl Eng & Maths
41%Results are significantly below the
national average (60%)
Average Point Score (best 8)
303Results are significantly below the
national average (339)
% 5+ A*-C incl Eng & Maths
-18%Progress is significantly below the
national average of zero
Average Point Score (best 8)
-40Progress is significantly below the
national average of zero
Dyson Perrins CofE Sports College (2013)2
Pupil Results - Attainment (2013)
Pupil Progress - Achievement (2013)
Relative Strengths and Weaknesses (3 years)
Key Stage 4 Performance Summary
Key Stage 4 Headline Performance
% 5+ A*-C incl Eng & Maths Average Point Score (best 8)
Actual Results Pupil Progress (Act vs Est)
2011 2012 2013 2011 2012 2013
Number of Pupils 150 159 153 - - -
% 5+ A*-C incl Eng & Maths 53% 57% 41% -9% -5% -18%
Average Point Score (best 8) 344 333 303 0 -19 -40
Average Grade (GCSE only) C- C- D+ -0.3 -0.3 -0.5
% pupils achieving 5+ A*-A 10% 10% 5% -5% -6% -7%
% 3 Levels Progress - English 71% 71% 49% -4% 0% -23%
% 3 Levels Progress - Maths 56% 58% 55% -12% -13% -17%
Stronger Areas Weaker Areas
Pupil Groups Middle ability
Not SEN
Not FSM (in last 6 yrs)
SEN School Action +
SEN Statement
FSM (in last 6 yrs)
Subjects Art & Design
D&T Food Technology
D&T Textiles Technology
D&T Electronic Products
Religious Studies
Psychology
% 5+ A*-C incl Eng & Maths
41%Results are significantly below the
national average (60%)
Average Point Score (best 8)
303Results are significantly below the
national average (339)
% 5+ A*-C incl Eng & Maths
-18%Progress is significantly below the
national average of zero
Average Point Score (best 8)
-40Progress is significantly below the
national average of zero
Summary Attainment & achievement Pupil groups Schools
Alliance Trust Group Subject Dashboard Mathematics
2013 KS2 Indicators
o Dashboard (PDF)o Table data (Excel)
ExportVA CVA
Filters
0
2
4
6
8
10
12
14
16
18
G F E D C B A A*
Expected
Actual
Group Grade distribution – expected and actual results (2013)
Group Relative High and Low Performing Schools (2013)
Higher performing Lower performing
Attainment
(pupil results)
Apple Tree Academy
Self Valley Primary
Self Valley Primary
Parkside Academy
Self Valley Primary
St Mary’s Primary
Abbey Grange Primary
Hillside Academy
Self Valley Primary
St Mary’s Primary
Abbey Grange Primary
Hillside Academy
Apple Tree Academy
Self Valley Primary
Milton Abbey Primary
Jonson Primary
Achievement
(pupil progress)
Self Valley Primary
St Mary’s Primary
Abbey Grange Primary
Hillside Academy
Apple Tree Academy
Self Valley Primary
Self Valley Primary
Parkside Academy
Self Valley Primary
St Mary’s Primary
Abbey Grange Primary
Hillside Academy
Apple Tree Academy
Self Valley Primary
Self Valley Primary
Parkside Academy
3 4C 4B 4A 5C 5B 5A 6

Group Key Stage 2 Performance Summary
Actual ResultsPupil Progress
(Act vs Est)
2012 2013 2014 2012 2013 2014
Number of Pupils (% match) 59 58 61 95% 95% 95%
% Level 4+ (Maths) 53% 57% 62% -9% -2%
4%
% Level 4B+ (Maths) 53% 57% 62% -9% -2% 4%
% Level 5+ (Maths 53% 57% 62% -9% -2% 4%
Average Point Score (Maths) 10% 10% 15% -5% -4% 1%
Maths: % 2 Levels Progress 71% 71% 78% -2% -2% 1%
Maths: % 3 Levels Progress 26% 28% 34% -8% -9% -1%
Group Pupil Progress – Achievement (2013)
FFT
Rank
High80 60 40 20Low
43
- 1.2
Significantly above the
national average (zero)
Significantly below the
national average (zero)
Group Pupil results – Attainment (2013)
82%60% 70% 80%
National Average(all pupils)
Similar Schools(all pupils)
Your School
Significantly above the
national average (57%)
29.560% 65% 70% 75% 80%
National Average
Similar Schools
Your School
In line with the the national
average (342)
+ 6%
Average Point Score (Mathematics)
% Level 4+ (Mathematics)
45%
47%
49%
51%
53%
55%
57%
59%
61%
63%
65%
2010 2011 2012 2013 2014 290
300
310
320
330
340
350
2010 2011 2012 2013 2014
School
SimilarSchools
NationalAverage
Average Point Score (Maths)% Level 4+ (Maths)
Low 80 60 40 20 High
31FFT
Rank
Low 80 60 40 20 High
55FFT
Rank
Low 80 60 40 20 High
18FFT
Rank
Low 80 60 40 20 High
92FFT
Rank
% Level 4+ Mathematics
Average Point Score (Mathematics)
Summary Attainment & achievement Pupil groups Schools
Alliance Trust Group Subject Dashboard Mathematics
2013 KS2 Indicators
o Dashboard (PDF)o Table data (Excel)
ExportVA CVA
Filters

Pupil group performance: Mathematics (2013)
` Actual Results Pupil Progress
PupilsAPS
Maths
% Level 4+
Maths
% Level 5+
Maths
APS
Maths
% Level 4+
Maths
% Level 5+
Maths
Summary
All Pupils 59 28.6 51% 51% 0.1 -3% +3%
Boys 31 27.3 45% 45% 0.2 +3% +3%
Girls 28 27.5 54% 54% -0.3 +2% +2%
Prior
Attainment
Higher ability 45 28.6 90% 90% 0.4 +5% +5%
Middle ability 53 27.3 49% 49% 0.1 -1% -1%
Lower ability 43 27.5 9% 9% -0.2 -8% -8%
SEN
SEN School Action 23 28.6 25% 25% -0.5 -3% +3%
SEN Action + 10 27.3 12% 12% -1.0 +3% +3%
SEN Statement 6 27.5 11% 11% -0.2 +2% +2%
Not SEN 96 28.6 60% 60% 0.6 +3% +3%
Pupil
Premium
FSM (in last 6
years)45 27.5 18% 18% -0.2 -8% -8%
Not FSM 103 28.6 59% 59% 0.4 +5% +5%
Ethnicity
White 100 27.5 51% 51% 0.3 +3% +3%
Black Caribbean 10 28.6 42% 42% 0.3 -8% -8%
Black African 25 27.5 41% 41% 0.3 +2% +2%
Bangladeshi 12 28.6 64% 64% -0.3 +3% +3%
Other Asian 3 27.5 50% 50% 0.3 +3% +3%
Any other 5 28.6 32% 32% 0.3 +2% -2%
First
Language
Not English 34 27.5 52% 52% 0.3 +3% +3%
English 112 28.6 51% 51% 0.3 +3% +3%
Mobility Joined in Y10/11 15 28.5 52% 52% 0.3 +2% +2%-50 0 50
FSM (in last 6 years) (45)
SEN School Action + (10)
All Pupils (152)
Lower ability (43)
Boys (74)
White (100)
Girls (76)
Middle ability (53)
SEN Statement (6)
Not SEN (96)
Black Caribbean (10)
Joined school in Yr 10/11 (15)
Not FSM (in last 6 years) (103)
Black African (25)
First Language English (112)
SEN School Action (23)
First Language not English (34)
Other Asian (3)
Any other (5)
Higher ability (45)
Bangladeshi (12)
Achievement summary (2013)
Pupil ProgressAverage Point Score (Maths)
Summary Attainment & achievement Pupil groups Schools
Alliance Trust Group Subject Dashboard Mathematics
2013 KS2 Indicators
o Dashboard (PDF)o Table data (Excel)
ExportVA CVA
Filters

Summary Attainment & achievement Pupil groups Schools
Alliance Trust Group Subject Dashboard Mathematics
2013 KS2 Indicators
o Dashboard (PDF)o Table data (Excel)
ExportVA CVA
Filters
School Performance Summary: Mathematics
Actual Results Pupil Progress
School Pupils APS
Maths
% Level 4+
Maths
% Level 5+
Maths
APS
Maths
% Level 4+
Maths
% Level 5+
Maths
Alliance Trust 152 28.6 51% 45% 0.1 -3% +3%
Self Valley Primary * 174 27.5 11% 60% -0.2 +2% +2%
Dale Primary 176 28.6 60% 18% 0.6 +3% +3%
Parkside Academy 145 27.5 18%
59% -0.2 -8% -8%
Self Valley Academy 153 28.6 59% 51% 0.4 +5% +5%
St Mary’s Primary 143 27.5 51% 42% 0.3 +3% +3%
Abbey Grange Primary 123 28.6 42% 41% 0.3 -8% -8%
Hillside Academy 110 27.5 41% 64% 0.3 +2% +2%
Apple Tree Academy 116 28.6 64%
50% -0.3 +3% +3%
Self Valley Primary 196 27.5 50% 32% 0.3 +3% +3%
Self Valley Primary 145 28.6 32% 52% 0.3 +2% -2%
Parkside Academy 103 27.5 52% 51% 0.3 +3% +3%
Self Valley Academy 100 28.6 51% 52% 0.3 +3% +3%
St Mary’s Primary 110 28.5 52% 54% +2% +2%
-40 -20 0 20
Group Achievement summary (2013)
APS (Mathematics)
Apple Tree Academy
Self Valley Primary
Self Valley Primary
Parkside Academy
Self Valley Academy
St Mary’s Primary
Abbey Grange Primary
Hillside Academy
Apple Tree Academy
Self Valley Primary
Self Valley Primary
Self Valley Primary
Parkside Academy
Self Valley Primary
Parkside Academy
Self Valley Academy
St Mary’s Primary


Pupil Results – Attainment (2013)
Pupil Progress – Achievement (2013)
Stronger Weaker
Attainment
(pupil results)
Higher ability
First Language not English
Not Pupil Premium (FSM)
Indian
Pupil Premium (FSM)
SEN School Action +
Lower ability
White other
Achievement
(pupil progress)
Higher ability
First Language not English
Not Pupil Premium (FSM)
Indian
Pupil Premium (FSM)
SEN School Action +
Lower ability
White other
Reading
(pupil progress)
Higher ability
Boys
Not SEN
Pupil Premium
Middle Ability
SEN School Action+
Writing
(pupil progress)
Middle ability
Boys
Indian
Pupil Premium (FSM)
Girls
SEN
Maths
(pupil progress)
Middle ability
Boys
Indian
Pupil Premium (FSM)
Girls
SEN
Relative Strengths and Weaknesses (2013)
% Level 4+
Reading Writing & Maths
Average Point Score
(Reading, Writing & Maths)
Progress is significantly above
the national average (zero)
Progress is significantly below
with the national average (zero)
% Level 4+
Reading Writing & Maths
Average Point Score
(Reading, Writing & Maths)
Results are significantly below
the national average (60%)Results are in line with the
national average (31)
Comparing your school to similar schools
This dashboard uses pupils’ prior attainment, gender and month of birth to analyse pupil progress
(value added). FFT’s Contextual Value Added (CVA) analyses compares the progress of your
pupils to similar pupils in similar schools. You can switch between Value Added and Contextual
Value Added at the top of this dashboard to see the differences for your school.
82% 26.5
+5% -1.2
Dyson Perrins CofE Sports College (2013)2
Pupil Results - Attainment (2013)
Pupil Progress - Achievement (2013)
Relative Strengths and Weaknesses (3 years)
Key Stage 4 Performance Summary
Key Stage 4 Headline Performance
% 5+ A*-C incl Eng & Maths Average Point Score (best 8)
Actual Results Pupil Progress (Act vs Est)
2011 2012 2013 2011 2012 2013
Number of Pupils 150 159 153 - - -
% 5+ A*-C incl Eng & Maths 53% 57% 41% -9% -5% -18%
Average Point Score (best 8) 344 333 303 0 -19 -40
Average Grade (GCSE only) C- C- D+ -0.3 -0.3 -0.5
% pupils achieving 5+ A*-A 10% 10% 5% -5% -6% -7%
% 3 Levels Progress - English 71% 71% 49% -4% 0% -23%
% 3 Levels Progress - Maths 56% 58% 55% -12% -13% -17%
Stronger Areas Weaker Areas
Pupil Groups Middle ability
Not SEN
Not FSM (in last 6 yrs)
SEN School Action +
SEN Statement
FSM (in last 6 yrs)
Subjects Art & Design
D&T Food Technology
D&T Textiles Technology
D&T Electronic Products
Religious Studies
Psychology
% 5+ A*-C incl Eng & Maths
41%Results are significantly below the
national average (60%)
Average Point Score (best 8)
303Results are significantly below the
national average (339)
% 5+ A*-C incl Eng & Maths
-18%Progress is significantly below the
national average of zero
Average Point Score (best 8)
-40Progress is significantly below the
national average of zero
Dyson Perrins CofE Sports College (2013)2
Pupil Results - Attainment (2013)
Pupil Progress - Achievement (2013)
Relative Strengths and Weaknesses (3 years)
Key Stage 4 Performance Summary
Key Stage 4 Headline Performance
% 5+ A*-C incl Eng & Maths Average Point Score (best 8)
Actual Results Pupil Progress (Act vs Est)
2011 2012 2013 2011 2012 2013
Number of Pupils 150 159 153 - - -
% 5+ A*-C incl Eng & Maths 53% 57% 41% -9% -5% -18%
Average Point Score (best 8) 344 333 303 0 -19 -40
Average Grade (GCSE only) C- C- D+ -0.3 -0.3 -0.5
% pupils achieving 5+ A*-A 10% 10% 5% -5% -6% -7%
% 3 Levels Progress - English 71% 71% 49% -4% 0% -23%
% 3 Levels Progress - Maths 56% 58% 55% -12% -13% -17%
Stronger Areas Weaker Areas
Pupil Groups Middle ability
Not SEN
Not FSM (in last 6 yrs)
SEN School Action +
SEN Statement
FSM (in last 6 yrs)
Subjects Art & Design
D&T Food Technology
D&T Textiles Technology
D&T Electronic Products
Religious Studies
Psychology
% 5+ A*-C incl Eng & Maths
41%Results are significantly below the
national average (60%)
Average Point Score (best 8)
303Results are significantly below the
national average (339)
% 5+ A*-C incl Eng & Maths
-18%Progress is significantly below the
national average of zero
Average Point Score (best 8)
-40Progress is significantly below the
national average of zero
Dyson Perrins CofE Sports College (2013)2
Pupil Results - Attainment (2013)
Pupil Progress - Achievement (2013)
Relative Strengths and Weaknesses (3 years)
Key Stage 4 Performance Summary
Key Stage 4 Headline Performance
% 5+ A*-C incl Eng & Maths Average Point Score (best 8)
Actual Results Pupil Progress (Act vs Est)
2011 2012 2013 2011 2012 2013
Number of Pupils 150 159 153 - - -
% 5+ A*-C incl Eng & Maths 53% 57% 41% -9% -5% -18%
Average Point Score (best 8) 344 333 303 0 -19 -40
Average Grade (GCSE only) C- C- D+ -0.3 -0.3 -0.5
% pupils achieving 5+ A*-A 10% 10% 5% -5% -6% -7%
% 3 Levels Progress - English 71% 71% 49% -4% 0% -23%
% 3 Levels Progress - Maths 56% 58% 55% -12% -13% -17%
Stronger Areas Weaker Areas
Pupil Groups Middle ability
Not SEN
Not FSM (in last 6 yrs)
SEN School Action +
SEN Statement
FSM (in last 6 yrs)
Subjects Art & Design
D&T Food Technology
D&T Textiles Technology
D&T Electronic Products
Religious Studies
Psychology
% 5+ A*-C incl Eng & Maths
41%Results are significantly below the
national average (60%)
Average Point Score (best 8)
303Results are significantly below the
national average (339)
% 5+ A*-C incl Eng & Maths
-18%Progress is significantly below the
national average of zero
Average Point Score (best 8)
-40Progress is significantly below the
national average of zero
Dyson Perrins CofE Sports College (2013)2
Pupil Results - Attainment (2013)
Pupil Progress - Achievement (2013)
Relative Strengths and Weaknesses (3 years)
Key Stage 4 Performance Summary
Key Stage 4 Headline Performance
% 5+ A*-C incl Eng & Maths Average Point Score (best 8)
Actual Results Pupil Progress (Act vs Est)
2011 2012 2013 2011 2012 2013
Number of Pupils 150 159 153 - - -
% 5+ A*-C incl Eng & Maths 53% 57% 41% -9% -5% -18%
Average Point Score (best 8) 344 333 303 0 -19 -40
Average Grade (GCSE only) C- C- D+ -0.3 -0.3 -0.5
% pupils achieving 5+ A*-A 10% 10% 5% -5% -6% -7%
% 3 Levels Progress - English 71% 71% 49% -4% 0% -23%
% 3 Levels Progress - Maths 56% 58% 55% -12% -13% -17%
Stronger Areas Weaker Areas
Pupil Groups Middle ability
Not SEN
Not FSM (in last 6 yrs)
SEN School Action +
SEN Statement
FSM (in last 6 yrs)
Subjects Art & Design
D&T Food Technology
D&T Textiles Technology
D&T Electronic Products
Religious Studies
Psychology
% 5+ A*-C incl Eng & Maths
41%Results are significantly below the
national average (60%)
Average Point Score (best 8)
303Results are significantly below the
national average (339)
% 5+ A*-C incl Eng & Maths
-18%Progress is significantly below the
national average of zero
Average Point Score (best 8)
-40Progress is significantly below the
national average of zero
Summary Attainment & achievement Pupil groups Subjects Pupil premium School context
Self Valley Primary Self Evaluation: School Dashboard
2013 KS2 Indicators
o Dashboard (PDF)o Table data (Excel)
ExportVA CVA
Filters

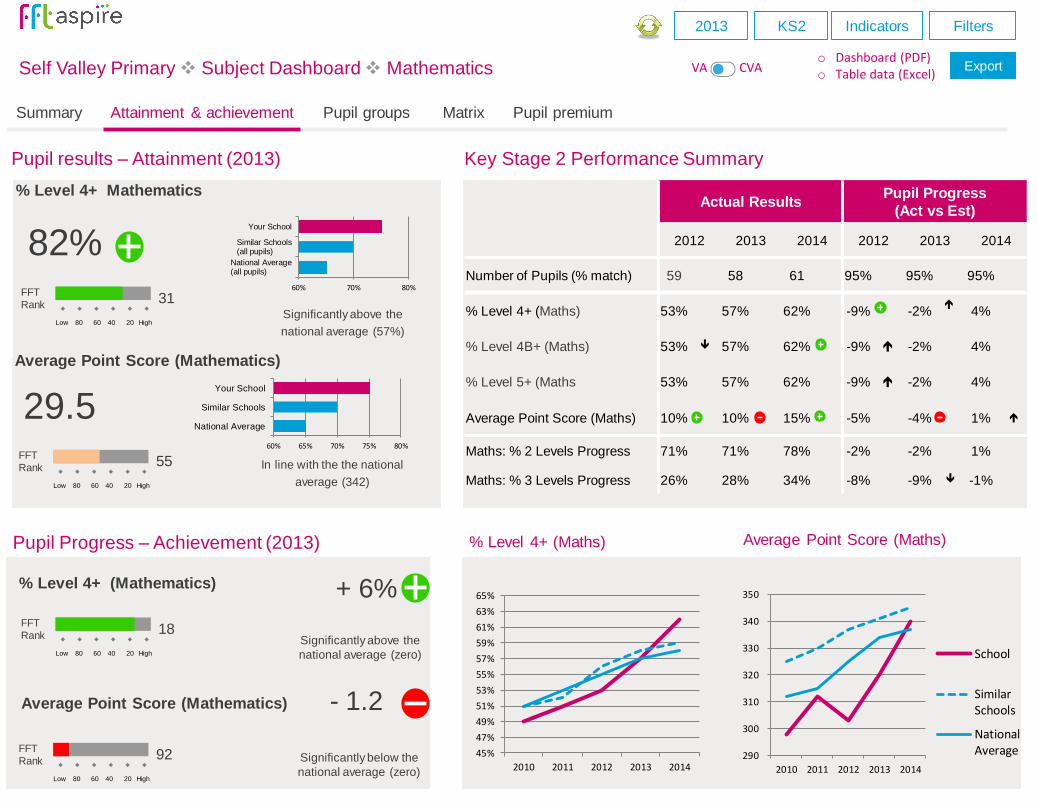
Key Stage 2 Performance Summary
Actual ResultsPupil Progress
(Act vs Est)
2012 2013 2014 2012 2013 2014
Number of Pupils (% match) 59 58 61 95% 95% 95%
% Level 4+ (Re, Wr, Ma) 53% 57% 62% +9% -2%
4%
% Level 4B+ (Re, Wr, Ma) 53% 57% 62% -9% -2% 4%
% Level 5+ (Re, Wr, Ma) 53% 57% 62% -9% -2% 4%
Average Point Score (Re, Wr,
Ma)10% 10% 15% -5% -4% 1%
Reading: % 2 Levels Progress 71% 71% 78% -2% -2% 1%
Reading: % 3 Levels Progress 26% 28% 34% -8% -9% -1%
Writing: % 2 Levels Progress 71% 71% 78% -2% 1% 1%
Writing: % 3 Levels Progress 26% 28% 34% -8% -9% -1%
Maths: % 2 Levels Progress 71% 71% 78% -2% -2% 1%
Maths: % 3 Levels Progress 26% 28% 34% -8% -9% -1%Pupil Progress – Achievement (2013)
FFT
Rank
High80 60 40 20Low
43- 1.2
Significantly above the
national average (zero)
Significantly below the
national average (zero)
Pupil results – Attainment (2013)
82%60% 70% 80%
National Average(all pupils)
Similar Schools(all pupils)
Your School
Significantly above the
national average (57%)
29.560% 65% 70% 75% 80%
National Average
Similar Schools
Your School
In line with the the national
average (342)
+ 6%
Average Point Score (Re, Wr, Ma)
% Level 4+ (Re, Wr, Ma)
45%
47%
49%
51%
53%
55%
57%
59%
61%
63%
65%
2010 2011 2012 2013 2014 290
300
310
320
330
340
350
2010 2011 2012 2013 2014
School
SimilarSchools
NationalAverage
Average Point Score (Re, Wr, Ma)% Level 4+ (Re, Wr, Ma)
Low 80 60 40 20 High
31FFT
Rank
Low 80 60 40 20 High
55FFT
Rank
Low 80 60 40 20 High
18FFT
Rank
Low 80 60 40 20 High
92FFT
Rank
% Level 4+ (Re, Wr, Ma)
Average Point Score (Re, Wr, Ma)
Summary Attainment & achievement Pupil groups Subjects Pupil premium School context
Self Valley Primary Self Evaluation: School Dashboard
2013 KS2 Indicators
o Dashboard (PDF)o Table data (Excel)
ExportVA CVA
Filters

Pupil group performance (2013)
` Actual Results Pupil Progress
Pupils
APS
(Re, Wr,
Ma)
% Level 4+
(Re, Wr,
Ma)
% Level 5+
(Re, Wr,
Ma)
APS
(Re, Wr,
Ma)
% Level 4+
(Re, Wr,
Ma)
% Level 5+
(Re, Wr,
Ma)
Summary
All Pupils 59 28.6 51% 51% 0.1 -3% +3%
Boys 31 27.3 45% 45% 0.2 +3% +3%
Girls 28 27.5 54% 54% -0.3 +2% +2%
Prior
Attainment
Higher ability 45 28.6 90% 90% 0.4 +5% +5%
Middle ability 53 27.3 49% 49% 0.1 -1% -1%
Lower ability 43 27.5 9% 9% -0.2 -8% -8%
SEN
SEN School Action 23 28.6 25% 25% -0.5 -2% +3%
SEN Action + 10 27.3 12% 12% -1.0 +3% +3%
SEN Statement 6 27.5 11% 11% -0.2 +2% +2%
Not SEN 96 28.6 60% 60% 0.6 +3% +3%
Pupil
Premium
FSM (in last 6
years)45 27.5 18% 18% -0.2 -8% -8%
Not FSM 103 28.6 59% 59% 0.4 +5% +5%
Ethnicity
White 100 27.5 51% 51% 0.3 +3% +3%
Black Caribbean 10 28.6 42% 42% 0.3 -8% -8%
Black African 25 27.5 41% 41% 0.3 -5% +2%
Bangladeshi 12 28.6 64% 64% -0.4 +3% +3%
Other Asian 3 27.5 50% 50% 0.3 +3% +3%
Any other 5 28.6 32% 32% 0.3 +2% -2%
First
Language
Not English 34 27.5 52% 52% 0.3 +3% +3%
English 112 28.6 51% 51% 0.3 +3% +3%
Mobility Joined in Y10/11 15 28.5 52% 52% 0.3 +2% +2%-50 0 50
FSM (in last 6 years) (45)
SEN School Action + (10)
All Pupils (152)
Lower ability (43)
Boys (74)
White (100)
Girls (76)
Middle ability (53)
SEN Statement (6)
Not SEN (96)
Black Caribbean (10)
Joined school in Yr 10/11 (15)
Not FSM (in last 6 years) (103)
Black African (25)
First Language English (112)
SEN School Action (23)
First Language not English (34)
Other Asian (3)
Any other (5)
Higher ability (45)
Bangladeshi (12)
Achievement summary (2013)
Pupil ProgressAverage Point Score (Re, Wr, Ma)
Summary Attainment & achievement Pupil groups Subjects Pupil premium School context
Self Valley Primary Self Evaluation: School Dashboard
2013 KS2 Indicators
o Dashboard (PDF)o Table data (Excel)
ExportVA CVA
Filters

Key Stage 2 subject performance (2013)
Actual Results Pupil Progress
2011 2012 2013 2011 2012 2013
Pupils (% matched) 58 59 60 95% 96% 94%
Reading
% Level 4+ 75% 75% 75% 5% 5% 5%
% Level 4B+ 54% 54% 54% -4% -4% -4%
% Level 5+ 32% 32% 32% -8% -8% -8%
Average Point Score 28% 28% 28% -0.2 -0.2 -0.2
% 2 Levels Progress 80% 80% 80% -5% -5% +5%
% 3 Levels Progress 25% 25% 25% -4% -4% -4%
Writing
% Level 4+ 75% 75% 75% 5% 5% 5%
% Level 4B+ 54% 54% 54% -4% -4% -4%
% Level 5+ 32% 32% 32% -8% -8% -8%
Average Point Score 28% 28% 28% -0.2 -0.2 -0.2
% 2 Levels Progress 80% 80% 80% -5% -5% -5%
% 3 Levels Progress 25% 25% 25% -4% -4% -4%
Mathematics
% Level 4+ 75% 75% 75% 5% 5% 5%
% Level 4B+ 54% 54% 54% -4% -4% -4%
% Level 5+ 32% 32% 32% -8% -8% -8%
Average Point Score 28% 28% 28% -0.2 -0.2 -0.2
% 2 Levels Progress 80% 80% 80% -5% -5% -5%
% 3 Levels Progress 25% 25% 25% -4% -4% -4%
290
300
310
320
330
340
350
2010 2011 2012 2013 2014
SchoolSimilar SchoolsNational Average
290
300
310
320
330
340
350
2010 2011 2012 2013 2014
290
300
310
320
330
340
350
2010 2011 2012 2013 2014
Reading: Level 4+
Writing: Level 4+
Mathematics: Level 4+
Summary Attainment & achievement Pupil groups Subjects Pupil premium School context
Self Valley Primary Self Evaluation: School Dashboard
2013 KS2 Indicators
o Dashboard (PDF)o Table data (Excel)
ExportVA CVA
Filters

Summary Attainment & achievement Pupil groups Subjects Pupil premium School context
Self Valley Primary Self Evaluation: School Dashboard
2013 KS2 Indicators
o Dashboard (PDF)o Table data (Excel)
ExportVA CVA
Filters
Pupil
Premium
Not Pupil
Premium
Actual Results Pupil Progress
APS (Re, Wr, Ma) APS (Re, Wr, Ma)
Pupil
Premium
Not Pupil
PremiumGap
Pupil
Premium
Not Pupil
PremiumGap
Summary
All Pupils 30 120 28.6 28.6 -0.5 0.1 0.1 0.3
Boys 16 60 27.3 27.3 -1.3 0.2 0.2 -0.4
Girls 14 60 27.5 27.5 -0.1 -0.3 -0.3 -0.1
Prior
Attainment
Boys - Higher Ability 4 23 28.6 28.6 -0.1 0.4 0.4 -0.6
Boys - Middle Ability 12 32 27.3 27.3 -1.1 0.1 0.1 0.3
Boys - Lower Ability 2 34 27.5 27.5 -0.4 -0.2 -0.2 0
Girls - Higher Ability 15 23 28.6 28.6 -0.4 -0.5 -0.5 -0.3
Girls - Middle Ability 12 43 27.3 27.3 -0.3 -1 -1 -0.8
Girls - Lower Ability 4 23 27.5 27.5 -0.2 -0.2 -0.2 0
KS2 Level
Level 2 or below 3 5 28.6 28.6 -0.1 0.6 0.6 0.8
Level 3C 2 10 27.3 27.3 -1.1 -0.2 -0.2 0
Level 3B 21 15 27.5 27.5 -0.4 0.4 0.4 -0.6
Level 3A 3 12 28.6 28.6 -0.4 0.3 0.3 -0.5
Level 4C 12 12 27.3 27.3 +0.2 0.3 0.3 0.5
Level 4B 12 25 27.5 27.5 -0.2 0.3 0.3 -0.5
Level 4A 3 25 28.6 28.6 -0.1 0.3 0.3 0.5
Level 5 2 25 27.3 27.3 -1.1 0.3 0.3 -0.5
Level 6 1 10 27.5 27.5 -0.4 0.3 0.3 0.5
SEN
School Action 7 12 28.6 28.6 -0.1 0.3 0.3 0.5
School Action + 6 25 27.3 27.3 -1.1 0.3 0.3 0.5
Statement 3 6 27.5 27.5 -0.4 0.3 0.3 0.5
Not SEN 5 123 28.6 28.6 0 0.3 0.3 0.5
-1 -0.5 0 0.5
KS2 Level 3B
KS2 Level 4C
Boys - Lower Ability
KS2 Level 3C
School Action
Boys
School Action +
All Pupils
KS2 Level 3A
Girls
Girls - Lower Ability
Boys - Middle Ability
KS2 Level 2
KS2 Level 4B
Statement
Not SEN
Girls - Middle Ability
KS2 Level 4A
Boys - Higher Ability
KS2 Level 6
Girls - Higher Ability
KS2 Level 5
Pupil Progress Gap
APS (Re, Wr, Ma)
Pupil Premium Pupils (2013)Pupil Premium – Closing the Gap

School Context: all pupils (Year 1 to Year 6) School Absence: all pupils (Year 1 to Year 6)
Summary Attainment & achievement Pupil groups Subjects Pupil premium School context
Self Valley Primary Self Evaluation: School Dashboard
2013 KS2 Indicators
o Dashboard (PDF)o Table data (Excel)
ExportVA CVA
Filters


Pupil Results – Attainment (2013)
Pupil Progress – Achievement (2013)
Stronger Weaker
Attainment
(pupil results)
Higher ability
First Language not English
Not Pupil Premium (FSM)
Indian
Pupil Premium (FSM)
SEN School Action +
Lower ability
White other
Achievement
(pupil progress)
Higher ability
First Language not English
Not Pupil Premium (FSM)
Indian
Pupil Premium (FSM)
SEN School Action +
Lower ability
White other
Relative Strengths and Weaknesses (2013)
Mathematics
% Level 4+
Mathematics
Average Point Score
Progress is significantly above
the national average (zero)
Progress is significantly below
with the national average (zero)
Mathematics
% Level 4+
Mathematics
Average Point Score
Results are significantly below
the national average (60%)Results are in line with the
national average (31)
Comparing your school to similar schools
This dashboard uses pupils’ prior attainment, gender and month of birth to analyse pupil progress
(value added). FFT’s Contextual Value Added (CVA) analyses compares the progress of your
pupils to similar pupils in similar schools. You can switch between Value Added and Contextual
Value Added at the top of this dashboard to see the differences for your school.
82% 26.5
+5% -1.2
Dyson Perrins CofE Sports College (2013)2
Pupil Results - Attainment (2013)
Pupil Progress - Achievement (2013)
Relative Strengths and Weaknesses (3 years)
Key Stage 4 Performance Summary
Key Stage 4 Headline Performance
% 5+ A*-C incl Eng & Maths Average Point Score (best 8)
Actual Results Pupil Progress (Act vs Est)
2011 2012 2013 2011 2012 2013
Number of Pupils 150 159 153 - - -
% 5+ A*-C incl Eng & Maths 53% 57% 41% -9% -5% -18%
Average Point Score (best 8) 344 333 303 0 -19 -40
Average Grade (GCSE only) C- C- D+ -0.3 -0.3 -0.5
% pupils achieving 5+ A*-A 10% 10% 5% -5% -6% -7%
% 3 Levels Progress - English 71% 71% 49% -4% 0% -23%
% 3 Levels Progress - Maths 56% 58% 55% -12% -13% -17%
Stronger Areas Weaker Areas
Pupil Groups Middle ability
Not SEN
Not FSM (in last 6 yrs)
SEN School Action +
SEN Statement
FSM (in last 6 yrs)
Subjects Art & Design
D&T Food Technology
D&T Textiles Technology
D&T Electronic Products
Religious Studies
Psychology
% 5+ A*-C incl Eng & Maths
41%Results are significantly below the
national average (60%)
Average Point Score (best 8)
303Results are significantly below the
national average (339)
% 5+ A*-C incl Eng & Maths
-18%Progress is significantly below the
national average of zero
Average Point Score (best 8)
-40Progress is significantly below the
national average of zero
Dyson Perrins CofE Sports College (2013)2
Pupil Results - Attainment (2013)
Pupil Progress - Achievement (2013)
Relative Strengths and Weaknesses (3 years)
Key Stage 4 Performance Summary
Key Stage 4 Headline Performance
% 5+ A*-C incl Eng & Maths Average Point Score (best 8)
Actual Results Pupil Progress (Act vs Est)
2011 2012 2013 2011 2012 2013
Number of Pupils 150 159 153 - - -
% 5+ A*-C incl Eng & Maths 53% 57% 41% -9% -5% -18%
Average Point Score (best 8) 344 333 303 0 -19 -40
Average Grade (GCSE only) C- C- D+ -0.3 -0.3 -0.5
% pupils achieving 5+ A*-A 10% 10% 5% -5% -6% -7%
% 3 Levels Progress - English 71% 71% 49% -4% 0% -23%
% 3 Levels Progress - Maths 56% 58% 55% -12% -13% -17%
Stronger Areas Weaker Areas
Pupil Groups Middle ability
Not SEN
Not FSM (in last 6 yrs)
SEN School Action +
SEN Statement
FSM (in last 6 yrs)
Subjects Art & Design
D&T Food Technology
D&T Textiles Technology
D&T Electronic Products
Religious Studies
Psychology
% 5+ A*-C incl Eng & Maths
41%Results are significantly below the
national average (60%)
Average Point Score (best 8)
303Results are significantly below the
national average (339)
% 5+ A*-C incl Eng & Maths
-18%Progress is significantly below the
national average of zero
Average Point Score (best 8)
-40Progress is significantly below the
national average of zero
Dyson Perrins CofE Sports College (2013)2
Pupil Results - Attainment (2013)
Pupil Progress - Achievement (2013)
Relative Strengths and Weaknesses (3 years)
Key Stage 4 Performance Summary
Key Stage 4 Headline Performance
% 5+ A*-C incl Eng & Maths Average Point Score (best 8)
Actual Results Pupil Progress (Act vs Est)
2011 2012 2013 2011 2012 2013
Number of Pupils 150 159 153 - - -
% 5+ A*-C incl Eng & Maths 53% 57% 41% -9% -5% -18%
Average Point Score (best 8) 344 333 303 0 -19 -40
Average Grade (GCSE only) C- C- D+ -0.3 -0.3 -0.5
% pupils achieving 5+ A*-A 10% 10% 5% -5% -6% -7%
% 3 Levels Progress - English 71% 71% 49% -4% 0% -23%
% 3 Levels Progress - Maths 56% 58% 55% -12% -13% -17%
Stronger Areas Weaker Areas
Pupil Groups Middle ability
Not SEN
Not FSM (in last 6 yrs)
SEN School Action +
SEN Statement
FSM (in last 6 yrs)
Subjects Art & Design
D&T Food Technology
D&T Textiles Technology
D&T Electronic Products
Religious Studies
Psychology
% 5+ A*-C incl Eng & Maths
41%Results are significantly below the
national average (60%)
Average Point Score (best 8)
303Results are significantly below the
national average (339)
% 5+ A*-C incl Eng & Maths
-18%Progress is significantly below the
national average of zero
Average Point Score (best 8)
-40Progress is significantly below the
national average of zero
Dyson Perrins CofE Sports College (2013)2
Pupil Results - Attainment (2013)
Pupil Progress - Achievement (2013)
Relative Strengths and Weaknesses (3 years)
Key Stage 4 Performance Summary
Key Stage 4 Headline Performance
% 5+ A*-C incl Eng & Maths Average Point Score (best 8)
Actual Results Pupil Progress (Act vs Est)
2011 2012 2013 2011 2012 2013
Number of Pupils 150 159 153 - - -
% 5+ A*-C incl Eng & Maths 53% 57% 41% -9% -5% -18%
Average Point Score (best 8) 344 333 303 0 -19 -40
Average Grade (GCSE only) C- C- D+ -0.3 -0.3 -0.5
% pupils achieving 5+ A*-A 10% 10% 5% -5% -6% -7%
% 3 Levels Progress - English 71% 71% 49% -4% 0% -23%
% 3 Levels Progress - Maths 56% 58% 55% -12% -13% -17%
Stronger Areas Weaker Areas
Pupil Groups Middle ability
Not SEN
Not FSM (in last 6 yrs)
SEN School Action +
SEN Statement
FSM (in last 6 yrs)
Subjects Art & Design
D&T Food Technology
D&T Textiles Technology
D&T Electronic Products
Religious Studies
Psychology
% 5+ A*-C incl Eng & Maths
41%Results are significantly below the
national average (60%)
Average Point Score (best 8)
303Results are significantly below the
national average (339)
% 5+ A*-C incl Eng & Maths
-18%Progress is significantly below the
national average of zero
Average Point Score (best 8)
-40Progress is significantly below the
national average of zero
Self Valley Primary Subject Dashboard Mathematics
2013 KS2 Indicators
o Dashboard (PDF)o Table data (Excel)
ExportVA CVA
Filters
0
5
10
15
20
G F E D C B A A*
Expected
Actual
Level distribution for Mathematics (expected and actual results)
Summary Attainment & achievement Pupil groups Matrix Pupil premium
3 4C 4B 4A 5C 5B 5A 6
Key Stage 2 Performance Summary
Actual ResultsPupil Progress
(Act vs Est)
2012 2013 2014 2012 2013 2014
Number of Pupils (% match) 59 58 61 95% 95% 95%
% Level 4+ (Maths) 53% 57% 62% -9% -2%
4%
% Level 4B+ (Maths) 53% 57% 62% -9% -2% 4%
% Level 5+ (Maths 53% 57% 62% -9% -2% 4%
Average Point Score (Maths) 10% 10% 15% -5% -4% 1%
Maths: % 2 Levels Progress 71% 71% 78% -2% -2% 1%
Maths: % 3 Levels Progress 26% 28% 34% -8% -9% -1%
Pupil Progress – Achievement (2013)
FFT
Rank
High80 60 40 20Low
43
- 1.2
Significantly above the
national average (zero)
Significantly below the
national average (zero)
Pupil results – Attainment (2013)
82%60% 70% 80%
National Average(all pupils)
Similar Schools(all pupils)
Your School
Significantly above the
national average (57%)
29.560% 65% 70% 75% 80%
National Average
Similar Schools
Your School
In line with the the national
average (342)
+ 6%
Average Point Score (Mathematics)
% Level 4+ (Mathematics)
45%
47%
49%
51%
53%
55%
57%
59%
61%
63%
65%
2010 2011 2012 2013 2014 290
300
310
320
330
340
350
2010 2011 2012 2013 2014
School
SimilarSchools
NationalAverage
Average Point Score (Maths)% Level 4+ (Maths)
Low 80 60 40 20 High
31FFT
Rank
Low 80 60 40 20 High
55FFT
Rank
Low 80 60 40 20 High
18FFT
Rank
Low 80 60 40 20 High
92FFT
Rank
% Level 4+ Mathematics
Average Point Score (Mathematics)
Self Valley Primary Subject Dashboard Mathematics
2013 KS2 Indicators
o Dashboard (PDF)o Table data (Excel)
ExportVA CVA
Filters
Summary Attainment & achievement Pupil groups Matrix Pupil premium

Pupil group performance: Mathematics (2013)
` Actual Results Pupil Progress
PupilsAPS
Maths
% Level 4+
Maths
% Level 5+
Maths
APS
Maths
% Level 4+
Maths
% Level 5+
Maths
Summary
All Pupils 59 28.6 51% 51% 0.1 -3% +3%
Boys 31 27.3 45% 45% 0.2 +3% +3%
Girls 28 27.5 54% 54% -0.3 +2% +2%
Prior
Attainment
Higher ability 45 28.6 90% 90% 0.4 +5% +5%
Middle ability 53 27.3 49% 49% 0.1 -1% -1%
Lower ability 43 27.5 9% 9% -0.2 -8% -8%
SEN
SEN School Action 23 28.6 25% 25% -0.5 -3% +3%
SEN Action + 10 27.3 12% 12% -1.0 +3% +3%
SEN Statement 6 27.5 11% 11% -0.2 +2% +2%
Not SEN 96 28.6 60% 60% 0.6 +3% +3%
Pupil
Premium
FSM (in last 6
years)45 27.5 18% 18% -0.2 -8% -8%
Not FSM 103 28.6 59% 59% 0.4 +5% +5%
Ethnicity
White 100 27.5 51% 51% 0.3 +3% +3%
Black Caribbean 10 28.6 42% 42% 0.3 -8% -8%
Black African 25 27.5 41% 41% 0.3 +2% +2%
Bangladeshi 12 28.6 64% 64% -0.3 +3% +3%
Other Asian 3 27.5 50% 50% 0.3 +3% +3%
Any other 5 28.6 32% 32% 0.3 +2% -2%
First
Language
Not English 34 27.5 52% 52% 0.3 +3% +3%
English 112 28.6 51% 51% 0.3 +3% +3%
Mobility Joined in Y10/11 15 28.5 52% 52% 0.3 +2% +2%-50 0 50
FSM (in last 6 years) (45)
SEN School Action + (10)
All Pupils (152)
Lower ability (43)
Boys (74)
White (100)
Girls (76)
Middle ability (53)
SEN Statement (6)
Not SEN (96)
Black Caribbean (10)
Joined school in Yr 10/11 (15)
Not FSM (in last 6 years) (103)
Black African (25)
First Language English (112)
SEN School Action (23)
First Language not English (34)
Other Asian (3)
Any other (5)
Higher ability (45)
Bangladeshi (12)
Achievement summary (2013)
Pupil ProgressAverage Point Score (Maths)
Self Valley Primary Subject Dashboard Mathematics
2013 KS2 Indicators
o Dashboard (PDF)o Table data (Excel)
ExportVA CVA
Filters
Summary Attainment & achievement Pupil groups Matrix Pupil premium

KS2 Mathematics Transition Matrix
KS2 MathsLevels
Progress
Difference
from National
Average
Ave
rag
e K
S1
su
b-
leve
l (M
ath
s)
3C 3B 3A 4C 4B 4A 5C 5B 5A 6% 2
Levels
% 3
Levels
% 2
Levels
% 3
Levels
W
1C
1B1 3 1 100% 0% +5% -5%
1A1 3 2 3 835 3% +4% +4%
2C1 2 2 4 5 3 60% 3% -6% -6%
2B2 2 3 4 3 86% 25 +3% +3%
2A1 2 8 4 2 89% 2% -10% -10%
33 2 1 2 1 92% 10% +6% +4%
All Pupils 3 5 2 12 13 12 3 2 2 79% 34% -5% +2%
National 83% 32%
Pupils Pupil
Premium
SEN Level (Mathematics)
Exp Act Diff
Strawberry, Kym State 4A 4A 0.3
Radish, Hazel FSM6 SchAct 4B 4B -0.5
Watermelon,
Lucy5C 5C 0.2
Apricot, Stacey 4B 4B 0.4
Bay Leaf, Hazel SchAct+ 4B 4B 0.1
Artichoke, Adele Service 5C 5C 0.3
Potassium,
Naomi4A 4A -0.5
Bromine, Laura FSM6 5C 5C 0.3
KS1 Maths Level: 2A
KS2 Maths Grade: 4B
Self Valley Primary Subject Dashboard Mathematics
2013 KS2 Indicators
o Dashboard (PDF)o Table data (Excel)
ExportVA CVA
Filters
Summary Attainment & achievement Pupil groups Matrix Pupil premium

2013 KS2 Indicators
o Dashboard (PDF)o Table data (Excel)
ExportVA CVA
Filters
Pupil
Premium
Not Pupil
Premium
Actual Results Pupil Progress
APS (Maths) APS (Maths)
Pupil
Premium
Not Pupil
PremiumGap
Pupil
Premium
Not Pupil
PremiumGap
Summary
All Pupils 30 120 28.6 28.6 -0.5 0.1 0.1 0.3
Boys 16 60 27.3 27.3 -1.3 0.2 0.2 -0.4
Girls 14 60 27.5 27.5 -0.1 -0.3 -0.3 -0.1
Prior
Attainment
Boys - Higher Ability 4 23 28.6 28.6 -0.1 0.4 0.4 -0.6
Boys - Middle Ability 12 32 27.3 27.3 -1.1 0.1 0.1 0.3
Boys - Lower Ability 2 34 27.5 27.5 -0.4 -0.2 -0.2 0
Girls - Higher Ability 15 23 28.6 28.6 -0.4 -0.5 -0.5 -0.3
Girls - Middle Ability 12 43 27.3 27.3 -0.3 -1 -1 -0.8
Girls - Lower Ability 4 23 27.5 27.5 -0.2 -0.2 -0.2 0
KS2 Level
Level 2 or below 3 5 28.6 28.6 -0.1 0.6 0.6 0.8
Level 3C 2 10 27.3 27.3 -1.1 -0.2 -0.2 0
Level 3B 21 15 27.5 27.5 -0.4 0.4 0.4 -0.6
Level 3A 3 12 28.6 28.6 -0.4 0.3 0.3 -0.5
Level 4C 12 12 27.3 27.3 +0.2 0.3 0.3 0.5
Level 4B 12 25 27.5 27.5 -0.2 0.3 0.3 -0.5
Level 4A 3 25 28.6 28.6 -0.1 0.3 0.3 0.5
Level 5 2 25 27.3 27.3 -1.1 0.3 0.3 -0.5
Level 6 1 10 27.5 27.5 -0.4 0.3 0.3 0.5
SEN
School Action 7 12 28.6 28.6 -0.1 0.3 0.3 0.5
School Action + 6 25 27.3 27.3 -1.1 0.3 0.3 0.5
Statement 3 6 27.5 27.5 -0.4 0.3 0.3 0.5
Not SEN 5 123 28.6 28.6 0 0.3 0.3 0.5
-1 -0.5 0 0.5
KS2 Level 3B
KS2 Level 4C
Boys - Lower Ability
KS2 Level 3C
School Action
Boys
School Action +
All Pupils
KS2 Level 3A
Girls
Girls - Lower Ability
Boys - Middle Ability
KS2 Level 2
KS2 Level 4B
Statement
Not SEN
Girls - Middle Ability
KS2 Level 4A
Boys - Higher Ability
KS2 Level 6
Girls - Higher Ability
KS2 Level 5
Pupil Progress Gap
APS (Re, Wr, Ma)
Pupil Premium Pupils (2013)Pupil Premium – Closing the Gap
Summary Attainment & achievement Pupil groups Matrix Pupil premium
Self Valley Primary Subject Dashboard Mathematics


![FSM [Autosaved]](https://img.pdfslide.us/doc/110x75/577cda6c1a28ab9e78a5a27e/fsm-autosaved.jpg)