Embed Size (px)
Citation preview

PowerPoint presentation to accompany
Besterfield
Quality Control, 8e
Chapter 12- Management and Planning Tools
Quality Control
Some Problems (Challenges) ! Undergraduate Unemployment Improve customer experience in a restaurant topics for research/project expending/relocation business entity improve customer experience driving a car improving health care system What are the consequences of children watching
violent television shows and playing violent video games?
ISO Implementation in an organzation
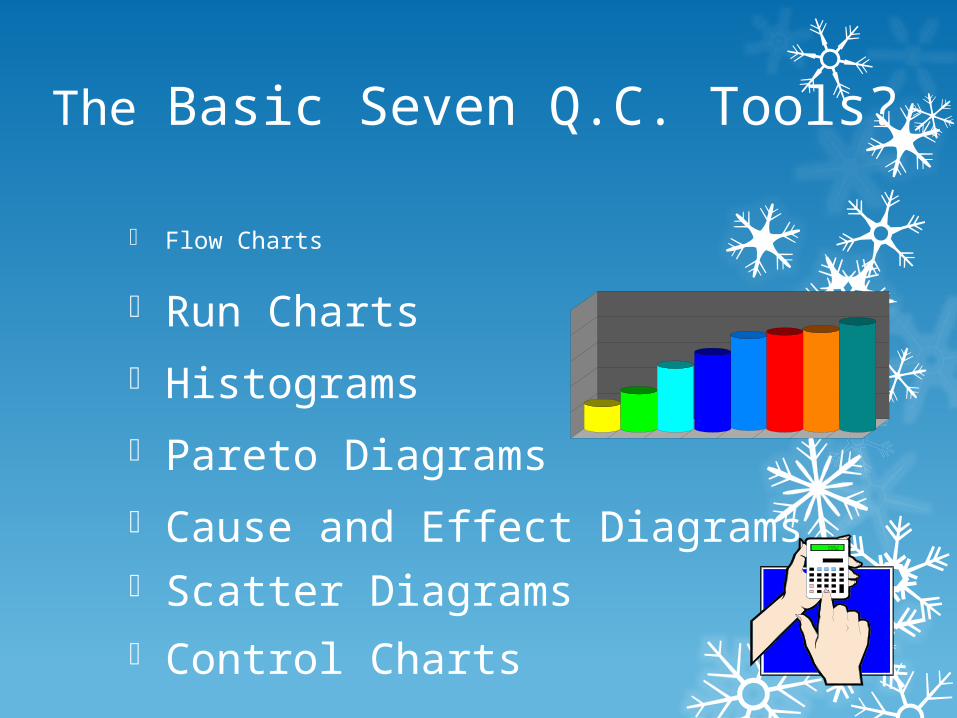
The Basic Seven Q.C. Tools?
Flow Charts
Run Charts Histograms Pareto Diagrams Cause and Effect Diagrams Scatter Diagrams Control Charts

Relation Between New Q.C. Tools and Basic Seven Tools
FACTS
Data
Numerical Data Verbal Data
Organize
The New Tools
Information
The Basic Tools
•Generate Ideas•Formulate plans
•Analytical approach
Define problem after collecting numerical data
Define problem before collecting numerical data
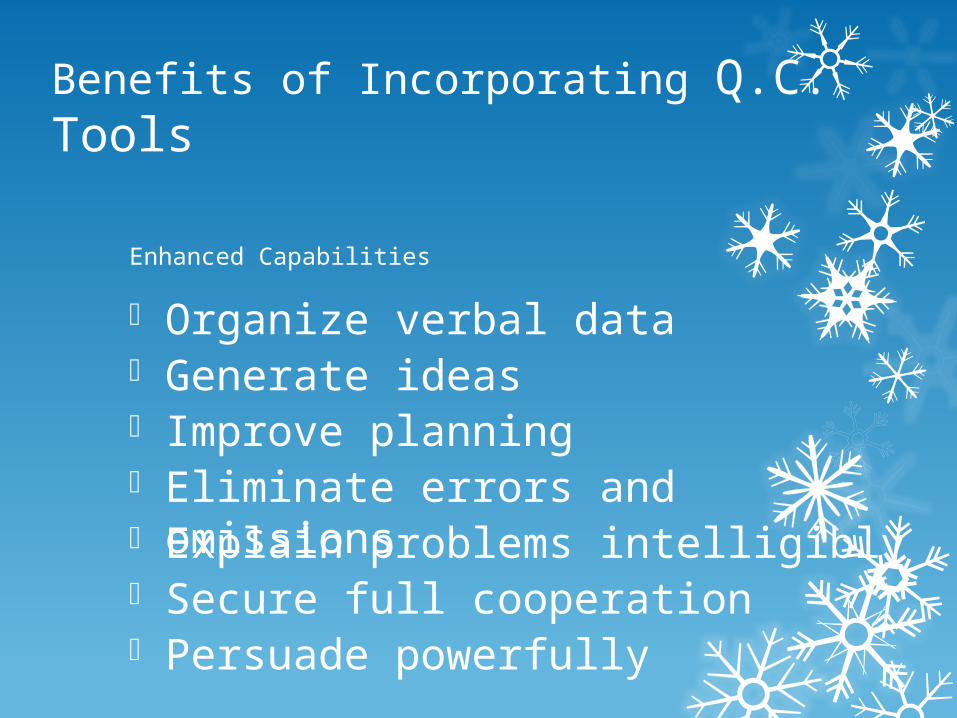
Benefits of Incorporating Q.C. Tools
Enhanced Capabilities
Generate ideas Improve planning Eliminate errors and omissions Explain problems intelligibly Secure full cooperation Persuade powerfully
Organize verbal data

Benefits of Incorporating Q.C. Tools
Clarify the desired situation Prioritize tasks effectively Proceed systematically Anticipate future events Change proactively Get things right the first time
Assess situations from various angles
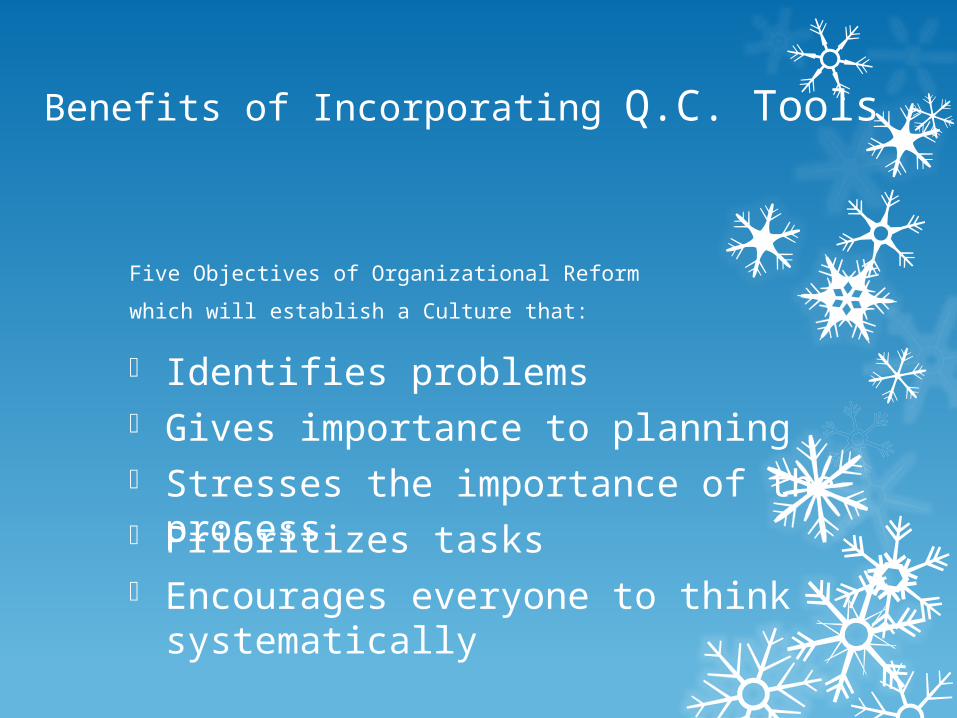
Benefits of Incorporating Q.C. Tools
Five Objectives of Organizational Reform
which will establish a Culture that:
Gives importance to planning Stresses the importance of the process Prioritizes tasks Encourages everyone to think
systematically
Identifies problems
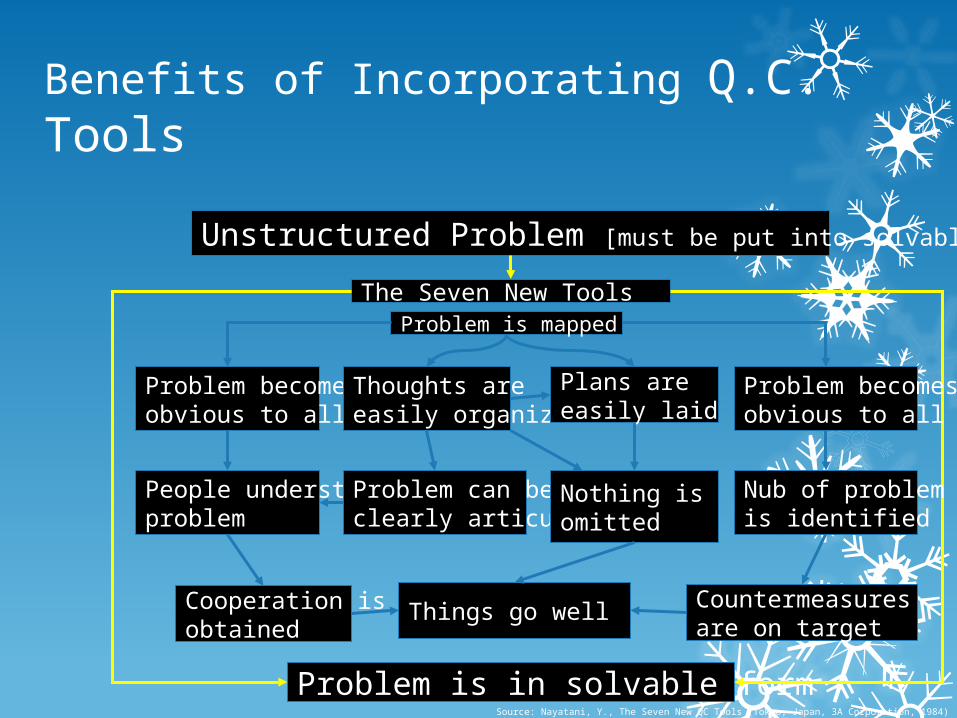
Benefits of Incorporating Q.C. Tools
Unstructured Problem [must be put into solvable form]
Problem is mapped
Problem becomesobvious to all
Problem is in solvable form
The Seven New Tools
Thoughts are easily organized
Things go well
People understandproblem
Cooperation is obtained
Countermeasuresare on target
Problem becomesobvious to all
Nub of problem is identified
Problem can be clearly articulated
Plans are easily laid
Nothing is omitted
Source: Nayatani, Y., The Seven New QC Tools (Tokyo, Japan, 3A Corporation, 1984)
Why, WhyKey to finding the root cause of a problem by
focusing on the process rather than on people.Describes the problem in specific terms and then
ask “why”.This tool is very beneficial in developing critical
thinking.It is frequently a quick method of solving
problems.

Management and Planning Tools
These tools are particularly useful in structuring unstructured ideas, making strategic plans, organizing and controlling large and complex projects.
These tools are very effective for teams and, in some cases, for individuals.
Management and Planning Tools
Subjective information.Applications of these tools has been proven
useful in process improvement, cost reduction, policy deployment, and new-product development.

85% of poor quality is a result of poor work processes, not of staff doing a bad job
Processes often “go wrong” at the point of the “handoff”
Attend to improving the overall process, not just one part—some of the most complex processes are the result of creating a “work around”
Outline
1.Force Field Analysis2.Nominal Group Technique3.Affinity Diagram4.Interrelationship Diagram
Outline
6. Tree Diagram7. Matrix Diagram8. Prioritization Matrices9. Process Decision Program Chart10.Activity Network Diagram
Learning Objectives
When you complete this chapter, you should: Be able to describe the why, why, forced field, and nominal group techniques. Know how to develop and utilize the following tools:
Affinity DiagramInterrelationship DiagramTree DiagramMatrix Diagram

Learning Objectives-cont’d.
When you complete this chapter, you should:
Know how to develop and utilize the following tools cont’d.:Process Decision Program ChartActivity Network DiagramPrioritization Matrices
Forced Field Analysis
Identifies the forces and factors that may influence the problem or goal.
Helps an organization to better understand promoting or driving and restraining or inhibiting forces so that the positives can be reinforced and the negatives reduced or eliminated.
Forced Field Analysis
Steps:
1. Define the objective.
2. Determine criteria for evaluating the effectiveness of the improvement action.
3. Brainstorm the forces that promote and inhibit achieving the goal.

Forced Field Analysis
Steps cont’d.:4.Prioritize the forces from greatest to
least.5.Take action to strengthen the promoting
forces and weaken the inhibiting forces.
Forced Field Analysis
Benefits:Determine the positives and negatives of
a situation.Encourage people to agree and prioritize
the competing forces.Identify the root causes.

Forced Field Analysis
Objective: Stop Smoking
Promoting Forces Inhibiting Forces
Poor Health Habit
Smelly Clothing Addiction
Poor Example Taste
Cost Stress
Impact on Others Advertisement

What is a force-field analysis?Force-field analysis is a problem-solving tool that is used to identify the reasons (“forces”) that support two positions to a question and the strength of each force. For example, force-field analysis could be sued by a team to answer the question, “Should ABC Inc. establish an office in Singapore?”
3. Following the rules of brainstorming, have the team provide as many reasons as possible for each of the responses. As with any brainstorming session, no answer should be ignored and no critique is permitted during the brainstorming session. After this session, the team’s force field might look like the following chart:
Yes No
Adapted from Practicing Organization Development
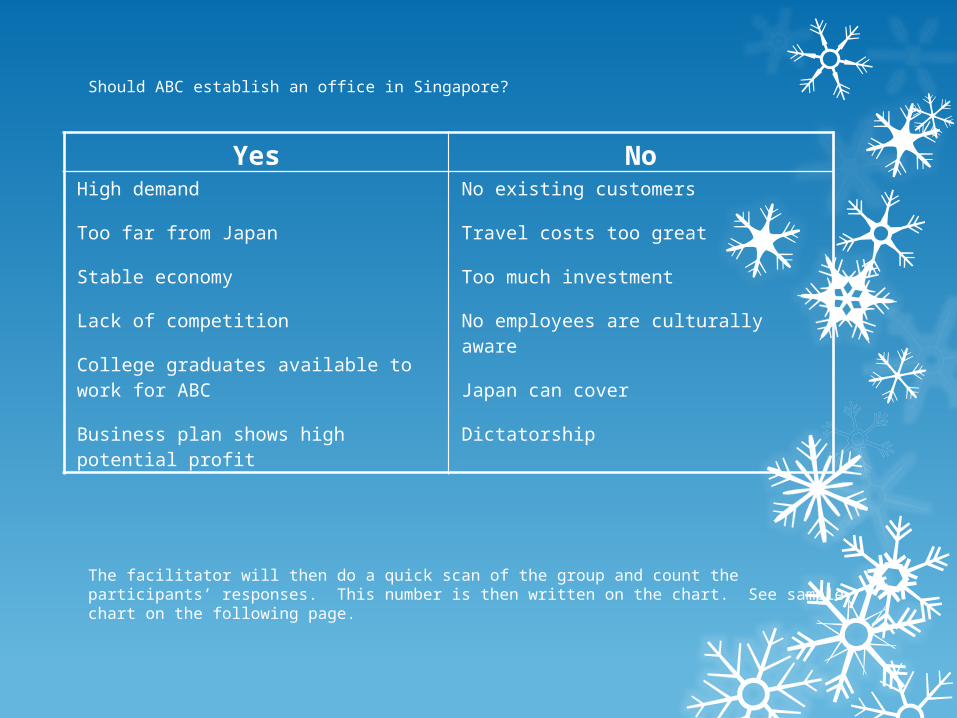
Should ABC establish an office in Singapore?
Yes NoHigh demand
Too far from Japan
Stable economy
Lack of competition
College graduates available to work for ABC
Business plan shows high potential profit
No existing customers
Travel costs too great
Too much investment
No employees are culturally aware
Japan can cover
Dictatorship
The facilitator will then do a quick scan of the group and count the participants’ responses. This number is then written on the chart. See sample chart on the following page.

4. Once the team can provide no new information to the brainstorming session, the items provided should be reviewed for clarification, duplication, and so on. Items should be reworded, if necessary, for clarification.
5. The next step is to identify how strong a force each item is. There are many ways to do this. One simple way is to treat each item with a five-point Likert scale. The facilitator may handle this process in the following manner:
“if you believe that the statement I read is a very strong argument for establishing an office in Singapore, hold up five fingers. If you believe that is a very weak argument for the position, hold up only one finger. How strong an argument do you think ‘High demand’ is?”

Yes No5 High demand
3 Too far from Japan
4 Stable economy
2 Lack of competition
2 College graduates available to work for ABC
5 Business plan shows high potential profit
1 No existing customers
2 Travel costs too great
5 Too much investment
2 No employees are culturally aware
5 Japan can cover
3 Dictatorship
6. Items that are perceived to be low in interest should be eliminated from the chart. In the sample chart above, items with a 1 or 2 would be removed. See sample chart below.
Should ABC establish an office in Singapore?
Yes No5 High demand
3 Too far from Japan
4 Stable economy
5 Business plan shows high potential profit
5 Too much investment
5 Japan can cover
3 Dictatorship
7. Given the arguments that remain, participants would try to decide the question.
Exhibit 6-5: Conducting a Force-Field Analysis (continued)
Nominal Group Technique
Provides the issues/ideas input from everyone on the team and for effective decisions.
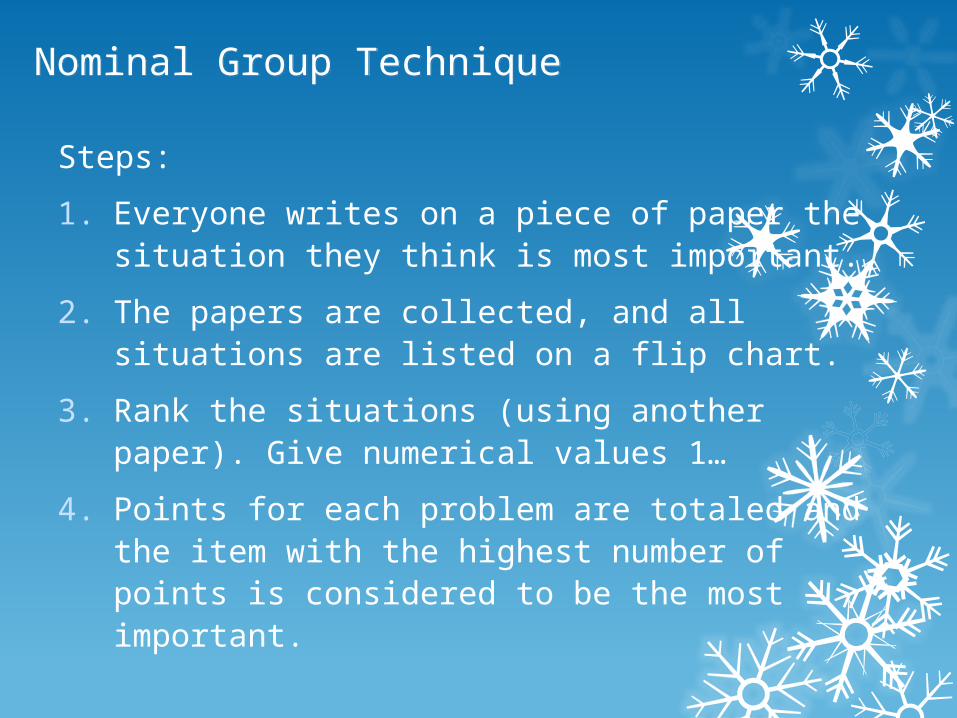
Nominal Group Technique
Steps:
1. Everyone writes on a piece of paper the situation they think is most important.
2. The papers are collected, and all situations are listed on a flip chart.
3. Rank the situations (using another paper). Give numerical values 1…
4. Points for each problem are totaled and the item with the highest number of points is considered to be the most important.
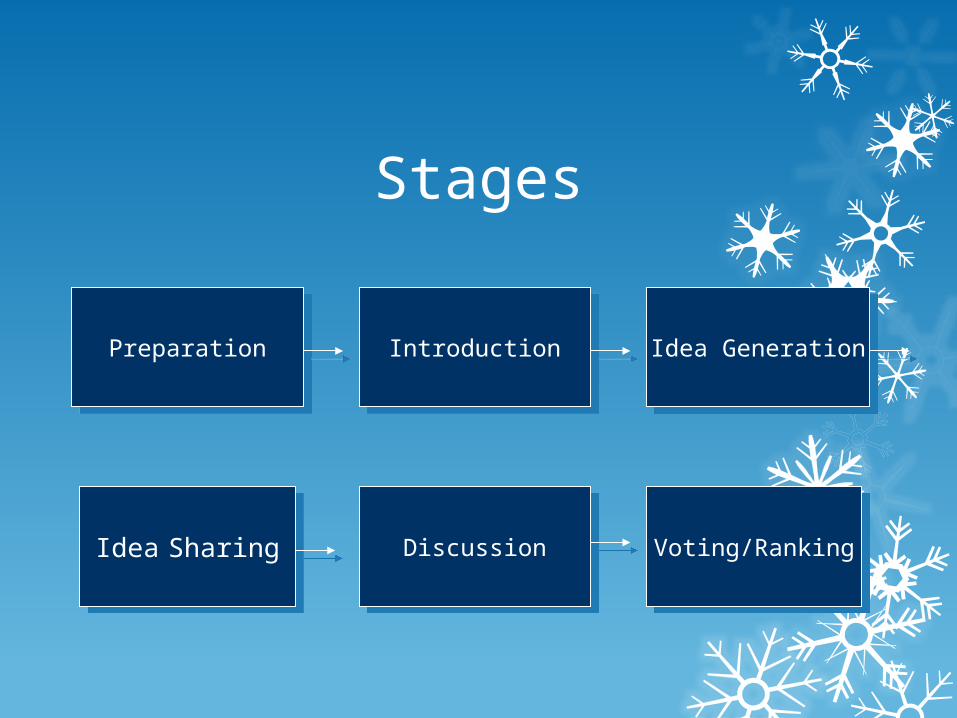
Stages
Introduction
Idea Sharing
Idea Generation
Discussion Voting/Ranking
Preparation

Example of NGT
The faculty at X-University is concerned that the students are not getting internships and jobs. A team is created involving faculty, students, and recruiters. The goal is to identify the cause of this problem. After this NGT process, the faculty will create an action plan based on the outcome.

Example of NGT
Statement of Problem:Why aren’t students getting internships and job offers?

Individual idea generation:
Not enough recruiters come.Their resumes are weak.Students are unwilling to
relocate.
Students are unprepared.
No internships prevents them from getting jobs later on.
The career fair is not productive.
Everyone wants to stay in-state.
The job market is slow.Poor interview skills.They’re not
networking.

Idea Sharing:

Discussion:
What do you mean by
“poor interview skills?”
Does that include lack of training?
Is the career fair not
productive because
there are too many people or too few? Can we re-
word that to say, “There aren’t job
opportunities through the career fair?”
Should we combine
“unwillingness to relocate”
with “students wanting
to stay in-state?”
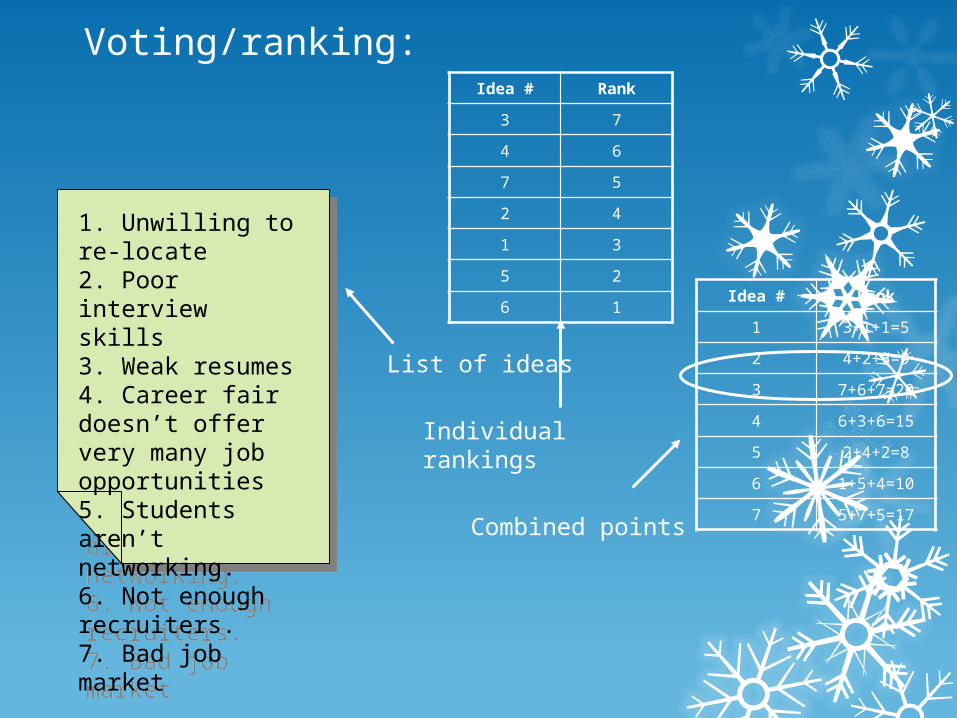
Voting/ranking:Idea # Rank
3 7
4 6
7 5
2 4
1 3
5 2
6 1
1. Unwilling to re-locate2. Poor interview skills3. Weak resumes4. Career fair doesn’t offer very many job opportunities5. Students aren’t networking.6. Not enough recruiters.7. Bad job market
Idea # Rank
1 3+1+1=5
2 4+2+3=9
3 7+6+7=20
4 6+3+6=15
5 2+4+2=8
6 1+5+4=10
7 5+7+5=17
List of ideas
Individual rankings
Combined points

Affinity Diagram
A tool for organizing a large number of ideas, opinions, and facts relating to a broad problem or subject area.
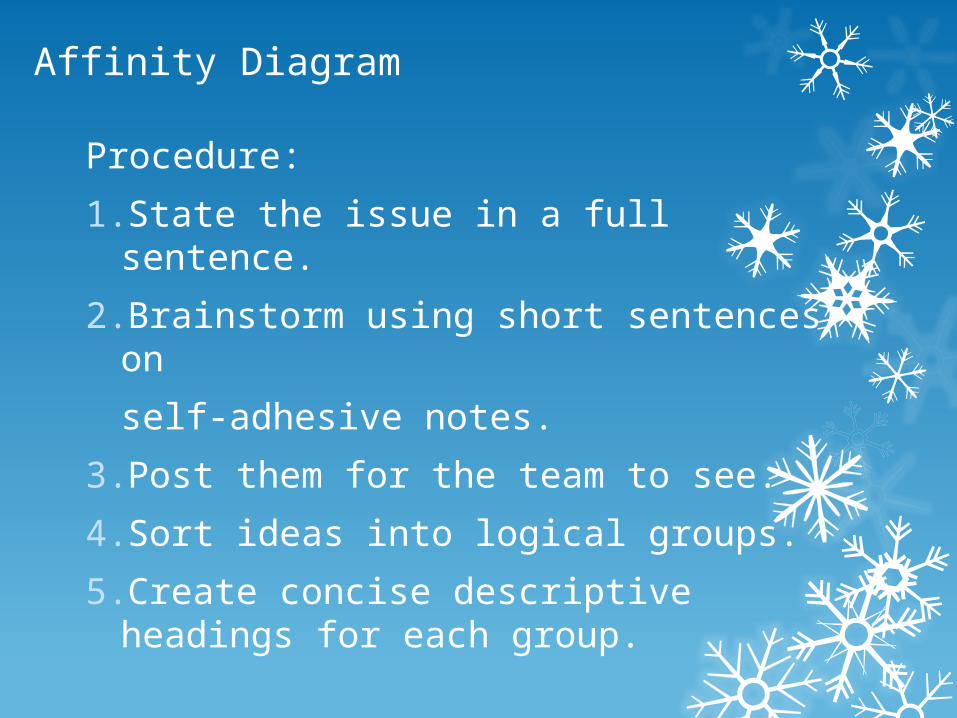
Affinity Diagram
Procedure:1. State the issue in a full sentence.2. Brainstorm using short sentences on
self-adhesive notes.3. Post them for the team to see.4. Sort ideas into logical groups.5. Create concise descriptive headings for each
group.

Topic
Affinity StatementData CardData CardData CardData Card
Affinity StatementData CardData CardData CardData Card
Affinity StatementData CardData Card
Data Card
Affinity StatementData CardData CardData CardData Card
Data Card Data Card

Activity
Innovative product features

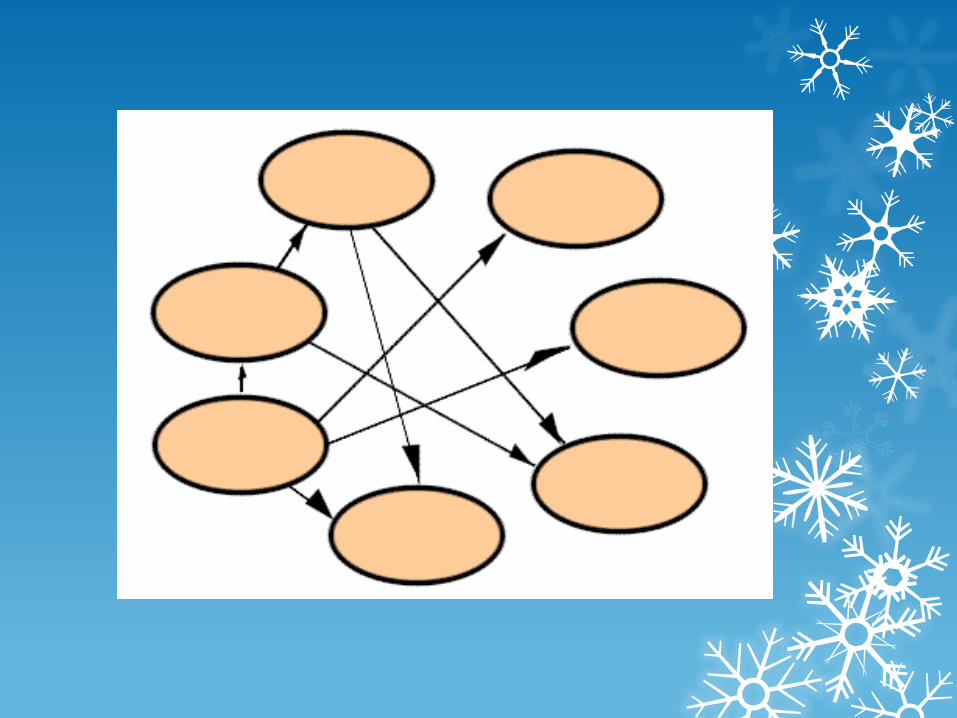
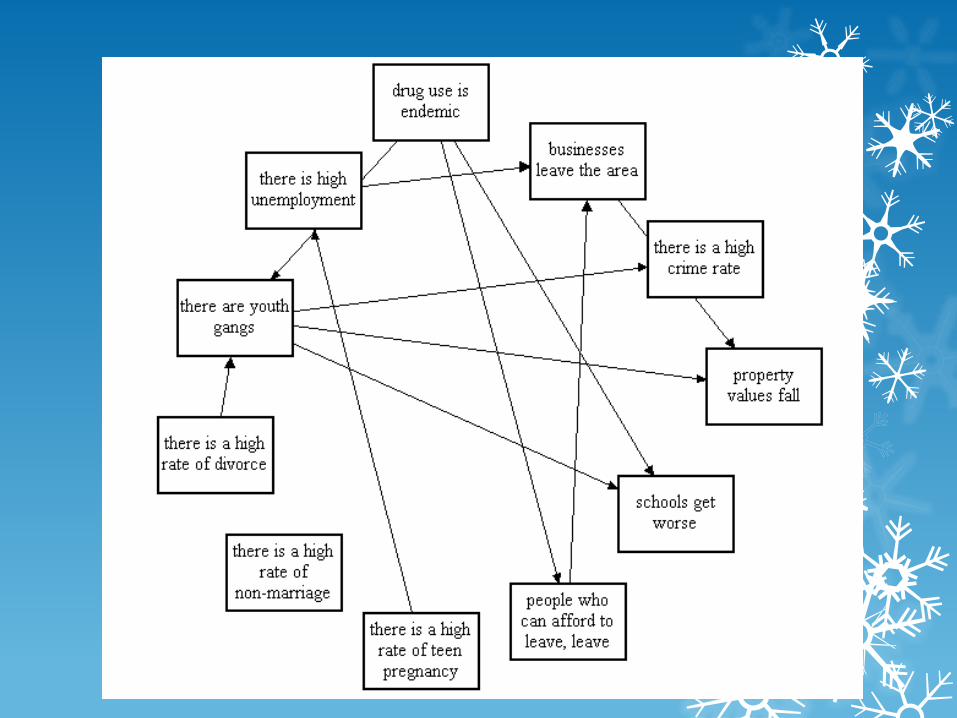
Interrelationship Diagram
Identifies and explores causal relationships among related concepts or ideas.
It allows the team to classify the cause-and-effect relationships among all factors so that the key drivers and outcomes can be used to solve the problem.
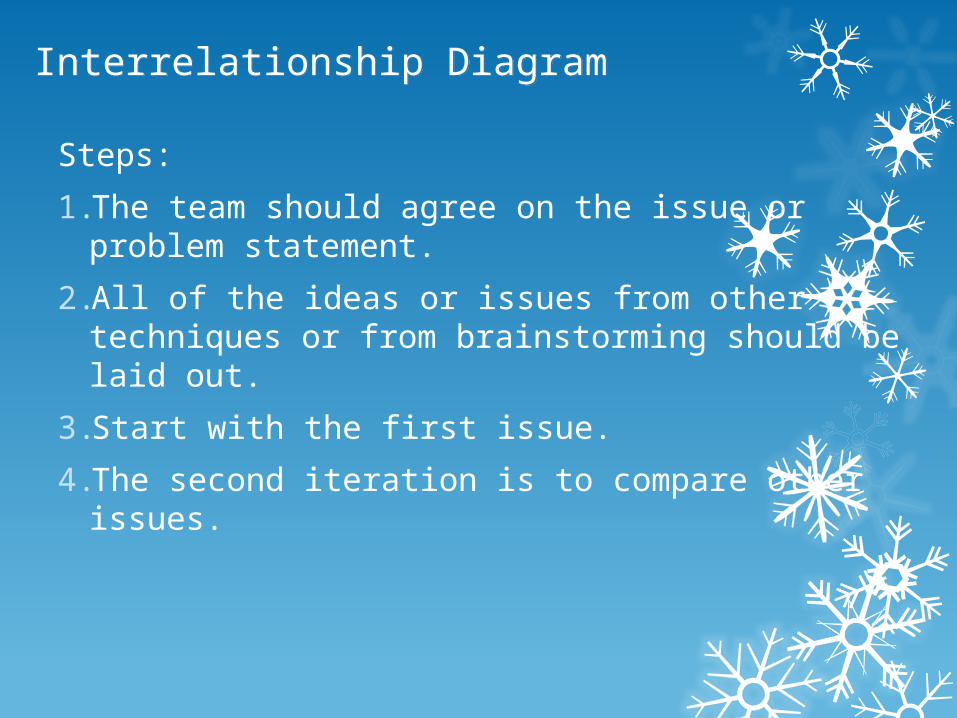
Interrelationship Diagram
Steps:
1. The team should agree on the issue or problem statement.
2. All of the ideas or issues from other techniques or from brainstorming should be laid out.
3. Start with the first issue.
4. The second iteration is to compare other issues.

Interrelationship Diagram
Steps cont’d.:5. The entire diagram should be reviewed and
revised where necessary.6. The diagram is completed by tallying the
incoming and outgoing arrows and placing this information below the box.
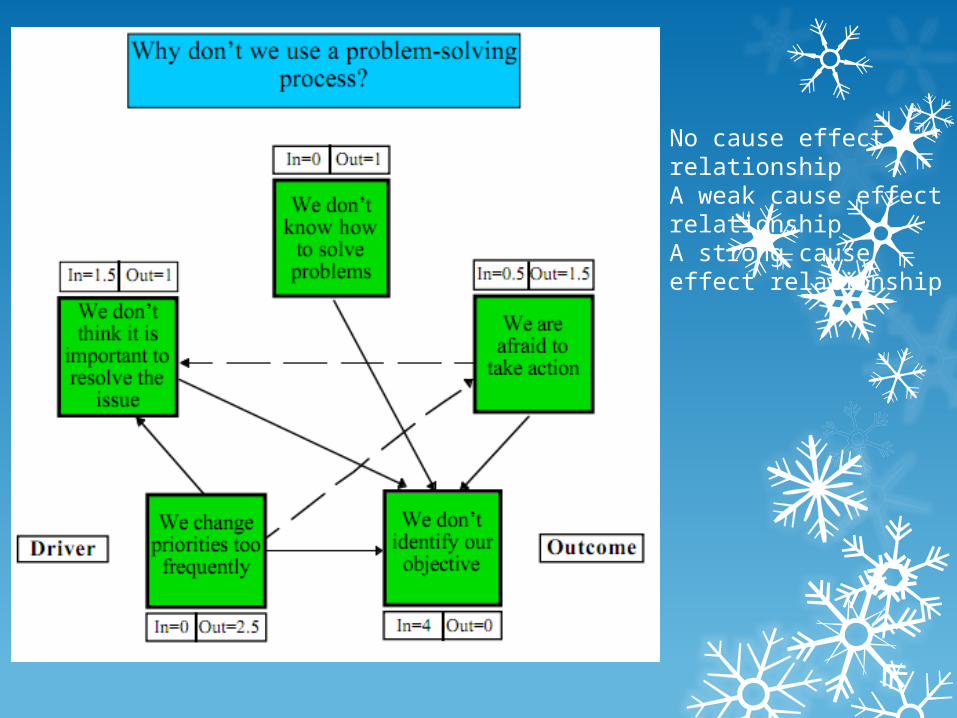
No cause effect relationshipA weak cause effect relationshipA strong cause effect relationship

Interrelationship Diagram
Benefits:Allows the team to identify root causes from
subjective data.Systematically explores cause-and-effect
relationships.Encourages members to think
multidirectionally.Develops team harmony and effectiveness.

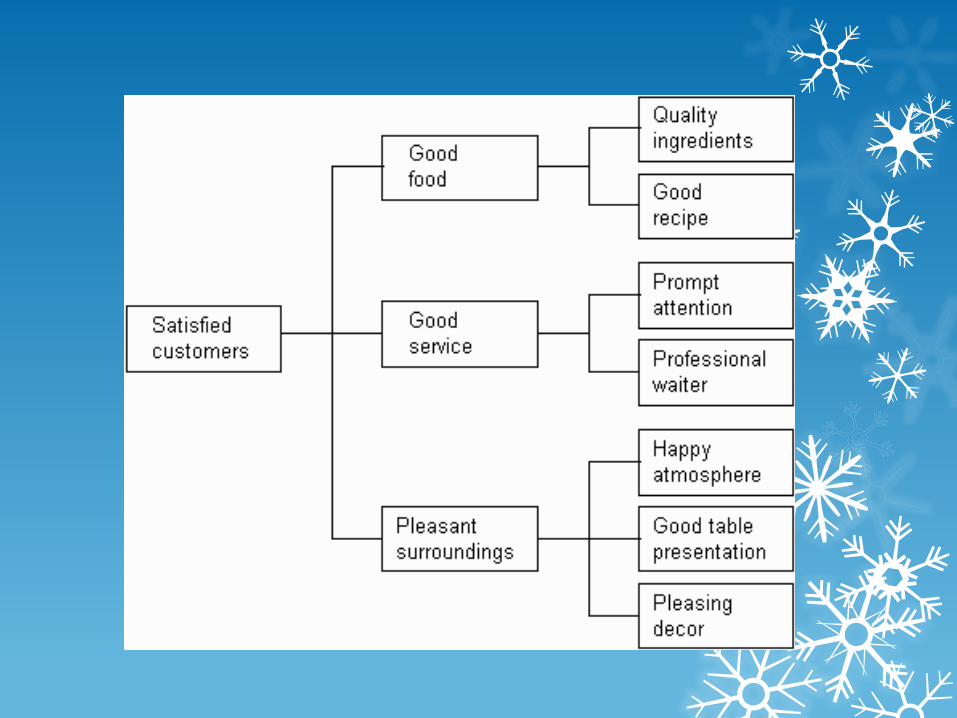
Tree Diagram
Maps out the paths and tasks necessary to complete a specific project or reach a specified goal.

Tree Diagram
Procedure:1. Choose an action-oriented objective statement from
the interrelationship diagram, affinity diagram, brainstorming, team mission statement.
2. Using brainstorming, choose the major headings.
3. Generate the next level by analyzing the major headings. Repeat this question at each level.
Tree Diagram
Benefits:Encourages team members to think
creatively.Makes large projects manageable.Generates a problem-solving
atmosphere.
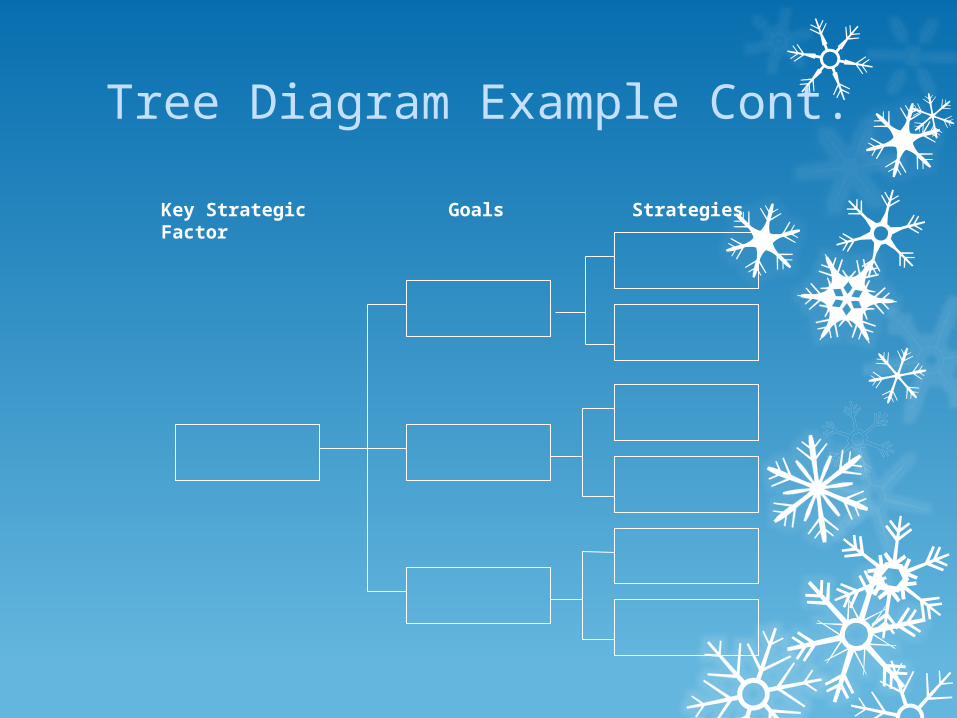
Tree Diagram Example Cont.
Key Strategic Factor Goals Strategies
Matrix Diagram
Display relationships between ideas, activities or other dimensions in such a way as to provide logical connecting points between each item.
Data are presented in table form and can be objective or subjective, which can be given symbols with or without numerical values.
Identified in 1988 book, Management for Quality Improvement by Shigeru Mizuno

Matrix Diagram
Procedure:
1. Select the factors affecting a successful plan.
2. Select the appropriate format (depend on the number of variables).
3. Determine the relationship symbols.

Matrix Diagram
Benefits:Encourage the team to think in terms
of relationship, their strength, and any pattern.

Matrix Diagram Exercise A restaurant manager wants to improve customer’s dining experience!
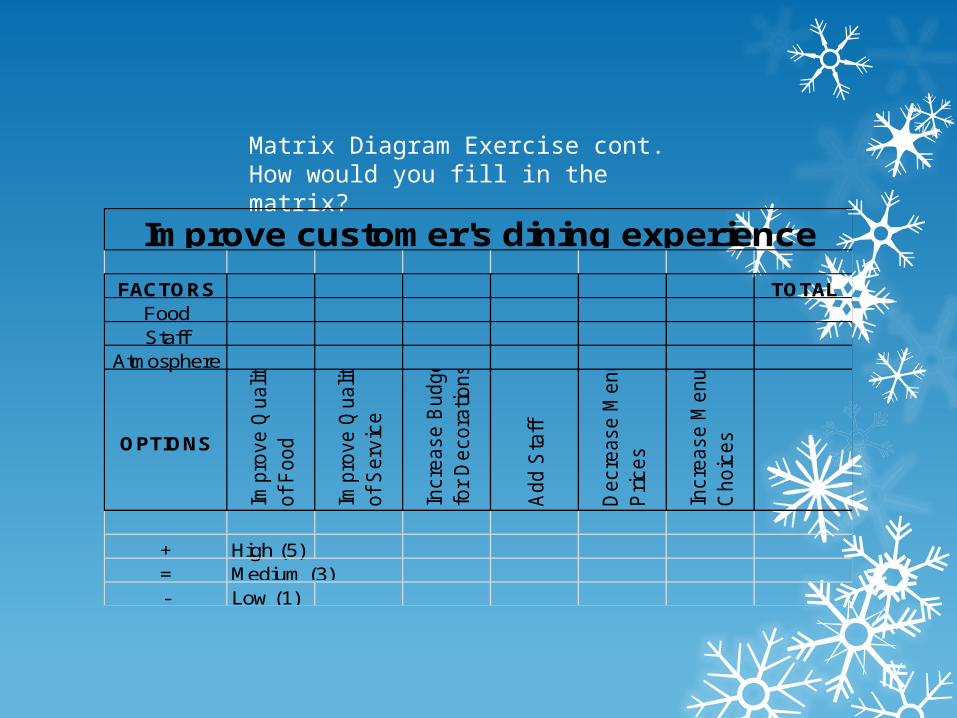
Matrix Diagram Exercise cont.How would you fill in the matrix?
FACTORS TOTALFoodStaff
Atmosphere
OPTIONS
Impr
ove
Qua
lity
of F
ood
Impr
ove
Qua
lity
of S
ervi
ce
Incr
ease
Bud
get
for
Dec
orat
ions
Add
Sta
ff
Dec
reas
e M
enu
Pric
es
Incr
ease
Men
u C
hoic
es
+ High (5)=- Low (1)
Medium (3)
Improve customer's dining experience

FACTORS TOTALFood + - - 7Staff + = 8
Atmosphere - = 4
OPTIONS
Impr
ove
Qua
lity
of F
ood
Impr
ove
Qua
lity
of S
ervi
ce
Incr
ease
Bud
get
for
Dec
orat
ions
Add
Sta
ff
Dec
reas
e M
enu
Pric
es
Incr
ease
Men
u C
hoic
es
+ High (5)=- Low (1)
Medium (3)
Improve customer's dining experience
Prioritization Matrices
Prioritizes issues, tasks, characteristics, based on weighted criteria using a combination of tree and matrix diagram techniques.
Once prioritized, effective decision can be made.Prioritization matrices are designed to reduce the
team’s options rationally before implementation planning occurs.
Prioritization Matrices
Steps:
1. Construct an L-Shaped matrix combining the options, which are the lowest-level of detail of the tree diagram with the criteria.
2. Determine the implementation criteria using the nominal group technique (NGT) or any other technique that will satisfactorily weight the criteria.
Prioritization Matrices
Steps cont’d.:
3. Prioritize the criteria using the NGT. Each team member weights the criteria so the total weight equals 1, and the results are totaled for the entire team.
4. Rank order the options in terms of importance by each criterion, average the results, and round to the nearest whole number.
Prioritization Matrices
Steps cont’d.:5. Compute the option importance score under
each criterion by multiplying the rank by the criteria weight.
-- refer to handout 1
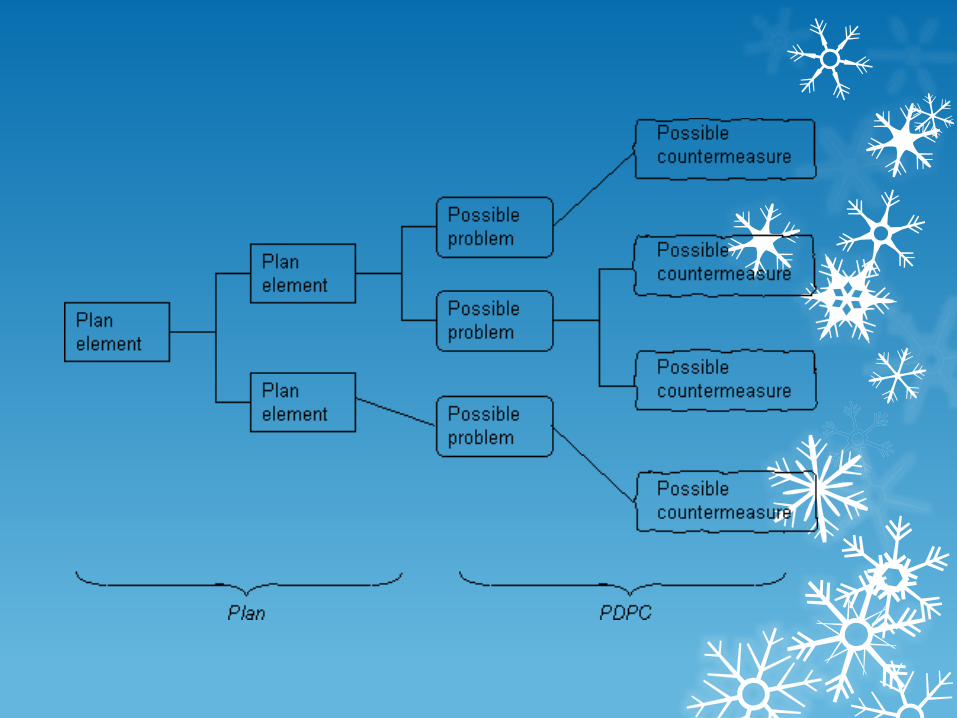
Process Decision Program Chart
The PDPC avoids surprises and identifies possible countermeasures.
PDPC is a method for mapping out every conceivable event and contingency that can occur when moving from a problem statement to possible solutions.
Process Decision Program Chart
Steps:1. The team state the objective.2. That activity is followed by the first level.3. In some cases a second level of detailed
activities may be used.4. The team brainstorms to determine what
could go wrong with the conference, and these are shown as the “what-if” level.
Process Decision Program Chart
Steps cont’d.:
5. The countermeasures are brainstormed and placed in a balloon in the last level.
6. The last step is to evaluate the countermeasures and select the optimal ones by placing an O underneath. Place an X under those that are rejected.

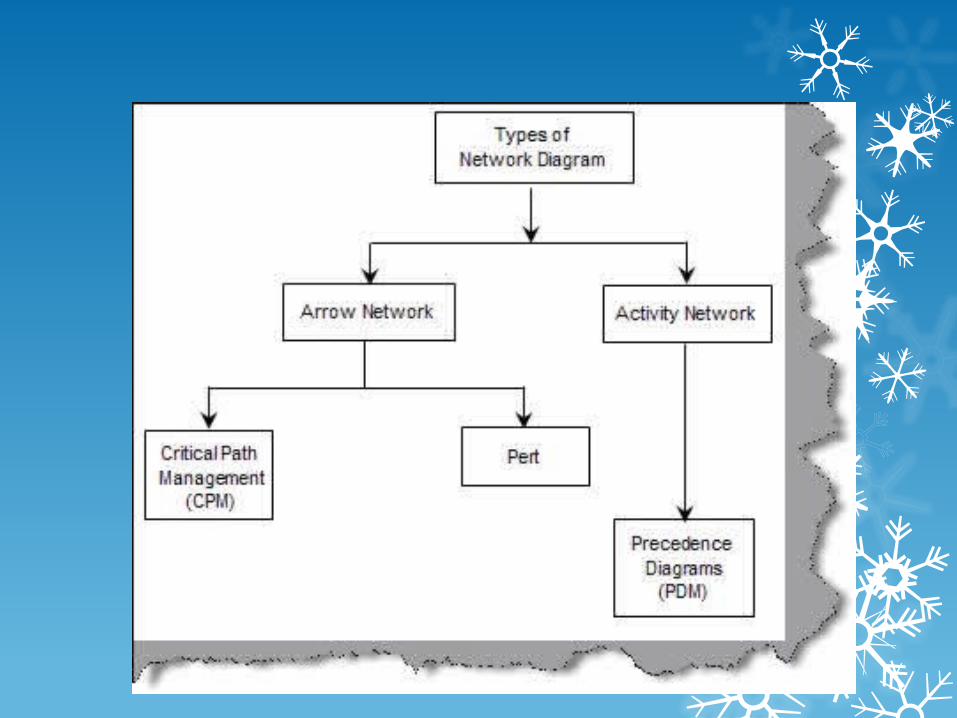
Activity Network Diagram
Program evaluation and review technique (PERT).
Critical path method (CPM).Arrow diagram.Activity on node (AON).The diagram shows completion times,
simultaneous tasks, and critical activity path.
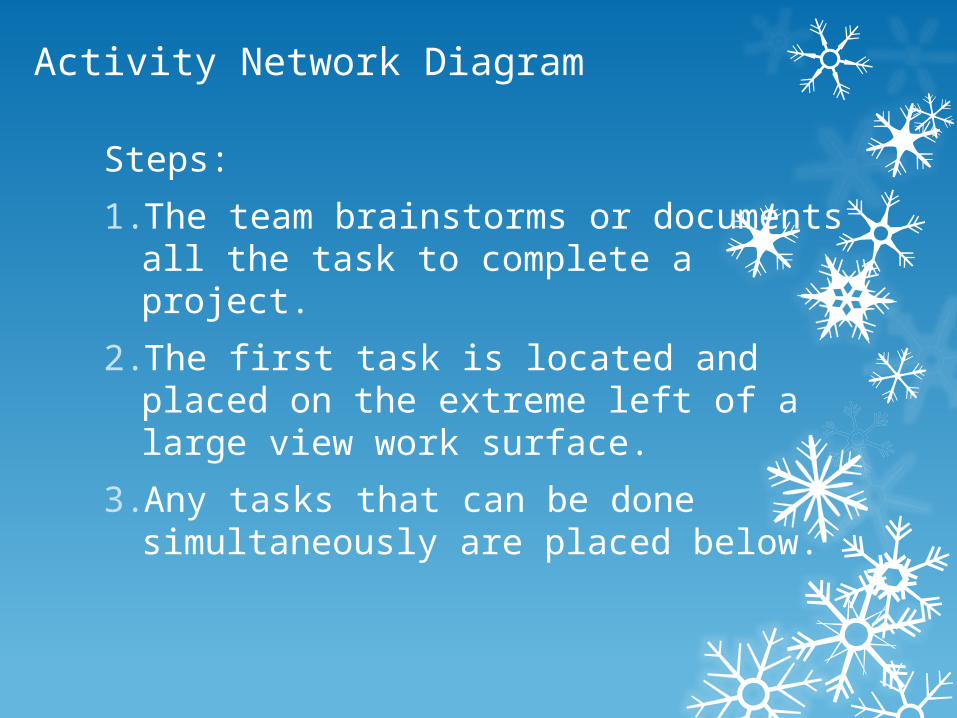
Activity Network Diagram
Steps:
1. The team brainstorms or documents all the task to complete a project.
2. The first task is located and placed on the extreme left of a large view work surface.
3. Any tasks that can be done simultaneously are placed below.
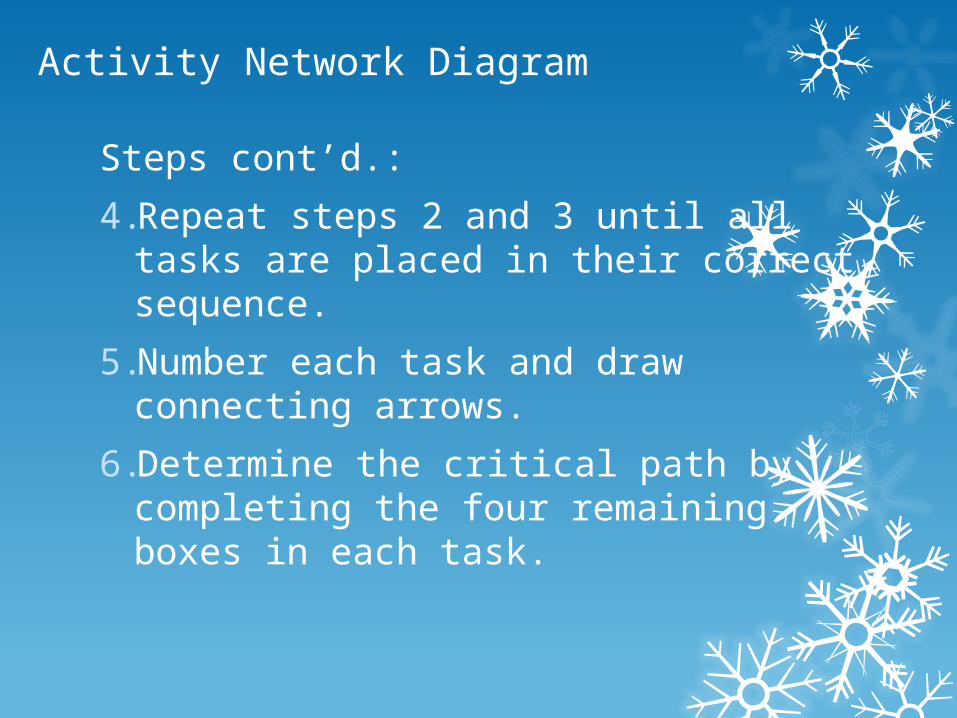
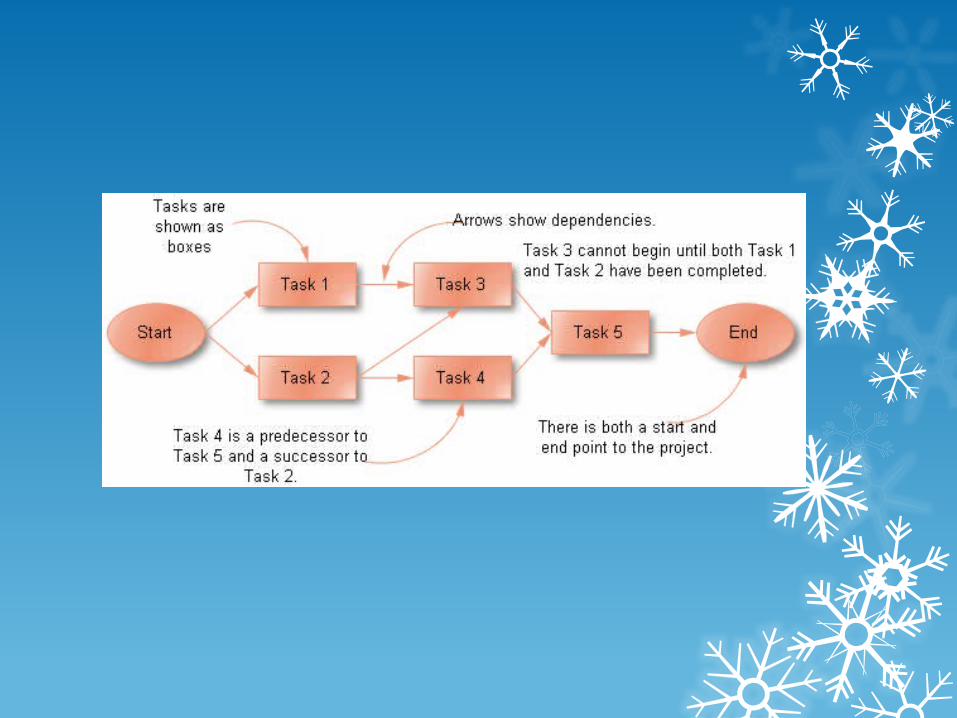
Activity Network Diagram
Steps cont’d.:4. Repeat steps 2 and 3 until all tasks are
placed in their correct sequence.5. Number each task and draw connecting
arrows.6. Determine the critical path by completing
the four remaining boxes in each task.

Activity Network Diagram for Green Productivity Project

Computer Training Center
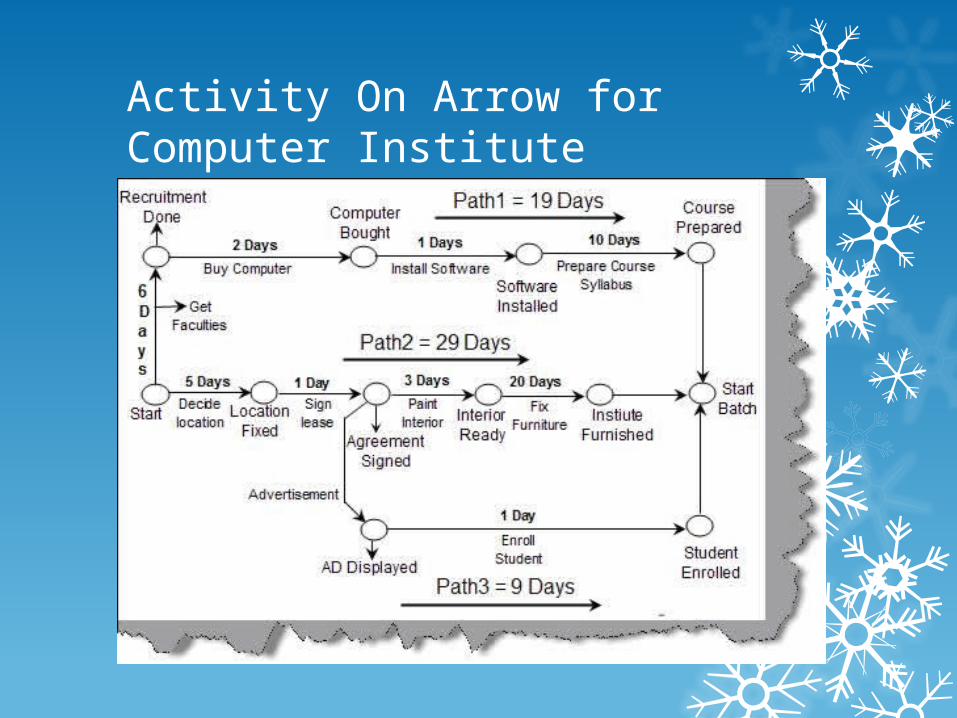
Activity On Arrow for Computer Institute

Recommendations to Use Q.C. Tools
Mental Attitudes
- Keen awareness to the actual problem
- Eagerness to solve problem
- Be highly motivated for the challenge
Four Specific Keys Understand the problem Select the right tool for the job Obtain appropriate verbal data Interpret analytical results
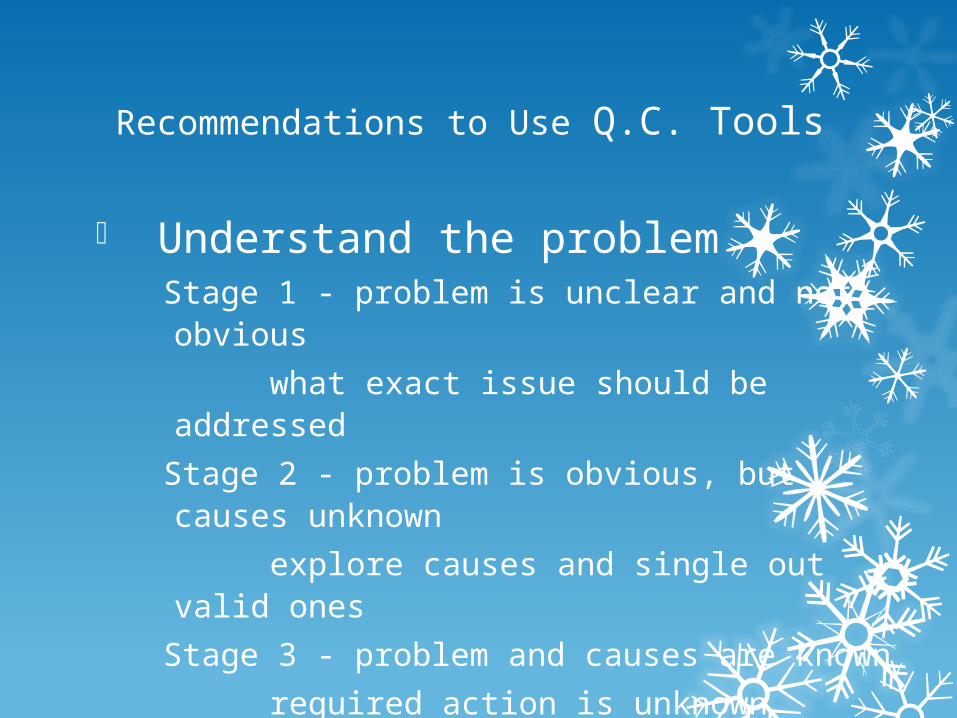
Understand the problem Stage 1 - problem is unclear and not obvious
what exact issue should be addressed Stage 2 - problem is obvious, but causes unknown
explore causes and single out valid ones Stage 3 - problem and causes are known
required action is unknownstrategies and plan must be developed
Recommendations to Use Q.C. Tools

Selecting Right tool for the Job Stage 1 - Collect verbal information on events
(Affinity Diagram) Stage 2 - Choose tool to identify causes
(Relations Diagram / Matrix Diagram)
Stage 3 - List strategies and activities (Tree Diagram / Relations Diagram) Plan actual activities (Arrow Diagram / PDPC Chart)
Recommendations to Use Q.C. Tools
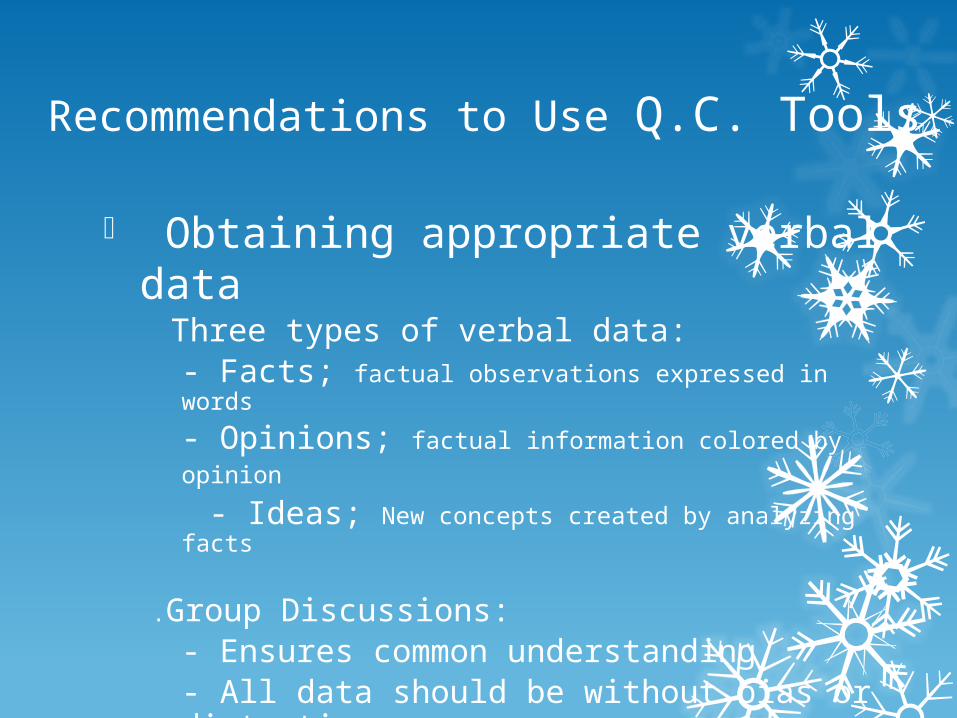
Obtaining appropriate verbal data Three types of verbal data: - Facts; factual observations expressed in words
- Opinions; factual information colored by opinion - Ideas; New concepts created by analyzing facts
.Group Discussions: - Ensures common understanding
- All data should be without bias or distortion
- Data should fit objective of the analysis
Recommendations to Use Q.C. Tools

Interpreting Analytical Results Information must be obtained for
accomplishing objectives from: - Completed diagrams; or
- Process of completing diagrams
Analyze actual information obtained: - Prepare summarized report with findings, conclusions, and processes used
- Check if necessary data has been obtained, if not
- Discover the cause and take appropriate action
Recommendations to Use Q.C. Tools
Exercises The roles of Suppliers Customers Efficiency Effectiveness Service Industry Innovativeness Value-added services and its benefits to the customers Management tools to manufacture a product Small group (< 5) Big group