Embed Size (px)
Citation preview

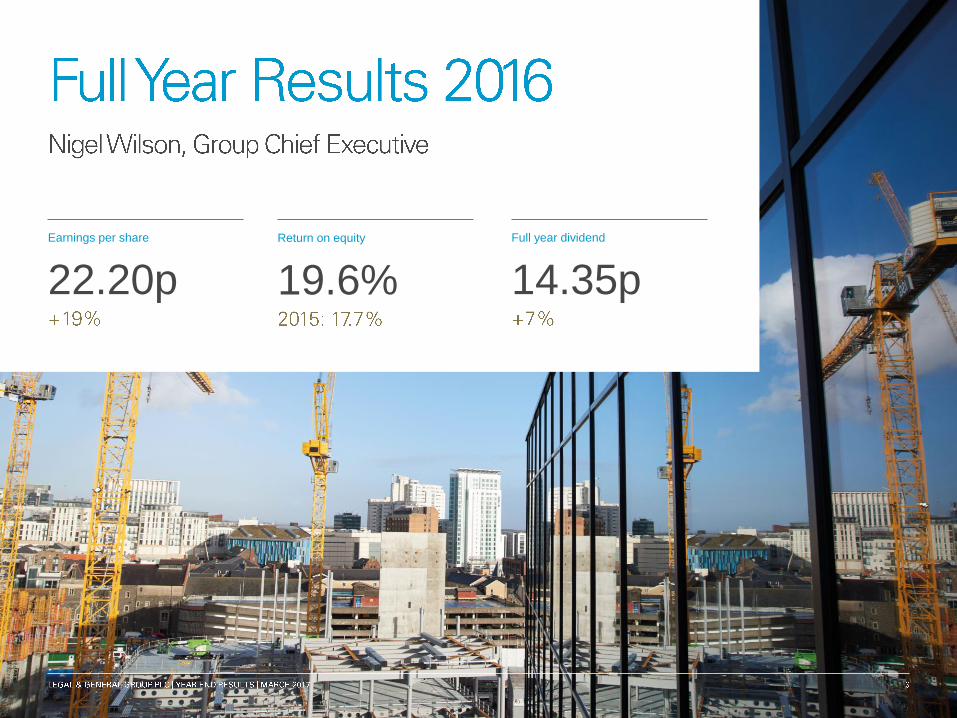
Earnings per share
22.20p
Return on equity
19.6%
Full year dividend
14.35p

Who New Position Background

Net release from operations
£1,411m Profit after tax
£1,265m Adjusted operating profit
£1,628m
Earnings per share1
22.20p Full year dividend
14.35p IFRS return on equity2
19.6%

2012 2013 2014 2015 2016
NET RELEASE FROM
OPERATIONS (£m) 846 865 1,002 1,104 1,256 1,411
DIVIDEND (£m) 375 452 550 668 797 854
NET RELEASE FROM
OPERATIONS RETAINED (£m) 471 413 452 436 459 557
DIVIDEND COVERAGE 2.26 1.91 1.82 1.65 1.58 1.65
DIVIDEND PER SHARE (p) 6.40 7.65 9.30 11.25 13.40 14.35
RETURN ON EQUITY (%) 14.9 15.4 16.1 16.9 17.71 19.62
EARNINGS PER SHARE (p) 12.42 13.84 15.20 16.70 18.581 22.202
BOOK VALUE PER SHARE (p) 86 92 94 100 106 116

Growth drivers 2016 achievements
Ageing
demographics
•
•
•
•
Globalisation of
asset markets
•
•
•
•
•
•
Creating real assets •
•
•
Welfare reforms •
•
•
•
Technological
innovation
•
•
•
Today’s capital •
•

7.65
9.30
11.25
13.40 14.35
2012 2013 2014 2015 2016
Growing net release from operations (£m) Consistent earnings per share growth1 (p)
865 1,002
1,104
1,256 1,411
2012 2013 2014 2015 2016
13.84 15.20
16.70
18.58
22.20
2012 2013 2014 2015 2016
Increasing return on equity1 (%)
15.4 16.1
16.9 17.7
19.6
2012 2013 2014 2015 2016
Increasing dividend per share (p)

Net release from operations
£1,411m
Operating profit
£1,628m
Profit before tax
£1,582m

2016 2015 YoY (%)
ASSETS &
PREMIUMS
CASH &
EARNINGS
CAPITAL
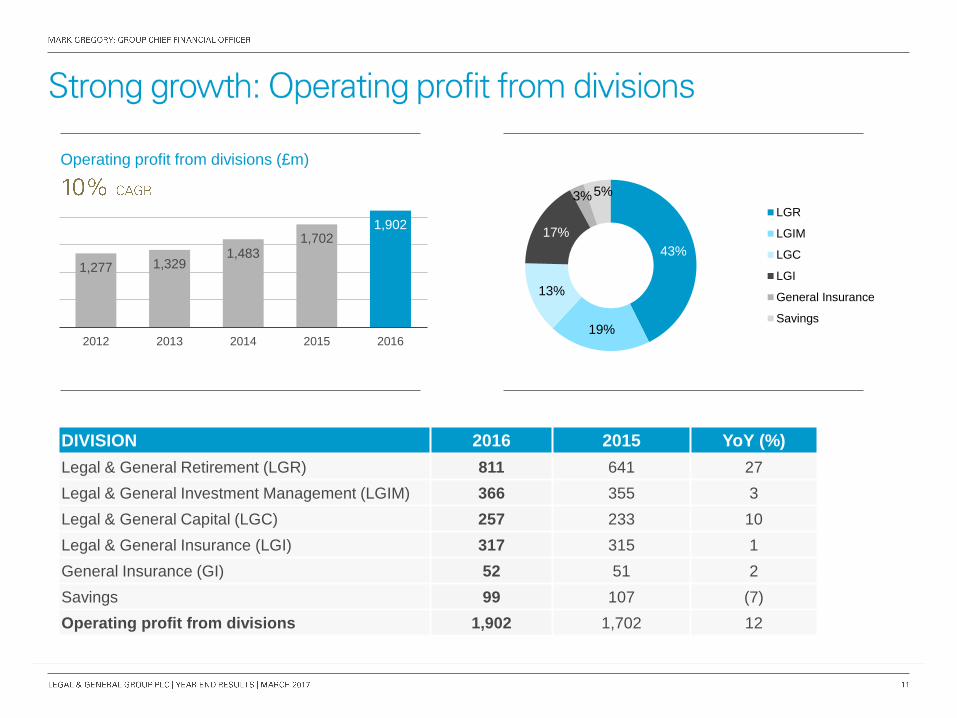
DIVISION 2016 2015 YoY (%)
Legal & General Retirement (LGR) 811 641 27
Legal & General Investment Management (LGIM) 366 355 3
Legal & General Capital (LGC) 257 233 10
Legal & General Insurance (LGI) 317 315 1
General Insurance (GI) 52 51 2
Savings 99 107 (7)
Operating profit from divisions 1,902 1,702 12
Operating profit from divisions (£m)
1,277 1,329 1,483
1,702 1,902
2012 2013 2014 2015 2016
43%
19%
13%
17%
3% 5%
LGR
LGIM
LGC
LGI
General Insurance
Savings

LGIM AUM growth (£bn) LGR assets growth (£bn)
543 612
694 746
894
2012 2013 2014 2015 2016
32.2 34.4
44.2 43.4
54.4
2012 2013 2014 2015 2016
2.2
2.4
2.5
2.6
2.7
2012 2013 2014 2015 2016
1.3 2.7
5.7
7.2
10.0
2012 2013 2014 2015 2016
UK & US Insurance premium growth (£bn) Direct Investments (£bn)

1.66p 1.96p 2.40p 2.90p 3.45p 4.00p
4.74p 5.69p 6.90p
8.35p 9.95p
10.35p
2011 2012 2013 2014 2015 2016
13.40p 14.35p
6.40p
7.65p
9.30p
11.25p
DIVIDEND

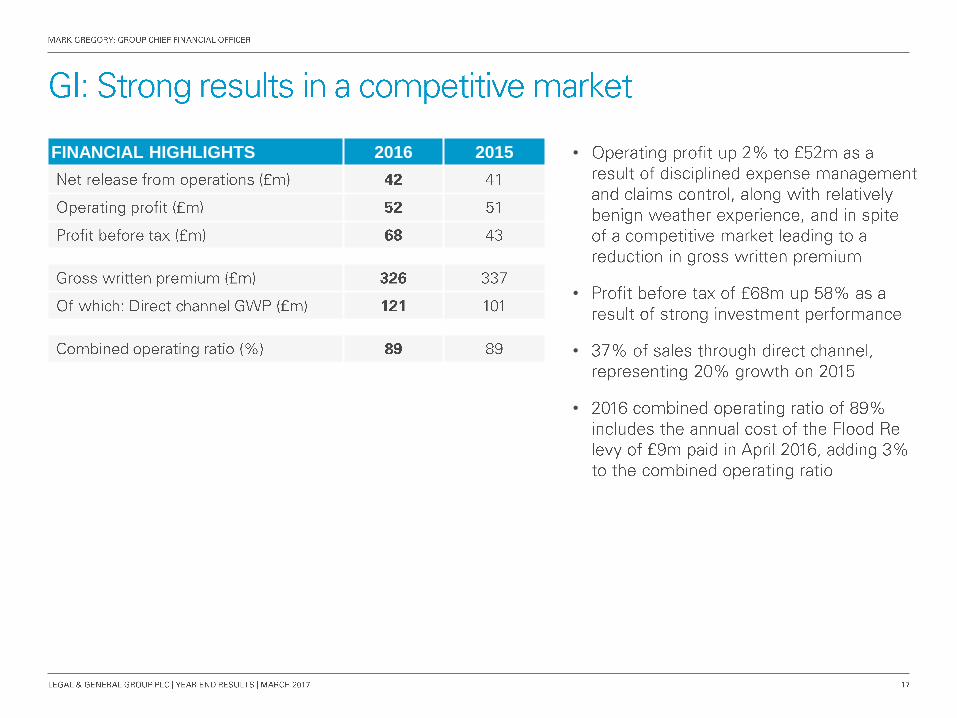
FINANCIAL HIGHLIGHTS 2016 2015 •
•
•

FINANCIAL HIGHLIGHTS 2016 2015 •
•
•
•
•
FINANCIAL HIGHLIGHTS 2016 2015 •
•
•
•
•
•
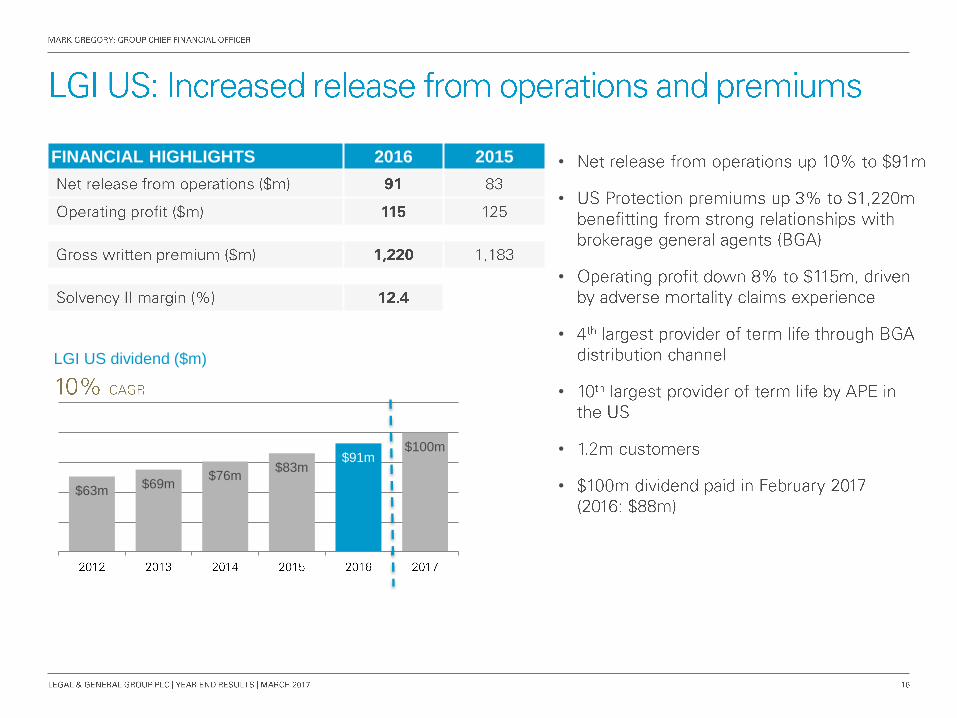
•$63m $69m
$76m $83m
$91m $100m
LGI US dividend ($m)
FINANCIAL HIGHLIGHTS 2016 2015 •
•
•
•

•
•
•
•
•
FINANCIAL HIGHLIGHTS 2016 2015
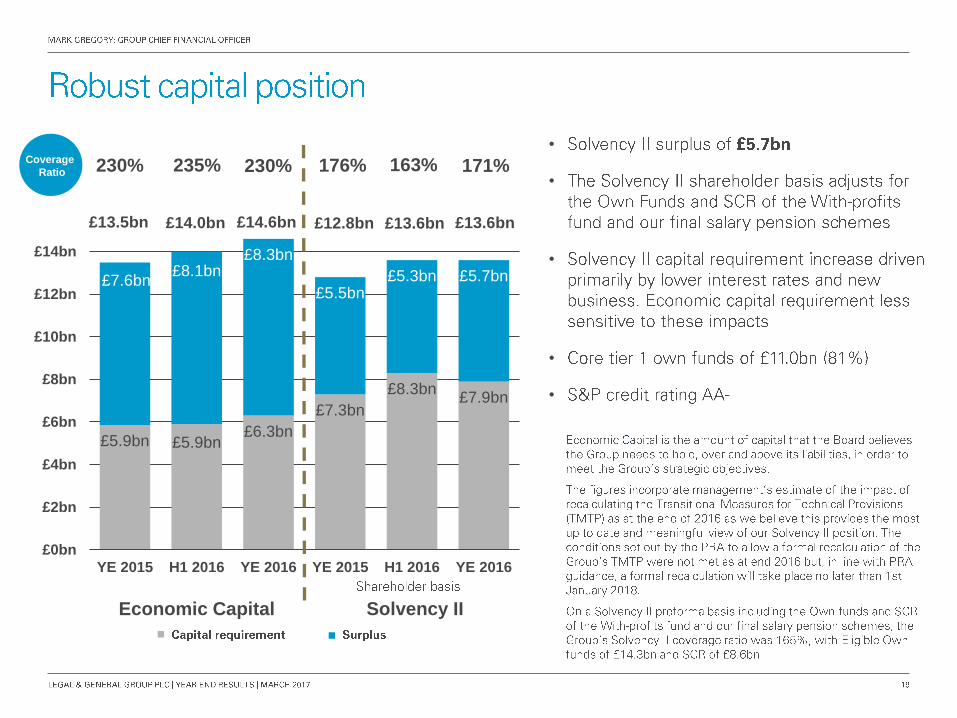
£5.9bn £5.9bn £6.3bn
£7.3bn
£8.3bn £7.9bn
£7.6bn £8.1bn
£8.3bn
£5.5bn £5.3bn £5.7bn
£0bn
£2bn
£4bn
£6bn
£8bn
£10bn
£12bn
£14bn
YE 2015 H1 2016 YE 2016 YE 2015 H1 2016 YE 2016
176% 230%
CAPITAL POSITION
•
•
•
•
•
Economic Capital Solvency II
Coverage
Ratio 230% 171%
£13.5bn £14.6bn £12.8bn £13.6bn £14.0bn
235% 163%
£13.6bn

2016
£bn Comments
Operational surplus generation 1.2 •
New business strain (0.1) •
•
Net Surplus Generation 1.1
Dividends paid (0.8) •
Operating variances 0.2
Market movements (0.3)
Total Surplus over year 0.2

•
•
•
•
•
FY 2016 PVNBP
Contribution
from New
Business
Margin %
6,661 693 10.4
1,466 153 10.4
1,255 139 11.1
211 14 6.6
631 78 12.4
8,758 924 10.6

Operating profit
£811m
New business sales
£8.5bn
AUA
£54.4bn

FINANCIAL HIGHLIGHTS 2016 2015 •
•

Back book for cash
and capital
•
•
Back book acquisitions
•
•
•
UK capital efficient
front book
•
•
•
Longevity Insurance •
•
US pension risk transfer •
•
Global reinsurance hub •
Individual retirement •
•
Lifetime mortgage •
•

2013 2014 2015 2016
Internal
External
£1,277m
£591m
£327m £378m
•
•
•
•
•

0
10
20
30
40
50
0
200
400
600
800
Q1 15 Q2 15 Q3 15 Q4 15 Q1 16 Q2 16 Q3 16 Q4 16
L&G Others L&G Market Share
29% in 2016
•
•
•
Sales £m Market share %
•
•
•

.. WHILST MAINTAINING OVERALL CREDIT QUALITY &
HIGH SECTORAL DIVERSIFICATION
2016 by
Credit
Rating
2016 by
Sector
•
•
•
INCREASING PROPORTION OF DIRECT
INVESTMENTS
BB or below
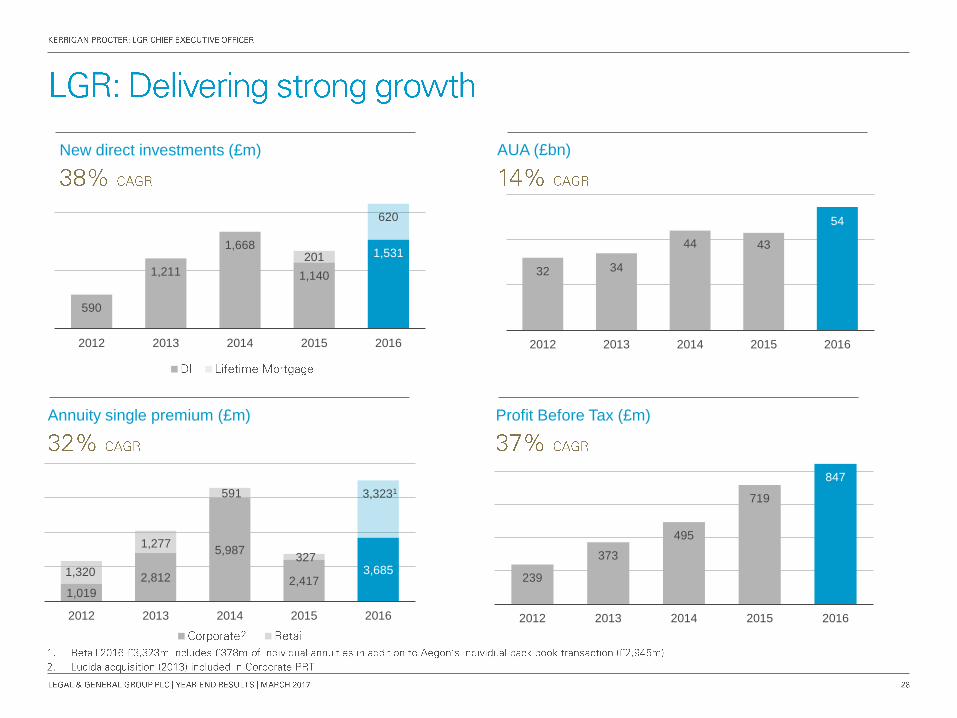
590
1,211
1,668
1,140
1,531 201
620
2012 2013 2014 2015 2016
Annuity single premium (£m)
New direct investments (£m)
Profit Before Tax (£m)
239
373
495
719
847
2012 2013 2014 2015 2016
32 34
44 43
54
2012 2013 2014 2015 2016
AUA (£bn)
1,019
2,812
5,987
2,417 3,685 1,320
1,277
591
327
3,3231
2012 2013 2014 2015 2016
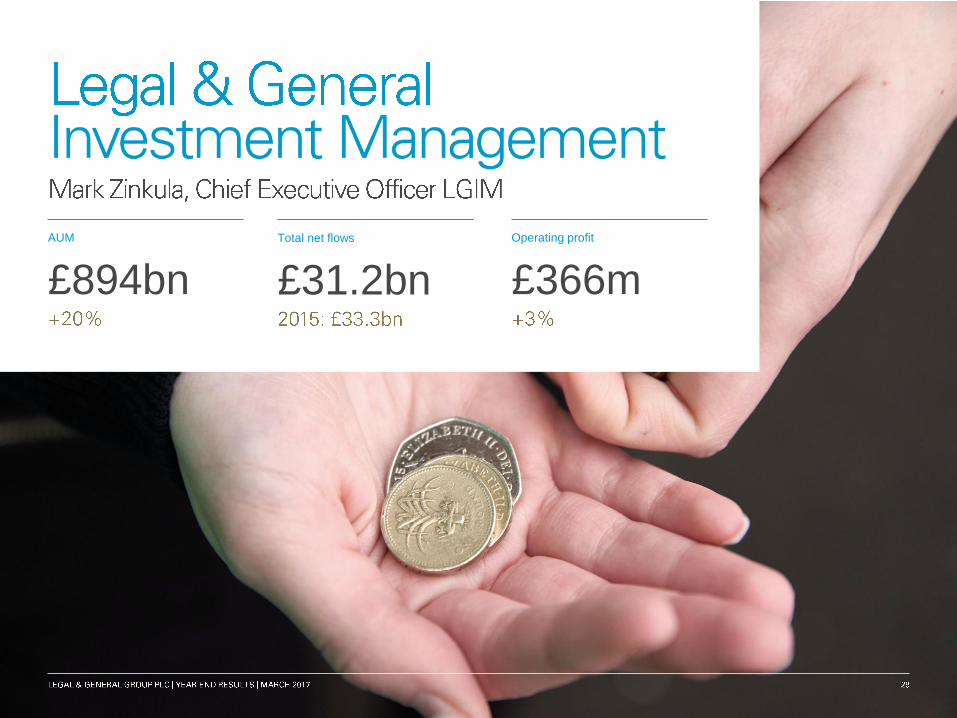
AUM
£894bn
Total net flows
£31.2bn
Operating profit
£366m
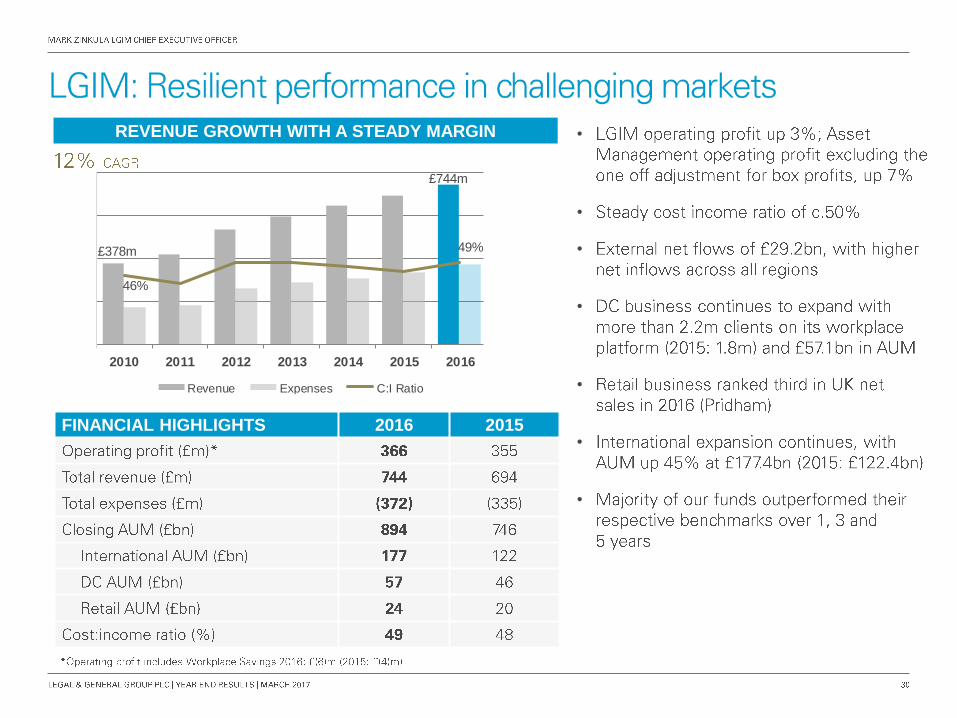
£378m
£744m
46%
49%
30
35
40
45
50
55
60
65
70
0
200
400
600
800
2010 2011 2012 2013 2014 2015 2016
Revenue Expenses C:I Ratio
FINANCIAL HIGHLIGHTS 2016 2015
•
•
•
•
•
•
•
REVENUE GROWTH WITH A STEADY MARGIN
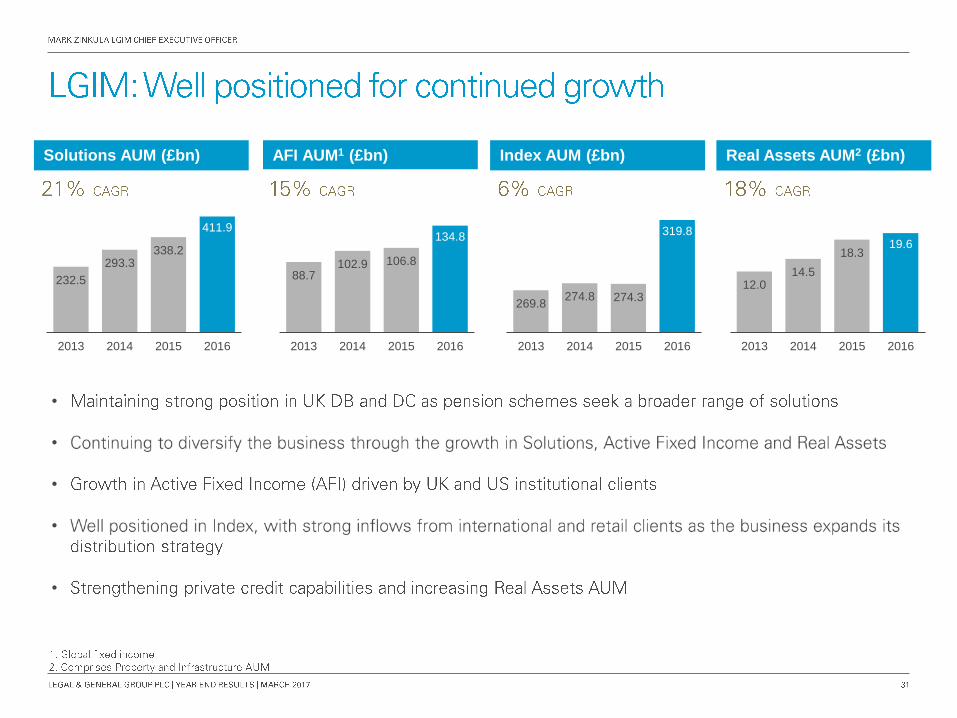
88.7 102.9 106.8
134.8
2013 2014 2015 2016
Solutions AUM (£bn) Index AUM (£bn) Real Assets AUM2 (£bn)
•
•
•
•
•
232.5
293.3 338.2
411.9
2013 2014 2015 2016
269.8 274.8 274.3
319.8
2013 2014 2015 2016
12.0 14.5
18.3 19.6
2013 2014 2015 2016
AFI AUM1 (£bn)

Time
Buy-out
DGFs
LDI
Real Assets
Buy and
Maintain
Credit
c.£2.1trn
buy-out
liabilities
Multi-Strat
Credit
Smart
Beta
DGFs
Funding
level
63%
Equities
Credit
Gilts
UK DB PENSION SOLUTIONS JOURNEY
OUTCOME ORIENTATED
SELF
SUFFICIENCY
MARKET BENCHMARK
INSURANCE
LDI
•
•
•

28
34
41 46
57
6 8 11
15
21
2012 2013 2014 2015 2016
DC AUM and AUA growth (£bn) DC client growth Retail AUM (£bn)
•
•
•
•
•
•
•
DC AUM
13
17 18 20
24
2012 2013 2014 2015 2016
2012 2013 2014 2015 2016
2,153
9,493
473
2,241
2012 2013 2014 2015 2016

46
252
-100-80-60-40-20020406080100120140160180200220240260280
0
50
100
150
200
250
2012 2013 2014 2015 2016
Other International Assets US Assets US Clients
•
•
•
•
•
•
•
•
International AUM Growth (£bn)
£43bn
£177bn
International Net Flows (£bn)
2012 2013 2014 2015 2016
Other International Flows US Flows
£8bn
£14.5bn
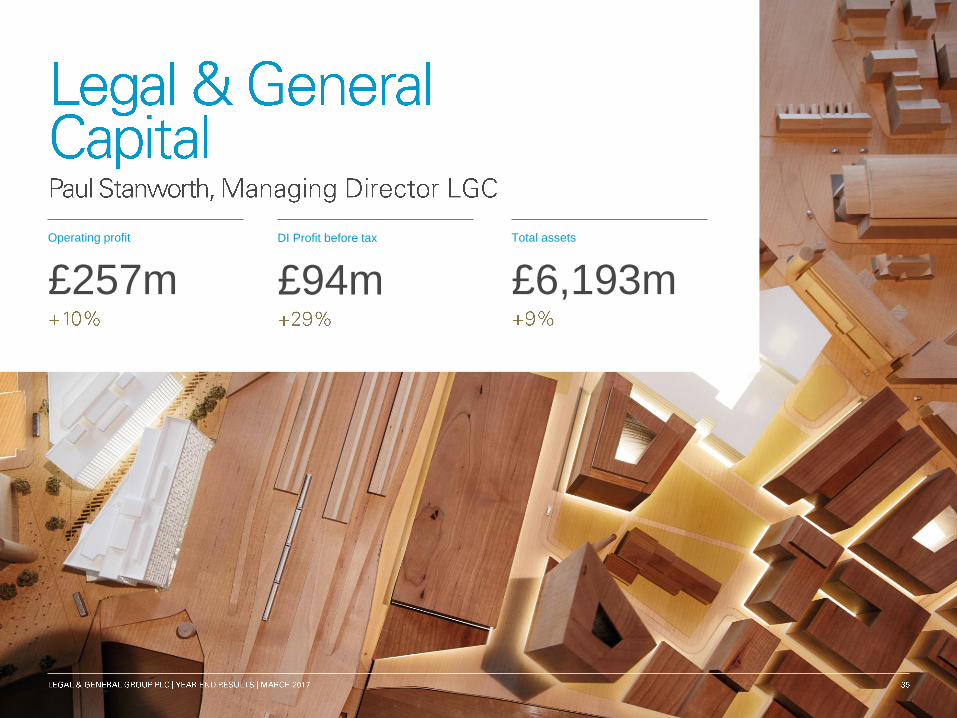
Operating profit
£257m
DI Profit before tax
£94m
Total assets
£6,193m

FINANCIAL HIGHLIGHTS 2016 2015 •
•
•
•

What we do How we achieve this
Maximise risk
adjusted returns
•
•
•
Create new
asset classes and
business models
•
•
•
Provide investment
opportunities for
the Group
•
•
•
Acquire Develop Sell
Internal
External

•
•
•
•
•
•
•
•
•
•
Acquire
Sell
Develop

179
257
2013 2016
Operating Profit – LGC total (£m)
Net portfolio return – Direct Investments (%) Operating Profit – Direct Investments (£m)
Total Assets - Direct Investments (£m)
23
121
2013 2016
351
1,137
2013 2016
4.7%
9.0%
2013 2016

Sector Macro theme Scaling up
businesses
Developing new
businesses
Housing •
•
•
•
•
•
•
•
•
•
•
Infrastructure
•
•
•
•
•
•
•
•
SME Finance
•
•
•
• •
•

Earnings per share
22.20p
Return on equity
19.6%
Full year dividend
14.35p


“What we are doing” 2016 2017 onwards
Robotics
•
•
•
•
Big Data
•
•
Platforms
•
•
•
Cloud •
•
•
Artificial Intelligence
Blockchain
•

846 865 1,002
1,104
1,256
1,411
2011 2012 2013 2014 2015 2016 2020
Earnings per share (p)
12.42 13.84
15.20 16.70
18.58
22.20
2011 2012 2013 2014 2015 2016 2020
Net release from operations (£m)
•
•
•
•
•
•