Embed Size (px)
Citation preview

Presentation

Water at a Glance•Water take from Heretaunga Plains aquifer•Water is provided for:
• Domestic needs• Commercial/business/industrial needs• Fire fighting needs
•Current city population approximately 61,000•Napier is a medium growth area•Two distinct supply areas
• Napier supply area (universally metered)• Bay View supply area (high water users are metered)
• Water permit expires in 2027

Asset Types•Bores – 10 (9 in operation)•Pipes – 481 km•Reservoirs – 11 (on 8 sites, approximate storage
29,000,000 litres, average 24 hour usage)•Booster pump stations – 8•Total Water Connections – 25,550

Scheme Schematic

Consented Volumes vs Actuals and ProjectionsCondition Allowed limits
of takeCurrent maximum takefrom all bores
Estimated 2048 maximum take no change in per capita consumption, 440 l/pers./day (excluding wet industries)
Estimated 2048 maximum take, targeted future per capita consumption 300 l/pers./day (excluding wet industries)
Cumulative rate of take of water from all bores
784 litres/sec 606 litres/sec 790 litres/sec <600 litres/sec
Cumulative 7 day maximum take from all bores
387,744 cubic meters
283,000 327,550 223,325

Population Growth:HPUDS and NPS - UDC
• Local authorities shall ensure that there is sufficient housing and business land development capacity in the short (3 years), medium (3-10 years) and long term (10 – 30 years)
• Development capacity means the provision of adequate infrastructure (water supply, wastewater and stormwater)
• Degree of conflict between NPS - FWM and NPS - UDC
Water Conservation Strategy•Public education •Pressure management•District zoning and monitoring•Targeted leak detection•Dedicated water taking points•Asset renewals•Water restrictions•Benchmarking with Water NZ•Annual water balance report•Universal water metering
(long term option – decision of Council)

Targeted per Capita Consumption (gross)Year Current
consumption litres/capita/day
Aspirational Targeted consumption litres/capita/day
How we are achieving the target
2018 440 N/A N/A
2023 N/A 425 Water conservation strategy, no universal metering
2028 N/A 400 Water conservation strategy, no universal metering
2033 N/A 300 Water conservation strategy, universal metering
2038 N/A 300 Water conservation strategy, universal metering
2043 N/A 300 Water conservation strategy, universal metering
2048 N/A 300 Water conservation strategy, universal metering

Projections

Water Quality
•Major focus•Sources of contamination
• Catchment – land use, existing bores, decommissioned/unused bores, spillages
• Bores – bore structure, headworks, proximity of sewer system
• Reservoirs – vermin/contaminants entry points• Reticulation – backflow, pipe breaks

Priorities
•Catchment protection – working together with other stakeholders
•Water conservation – sustainable water source
•Enable growth – minimise usage and waste to cater future demand
•Water treatment

Capital Investments next 30 years
•Water quality improvements - $9.6 million
•Future demand - $20.6 million
• Improve level of service (flow, pressure)- $2 million
•Renewals - $45.2 million
Future urban water focus
•Support sustainable use of the aquifer
•Support fair and equitable approach…
•Support future population growth
•Support economic development
•Recognise cultural values

STORMWATER

Stormwater at a Glance
•Majority of catchment flat and low lying•13 sub-catchments (total of 6,055 ha)•Drainage is extensively reliant upon an open drain
system•Approximately 68% of stormwater discharged into
Estuary•Approximately 75% of stormwater pumped into
Estuary or sea

Stormwater catchment

Desired Standards for Network capacity
•Provide flood protection from rain event of 50 year return period
•Primary stormwater system designed to convey stormwater from a rain event of 10 year return period
•Secondary stormwater system designed to convey stormwater from a rain event of 50 year return period
•No adverse effect on receiving environment

Stormwater Issues•Currently can not meet the desired standards in many
areas
•Uncertainties over ownership of some stormwaterassets
•Stormwater quality issues
•Growth pressure
•Climate change

What is Planned?
•Construction of a 2D hydraulic model•Develop a master plan for the next 30 years to meet
the desired standards• Improve water quality
• Ahuriri Master Plan• Catchment Management Plans
•Promote low impact design concepts• Updated District Plan• Review of Engineering Code of Practice

30 Year Capital Investment Programme
• Improve level of service • Discharge quality improvements - $11.7 million• Capacity improvements - $24.3 million
•Growth - $24.9 million
•Renewals - $25.9 million

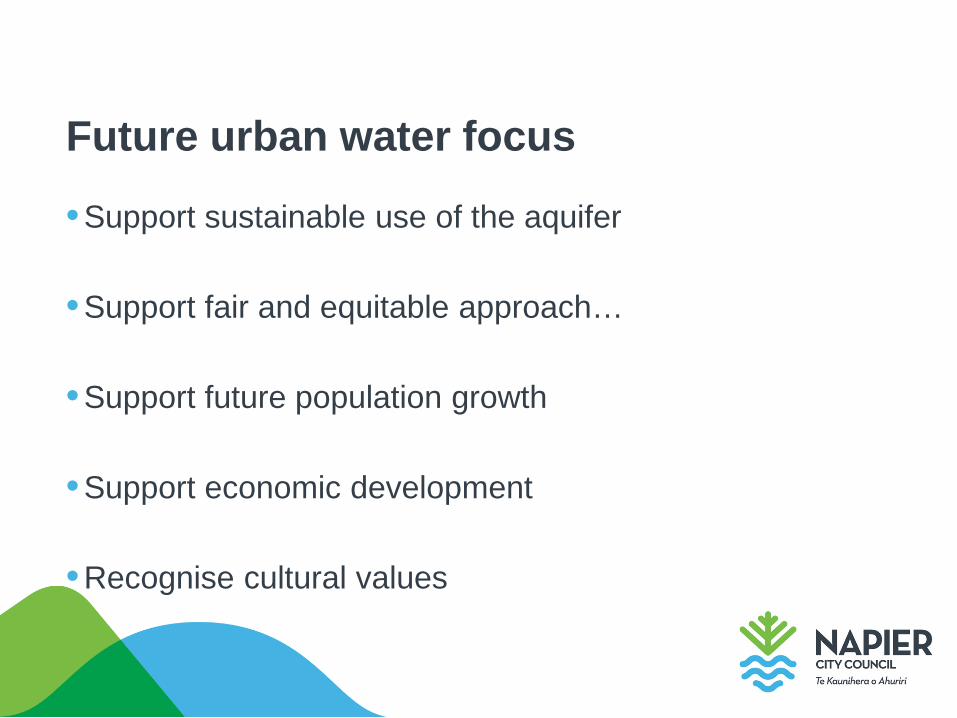
Opportunities

Stormwater CycleOpportunities
Opportunities

Opportunities

Opportunities