Embed Size (px)
Citation preview

March 2018
Investor Presentation

2
Forward-Looking Statements and Preliminary Financial Information
This presentation includes “forward-looking statements” within the meaning of the “safe harbor” provisions of the United States Private Securities Litigation Reform Act of 1995. Forward-looking statements are often identified by the use of words such as “believe,” “intend,” “expect,” “estimate,” “plan,” “outlook,” “project,” “anticipate,” “may,” “will,” “would” and other similar words and expressions that predict or indicate future events or trends that are not statements of historical matters. Forward-looking statements include statements related to the Company’s financial outlook (including statements regarding agent count, revenue, free cash flow and Adjusted EBITDA margins), dividends, future acquisitions, franchise sales, the benefits of the acquisition of booj, the Company’s strategic and operational plans and business models, and the housing and mortgage markets. Forward-looking statements should not be read as a guarantee of future performance or results, and will not necessarily accurately indicate the times at which such performance or results may be achieved. Forward-looking statements are based on information available at the time those statements are made and/or management’s good faith belief as of that time with respect to future events, and are subject to risks and uncertainties that could cause actual performance or results to differ materially from those expressed in or suggested by the forward-looking statements. Such risks and uncertainties include, without limitation, (1) the impact of the findings and recommendations of the Special Committee on the Company and its management and operations, including reputational damage to the Company and the time and expenses incurred in implementing the recommendations of the Special Committee, (2) that, while the Special Committee investigation has been completed, the full implications of the investigation on the Company and its operations are still being evaluated and there may be unanticipated adverse or negative consequences that are not identified at this time, including reputational damage to the Company as well as the time and expense incurred in implementing the recommendations of the Special Committee, (3) any legal proceedings or governmental or regulatory investigations or actions directly or indirectly related to the underlying matters of the recently completed Special Committee’s internal investigation may result in adverse findings, the imposition of fines or other penalties, increased costs and expenses, and the diversion of management’s time and resources to address such matters, any of which may have a material adverse effect on the Company, (4) the impact of recent changes to our senior management team, (5) the impact of disclosing previously undisclosed transactions between members of our management team, including the loan from David Liniger to Adam Contos, (6) the existence and identification of control deficiencies, including disclosure controls or internal controls over financial reporting, and any impact of such control deficiencies as well as the associated costs in remediating those control deficiencies, (7) changes in business and economic activity in general, (8) changes in the real estate market or interest rates and availability of financing, (9) the Company’s ability to attract and retain quality franchisees, (10) the Company’s franchisees’ ability to recruit and retain real estate agents and mortgage loan originators, (11) changes in laws and regulations, (12) the Company’s ability to enhance, market, and protect the RE/MAX and Motto Mortgage brands, (13) fluctuations in foreign currency exchange rates, and (14) the impact of the Tax Cuts and Jobs Act, as well as those risks and uncertainties described in the sections entitled “Risk Factors” and “Management’s Discussion and Analysis of Financial Condition and Results of Operations” in the most recent Annual Report on Form 10-K filed with the Securities and Exchange Commission (“SEC”) and similar disclosures in subsequent periodic and current reports filed with the SEC, which are available on the investor relations page of the Company’s website at www.remax.com and on the SEC website at www.sec.gov. Readers are cautioned not to place undue reliance on forward-looking statements, which speak only as of the date on which they are made. Except as required by law, the Company does not intend, and undertakes no obligation, to update this information to reflect future events or circumstances.

3
Why Invest in RE/MAX Today?
Organic Growth Catalysts Return of Capital
Shareholder Return Driven By
Stable recurring revenue
High margin & Strong
Free Cash Flow
Driven by:
1) Agent growth
2) Franchise sales
3) Motto Mortgage
4) Steadily improving
housing market
Independent region
acquisitions
Reinvest in the business
Other acquisitions within
our core competencies of
franchising and real
estate
Committed to returning
capital through dividend
payments over time
Dividend metrics:
– ~36% of FCF in 20171
– $0.20 quarterly dividend
FCF Fuels Catalysts and Return of Capital to Create Shareholder Value
1Free Cash Flow (“FCF”) = Operating Cash Flow – Capital Expenditures; $22M 2017 quarterly dividend payments / $61M 2017 FCF = 36%; see Appendix forreconciliation of non-GAAP measures

4
$64.9
$103.9
2012 2017
$49.6
61.2
2012 2017
$143.7
$195.9
2012 2017
89,008
119,041
2012 2017
Sustained Growth & Expanding Margins
46%
margin
53%
margin
$’s in MillionsAgent Count Revenue
Free Cash Flow1Adjusted EBITDA1
1Non-GAAP measure. See Appendix for reconciliation of Non-GAAP measures

5
Steady demand for housing
Attractive mortgage rates
Housing starts improving
Steady jobs growth
Household formations
forecasted to grow
First-time homebuyers
entering the market
Wage growth
Constrained inventory
Single-family home starts
Access to credit
Housing Market Gradually Improving
Drivers Opportunities

6
Acquisition of booj: A Real Estate Technology CompanyKey component of RE/MAX Technology Strategy
RE/MAX will leverage the capabilities of booj and other strategic partners to deliver
core technology solutions designed for and with RE/MAX affiliates. The objective:
technology platforms that create a distinct competitive edge for RE/MAX brokerages
and agents and complement other technology products they choose to use.
Financial Considerations
Expect minimal financial impact to Q1 2018
Expect $0.03-$0.05 per share reduction to
Adjusted EPS in FY18
Funded via cash on hand
Financial terms not disclosed
booj, established in 2005, has created proven real estate technology enabling the
success of independent brokerages and agents across the U.S.
These platforms, designed by and for the real estate industry, include websites,
mobile apps, lead generation and cultivation systems and predictive analytics
Talented and deep roster of real estate technology developers and strategists
booj Background

7
The Real Estate Franchisor

8
Unique product or service offering
Brand name and market share
Training and productivity tools
Group purchasing power
Hallmarks of a Successful Franchise Business
Key Success Factors of
FranchisorsSuccessful Franchisors

9
RE/MAX is a Premium Franchisor
Nobody in the world sells more Real
Estate than RE/MAX1
100% franchised business, delivering
the full economic benefits of the model
Dual-brand franchisor, focused on our
core businesses
Among the best-in-class franchisor
operating margins
1As measured by residential transaction sides

10
Transactions Per
Agent
(Large brokerages only)1
U.S. Residential
Transaction Sides2
Brand Awareness
(unaided) 3
Countries and
Territories
Offices
Worldwide
Agents
Worldwide
17.2 1 million+ 27.6% 100+ 7,343 111,915
6.8 977,603 7.3% 16 800 154,979
8.4 727,415 14.2% 49 3,000 88,400
8.2 420,184 19.7% 77 7,300 110,800
8.2 128,812 1.1% 31 2,300 37,900
6.5 111,950 2.1% 66 850 20,300
6.9 70,980 0.6% 3 300 10,900
9.2 Not Released 4.3% 1 1,240 42,747
RE/MAX Agents Outsell Other Agents by More Than 2 to 1 at Large Brokerages
Ranking RE/MAX vs. Other National Real Estate Franchise Brands
Realogy Brand
Data is full-year or as of year-end 2016, as applicable. Except as noted, Coldwell Banker, Century 21, ERA, Sotheby’s and Better Homes and Gardens data is as reported by RealogyCorporation on SEC Form 10-K, Annual Report for 2016; Keller Williams, and Berkshire Hathaway HomeServices data is from company websites and industry reports1Two surveys of the largest participating U.S. brokerages. The 2017 REAL Trends 500 includes data for 1,705 brokerages with at least 500 transaction sides each. The RIS Media2017 Power Broker Report includes data for 1,000 brokerages with the highest sales volume and a minimum of 500 residential transaction sides each..²Keller Williams reports all transaction sides and does not itemize U.S. residential transactions.³MMR Strategy Group study of buyers and sellers, asked if there is one real estate brand they would be most likely to recommend to a friend or relative, and if so which one.

11
Among Highest Franchisor Adjusted EBITDA Margins1,2
57% 53%
27%
20%17%
15%12%
10%
Franchisors Real Estate Brokerages
1Adjusted EBITDA and Adjusted EBITDA margin are Non-GAAP measures. See Appendix for definitions and reconciliations of RE/MAX Non-GAAP measures.
Other companies may calculate this measure differently so these measures may not be comparable. This chart is for illustrative purposes only. Calculations
use financial statements from company public filings.2Choice Hotels and Domino’s do not report Adjusted EBITDA therefore EBITDA has been used for the calculation of the margin
Full-year 2016

12
the Mortgage Brokerage Franchisor

13
Motto Mortgage is a mortgage brokerage franchisor
Franchises are independently owned and operated
Motto Mortgage is not a lender and will not underwrite loans
Offers potential homebuyers the opportunity to find both real estate agents and
independent Motto Mortgage loan originators in offices in one location
Motto Mortgage loan originators access a variety of quality loan options from
multiple leading wholesalers
Ward Morrison leads Motto Mortgage with an operational team that scales as Motto
grows
Motto Mortgage franchises are available for purchase by select qualified real estate
professionals outside of RE/MAX
Motto Mortgage Fact Sheet

14
Motto Mortgage UpdateFocused on Enabling the Success of Initial Group of Franchisees
▪ Over 70 franchise sales in 29 states
during our first 16 months of operations
▪ Over 30 offices open
▪ Validating the concept with each new
office opened
▪ Scaling the business efficiently and
effectively
▪ Franchise sales in 2018 expected to be
comparable to 2017
▪ Will generally take ~14-17 months after
the sale of a franchisee to ramp to
paying a full set of monthly fees
As of February 22, 2018
15
Agent Count Growth

16
87,47689,008
93,228
98,010
104,826
111,915
119,041
2011 2012 2013 2014 2015 2016 2017
Global Agent Network Growing
+31,565 from 2011
through 2018
Strongest full-year
agent gain in 2017
since 2006
Added over 7,000
agents in 2017
Total Network Agent Count

17
53%
18%
29%
Unmatched Global Footprint
December 31, 2017
Canada21,112 Agents
Outside the U.S.
and Canada34,767 Agents
U.S.63,162 Agents
RE/MAX Regional or Franchise Presence
RE/MAX Global Footprint Agents by Geography
The RE/MAX brand spans over 100 countries and territories
December 31, 2017

18
111,915
82,402
29,513
119,041
84,274
34,767
Total RE/MAX U.S. & Canada Outside U.S. & Canada
Growing Our Global Network Year-over-Year Agent Count Growth of 6.4%
(+7,126 agents)
+6.4% YoY
+2.3% YoY(+1,872 agents)
+17.8% YoY(+5,254 agents)
December 31, 2016 December 31, 2017
Agent Count Growth Year-over-Year

19
Agent Count in the U.S. and Canada Increases
Agents in the U.S.
Agent Count Growth FY 2017 over FY 2016
Agents in Canada
+2.1%(+440 Agents)
+2.3%(+1,432 Agents)

20
Business Model

21
Owned & operated by brokerage
30-40% of commission goes to broker
Commission rate typically determined
by brokerage, not agent
Lack of autonomy within brokerage
Marketing dictated by brokerage
100% franchised
Recommended 95% agent commission
Ability for agent to set commission
rates with sellers in many cases
Entrepreneurially driven agents
Multiple support channels: brand,
marketing & training
Revenue Driven by Commission Revenue Driven by Agent Count
Agent-Centric Model is Unique and Effective
Traditional Brokerage The RE/MAX Model
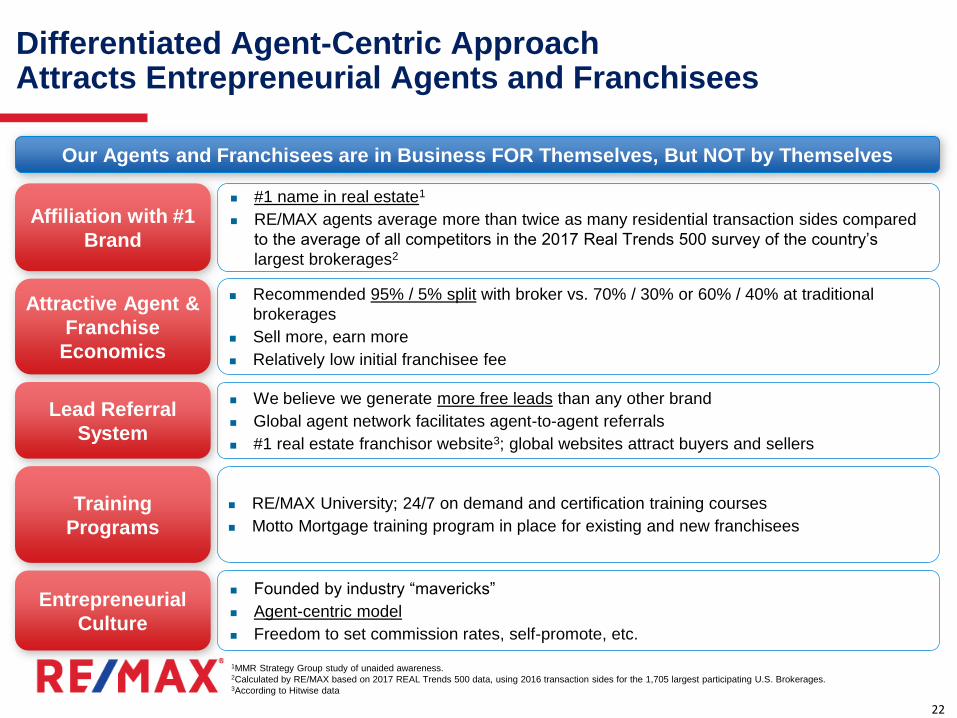
22
#1 name in real estate1
RE/MAX agents average more than twice as many residential transaction sides compared
to the average of all competitors in the 2017 Real Trends 500 survey of the country’s
largest brokerages2
Founded by industry “mavericks”
Agent-centric model
Freedom to set commission rates, self-promote, etc.
We believe we generate more free leads than any other brand
Global agent network facilitates agent-to-agent referrals
#1 real estate franchisor website3; global websites attract buyers and sellers
Our Agents and Franchisees are in Business FOR Themselves, But NOT by Themselves
1MMR Strategy Group study of unaided awareness.2Calculated by RE/MAX based on 2017 REAL Trends 500 data, using 2016 transaction sides for the 1,705 largest participating U.S. Brokerages.3According to Hitwise data
Affiliation with #1
Brand
Attractive Agent &
Franchise
Economics
Entrepreneurial
Culture
Lead Referral
System
Training
Programs
RE/MAX University; 24/7 on demand and certification training courses
Motto Mortgage training program in place for existing and new franchisees
Recommended 95% / 5% split with broker vs. 70% / 30% or 60% / 40% at traditional
brokerages
Sell more, earn more
Relatively low initial franchisee fee
Differentiated Agent-Centric Approach Attracts Entrepreneurial Agents and Franchisees

23
Reacquiring Independent Regions Increases Revenue Per Agent by ~$1,850
67% of Agents in the U.S. & Canada are in
Company-owned Regions1
Washington
Oregon
Idaho
Montana
California
Hawaii
ColoradoUtah
Wyoming
SouthDakota
NorthDakota
Texas
Pennsylvania
Delaware
Florida
North Carolina
South Carolina
BritishColumbia
Alberta
Saskatchewan
Manitoba
Yukon
U.S./Canada Overview1
Company-owned Regions
– 19 regions
– 56,293 agents
Independent Regions
– 9 regions
– 27,981 agents
Average Annual Revenue per
Agent
– Company-owned regions:
~$2,600
– Independent regions:
~$750
Company-owned Regions
Independent Regions
Nevada
Arizona New Mexico
Maryland
Virginia
WestVirginia
Missouri
Illinois
Ohio
Northwest
TerritoriesNunavut
1Agent counts and average revenue to RE/MAX, LLC per agent is for the year ended December 31, 2017
New York
Alaska
New Jersey
Georgia

24
Agents
RE/MAX
Franchises / Brokerages
Independent Regions
$410 / AgentPer Year
Recommended5% of AgentGeneratedCommissions
Fixed Monthly
Management Fee
ContinuingFranchise
Fee
1% of Agent GeneratedCommissions
15%-30%of Continuing Franchise / Broker Fee Revenue
Implied
70%-85%
Upside
Through
Independent
Region
Acquisitions
~$300 /
Agent
Average
~$100 /
Agent
Average
~$350 /
Agent
Revenue Model Independent Regions in U.S. & Canada
~$750 / Agent
Average
Revenue Streams from Agent to
Franchisee to Independent Region to RE/MAX1
2017 Annual Revenue per Agent to RE/MAX
(U.S. & Canada)2
Annual DuesBroker FeeContinuing
Franchise Fees1Illustrative of independent regions in the U.S.2Annual dues are currently a flat fee of US$410/CA$410 per agent annually for our U.S. and Canadian agents. The average per agent for
the year ended December 31, 2017 in Independent Regions reflects the impact of foreign currency movements related to revenue
received from Canadian agents. The ratio of Canadian agents to U.S. agents in Independent Regions has increased as a result of U.S.
Independent Region acquisitions.
Increased from
$400 July 1, 2017

25
~$2,600 / Agent
Average
Revenue ModelCompany-owned Regions in U.S. & Canada
~$1,450 /
Agent
Average
~$750 /
Agent
Average
~$400 /
Agent
RE/MAX
Franchises / Brokerages
$410 / AgentPer Year
Recommended5% of AgentGeneratedCommissions
$128 / Agent Per Month
1% of Agent GeneratedCommissions
Agents
Revenue Streams from Agent to
Franchisee to RE/MAX1
2017 Annual Revenue per Agent to RE/MAX
(U.S. & Canada)2
Annual DuesBroker FeeContinuing
Franchise Fees
Increased from
$123 July 1, 2016
Fixed Monthly
Management Fee
1Illustrative of company-owned regions in the U.S.2Annual dues are currently a flat fee of US$410/CA$410 per agent annually for our U.S. and Canadian agents. The average per agent for
the year ended December 31, 2017 in company-owned regions reflects the impact of foreign currency movements related to revenue
received from Canadian agents. The ratio of Canadian agents to U.S. agents in Independent Regions has increased as a result of U.S.
Independent Region acquisitions.
Increased from
$400 July 1, 2017

26
Key Initiatives
Target underpenetrated
geographies in the U.S.
and Canada where
RE/MAX share is below
network average
Selling to entrepreneurial
brokers who will grow the
business
Best global franchise sales
in over a decade
Global Franchise Sales Consistently Strong
Franchise Sales Drive Agent Growth
714 729692
752
929 903
1,059
87,47689,008
93,228
98,010
104,826
111,915
119,041
80,000
85,000
90,000
95,000
100,000
105,000
110,000
115,000
120,000
125,000
0
200
400
600
800
1,000
1,200
2011 2012 2013 2014 2015 2016 2017
Franchise Sales Agents

27
Financials

28
1Adjusted EBITDA and Adjusted Net Income are Non-GAAP measures. See Appendix for definitions and reconciliations of Non-GAAP measures.
Annual Financial PerformanceGenerating High Margins
Revenue Adjusted EBITDA1 Adjusted Net Income1
51%
($M) ($M) ($M)
Stable, High Adjusted
EBITDA Margins53% 53%
$177 $176
$196
2015 2016 2017
$90 $94$104
2015 2016 2017
$48 $52 $57
2015 2016 2017

29
Quarterly Financial PerformanceGenerating High Margins
53%51% 60%Stable, High Adjusted
EBITDA Margins
Revenues Adjusted EBITDA1 Adjusted Net Income1
($M) ($M) ($M)
47% 52%
1Adjusted EBITDA and Adjusted Net Income are Non-GAAP measures. See Appendix for definitions and reconciliations of Non-GAAP measures.
$44
$48 $49 $49 $50
Q4 2016 Q1 2017 Q2 2017 Q3 2017 Q4 2017
$23 $22
$29$26 $26
Q4 2016 Q1 2017 Q2 2017 Q3 2017 Q4 2017
$12 $12
$16$14 $14
Q4 2016 Q1 2017 Q2 2017 Q3 2017 Q4 2017

30
83%
12%
5%
48%
17%
22%
13%
Revenue by Stream and Geographic AreaGrowing Recurring Revenue Base
Revenue Streams Revenue by Geographic Area
U.S.
Canada
Outside the U.S.
and Canada
Recurring fees and dues (i.e. Continuing
Franchise Fees and Annual Dues) accounted for
65% of revenue in 2017
~95% of 2017 revenue
was generated in the U.S.
and Canada
Franchise Sales & Other
Franchise Revenue
Broker Fees
Annual Dues
Continuing
Franchise Fees

31
Maturities of Debt1 Balance Sheet
▪ Credit facility of $235.0 million plus $10.0 million
revolving credit facility
▪ Covenant light deal
▪ Variable Rate: LIBOR + 275bps with 0.75% floor
▪ $229.0 million in term loans1 and no revolving
loans outstanding
▪ Cash balance of $50.8 million on December 31,
2017
▪ Total Debt / Adjusted EBITDA of 2.2x2
▪ Net Debt / Adjusted EBITDA of 1.7x3
Low Leverage to Support Strategy
$2.4 $2.4 $2.4 $2.4 $2.4 $220.3
2018 2019 2020 2021 2022 Thereafter
1Net of unamortized debt discount and debt issuance costs2Based on twelve months ended December 31, 2017, Adjusted EBITDA of $103.9M and total debt of $229.0M, net of unamortized debt discount
and debt issuance costs3Based on twelve months ended December 31, 2017, Adjusted EBITDA of $103.9M and net debt of $178.2M, net of unamortized debt discount,
debt issuance costs and cash balance at December 31, 2017

32
$63
$61
$53
$51
Operating
Cash Flow
Free Cash
Flow
Free Cash
Flow after
Distributions to
RIHI
Unencumbered
Cash
Generated
1Free Cash Flow = Operating Cash Flow – Capital Expenditures2Free Cash Flow after Distributions to RIHI = Free Cash Flow – Tax and other discretionary non-dividend distributions paid to RIHI to enable RIHI to satisfy its
income tax obligations3Unencumbered Cash Generated = Free Cash Flow after Distributions to RIHI – Quarterly debt principal payments – Annual excess cash flow payment on debt, see Appendix for reconciliation of Non-GAAP measures
Acquire independent regions
Reinvest in the business
Other acquisitions
Return of capital
1
2
3
4
1
2
3
59% 49%As % of
Adj. EBITDA
Capital Allocation Priorities
51%
$’s in Millions
Cash Flow Generation Fuels Capital Allocation Strategy
Strong Annual Adjusted EBITDA Conversion to FCF
Full Year 2017

33
Leading Real Estate Franchisor
#1 Real Estate Franchise Brand1 with Unmatched
Global Footprint
Highly Productive Network of More Than 115,000
Agents
Agent-Centric Model is Different and Better
Stable, Recurring Fee-Based Revenue Model with Strong
Margins and Cash Flow
100% Franchised Business
Multiple Drivers of Shareholder Value Creation
1Source: MMR Strategy Group study of unaided awareness.

Each Office Independently Owned and Operated.

35
Positive Forecasts for 2018 & 2019Gradual Expansion of the Housing Market Continues
Monthly Existing Home Sales1 (Thousands) Annual Existing Home Sales2,3 (M)
Housing Starts - Single Family3,4 (Thousands)Home Price Appreciation2,3 (YoY)
1Source: NAR (National Association of Realtors) – Existing Home Sales, numbers presented are not seasonally adjusted; December 2013 through January 20182Source: NAR (National Association of Realtors) – U.S. Economic Outlook, February 20183Source: Fannie Mae – Economic and Strategic Research – Housing Forecast, February 20184Source: NAHB (National Association of Home Builders) – Housing and Interest Rate Forecast February 2018
5.45.5
5.65.7
5.5
5.6
5.8
5.7
2016 2017 2018e 2019e
Fannie Mae NAR
200
250
300
350
400
450
500
550
600
650
6.4%
5.6% 5.6%
3.5%
5.1%
5.8%
2.7%
3.4%
2016 2017 2018e 2019e
Fannie Mae NAR
782 848
921 965
784 851
893 943
2016 2017 2018e 2019e
Fannie Mae NAHB

36
Mortgage Finance ForecastsPurchase Originations Expected to Grow, Rates to Rise
1Source: Mortgage Bankers Association – MBA Mortgage Finance Forecast February 2018
Loan Originations1 Mortgage & Interest Rates1
$1,052$1,110
$1,183$1,250
$999
$600
$433$395
2016 2017 2018e 2019e
Purchase Refinance
3.8% 3.9%
4.9%5.4%
2.1%2.4%
3.2% 3.5%
2016 2017 2018e 2019e
30-Year Fixed 10-Year Treasury

37
(1) As of the year ended December 31, 2017, U.S. Company-owned Regions include agents in the Northern Illinois region, which converted from an Independent Region to a Company-owned Region
in connection with the acquisition of certain assets of RE/MAX of Northern Illinois, Inc. (“RE/MAX of Northern Illinois”), including the regional franchise agreements issued by us permitting the sale
of RE/MAX franchises in the northern region of the state of Illinois, on November 15, 2017. As of the acquisition date, the Northern Illinois region had 2,266 agents. As of each year end since
December 31, 2016, U.S. Company-owned Regions include agents in the Georgia, Kentucky/Tennessee and Southern Ohio regions, which converted from Independent Regions to Company-
owned Regions in connection with the acquisition of certain assets of RE/MAX of Georgia, Inc., RE/MAX of Kentucky/Tennessee, Inc. and RE/MAX of Southern Ohio, Inc., collectively (“RE/MAX
Regional Services”), including the regional franchise agreements issued by us permitting the sale of RE/MAX franchises in the states of Georgia, Kentucky and Tennessee and Southern Ohio, on
December 15, 2016. As of the acquisition date, the Georgia, Kentucky/Tennessee and Southern Ohio regions had 3,963 agents. As of each year end since December 31, 2016, U.S. Company-
owned Regions include agents in the New Jersey region, which converted from an Independent Region to a Company-owned Region in connection with the acquisition of certain assets of RE/MAX
of New Jersey, Inc. (“RE/MAX of New Jersey”), including the regional franchise agreements issued by us permitting the sale of RE/MAX franchises in the state of New Jersey, on December 1,
2016. As of the acquisition date, the New Jersey region had 3,008 agents. As of each year end since December 31, 2016, U.S. Company-owned Regions include agents in the Alaska region,
which converted from an Independent Region to a Company-owned Region in connection with the acquisition of certain assets of RE/MAX of Alaska, Inc. (“RE/MAX of Alaska”), including the
regional franchise agreements issued by us permitting the sale of RE/MAX franchises in the state of Alaska, on April 1, 2016. As of the acquisition date, the Alaska region had 245 agents. In
addition, as of each year end since December 31, 2016, U.S. Company-owned Regions include agents in the New York region, which converted from an Independent Region to a Company-owned
Region in connection with the acquisition of certain assets of RE/MAX of New York, Inc. (“RE/MAX of New York”), including the regional franchise agreements issued by us permitting the sale of
RE/MAX franchises in the state of New York, on February 22, 2016. As of the acquisition date, the New York region had 869 agents.
RE/MAX Holdings, Inc. Agent Count
2017 2016 2015 2014 2013 2012
Agent Count:
U.S.
Company-owned regions (1) 49,411 46,240 37,250 35,299 33,416 25,819
Independent regions (1) 13,751 15,490 22,668 21,806 21,075 25,984
U.S. Total 63,162 61,730 59,918 57,105 54,491 51,803
Canada
Company-owned regions 6,882 6,713 6,553 6,261 6,084 6,070
Independent regions 14,230 13,959 13,115 12,779 12,838 12,796
Canada Total 21,112 20,672 19,668 19,040 18,922 18,866
U.S. & Canada Total 84,274 82,402 79,586 76,145 73,413 70,669
Outside U.S. and Canada
Company-owned regions — — — 328 338 336
Independent regions 34,767 29,513 25,240 21,537 19,477 18,003
Outside U.S. and Canada Total 34,767 29,513 25,240 21,865 19,815 18,339
Total 119,041 111,915 104,826 98,010 93,228 89,008
Net change in agent count compared to the prior period 7,126 7,089 6,816 4,782 4,220 1,532
As of December 31,

38
(Amounts in thousands)
RE/MAX Holdings, Inc. Adjusted EBITDA Reconciliation to Net Income(Reflects RE/MAX Holdings with 100% ownership of RMCO, LLC)
(1) Represents loss (gain) on the sale or disposition of assets as well as the losses (gains) on the sublease of a portion of the Company’s corporate headquarters office
building.
(2) Represents losses incurred on early extinguishment of debt on the Company’s credit facility for each full-year period presented as well as costs associated with the
refinancing of the Company’s credit facility during the year ended December 31, 2016.
(3) Represents the annual salaries paid to David Liniger, our Chairman and Co-Founder, and Gail Liniger, our Vice Chair and Co-Founder. Such salaries have not been paid
subsequent to the IPO, and will not be paid in future periods.
(4) Represents costs incurred for compliance services performed in connection with the issuance of shares of Class A common stock as a result of the RIHI, Inc. (“RIHI”)
redemption of 5,175,000 common units in RMCO during the fourth quarter of 2015 (the “Secondary Offering”).
(5) Acquisition-related expenses include fees incurred in connection with the Company’s acquisitions of certain assets of HBN, Inc. (“HBN”) and Tails, Inc. (“Tails”) in October
2013, the acquisition of six Independent Regions (New York, Alaska, New Jersey, Georgia, Kentucky/Tennessee and Southern Ohio, collectively, the (“2016 Acquired
Regions”) and the acquisition of Full House Mortgage Connection, Inc., now known as Motto Mortgage (“Motto”). Costs include legal, accounting and advisory fees,
consulting fees for integration services and litigation settlement and fees specific to tails.
(6) Gain on reduction in tax receivable agreement liability is a result of the Tax Cuts and Jobs Act enacted in December 2017.
(7) Special investigation costs relate to costs incurred in relation to a special committee of independent directors appointed by the Board of Directors to investigate allegations
concerning actions of certain members of our senior management.
(8) Non-GAAP measure. See the end of this presentation for definitions of Non-GAAP measures.
2017 2016 2015 2014 2013 2012
Net income 35,179$ 47,226$ 50,775$ 43,426$ 28,252$ 33,324$
Depreciation and amortization 20,512 16,094 15,124 15,316 15,166 12,090
Interest expense 9,996 8,596 10,413 9,295 14,647 11,686
Interest income (352) (160) (178) (313) (321) (286)
Provision for income taxes 55,576 15,273 12,030 9,948 2,844 2,138
EBITDA 120,911 87,029 88,164 77,672 60,588 58,952
Loss (gain) on sale or disposition of assets and sublease (1) 4,260 (171) (3,650) (340) 971 1,352
Loss on early extinguishment of debt and debt modification expense (2) - 2,893 94 178 1,798 136
Equity-based compensation 2,900 2,330 1,453 2,002 2,995 1,089
Chairman Executive Comp (3) - - - - 2,261 3,000
Public offering related expenses (4) - 193 1,097 - 6,995 -
Acquisition related expenses (5) 5,889 1,899 2,750 313 495 336
Gain on reduction in TRA liability (6) (32,736) - - - - -
Special investigation costs (7) 2,634 - - - - -
Adjusted EBITDA (8) 103,858$ 94,173$ 89,908$ 79,825$ 76,103$ 64,865$
Adjusted EBITDA Margin (8) 53.0% 53.4% 50.8% 46.7% 47.9% 45.1%
Year Ended December 31,

39
(Amounts in thousands)
RE/MAX Holdings, Inc. Adjusted EBITDA Reconciliation to Net Income (Reflects RE/MAX Holdings with 100% ownership of RMCO, LLC)
(1) Represents loss (gain) on the sale or disposition of assets as well as the losses (gains) on the sublease of a portion of the Company’s corporate headquarters office
building.
(2) Represents losses incurred associated with the refinancing of the Company’s credit facility during the quarter ended December 31, 2016.
(3) Acquisition-related expenses include fees incurred in connection with the Company’s acquisitions of certain assets of HBN and Tails, the 2016 Acquired Regions and the
acquisition of Motto. Costs include legal, accounting and advisory fees, consulting fees for integration services and litigation settlement and fees specific to Tails.
(4) Gain on reduction in tax receivable agreement liability is a result of the Tax Cuts and Jobs Act enacted in December 2017.
(5) Special investigation costs relate to costs incurred in relation to a special committee of independent directors appointed by the Board of Directors to investigate allegations
concerning actions of certain members of our senior management.
(6) Non-GAAP measure. See the end of this presentation for definitions of Non-GAAP measures.
Q4 2017 Q3 2017 Q2 2017 Q1 2017 Q4 2016 Q3 2016
Net income $ 1,934 $ 7,537 $15,637 $10,071 $ 8,397 $14,306
Depreciation and amortization 4,834 4,286 5,397 5,995 4,612 3,889
Interest expense 2,582 2,598 2,462 2,354 2,103 2,121
Interest income (157) (145) (25) (26) (42) (32)
Provision for income taxes 44,693 3,091 4,762 3,030 3,097 4,632
EBITDA 53,886 17,367 28,233 21,424 18,167 24,916
Loss (gain) on sale or disposition of assets and sublease (1) 401 3,980 (74) (47) 4 (99)
Loss on early extinguishment of debt and debt modification expense (2) - - - - 2,757 -
Equity-based compensation 739 868 732 562 518 501
Acquisition related expenses (3) 1,491 3,566 274 557 1,200 169
Gain on reduction in TRA liability (4) (32,736) - - - - -
Special investigation costs (5) 2,634 - - - - -
Adjusted EBITDA (6) $26,415 $25,781 $29,165 $22,496 $22,646 $25,487
Adjusted EBITDA Margin (6) 53.4% 52.2% 59.7% 46.6% 51.0% 55.9%
Quarter Ended

40
(Amounts in thousands)
RE/MAX Holdings, Inc. Adjusted Net Income and Adjusted EPS Reconciliation to Net Income (Reflects RE/MAX Holdings with 100% ownership of RMCO, LLC)
(1) Represents loss (gains) on the sale or disposition of assets as well as the losses (gains) on the sublease of a portion of the Company’s corporate headquarters office
building.
(2) Represents losses incurred on early extinguishment of debt on the Company’s credit facility for each full-year period presented as well as costs associated with the
refinancing of the Company’s credit facility during the year ended December 31, 2016.
(3) Represents the annual salaries paid to David Liniger, our Chairman and Co-Founder, and Gail Liniger, our Vice Chair and Co-Founder. Such salaries have not been paid
subsequent to the IPO, and will not be paid in future periods.
(4) Represents costs incurred for compliance services performed in connection with the issuance of shares of Class A common stock as a result of the Secondary Offering
(5) Acquisition-related expenses include fees incurred in connection with the Company’s acquisitions of certain assets of HBN, Inc. HBN and Tails, in October 2013, the 2016
Acquired Regions and the acquisition of Motto. Costs include legal, accounting and advisory fees, consulting fees for integration services and litigation and settlement fees
specific to Tails.
(6) Gain on reduction in tax receivable agreement liability is a result of the Tax Cuts and Jobs Act enacted in December 2017.
(7) Special investigation costs relate to costs incurred in relation to a special committee of independent directors appointed by the Board of Directors to investigate allegations
concerning actions of certain members of our senior management.
(8) Non-GAAP measure. See the end of this presentation for definitions of Non-GAAP measures.
2017 2016 2015 2014 2013 2012
Net income $ 35,179 $ 47,226 $ 50,775 $ 43,426 $ 28,252 $ 33,324
Amortization of franchise agreements 17,741 14,590 13,566 13,566 12,274 9,080
Provision for income taxes 55,576 15,273 12,030 9,948 2,844 2,138
Add backs:
Loss (gain) on sale or disposition of assets and sublease (1) 4,260 (171) (3,650) (340) 971 1,352
Loss on early extinguishment of debt and debt modification expense (2) - 2,893 94 178 1,798 136
Equity-based compensation 2,900 2,330 1,453 2,002 2,995 1,089
Chairman Executive Compensation (3) - - - - 2,261 3,000
Public offering related expenses (4) - 193 1,097 - 6,995 -
Acquisition related expenses (5) 5,889 1,899 2,750 313 495 336
Gain on reduction in TRA liability (6) (32,736) - - - - -
Special investigation costs (7) 2,634 - - - - -
Adjusted pre-tax net income 91,443 84,233 78,115 69,093 58,885 50,455
Less: Provision for income taxes at 38% (34,748) (32,009) (29,684) (26,255) (22,376) (19,173)
Adjusted net income (8) $ 56,695 $ 52,224 $ 48,431 $ 42,838 $ 36,509 $ 31,282
Year Ended December 31,

41
(Amounts in thousands)
RE/MAX Holdings, Inc. Adjusted Net Income and Adjusted EPS Reconciliation to Net Income (Reflects RE/MAX Holdings with 100% ownership of RMCO, LLC)
(1) Represents loss (gain) on the sale or disposition of assets as well as the losses (gains) on the sublease of a portion of the Company’s corporate headquarters office
building.
(2) Represents costs associated with the refinancing of the Company’s credit facility during the year ended December 31, 2016.
(3) Represents the annual salaries paid to David Liniger, our Chairman and Co-Founder, and Gail Liniger, our Vice Chair and Co-Founder. Such salaries have not been paid
subsequent to the IPO, and will not be paid in future periods.
(4) Gain on reduction in tax receivable agreement liability is a result of the Tax Cuts and Jobs Act enacted in December 2017.
(5) Special investigation costs relate to costs incurred in relation to a special committee of independent directors appointed by the Board of Directors to investigate allegations
concerning actions of certain members of our senior management.
(6) Non-GAAP measure. See the end of this presentation for definitions of Non-GAAP measures.
Q4 2017 Q3 2017 Q2 2017 Q1 2017 Q4 2016 Q3 2016
Net income $ 1,934 $ 7,537 $15,637 $10,071 $ 8,397 $14,306
Amortization of franchise agreements 3,847 3,665 4,806 5,423 4,081 3,534
Provision for income taxes 44,693 3,091 4,762 3,030 3,097 4,632
Add-backs:
Loss (gain) on sale or disposition of assets and sublease (1) 401 3,980 (74) (47) 4 (99)
Loss on early extinguishment of debt and debt modification expense (2) - - - - 2,757 -
Equity-based compensation 739 868 732 562 518 501
Acquisition related expenses (3) 1,491 3,566 274 557 1,200 169
Gain on reduction in TRA liability (4) (32,736) - - - - -
Special investigation costs (5) 2,634 - - - - -
Adjusted pre-tax net income 23,003 22,707 26,137 19,596 20,054 23,043
Less: Provision for income taxes at 38% (8,741) (8,628) (9,932) (7,446) (7,621) (8,756)
Adjusted net income (6) $14,262 $14,079 $16,205 $12,150 $12,433 $14,287
Quarter Ended

42
(Amounts in thousands)
Annual Free Cash Flow
(1) Non-GAAP measure. See the end of this presentation for definitions of Non-GAAP measures.
2017 2016 2015 2014 2013 2012
Cash flow from operations 63,288$ 64,379$ 77,358$ 64,445$ 50,069$ 51,259$
Less: Capital expenditures (2,126) (4,395) (3,546) (2,026) (1,108) (1,610)
Free cash flow (1) 61,162$ 59,984$ 73,812$ 62,419$ 48,961$ 49,649$
Year Ended December 31,

43
(1) Non-GAAP measure. See the end of this presentation for definitions of non-GAAP measures.
RE/MAX Holdings, Inc. Free Cash Flow & Unencumbered Cash Generation
(Amounts in 000s)
2017 2016
Cash flow from operations $ 63,288 $ 64,379
Less: Purchases of property, equipment and softw are (2,126) (4,395)
Free cash flow (1)61,162 59,984
Free cash flow 61,162 59,984
Less: Tax/Other non-dividend distributions to RIHI (8,217) (10,391)
Free cash flow after tax/non-dividend distributions to RIHI (1)
52,945 49,593
Free cash flow after tax/non-dividend distributions to RIHI 52,945 49,593
Less: Quarterly debt principal payments (2,350) (2,081)
Less: Annual excess cash flow (ECF) payment - (12,727)
Unencumbered cash generated (1)$ 50,595 $ 34,785
Summary
Cash flow from operations $ 63,288 $ 64,379
Free cash flow $ 61,162 $ 59,984
Free cash flow after tax/non-dividend distributions to RIHI $ 52,945 $ 49,593
Unencumbered cash generated $ 50,595 $ 34,785
Adjusted EBITDA $ 103,858 $ 94,757
Free cash flow as % of Adjusted EBITDA 58.9% 63.3%
Free cash flow less distributions to RIHI as % of Adjusted EBITDA 51.0% 52.3%
Unencumbered cash generated as % of Adjusted EBITDA 48.7% 36.7%
Year ended December 31,
44
The SEC has adopted rules to regulate the use in filings with the SEC and in public disclosures of financial measures that are not in accordance with U.S. GAAP, such as Adjusted EBITDA
and the ratios related thereto, Adjusted net income, Adjusted basic and diluted earnings per share (Adjusted EPS) and Free cash flow. These measures are derived on the basis of
methodologies other than in accordance with U.S. GAAP.
The Company calculates Adjusted EBITDA as EBITDA (consolidated net income before depreciation and amortization, interest expense, interest income and the provision for income taxes,
each of which is presented in the unaudited condensed consolidated financial statements included in the Company’s earnings release issued on February 22, 2018), adjusted for the impact
of the following items that are either non-cash or the Company does not consider representative of its ongoing operating performance: loss or gain on sale or disposition of assets and
sublease, loss on early extinguishment of debt, equity based compensation expense, professional fees and certain expenses incurred in connection with the issuance of Class A common
stock as a result of RIHI’s redemption of common units in RMCO, acquisition-related expenses and other non-recurring items including the impact of the Tax Cuts and Jobs Act and the
special committee investigation costs.
Adjusted EBITDA margin represents Adjusted EBITDA as a percentage of revenue.
During the first quarter of 2017, the Company revised its definitions of Adjusted EBITDA and Adjusted EBITDA margin to better reflect the performance of the business and comply with SEC
guidance. The Company now adjusts for equity-based compensation expense and no longer adjusts for straight-line rent expense and severance-related expenses. Adjusted EBITDA and
Adjusted EBITDA margin were revised in prior periods to reflect this change for consistency in presentation.
Because Adjusted EBITDA and Adjusted EBITDA margin omit certain non-cash items and other non-recurring cash charges or other items, the Company believes that each measure is less
susceptible to variances that affect its operating performance resulting from depreciation, amortization and other non-cash and non-recurring cash charges or other items. The Company
presents Adjusted EBITDA and the related Adjusted EBITDA margin because the Company believes they are useful as supplemental measures in evaluating the performance of its operating
businesses and provides greater transparency into the Company’s results of operations. The Company’s management uses Adjusted EBITDA and Adjusted EBITDA margin as factors in
evaluating the performance of the business.
Adjusted EBITDA and Adjusted EBITDA margin have limitations as analytical tools, and you should not consider these measures in isolation or as a substitute for analyzing the Company’s
results as reported under U.S. GAAP. Some of these limitations are:
• these measures do not reflect changes in, or cash requirements for, the Company’s working capital needs;
• these measures do not reflect the Company’s interest expense, or the cash requirements necessary to service interest or principal payments on its debt;
• these measures do not reflect the Company’s income tax expense or the cash requirements to pay its taxes;
• these measures do not reflect the cash requirements to pay dividends to stockholders of the Company’s Class A common stock and tax and other cash distributions to its non-controlling
unitholders;
• these measures do not reflect the cash requirements to pay RIHI Inc. and Oberndorf pursuant to the tax receivable agreements;
• although depreciation and amortization are non-cash charges, the assets being depreciated and amortized will often require replacement in the future, and these measures do not reflect
any cash requirements for such replacements;
• although equity-based compensation is a non-cash charge, the issuance of equity-based awards may have a dilutive impact on earnings per share; and
• other companies may calculate these measures differently so similarly named measures may not be comparable.
The Company’s Adjusted EBITDA margin guidance does not include certain charges and costs. The adjustments to EBITDA margin in future periods are generally expected to be similar to
the kinds of charges and costs excluded from Adjusted EBITDA margin in prior quarters, such as gain on sale or disposition of assets and sublease and acquisition related expenses, among
others. The exclusion of these charges and costs in future periods will have a significant impact on the Company’s Adjusted EBITDA margin. The Company is not able to provide a
reconciliation of the Company’s Non-GAAP financial guidance to the corresponding U.S. GAAP measures without unreasonable effort because of the uncertainty and variability of the nature
and amount of these future charges and costs.
Non-GAAP Financial Measures

45
Adjusted net income is calculated as Net income attributable to RE/MAX Holdings, assuming the full exchange of all outstanding non-controlling interests for shares of Class A common
stock as of the beginning of the period (and the related increase to the provision for income taxes after such exchange), plus primarily non-cash items and other items that management does
not consider to be useful in assessing the Company’s operating performance (e.g., amortization of acquired intangible assets, gain on sale or disposition of assets and sub-lease, loss on
early debt extinguishment, public-offering related expenses, acquisition-related expenses, equity-based compensation expense, the impact of the TCJA and special investigation expenses).
Adjusted basic and diluted earnings per share (Adjusted EPS) are calculated as Adjusted net income (as defined above) divided by pro forma (assuming the full exchange of all
outstanding non-controlling interests) basic and diluted weighted average shares, as applicable.
When used in conjunction with GAAP financial measures, Adjusted net income and Adjusted EPS are supplemental measures of operating performance that management believes are
useful measures to evaluate the Company’s performance relative to the performance of its competitors as well as performance period over period. By assuming the full exchange of all
outstanding non-controlling interests, management believes these measures:
• facilitate comparisons with other companies that do not have a low effective tax rate driven by a non-controlling interest on a pass-through entity;
• facilitate period over period comparisons because they eliminate the effect of changes in Net income attributable to RE/MAX Holdings, Inc. driven by increases in its ownership of RMCO,
LLC, which are unrelated to the Company’s operating performance; and
• eliminate primarily non-cash and other items that management does not consider to be useful in assessing the Company’s operating performance.
Free cash flow is calculated as cash flows from operations less capital expenditures, both as reported under GAAP, and quantifies how much cash a company has to pursue opportunities
that enhance shareholder value. The Company believes free cash flow is useful to investors as a supplemental measure as it calculates the cash flow available for working capital needs, re-
investment opportunities, potential independent region and strategic acquisitions, dividend payments or other strategic uses of cash.
Free cash flow after tax and non-dividend distributions to RIHI is calculated as free cash flow less tax and other non-dividend distributions paid to RIHI (the non-controlling interest
holder) to enable RIHI to satisfy its income tax obligations. Similar payments would be made by the Company directly to federal and state taxing authorities as a component of the Company’s
consolidated provision for income taxes if a full exchange of non-controlling interests occurred in the future. As a result and given the significance of the Company’s ongoing tax and non-
dividend distribution obligations to its non-controlling interest, free cash flow after tax and non-dividend distributions, when used in conjunction with GAAP financial measures, provides a
meaningful view of cash flow available to the Company to pursue opportunities that enhance shareholder value.
Unencumbered cash generated is calculated as free cash flow after tax and non-dividend distributions to RIHI less quarterly debt principal payments less annual excess cash flow payment
on debt, as applicable. Given the significance of the Company’s excess cash flow payment on debt, when applicable, unencumbered cash generated, when used in conjunction with GAAP
financial measures, provides a meaningful view of the cash flow available to the Company to pursue opportunities that enhance shareholder value after considering its debt service
obligations.
Non-GAAP Financial Measures (continued)