Embed Size (px)
Citation preview

Transforming Newell Brands
May 2018

2
DisclaimerThis presentation and any of the information contained herein (this “Presentation”) is for general informational purposes only and is not complete. Under no circumstances is this Presentation intended to be, nor should it be construed as advice or a recommendation to enter into or conclude any transaction or buy or sell any security (whether on the terms shown herein or otherwise). This Presentation should not be construed as legal, tax, investment, financial or other advice. Additionally, this Presentation should not be construed as an offer to buy any investment in any fund or account managed by Starboard Value LP (“Starboard”). All investments involve risk, including the risk of total loss.
This Presentation is not an advertisement. The purpose of this Presentation is to communicate Starboard’s views regarding the companies discussed herein, including Newell Brands Inc. (“Newell,” “Newell Brands” or the “Company”). In making this Presentation available for distribution, Starboard is not acting as an investment adviser with respect to any recipient of this Presentation. Any mention within this Presentation of Starboard’s research process is incidental to the presentation of Starboard’s views regarding the companies described herein.
The views contained in this Presentation represent the opinions of Starboard as of the date hereof. Starboard reserves the right to change any of its opinions expressed herein at any time, but is under no obligation to update the data, information or opinions contained herein. The information contained in this Presentation may not contain all of the information required in order to evaluate the value of the companies discussed in this Presentation.
The views expressed in this Presentation are based on publicly available information, including information derived or obtained from filings made with the Securities and Exchange Commission and other regulatory authorities and from third parties. Starboard recognizes that there may be nonpublic or other information in the possession of the companies discussed herein that could lead these companies and others to disagree with Starboard’s conclusions. Starboard has not sought or obtained consent from any third party to use any statements or information indicated herein as having been obtained or derived from statements made or published by third parties. Any such statements or information should not be viewed as indicating the support of such third party for the views expressed herein. No agreement, arrangement, commitment or understanding exists or shall be deemed to exist between or among Starboard and any third party or parties by virtue of furnishing this Presentation.
None of Starboard, its affiliates, its or their representatives, agents or associated companies or any other person makes any express or implied representation or warranty as to the reliability, accuracy or completeness of the information contained in this Presentation, or in any other written or oral communication transmitted or made available to the recipient. Starboard, its affiliates and its and their representatives, agents and associated companies expressly disclaim any and all liability based, in whole or in part, on such information, errors therein or omissions therefrom.
The analyses provided herein may include certain forward-looking statements, estimates and projections prepared with respect to, among other things, the historical and anticipated operating performance of the companies discussed in this Presentation, access to capital markets, market conditions and the values of assets and liabilities, and the words “anticipate,” “believe,” “expect,” “potential,” “could,” “opportunity,” “estimate,” “plan,” and similar expressions are generally intended to identify such forward-looking statements. Such statements, estimates, and projections reflect Starboard’s various assumptions concerning anticipated results that are inherently subject to significant economic, competitive, and other uncertainties and contingencies. Thus, actual results may vary materially from the estimates and projected results contained herein. No representations, express or implied, are made as to the accuracy or completeness of such statements, estimates or projections or with respect to any other materials herein and Starboard disclaims any liability with respect thereto. In addition, Starboard will not undertake and specifically disclaims any obligation to disclose the results of any revisions that may be made to any projected results or forward-looking statements in this Presentation to reflect events or circumstances after the date of such projected results or statements or to reflect the occurrence of anticipated or unanticipated events.
Clients and accounts managed by Starboard (the “Starboard Clients”) may beneficially own, and/or have an economic interest in, shares of certain of the companies discussed in this Presentation and as a result, Starboard and its clients have an economic interest in the forward-looking statements, estimates and projections discussed above and their impact on the companies discussed in this Presentation. The Starboard Clients are in the business of trading – buying and selling – securities, and may trade in the securities of the companies discussed in this Presentation. You should also assume that the Starboard Clients may from time to time sell all or a portion of their holdings of one or more of the companies in open market transactions or otherwise (including via short sales), buy additional shares (in open market or privately negotiated transactions or otherwise), or trade in options, puts, calls, swaps or other derivative instruments relating to some or all of such shares, regardless of the views expressed in this Presentation.
Starboard reserves the right to change its intentions with respect to its investments in the companies discussed in this Presentation and take any actions with respect to investments in such companies as it may deem appropriate, and disclaims any obligation to notify the market or any other party of any such changes or actions.
All registered or unregistered service marks, trademarks and trade names referred to in this Presentation are the property of their respective owners, and Starboard’s use herein does not imply an affiliation with, or endorsement by, the owners of these service marks, trademarks and trade names.
© Starboard Value LP 2018
All Rights Reserved

3
I. Executive Summary 4
II. Brief History of Newell Brands 14
III. Underperformance Creates Opportunity 20
A. Financial Performance 23
B. Issues Have Been Self-Inflicted 46
C. Culture 76
IV. The Opportunity to Improve Newell 83
A. SG&A Improvements 86
B. Procurement Improvements 115
C. Logistics Improvements 142
D. Working Capital Improvements 155
E. Empowering the Workforce to Improve Revenue Growth 163
V. Conclusion 170
TABLE OF CONTENTS

4
I. Executive Summary

5
We Are Excited About the Opportunity at Newell
We have been successful investing in companies with good core assets and helping these companies improve
culture, governance, and performance.
In the following pages, we detail our analysis of Newell Brands’ (“Newell” or the “Company”) business, its
operations, and the significant opportunity we see to create value at the Company.
It starts with people and culture.
– After our settlement with the Company last week, 75% of the Board will be reconstituted, bringing in new
people with fresh, objective, and experienced views on how best to create value at the Company.
– We believe this new Board will work to empower the people responsible for running Newell’s day-to-day
businesses while holding management accountable for reaching its revenue growth and profitability goals.
– We believe this new Board will be able to effectively oversee the Company’s potential divestitures by
comparing the after-tax value Newell can generate today vs. the risk-adjusted standalone operating potential
of the businesses.
With a renewed focus on operations and improving EBITDA, we believe Newell can increase annual profitability by
almost $1 billion, and in turn, substantially increase the stock price.
We are releasing this presentation so that management, the Board, and the shareholders can understand why
we believe there is such a great opportunity at Newell Brands

6
We have done extensive research on Newell Brands, including:
- Working with one of the leading operationally-focused consulting firms, and
- Conducting dozens of interviews with former employees, customers, and suppliers.
We believe there is substantial opportunity for improvement at Newell Brands.
We are sharing this research to provide management, employees, and the Board with
a directional roadmap for operational improvement.
In addition, we believe shareholders should understand the opportunity for
improvement at Newell.
We Are Excited About the Opportunity at Newell (cont’d)

7
We Believe that There Is a Significant Opportunity to
Create Value at Newell
We believe that a new, truly independent Board has a tremendous opportunity to oversee multiple
avenues to create significant shareholder value at Newell
A combination of operational improvements and asset sales could create significant value at Newell.
We believe there are several key tenets to create significant value at Newell:
1. Implement a comprehensive operational improvement plan, that includes:
A company-wide margin improvement plan that we believe will increase EBITDA by $585 to $966 million.
Substantial improvement in Working Capital of ~$800 million to ~$1.1 billion to generate excess cash.
2. Oversee the asset divestiture program.
We believe that a number of Newell’s assets could realize substantial after-tax multiples.
While we are in favor of asset sales, we believe that selling assets on their own is not a panacea for operational
issues and that those must simultaneously be addressed by the new Board.
3. Empower employees to make decisions by removing bureaucratic silos and granting them more P&L responsibility.
4. Enable a truly independent Board to oversee and hold management accountable for executing on its strategy.
1
2
3
4
Source: Company filings and Starboard estimates.

8
We Believe that Asset Sales Executed at the Right Multiples Can
Create Value, but the Process Has to Be Properly Executed…
A combination of asset sales and operational improvements can create significant value at Newell
We believe that Newell owns many valuable assets – and should evaluate strategic alternatives for them – but
the strategic review must be comprehensive and weigh ALL options to determine what is best for long-term
shareholder value creation.
Newell has fantastic brands and businesses. We believe that some of Newell’s assets have the potential to generate high
after-tax multiples and create shareholder value.
However, the process should follow certain parameters:
– The analysis and process should be robust, comprehensive, and focused on exploring strategic alternatives for
ALL of Newell’s assets;
– Newell should look to sell brands and businesses only if they can receive a high after-tax multiple such that the
sale is value accretive;
– All asset sale offer prices should be compared to the risk-adjusted operating plan for each asset and need to
account for potential side effects to other businesses (e.g., raw materials purchasing power, volume discounts,
customer pricing strategies, etc.).
1
2
3

9
…But Asset Sales Are Not a Panacea for Operational
ImprovementWhile asset sales can unlock value, we believe that the focus needs to be on operational improvement, which is
essential to driving long-term value creation at Newell.
Based on our operational improvement plan, 2019 EBITDA would increase to ~$3.1 billion (with Working Capital
ultimately decreasing by ~$800 million to ~$1.1 billion), resulting in a significantly higher value for Newell.
– Our plan is based on improvements that should be well within the control of management and the Board, and, we
believe, that there is an opportunity to immediately begin implementing the plan.
– Management targeted $1 billion in synergies after the acquisition of Jarden which never came to fruition. We believe
many of these opportunities are still available and have been incorporated into our plan.
– Given the resulting significant improvement in free cash flow, asset divestitures are not required to substantially
lower the Company’s current leverage profile.
However, we do believe that some of Newell’s assets have the potential to generate high multiples.
– Given that Newell now intends to explore asset sales for approximately half of the Company, we believe the most
prudent course of action is to evaluate a comprehensive set of strategic alternatives for ALL of the businesses.
– At the very least, we believe that Newell’s industrial and commercial product assets, including Waddington, Process
Solutions, Rubbermaid Commercial Products, and Mapa, are candidates for divestitures given the potential for
strategic acquirers to pay accretive after-tax multiples.
– In addition, we believe that the Company’s portfolio of smaller consumer businesses and brands should be fully
examined to determine which assets are non-core and could potentially generate attractive after-tax sale multiples.
We believe that the Company needs to focus on operational improvements to ensure that the strategic
alternatives process maximizes the value of its assets
Source: Company filings and Starboard estimates.

10
$546
$776
$169
$61
$0
$200
$400
$600
$800
SG&A Procurement Logistics Total
EBITDA Impact
Midpoint of Potential EBITDA Improvement
from Enhanced Operational Execution
We believe that there is a substantial cost improvement and Working Capital opportunity at Newell
Source: Starboard’s proprietary report by a leading consulting firm.
We Have Identified Specific Opportunities to Increase
Annual EBITDA by $585 – $966 Million
Working Capital Opportunity
($ in millions)
We believe there is also the
potential to improve
Working Capital by $800
million to $1.1 billion,
which would significantly
increase cash available for
capital deployment
We have retained one of the leading operationally-
focused consulting firms to assist us with this analysis

11
We Have Identified Specific Opportunities to Increase
Annual EBITDA by $585 – $966 Million (cont’d)
– Selling, General & Administrative expenses are bloated, causing inefficiencies.
– Transformation and integration spend appears excessive and is not fully accounted for in the adjusted numbers.
– Layers of redundant executives and vice presidents add complexity.
– Newell is inefficient in business support categories, such as HR and Finance & Accounting.
– The Company appears to have a large Information Technology & support staff for a company of its size.
– Newell’s lax Travel & Entertainment expense policies have resulted in unnecessary costs.
Selling, General &
Administrative
Working Capital
Logistics
Procurement
– Newell’s Working Capital usage is currently much higher than comparable company benchmarks.
– Days Sales Outstanding and Days Inventory Outstanding are significantly higher than industry averages.
– Inventory levels are materially higher than peers.
– The Company has failed to meaningfully improve its cash conversion cycle over time.
– The Company has failed to integrate legacy Newell Rubbermaid and Jarden warehousing networks.
– Multiple Transportation Management Systems (TMSs) present organizational challenges and increase costs.
– Newell concentrated its product discharge to Southern California, giving the appearance of consolidation, but
costs may have actually increased on the back-end because a mile transported on land is much more expensive.
– Lack of collaboration with major retailers has led to unnecessary steps in the distribution process.
– The Company lacks a well structured low-cost-country (LCC) sourcing strategy and make-vs-buy strategy.
– Products in several segments are “over-spec’d” or “over-engineered” versus the competition.
– A decentralized sourcing strategy for materials hinders the Company’s ability to leverage best-in-class processes.
We believe there are a number of opportunities that can substantially improve operating performance.
Source: Starboard’s proprietary report by a leading consulting firm.

12
Fwd
Comparable Companies EV/EBITDA
Church & Dwight Co., Inc. 13.8x
The Clorox Company 12.4x
Colgate-Palmolive Company 14.0x
Fortune Brands Home & Security, Inc. 10.3x
Henkel AG & Co. KGaA 11.5x
Prestige Brands Holdings, Inc. 10.4x
The Procter & Gamble Company 11.8x
Reckitt Benckiser Group plc 14.1x
Spectrum Brands Holdings, Inc. 13.7x
Stanley Black & Decker, Inc. 11.4x
Tupperware Brands Corporation 6.3x
Unilever PLC 13.1x
Mean 11.9x
Median 12.1x
High 14.1x
Low 6.3x
Low Mid High
Net Sales 14,655$ 14,655$ 14,655$
Adj. EBITDA 2,557$ 2,557$ 2,557$
Margin (%) 17.4% 17.4% 17.4%
(-) Transformation Office Expenditure (247) (247)$ (247)$
Pro Forma Adj. EBITDA 2,310$ 2,310$ 2,310$
Cost Opportunities:
(+) Selling, General & Administrative 399$ 546$ 693$
(+) Procurement 137$ 169$ 200$
(+) Logistics 49$ 61$ 73$
Total Cost Opportunity 585$ 776$ 966$
Adjusted EBITDA 2,895$ 3,086$ 3,276$
Margin 19.8% 21.1% 22.4%
EBITDA Multiple 10.0x 10.5x 11.0x
Enterprise Value 28,953$ 32,402$ 36,041$
(-) Net Debt (10,103) (10,103) (10,103)
(+) Working Capital Opportunities 800$ 950$ 1,100$
Equity Value 19,650$ 23,249$ 27,038$
Newell Brands Value per Share 40.50$ 47.92$ 55.73$
Upon executing our operational turnaround plan, we believe we can create Newell at approximately 6.7x – 7.6x
pro forma EV / EBITDA, compared with an average multiple since the Jarden acquisition of ~11.4x. By
executing this plan, we believe there is significant upside.
We Believe An Operational Turnaround Could Create
Significant Shareholder Value
We believe Newell Brands represents an extremely compelling investment opportunity
Source: Bloomberg, CapitalIQ, Company filings, and Starboard estimates.
(1) Consensus FY 2019E Revenue and FY 2019E EBITDA (excluding estimates which account for divestiture plan).
(2) Includes Starboard estimate for Transformation Office expense of $247 million.
Value Creation Opportunity
($ in millions, except per share data)
Identifiable
EBITDA
improvement
opportunities
explained in
detail in
Section IV
Peer Multiples
We believe we are being
conservative in our
EBITDA multiple
estimate, which we place
at a discount to peers
(1)
(1)
(2)

13
We Believe That Newell Is Undervalued with Substantial
Opportunities to Create Value
We believe Newell could be worth $47.92 per share, or 81% upside from where it currently trades
Source: CapitalIQ, Bloomberg, Company filings, and Starboard estimates.
Note: Stock price as of April 20, 2018.
Value Creation Opportunity
$26.44
$47.92
$16.78
$2.74
$1.96
$0
$5
$10
$15
$20
$25
$30
$35
$40
$45
$50
$55
Current
Stock Price
EBITDA Improvement
(10.5x Multiple)
Current EBITDA
(10.5x Multiple)
Working Capital
Improvements
Pro Forma
Stock Price
Pro forma for an operational turnaround, which we believe is well within control of management and the
Board, we believe that Newell is extremely undervalued.

14
II. Brief History of Newell Brands

15
The merger of Newell Rubbermaid and Jarden combined portfolios of extremely well-recognized
brands, which should have generated strong growth and value for shareholders
Source: Company filings.
Note: Acquisition price includes debt assumed and net of cash acquired.
A Transformational Acquisition Created One of the Most
Prominent Consumer Products CompaniesIn April 2016, Newell Rubbermaid acquired Jarden for $18 billion in cash and stock, creating one of the most
powerful forces in the consumer products space.

16
The Combined Business Generated ~$16 Billion in
Revenue…This was a transformational transaction, as Newell more than doubled its revenue, tripled its employee base,
and significantly increased its financial leverage.
The combined company formed one of the largest global providers of consumer and commercial products
Source: Company filings.
(1) Revenue based on each management team’s FY2016 projections on a stand-alone basis from the merger proxy (excluding the results of Venezuelan operations).
$5.9 Billion $10.1 Billion $16.1 Billion
2016 Net Sales(1)
Jarden
Newell
Rubbermaid
($ in billions)

17
…And ~$2.7 Billion in EBITDA with Significant Synergy
Opportunities
By acquiring Jarden, Newell more than doubled its EBITDA
$1.1 Billion $1.6 Billion $2.7 Billion
2016 Adjusted EBITDA(1)
Jarden
Newell
Rubbermaid
Following the Jarden acquisition, management promised $500 million in synergies (later increasing that target
to $1 billion in synergies) and EBITDA margins over 20% with greater than $3 billion in EBITDA.
($ in billions)
Source: Company filings.
(1) Adjusted EBITDA based on each management team’s FY2016 projections on a stand-alone basis from the merger proxy (excluding the results of Venezuelan operations).

18
(35%)
+4%
+29%
64
% U
nd
erperfo
rma
nce
Share Price Performance(1)
+7%
+24%
(2)
(3)
Since the Deal Closed, Newell Has Significantly
Underperformed…A series of operational missteps has caused Newell’s stock to underperform the S&P 500 by 64% since the
Jarden acquisition.
Newell has massively underperformed its sector and the overall market
Source: CapitalIQ.
(1) Total returns include dividends from April 18, 2016 (first day of trading as a combined company following Jarden acquisition) to February 8, 2018 (closing price before Newell confirmed receipt of Starboard’s director nominations).
(2) NWL’s 2017 Proxy Peer Group includes: MMM, AVY, TSE:6448, CLX, CL, DHR, TSX:DII.B, ECL, OM:ELUX B, EMR, EL, ITW, KMB, MAS, MAT, TSE:6503, SHW, ENXTPA:BB, SWK, VFC, and WHR.
(3) Includes CHD, CL, CLX, FBHS, XTRA:HEN3, PBH, PG, LSE:RB., SWK, SPB, TUP, and LSE:ULVR.

19
…But Continues to Own Fantastic Brands
Newell owns more than 50 leading brands that operate in large, growing, and unconsolidated global categories.
Newell’s diverse product portfolio contains many well-recognized and market-leading brands
Source: Company filings.
Note: Excludes Newell Brands “Other” segment.
FY2017 Net Sales $5.6B
Core Growth Rate 0.1%
Adj. Operating Margin 12.4%
Key Brands:
LIVE
FY2017 Net Sales $2.8B
Core Growth Rate 1.8%
Adj. Operating Margin 21.9%
Key Brands:
LEARN
FY2017 Net Sales $2.8B
Core Growth Rate 1.1%
Adj. Operating Margin 16.7%
Key Brands:
WORK
FY2017 Net Sales $2.6B
Core Growth Rate 1.4%
Adj. Operating Margin 12.0%
Key Brands:
PLAY

20
III. Underperformance Creates Opportunity

21
Newell’s Share Price Has Dramatically Underperformed Both
the Market and Its Peers…
Source: CapitalIQ.
(1) Total returns for all periods include dividends. Performance is measured as of February 8, 2018 (last closing price before Newell confirmed receipt of Starboard’s director nominations).
(2) NWL’s 2017 Proxy Peer Group includes: MMM, AVY, TSE:6448, CLX, CL, DHR, TSX:DII.B, ECL, OM:ELUX B, EMR, EL, ITW, KMB, MAS, MAT, TSE:6503, SHW, ENXTPA:BB, SWK, VFC, and WHR.
(3) Includes CHD, CL, CLX, FBHS, XTRA:HEN3, PBH, PG, LSE:RB., SWK, SPB, TUP, and LSE:ULVR.
(4) Newell Rubbermaid’s acquisition of Jarden Corporation closed on April 15, 2016.
One-Year Stock Price Chart
Newell’s stock price has materially underperformed the broader equity markets, its Proxy Peer Group and its
closest direct competitors over the last 1-, 3-, and 5-year periods.
Stock Price Chart since April 15, 2016(4)
Five-Year Stock Price Chart
Summary ReturnsTotal Shareholder Return
(1)
1 Year 3 Year 5 Year
Acquisition of
Jarden Corp.
S&P 500 Index 14.7% 33.7% 88.7% 28.7%
DJ U.S. Consumer Goods Index 4.1% 14.4% 48.8% 6.6%
2017 Proxy Peer Group (2)
15.0% 33.3% 100.8% 24.1%
Closest Direct Peers(3)
(1.9%) 20.6% 67.0% 3.8%
Newell Brands Inc. (38.3%) (22.3%) 27.7% (35.0%)
Underperformance vs. S&P 500 (53.0%) (56.0%) (61.1%) (63.7%)
Over/(Underperformance) vs. Consumer Goods Index (42.4%) (36.7%) (21.1%) (41.6%)
Over/(Underperformance) vs. 2017 Proxy Peer Group (53.3%) (55.7%) (73.1%) (59.1%)
Over/(Underperformance) vs. Closest Direct Peers (36.4%) (42.9%) (39.4%) (38.8%)

22
Newell Has Also Underperformed on a Number of
Important Metrics
Current quantitative and qualitative metrics show substantial room for improvement
Source: CapitalIQ, Bloomberg, Company filings, and Glassdoor.
(1) Includes CHD, CL, CLX, FBHS, XTRA:HEN3, PBH, PG, LSE:RB., SWK, SPB, TUP, and LSE:ULVR.
While many of these metrics are disappointing, they also point to substantial opportunity.
COGS (% of Revenue)
Revenue per Employee Board TurnoverOrganic Revenue Growth
EBITDA Margin Employee Morale
($ in million)
5 board
members
resigned in the
span of two
months
Newell ranks
dead last among
its peers in
several Glassdoor
categories
(1)
(1)
Significant
deceleration in
organic
revenue growth
over the past 8
quarters

23
III. Underperformance Creates Opportunity
A. Financial Performance

24
We believe that significant opportunity exists to dramatically improve Newell’s financial performance,
closing the gap versus peers on both margins and valuation
Financial Performance Has Been Suboptimal,
Substantial Opportunity Exists for ImprovementNewell has struggled to improve its margins and execute on its financial targets following the Jarden
acquisition. In addition, its poor communication and inability to achieve expectations has frustrated investors.
Newell’s margins are among the worst in its peer group and well below the peer average.
EBITDA margins are significantly below management’s targets and best-in-class peers, despite supposed synergy
realization from the Jarden transaction.
Compared to peers, Newell trades at some of the lowest multiples on several valuation metrics (e.g., EV/EBITDA,
P/E), reflecting investors’ lack of confidence.
Newell management was very optimistic about the combination with Jarden, but execution and communication since the
acquisition has been poor.
Management believed that the strategic rationale was compelling and that the combination created substantial scale
in key geographies, customers, and channels.
Newell’s management expected to achieve significant synergies from the Jarden acquisition, stating that they had
“clear line of sight to $500 million”, and even doubled the synergy target to $1 billion.
Newell management has been unable to achieve its guidance targets, which has severely frustrated investors.
Following the Jarden synergy capture, Newell management expected the Company to generate >$3 billion of
EBITDA with >20% EBITDA margins. However, EBITDA has declined since the Jarden acquisition.
Revenue growth has been consistently decelerating for the past 8 quarters and Newell lowered its financial
guidance several times throughout 2017.
Source: Company filings.

25
Newell’s Margins Are Substantially Below Peers
33.0%
28.8% 28.4%
25.9%
23.6%
21.4% 21.1% 20.9% 20.6% 20.0% 19.8%
16.9% 16.7% 16.6%
PBH LSE
RB
CL PG CHD CLX SPB LSE
ULVR
XTRA
HEN3
NWL
Mgmt Target
TUP NWL SWK FBHS
Source: CapitalIQ, Bloomberg, Company filings, and Starboard estimates.
Newell’s EBITDA margins are significantly below management’s targets and best-in-class peers, despite its
product portfolio consisting of valuable brands in large, growing, and unconsolidated global categories.
Newell’s peer group consists of a diverse set of companies operating in the Consumer Durables, Consumer Discretionary,
and Household Products industries.
Newell’s low EBITDA margins reflect a bloated cost structure and poor operating performance.
2018E EBITDA Margins
Peer Average: 23.1%
Newell’s EBITDA margins are among the worst in its peer group and substantially below the peer average

26
21.9x 21.3x 20.2x
19.3x 19.0x 17.2x 17.1x 17.1x 17.0x
15.8x
10.5x 9.9x 9.0x
SPB CL CHD LSE
ULVR
CLX PG LSE
RB
SWK XTRA
HEN3
FBHS PBH NWL TUP
And the Company Now Trades at a Significant Discount to
Peers
14.1x 14.0x 13.8x 13.7x 13.1x
12.4x 11.8x 11.5x 11.4x
10.4x 10.3x 9.4x
6.3x
LSE
RB
CL CHD SPB LSE
ULVR
CLX PG XTRA
HEN3
SWK PBH FBHS NWL TUP
Poor operating performance and missed expectations have led to Newell trading at a substantial discount to peers on several key valuation metrics.
Enterprise Value / CY2018E EBITDA
Price / CY2018E EPS
Peer Average: 17.1x
Peer Average: 11.9x
Source: CapitalIQ and Bloomberg.
Note: Market data as of April 20, 2018.
Newell is deeply undervalued relative to peer valuations

27
87.5% 86.3% 85.2% 85.1%83.5% 82.7% 82.5% 80.3% 79.5% 78.0%
74.6% 72.9%69.5%
0%
10%
20%
30%
40%
50%
60%
70%
80%
90%
100%
NWL FBHS SWK SPB TUP XTRA
HEN3
LSE
UVLR
CLX CHD PG CL LSE
RB
PBH
Newell Brands Maintains the Highest Expense Ratio Even
After “Synergies” from the Jarden Acquisition
Cost Profile (% of Revenue)
Compared to peers, Newell’s total expense ratio is the highest, indicating a substantial opportunity to reduce
costs.
An opportunity exists to significantly reduce costs and improve margins at Newell
$14.7B $5.3B $12.7B $5.0B $2.3B €20.0B €53.7B $6.0B $3.8B $65.7B $15.5B £11.5B $1.0B
2017
Revenue:
Source: CapitalIQ, Bloomberg, and Company filings.
Note: Based on LTM cost of goods sold and total operating expenses.
(1) Includes Starboard estimate for Transformation Office expense of $247 million.
(1)

28
Newell CEO Michael Polk was extremely bullish on the acquisition of Jarden
“The combination creates substantial scale in key
geographies, customers and channels, enabling us to leverage
an advantaged set of brand development and commercial
capabilities to accelerate the deployment and impact of our
portfolio in international markets, in key customers and in fast-
growing channels like e-commerce.”
- CEO Michael Polk,
Jarden Corp. and Newell Rubbermaid Merger Call (December 2015)
Newell was Optimistic About the Operational Prospects of
the Jarden Acquisition The Newell and Jarden combination was intended to establish a best-in-class brand portfolio with unmatched
growth potential and the opportunity to realize sizeable revenue and cost synergies.
“The strategic rationale for combining the two companies is clear and compelling. Both Newell Rubbermaid and Jarden
have strong portfolios of leading brands that are number one or number two in their categories. The combined brand portfolio
is quite concentrated, with the top 30 brands delivering about 80% of the revenue, which will enable us to focus investment
quite easily.”- CEO Michael Polk, Jarden Corp. and Newell Rubbermaid Merger Call (December 2015)
Source: Company filings.
Merger Presentation - “A Winning Combination” (December 14, 2015)

29
Newell Expected to Achieve Significant Synergies from the
Jarden Acquisition…
Newell promised significant synergy realization from the Jarden acquisition
Newell predicted substantial upside from the anticipated cost synergies.
Shareholders put their faith in Michael Polk and the management team, realizing there was tremendous strategic
value between the two assets and various ways to win, including:
– Revenue synergies with the complementary business models;
– Substantial cost synergies in purchasing, manufacturing and corporate expenses;
– Greater leverage with retailers and suppliers, with opportunities for supply chain optimization; and
– A lower tax rate on Jarden businesses, among many others.
Many sell-side analysts believed that the synergy estimate, representing less than 4% of the combined cost structure,
was conservative, and there was the potential for much more.
“We have a clear line of sight to $500 million in anticipated cost synergies…And we wouldn’t have taken [on the merger
with Jarden had we] not seen tremendous upside beyond what we’re committing to today.”
- CEO Michael Polk, Jarden Corp. and Newell Rubbermaid Merger Call (December 2015)
1
2
3
4
Source: Company filings.
30
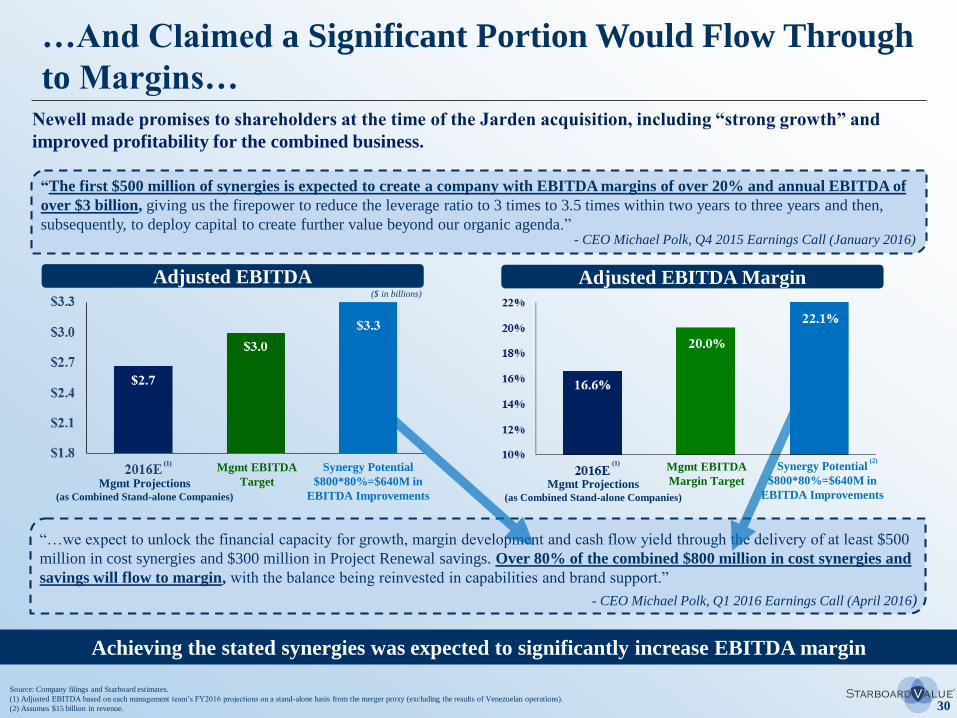
…And Claimed a Significant Portion Would Flow Through
to Margins…
Achieving the stated synergies was expected to significantly increase EBITDA margin
Newell made promises to shareholders at the time of the Jarden acquisition, including “strong growth” and
improved profitability for the combined business.
“The first $500 million of synergies is expected to create a company with EBITDA margins of over 20% and annual EBITDA of
over $3 billion, giving us the firepower to reduce the leverage ratio to 3 times to 3.5 times within two years to three years and then,
subsequently, to deploy capital to create further value beyond our organic agenda.”- CEO Michael Polk, Q4 2015 Earnings Call (January 2016)
“…we expect to unlock the financial capacity for growth, margin development and cash flow yield through the delivery of at least $500
million in cost synergies and $300 million in Project Renewal savings. Over 80% of the combined $800 million in cost synergies and
savings will flow to margin, with the balance being reinvested in capabilities and brand support.”
- CEO Michael Polk, Q1 2016 Earnings Call (April 2016)
Adjusted EBITDA($ in billions)
Mgmt Projections(as Combined Stand-alone Companies)
Mgmt EBITDA
Target
Mgmt EBITDA
Margin Target
Source: Company filings and Starboard estimates.
(1) Adjusted EBITDA based on each management team’s FY2016 projections on a stand-alone basis from the merger proxy (excluding the results of Venezuelan operations).
(2) Assumes $15 billion in revenue.
Mgmt Projections(as Combined Stand-alone Companies)
(1) (1)Synergy Potential
$800*80%=$640M in
EBITDA Improvements
Adjusted EBITDA Margin
Synergy Potential
$800*80%=$640M in
EBITDA Improvements
(2)

31
…Then Even Doubled the Synergy Target
Less than one year after closing the Jarden acquisition, Newell management doubled its synergy target
“We've been conservative in our
assumptions, but we'll pursue every
opportunity we uncover. We have no
revenue synergies, no working capital
benefits, and no tax synergies in our deal
economics and have a very clear line of
sight to at a minimum $500 million of
cost synergies.”
- CEO Michael Polk, Q4 2015 Earnings Call
January 2016
“But we believe we can now deliver $1 billion of synergies, on top of that $300 million in project renewal savings. That gets us to $1.3 billion in cumulative savings over the timeframe from 2016 through 2021. And so, that's going to be an important part of the algorithm. It drives margin development.”
- CEO Michael Polk, 2017 CAGNY Investor Conference
February 2017
Following the announcement of
the merger with Jarden,
management provided a synergy
target of $500 million, claiming
the target was conservative…
…leading them to double the
synergy target to $1 billion just
one year later
Source: Company filings.

32
Sell-side Analysts Were Also Excited by the Combination
Wall Street echoed Newell management’s bullishness towards the Jarden acquisition
Source: Wall Street equity research.
Research analysts also saw strategic value in the acquisition, highlighting the combination’s potential and their
excitement within their research reports.
“We Are Positive on JAH Deal”
“JAH Acquisition Adds Significant Scale
and Cost Synergies”
“…JAH and NWL have complementary
portfolios, unmasking significant revenue growth
opportunities in cross-selling, geographic expansion
and retail relationships.”
- Gabelli, February 2016
“The Perfect Recipe”
“The deal makes a lot of sense from a
financial perspective, particularly once
synergies kick in.”
“We see tremendous merit in the potential merger
and note the following:
(1) Business models are complementary; not competitive; we see
minimal anti-trust risk; there is limited direct product or
category overlap;
(2) Both companies are specialists in durable goods businesses,
with margin rich consumables (non-staples) businesses;
(3) Mix based product margins are quite different, with NWL
exceeding JAH by nearly 700bps; we expect merger synergies
to be concentrated in COGS at the onset, based on baseline
savings in procurement, sourcing, logistics, warehousing, and
distribution;
(4) The combined entity would have near $16 billion in revenue in
2016; $10 billion domestic and $6 billion in international
markets;
(5) Combined EBITDA (pre-synergy) nears $2.5 billion; $500M in
identified synergies appears conservative in our view;
(6) Both companies have 10%+ exposure to mass retail but we note
that NWL is more exposed to big box specialty including home
improvement, office, and baby while JAH has exposure to club,
sporting goods, and department stores.”
- Piper Jaffray, December 2015
- Raymond James, December 2015
- Gabelli, February 2016
- Piper Jaffray, December 2015
- JP Morgan, December 2015

33
What Exactly Comprised the Synergy Opportunity?
Newell believed that the combination with Jarden would generate significant scale benefits
Source: Company filings.
The Company promised to deliver $500 million (and later $1 billion) in cost synergies from the Jarden
acquisition.
Excerpts from Newell’s Presentation upon Deal Announcement
The Jarden acquisition made Newell one of the largest consumer products companies in the world.
This combination was expected to generate meaningful economies of scale in purchasing, SG&A leverage,
distribution, and transportation, among other expense categories.
Newell stated that the Jarden acquisition created ~2x – 4x the scale at major retailers.

34
Management identified several areas of opportunity to achieve the $500 million of cost savings.
Newell’s management team outlined numerous initiatives to achieve the $500 million synergy target
Source: Company filings.
What Exactly Comprised the Synergy Opportunity? (cont’d)
- Deutsche Bank Global Consumer Conference (June 2016)

35
Newell management expected to deliver the $500 million of synergies earlier than its previous forecast
Management also articulated a specific timeline to achieve the stated synergies.
Source: Company filings.
What Exactly Comprised the Synergy Opportunity? (cont’d)
- Barclays Consumer Staples Conference (September 2016)

36
The Company has reported almost $600 million in synergies and savings over the past two years.
However, EBITDA has actually declined during that timeframe
Yet, EBITDA Has Declined Since the Acquisition…
Adjusted EBITDA Comparison
($ in billions)
Jarden
Newell
Rubbermaid
$2.6$2.4
Newell has reported significant synergies and savings since the combination with Jarden. Yet, EBITDA has
actually declined two years post the acquisition.
Source: Company filings and Starboard estimates.
(1) Adjusted EBITDA based on each management team’s FY2016 projections on a stand-alone basis from the merger proxy (excluding the results of Venezuelan operations); adjusts for Tools segment sale.
(2) Adjusts for Tools segment sale and includes Starboard estimate for Transformation Office expense of $247 million.
(1) (2)
Transformation Office
Expenditure

37
…And Estimates are Heading in the Wrong Direction
Following Newell’s recent financial results and 2018 outlook, we estimate that management’s implied
EBITDA guidance for 2018 has fallen 18% below its original EBITDA target
Management Commentary on Jarden Acquisition
“The first $500 million of synergies is expected
to create a company with EBITDA margins of
over 20% and annual EBITDA of over $3
billion…”
Goal #1:
Source: Company filings, CapitalIQ, and Bloomberg.
(1) Wall Street consensus FY2018 EBITDA estimate.
- CEO Michael Polk, Q4 2015 Earnings Call
($ in billions)
Adj. EBITDA & EBITDA Margin Since Merger
20%
17.7%
16.6%
16.9%
(Q4 2015)
(1)
18% below
original
targets
Despite the promise to shareholders of over $3 billion in EBITDA, the Company has thus far failed in reaching
its goal.
“But we believe we can now deliver $1 billion
of synergies, on top of that $300 million in
project renewal savings.”
- CEO Michael Polk, 2017 CAGNY Investor Conference

38
The Company Also Failed to Hit Revenue Growth Targets
Source: Company filings, CapitalIQ, and Bloomberg.
(1) Wall Street consensus estimate of FY2018 “core growth” rate.
Management Commentary on Jarden Acquisition Actual Results – Core Growth Pre & Post-Merger
“Our ambition is to bring together and leverage
the best talent and capabilities from both
companies to drive strong growth…”
Goal #2:
- CEO Michael Polk, Q4 2015 Earnings Call (January 2016)
Revenue growth has massively decelerated and may turn negative in 2018
Despite the promise to shareholders of “strong growth,” core revenue growth has continued to meaningfully
decelerate.
NWL acquisition of JAH
closed on 4/15/2016
(1)
“The key tenet that underpins the strategy is
that this company is going to be growth-led…”
- CEO Michael Polk, Barclays Conference (September 2016)

39
Less than seven months after management doubled its synergy target, analysts were becoming more skeptical.
As a Result, Sell-side Analysts Started Becoming Skeptical
of the Company’s Targets and Guidance
Analysts expressed a lack of confidence in Newell’s execution and strategic vision
Analyst Commentary
Source: Wall Street equity research.
“We had expected Newell’s first $500M of cost synergies,
including ~$300M (or ~$0.50 in EPS) in FY18 to drop to the
bottom line, consistent with Newell’s initial guidance. This
had been a key driver of our positive thesis on Newell
Brands…However, the company’s “soft-guide” for ~$3.30 in
FY18 EPS, based on inferred low double-digit % growth off
of the lowered FY17 base, suggests materially higher
reinvestment levels than we (and Newell) had previously
expected.”- Jefferies, September 2017
“Headwinds Exist…but Bigger Issue Is Loss of
Confidence in Management and the Story — We think
the reason the stock has round-tripped to roughly where
it was when the JAH acquisition was first announced in
December 2015 is a lack of investor confidence that the
integration of these businesses is progressing to plan, and
doubt that the strategic vision of NWL’s CEO will
play out as he hopes.”
- Citi, September 2017
“Following the additional commentary today,
including on slower category growth and risk of
additional investment spending, we are less confident in
the bottom-line delivery at NWL.”
- Oppenheimer, September 2017
“While partially owing to cash restructuring/synergy-
related costs to unlock material savings, Newell’s
heretofore lack of progress in this area…and the
market’s concern regarding the company’s ability to
ultimately deliver on its long-term operating cash
flow targets should continue to weigh on the stock’s
multiple, in our view.”
- Jefferies, September 2017

40
Consensus Estimates Reflected this Skepticism
FY2017 Consensus Adjusted EBITDA Estimates
FY2017 EBITDA was 19% below initial estimates following the closing of the Jarden transaction
“The first $500 million of synergies is expected to create a company with EBITDA margins of over 20% and annual
EBITDA of over $3 billion, giving us the firepower to reduce the leverage ratio to 3 times to 3.5 times within two years to
three years and then, subsequently, to deploy capital to create further value beyond our organic agenda.”
- CEO Michael Polk, Q4 2015 Earnings Call (January 2016)
Management Long-Term EBITDA Target
Actual 2017
Adj. EBITDA
Source: Bloomberg and CapitalIQ.
Note: Estimates not normalized for acquisitions and divestitures.

41
Newell has repeatedly missed consensus expectations on numerous financial metrics over the past several quarters, frustrating shareholders, and failing to gain momentum despite its iconic portfolio of brands.
Source: Bloomberg and Company filings.
(1) Based on FY2017 EPS consensus estimate prior to Newell issuing its FY2017 guidance.
(2) Consensus estimates prior to announcement of preliminary results on January 25, 2018.(3) Stock price reaction on January 25, 2018 (day Newell announced preliminary 2017 results).
Newell Has Consistently Overpromised and Under-delivered…
Earnings Surprise History – Last 3 Quarters
Q2 2017
Earnings
Q3 2017
Earnings
Revised
Guidance
Q4 2017
Earnings(2)
(3)
Newell’s ability to achieve consensus expectations deteriorated significantly throughout 2017

42
(35%)
+4%
+29%
64
% U
nd
erperfo
rma
nce
+7%
+24%
A series of operational missteps has caused Newell’s stock price to underperform the S&P 500 by 64% in less
than 2 years.
…And Shareholders Have Suffered…
Newell has massively underperformed its sector and the overall market
Share Price Performance(1)
(2)
(3)
Source: CapitalIQ.
(1) Total returns include dividends from April 18, 2016 (first day of trading as a combined company following Jarden acquisition) to February 8, 2018 (closing price before Newell confirmed receipt of Starboard’s director nominations).
(2) NWL’s 2017 Proxy Peer Group includes: MMM, AVY, TSE:6448, CLX, CL, DHR, TSX:DII.B, ECL, OM:ELUX B, EMR, EL, ITW, KMB, MAS, MAT, TSE:6503, SHW, ENXTPA:BB, SWK, VFC, and WHR.
(3) Includes CHD, CL, CLX, FBHS, XTRA:HEN3, PBH, PG, LSE:RB., SWK, SPB, TUP, and LSE:ULVR.

43
Since the acquisition of Jarden, approximately $10 billion in shareholder value has been destroyed.
Value at Time of Acquisition:
Value Today:$10 billion in shareholder value has
been destroyed in less than 2 years
Source: Company filings and CapitalIQ (adjusted for dividends).
Note: As of February 8, 2018 (closing price before Newell confirmed receipt of Starboard’s director nominations).
The operational issues at Newell have resulted in a significant destruction of shareholder value
…As Significant Shareholder Value Has Been Destroyed

44
The Communication to Shareholders Has Been Confusing
While management has tried to put a positive spin on the operating performance issues, shareholders
remain extremely concerned
Only exacerbating the poor execution and share price performance, management commentary regarding
Newell’s performance has been confusing for shareholders, leaving more questions than answers.
Quote Author
Source: Company filings.
“So we’re right where we thought we would be,
although our business performance hasn’t been
up to our expectations.”
CEO Michael Polk
(CAGNY Conference – February 2018)
“And we delivered $358 million of synergies and
savings in 2017. Some of that did not flow through
the margin…for a variety of reasons, but quite clear
that that money is in the bank…”
CEO Michael Polk
(CAGNY Conference – February 2018)
“So on balance, I think we’ve had a phenomenal
year. Despite the fact that we're struggling on the
top line and the flow through to earnings
associated with revenue…”
CEO Michael Polk
(Town Hall Presentation– February 2018)

45
In contrast to management’s remarks, adjusted operating margins declined 138bps in FY2017 vs. FY2016
While management continually boasted about its success in achieving synergy targets, the Company’s
operating margins showed a completely different story.
“…the work we’re doing on cost synergies and Project Renewal savings is
having a meaningful positive impact on margins.”
Q1’17 Adj. Operating Margin
“We delivered over $80 million of savings and synergies in the second
quarter, which contributed to strong normalized operating margin growth…”
Q2’17 Adj. Operating Margin
“We have delivered the cost synergies and Renewal savings we
committed to deliver…”
Q3’17 Adj. Operating Margin
“When coupled with procurement benefits, this results in over $350
million [in FY2017] in savings and synergies that flowed to the P&L.”
Q4’17 Adj. Operating Margin
Source: Company filings.
In Our View, Newell Management Needs to Communicate
a Better Plan to Turn the Business Around and Execute

46
III. Underperformance Creates Opportunity
B. Issues Have Been Self-Inflicted

47
We believe that issues specific to Newell are responsible for the Company’s underperformance, and there is a
significant opportunity for improvement
While Newell Has Blamed Poor Performance on the Macro Environment,
We Believe it Is Self-Inflicted and Can Be Improved
Newell management has frequently blamed poor performance on the macro environment, yet peers have fared
far better.
While the retail macro environment has been stressed, Newell’s peers have performed far better.
Newell’s peers have shown consistent organic revenue growth and gross margin expansion.
As a result, Newell’s share price has significantly underperformed its peers over the past year.
We believe that Newell’s issues resulted from poor execution versus industry headwinds.
Many of Newell’s issues are self-inflicted due to communication problems within the Company.
Limited communication between corporate functions (e.g., e-commerce, R&D, brand marketing, etc.) and the
divisions / brands leads to inefficiencies and higher costs.
In the following pages, we discuss several examples of poor communication resulting in strained customer
relationships and negative financial consequences.
We believe that there are numerous opportunities to fix the internal communication issues.
By returning more responsibility and accountability to the divisions / brands, Newell can streamline
communication, accelerate time to market, and improve customer relationships.
Source: Company filings.

48
The Company has been vehement that its operational issues are macro related
Newell claims poor results and guidance reductions are due to the weak retail environment.
Q2 2017 Earnings Call
(August 4, 2017)
“That said, like most others in our industry, we continue to face pressure from retailer inventory
reductions and retailer consolidation in the U.S.” – CEO Michael Polk
Barclays Conference
(September 7, 2017)
“We're making good progress despite a tougher landscape than we originally envisioned. The
landscape issue is really retail environment related and also market growth related. We are existing
now in sluggish markets, a little bit worse than where we were when this whole process started and
where we envisioned the deal…” – CEO Michael Polk
Q3 2017 Earnings Call
(November 2, 2017)
“We had a top customer bankruptcy, forcing a future re-plan on one of our best performing businesses.
We had unrelenting retailer inventory destocking, creating a headwind for revenue as our retail
partners adjust to slowing market growth and changes in shopping patterns. You name it, we experienced
it this quarter.”– CEO Michael Polk
Q4 2017 Earnings Call
(February 16, 2018)
“What's changed is the retail environment, and what's unique about our portfolio and that does not
change with the change in portfolio footprint is the exposure to the stressed segment of the U.S. retail
landscape. And that will continue to be bit of an overhang on the business with probably episodic events
like the ones we're dealing with right now.”– CEO Michael Polk
CAGNY Conference
(February 22, 2018)
“The external environment is tougher than what we anticipated when we did the deal and even at the
beginning of this year, and it's not that the markets are really having troubles or consumer purchasing
behaviors have slowed down in any way. In fact, it's the opposite, the consumer markets are quite robust.
But the retail landscape given our category footprint and our exposure to a group of stressed retailers
is more troubling than what we anticipated.”– CEO Michael Polk
Note: Emphasis added to quotations.
While Newell Has Blamed Poor Performance on the Macro Environment,
We Believe it Is Self-Inflicted and Can Be Improved (cont’d)

49
Facing the Same Retail Environment, Peers Have Fared
Much Better
Despite experiencing similar retail trends, Newell’s peers have outperformed
Stock price performance between Newell and the Company’s peers has differed significantly.
(45%)
(1%)
(5%)
(2%)
12%
8%
Source: CapitalIQ.
Note: Stock price return from May 9, 2017 (day of Newell Brands 2017 Annual Meeting) to February 8, 2018 (last closing price before Newell confirmed receipt of Starboard’s director nominations).
(1) NWL’s 2017 Proxy Peer Group includes: MMM, AVY, TSE:6448, CLX, CL, DHR, TSX:DII.B, ECL, OM:ELUX B, EMR, EL, ITW, KMB, MAS, MAT, TSE:6503, SHW, ENXTPA:BB, SWK, VFC, and WHR.
(1)

50
6%
5%
3%
3% 3% 3%
0%
(2%)
5%
4% 4%5%
7% 7%
8%
5%
4%
1%
2%
3%3%
5%5% 5%
2%
1%
0%
2%2%
8%
6%
2%
5%
5%
4% 4%
5%
-3%
-1%
1%
3%
5%
7%
9%
Q1'16 Q2'16 Q3'16 Q4'16 Q1'17 Q2'17 Q3'17 Q4'17
NWL SWK CHD CL FBHS
While Newell’s Revenue Is Declining, Its Peers Are
Growing Consistently
Peers have been able to weather the “difficult environment” without reporting a quarter of negative
organic revenue growth. Unfortunately, Newell cannot say the same
Source: Company filings, peer filings, and Starboard estimates.
Organic Revenue Growth
While the macro environment may be more difficult, the Company’s peers are demonstrating substantially
better organic growth than Newell.

51
While Newell’s Gross Margins Are Deteriorating, Its Peers’
Are Continuing to Expand
While peers have been able to expand gross margins, Newell Brands’ contracted significantly in 2017
Source: Company filings and peer filings.
Change in Adjusted Gross Margin Year-over-Year
While the macro environment may be more difficult, Newell Brands’ peers are operating more effectively and
performing significantly better.
Q1’17 Q2’17 Q3’17 Q4’17 2017
(415bps) (24bps) (104bps) (412bps) (206bps)
163bps (15bps) 63bps (17bps)44bps
80bps 115bps 1bp (46bps)35bps
72bps 43bps (2bps) (36bps)19bps
103bps (80bps) (13bps) 52bps16bps

52
Many Specific Operational Missteps, Not the Macro
Environment, Have Led to this Underperformance
In the following pages, we detail clear examples of customer frustration, brand
destruction, and other actions that have contributed to the Company’s poor operational
execution.
Based on our research, we believe that the communication at Newell has resulted in a number of issues at the
Company and can be greatly improved.
The Company has drastically missed expectations, and has blamed the macro environment.
Our question: So why have competitors fared so much better than Newell in this environment?
We believe the culprit is not the macro environment.
We believe the Company’s issues are self-inflicted and there is substantial room for improvement.
These issues are fixable, and by implementing the appropriate changes, Newell can substantially
improve its margins

53
The Structure of the Organization Has Resulted in High
Costs, Massive Inefficiencies, and Declining Revenue
Source: Industry research and interviews.
While Newell continues to blame the macro environment, we believe that many of these issues are actually self-
inflicted.
We believe that Newell’s organization is inefficient, and its processes result in high costs, poor employee morale, and
frustrated customers.
Corporate appears to make decisions without fully informing the divisions / brands, which has resulted in
significant customer and brand issues, including gross margin erosion.
The R&D process lacks communication between corporate and the divisions / brands, which results in a low
number of new products reaching the market, high kill rates, duplicative functions, and far higher costs.
In many cases the division / brand leaders are so removed from new product design that the Company
could be working on new products for a year before the division / brand leader is involved. This results in
lengthy time to market and high product kill ratios.
The e-commerce group is too separated from the divisions and appears to determine online pricing without
communicating with the divisions, resulting in inconsistent pricing that, in some cases, violates the Company’s
own minimum pricing policy or results in different pricing to the same customers between online and brick-and-
mortar (i.e., Walmart vs Walmart.com).
These issues frustrate customers and lead to Newell giving large promotional concessions, which
drastically lowers margins.
Newell’s organizational structure appears to be a significant contributor to the issues facing the Company

54
Newell’s Siloed Organizational Structure Causes Massive
Communication Issues, Resulting in High Costs
CORPORATE
Division CEO / Head of Brand
CFO │ COO │ Supply Chain │ HR │
Regional Presidents
Reports to e-commerce head
Determines online pricing regardless of
whether retailer has brick-and-mortar
store
Division / Brand Level E-commerce
Research and
Development
Brand Marketing
Limited communication among the different functional groups not only results in duplicative costs, but also
frustrates customers and causes poor employee morale.
Reports to Richard Davies
New product design operated out of
Kalamazoo, MI
Works on new product development
Reports to Richard Davies
National marketing and website design
New product development and pricing
Prices online products
without the knowledge of
division / brand, sometimes
violating Company’s own
minimum pricing policy for
some retailers, and in other
cases, results in presenting
different prices to the same
retailer (i.e., Walmart vs
Walmart.com)
Operates Design center in a
silo away from Division;
months or years of research
with high kill rate because
Division leaders have little
to no input
Limited communication
with Division Trade
Marketing and Sales (who
have customer relationships)
which results in bringing
forward products that
retailers don’t want
Given revenue and
operating plan from
corporate with
limited control over
actual P&L levers
Source: Industry research and interviews.
Lack of communication
Field Sales
Trade Marketing
Engineering (Plant
and Supply Chain)
Can also reside in Corporate
depending on the division /
brand
If no Field Sales in Division,
would have to speak with
channel sales in corporate to
know product sales trends;
Very limited communication
with Brand Marketing
Very limited communication
with R&D, resulting in new
products having to be
redesigned along with
sourcing issues
Responsible for
ultimately selling the
product
Responsible for in-store
promotions and in-store
support
Responsible for
manufacturing
engineering products

55
When Corporate Fails to Communicate with the Brands: Textbook
Way to Harm a Brand – The Yankee Candle Story
Source: Jarden filings.
Yankee Candle is one of the most recognized brands in the candle industry with ~600 retail store locations.
Yankee Candle has been a prominent, high quality candle brand for
many years.
In an effort to expand its reach, Yankee Candle (before Newell
acquired Jarden), created a value-priced candle line called
“American Home by Yankee Candle” so major retailers could carry
product without diluting the flagship Yankee Candle brand.
From Jarden’s 2015 CAGNY presentation – focused
strategy on breaking into mass retailing without
harming flagship Yankee Candle brand

56
When Corporate Fails to Communicate with the Brands: Textbook
Way to Harm a Brand – The Yankee Candle Story (cont’d)
The first way to kill the value of a brand is to put it right next to the Walmart knockoff that is a quarter of the price
As a result of this action, Walmart a) cut the price of the product, and b) placed it right next to the lowest-
end candles on the market.
Why would you put a high quality
brand next to a cheap knockoff?
In 2017, in an effort to generate additional near-term sales, Newell did away with the American Home brand
and began rolling out its higher-end, flagship Yankee Candle brand into large retailers.
Yankee Candle
$19.87
Low Quality Candles
priced at ~$3 - $5
Now the high-end Yankee Candle brand is lost in a sea of low-end knockoff candles in Walmart. How does the
opinion of its core customer base stay the same when Yankee Candle is now next to the $4 candles at Walmart?
Source: Industry research and interviews.

57
In an Effort to Grow Sales, Newell Allowed Walmart to
Discount Yankee Candle by Almost $10 per Candle
Source: Industry research and interviews, www.yankeecandle.com, and www.walmart.com.
Why would Newell push the Yankee Candle brand into Walmart at a 30% discount to the price at its own stores?
Walmart - $19.87Yankee Candle Store - $27.99
Not considering the long-term effects of a decision like this can be dangerous

58
So What Do You Think Happened Next?
We believe that this had a negative impact on gross margins
Source: www.bedbathandbeyond.com, industry research and interviews.
Clearly, other large retailers would get upset if they realized Walmart was selling the same candle at a large
price discount. So, Bed Bath & Beyond demanded a lower wholesale price from Newell, so it could offer a
competitive retail price.
Bed Bath & Beyond today - $21.99
A more than 20% reduction at a major retailer
not only severely impacts profitability, but also
draws customers away from Company owned
stores to capitalize on better prices!

59
Newell’s actions resulted in a number of large retailers significantly reducing their prices of Yankee Candle
products. However, the same product is still sold in its own Yankee Candle stores for $27.99!
Many Major Retailers Ended Up Cutting Prices
This decision resulted in retail partners cutting their prices by 20% - 30%; clearly a bad outcome for the business
Source: www.yankeecandle.com, www.walmart.com, www.bedbathandbeyond.com, www.target.com, www.amazon.com, industry research and interviews.
Walmart - $19.87 Bed Bath & Beyond - $21.99
Amazon - $21.99
Target - $19.99
YankeeCandle.com - $27.99

60
Especially When Yankee Candle Has Close to 600 Stores
Selling at Full Price!
Why was this a good idea?
Source: www.yankeecandle.com, Mapline, industry research and interviews.
Newell is undercutting its own stores…and it operates a lot of stores.
Map of Yankee Candle Locations

61
The Appliance Business Opportunity
We believe that an issue like this is clearly self-inflicted, not macro related
Newell has pointed to “structural issues” and “destocking” to account for the struggling appliance business, but
we believe that the real issue was poor decision making.
We don’t believe this is a “destocking” or a “structural” issue. We believe the issue stems from the Company’s decision to fire
almost the entire sales force right before the selling season.
During the integration of legacy Newell and Jarden, the management team “integrated” sales offices in an attempt to shift
towards a more centralized strategy – resulting in the termination of more than 150 former Jarden sales executives.
However, two problems ensued in this relationship driven industry – (1) the recently terminated sales executives had the
relationships with the buyers, and (2) it was just prior to selling season!
“…Appliances in particular, that has some structural issues within its portfolio that need to be addressed through the work
we're doing on design, the work we're doing on innovation, the work we're doing in the brand arena.”
- CEO Michael Polk, 2018 CAGNY Investor Conference
NWL fires legacy
Jarden appliance
salesforce –
integrates
appliances with
legacy NWL
salespeople
Sell-in for
upcoming 3rd and
4th quarter
appliance season
Newell reverses
course and tries to
re-hire legacy
salesforce
NWL misses
appliance
expectations in key
sales season
Q1 2017 Q3 2017 Q4 2017Q2 2017
Source: Company filings, industry research and interviews.

62
The R&D Process Appears to Be a Key Reason for Inflated
Costs and Slowing Revenue Growth
Source: Industry research and interviews.
The process is led by corporate, not by the division / brands.
Corporate relies on test scores in determining new product design rather than conversations with retailers, pricing,
competition, or manufacturability.
Division leaders are not brought into the new product design process for sometimes up to a year after corporate
determines new concept, despite the fact that they are the ones who speak with the retailers and are responsible for
manufacturing.
This results in high kill rates when corporate finally realizes that competition exists, pricing is too high, or a product
cannot actually be manufactured.
In some cases, the Company seems to wait until the product is already manufactured to bring it in front of retailers
and then realizes that they don’t want it, thereby killing the product after multiple years of development.
The process is too lengthy and Newell misses opportunities to market.
Speed to market is one of the most important factors in new product success and revenue growth, yet Newell’s
complex structure, which cuts off division leaders, can lead to multiple years from concept to new product
production.
Newell appears to measure success based on quantity of concepts (approximately 1,300 last year alone!) rather than actual
new products to market or the revenue and return they generate.
The brand leaders live and breathe their brands and their respective categories. These are the people
that need to be empowered to drive innovation and revenue growth
1
2
3

63Source: Company filings, industry research and interviews.
In our research, we have focused extensively on Newell’s innovation and R&D process because we believe
there are massive inefficiencies.
Step 1: New Product Design (Led by Corporate R&D and Corporate Brand Marketing)
Over the next few pages, we detail what we believe to be the current R&D process at Newell. There are many issues with
the process that result in wasted time, higher than expected costs, frustrated retailers, and new product delays.
The corporate R&D design team in Kalamazoo, MI, along with corporate brand marketing, will generate new ideas for
products that theoretically solve a problem in the marketplace.
They are not experts in individual brands.
The division / brand leaders, who have the relationships with the retailers and are the experts in each brand, are generally
not involved and are unaware of what this corporate team is working on.
The design team, which operates in a silo in Kalamazoo, will draw up these new concepts.
Richard Davies, who operates out of the UK, oversees this process.
Rather than relying on the divisions / brands who are close to the retail customer and
know the competitive landscape, new product development is instead done in a
completely different location and generally without the knowledge of those who know
the business the best
The R&D Process Appears to Be a Key Reason for Inflated
Costs and Slowing Revenue Growth (cont’d)

64
Corporate makes decisions based on theoretical scores without the division / brand leaders having
input, whether the retailer wants the product, or whether it is even possible to manufacture
Step 2: Consumer Research
Once decided on a sketch and concept at
Kalamazoo, the idea will go through Newell’s
corporate consumer research team.
Again, the consumer research team is not brand
specific, so the division / brand still generally
has no idea about these new products.
The consumer research group will score each
product with a consumer panel, but they will
not typically discuss price, specification or any
details, just high level thoughts.
Corporate will then make its decisions based on
these theoretical index scores without the
proper input from division / brand leaders.
Steps 1 and 2 can take up to 6 months and
the divisions / brands are not involved.
Products moving forward are based on consumer index scores, but do
not properly take into account price, competition, retail customer
desires or even whether it is possible to manufacture the product!
They “trust the index number” and “don’t
take into account what matters like
competition, price, or even the retailer”
-Former Senior Executive
Source: Company filings, industry research and interviews.
The R&D Process Appears to Be a Key Reason for Inflated
Costs and Slowing Revenue Growth (cont’d)

65
A year into the process, the division / brand specific executives still have minimal involvement
Step 3: Decision to Move Forward with R&D
After the consumer research stage, the division / brand leader finally gets notified – but not in a meaningful way.
The division / brand leader is invited to listen to a call, which typically lasts 30-45 minutes, where up to 70 new
concepts will be discussed by corporate.
Richard Davies and Bill Burke (COO) listen to each idea from corporate in rapid-fire and make approvals.
Since they are not experts in each industry, they rely primarily on index scores.
Division / brand leaders do not have the right to eliminate an idea, even if it already exists or they know the
retailer would not want it.
New product concepts are then approved (assuming they have a high index score) to go back to corporate engineering.
At this point, which can easily be 6-12 months, there is generally still no real view on price, cost, and feasibility
(since division operations are not on the call), and they typically have not shared the products or ideas with the
retailer.
The “quality of thinking was quite low”
-Former Senior Executive
“There was no debate, not enough time”
-Former Senior Executive
When discussing the rapid fire process to make approvals, one former senior executive stated:
Source: Company filings, industry research and interviews.
The R&D Process Appears to Be a Key Reason for Inflated
Costs and Slowing Revenue Growth (cont’d)

66
Typically a year or more into the product development, there is still no answer on actual cost, limited
interaction with the divisions, limited/no conversations with the retailer, and corporate R&D
engineering is still trying to determine whether the product can actually be manufactured!
Step 4: Corporate R&D Engineering
Now the concept goes back to the R&D engineering team at corporate, led again by Richard Davies.
Once again, there is no knowledge or input from the division / brand leaders.
This group at corporate develops a theoretical cost and materials model, and tries to determine whether the product can
actually be manufactured.
Importantly, since the division supply chain and operations is typically not involved, actual pricing may differ
materially from theoretical pricing.
If R&D Engineering determines
the product cannot be
manufactured, the idea is killed
(yet a year may have been wasted)
Division / brand supply chain and
operations is not engaged, so
“theoretical” cost may differ
materially from actual cost
Sometimes the R&D team will
learn that someone else has
already patented the device and
cannot design around it, therefore
being forced to kill the idea
Source: Company filings, industry research and interviews.
The R&D Process Appears to Be a Key Reason for Inflated
Costs and Slowing Revenue Growth (cont’d)

67
Step 5: Decision to move forward with commercial engineering
Once again, the division / brand leader is invited to listen to a call between corporate R&D, Richard Davies, and Bill
Burke to determine whether to pursue commercial engineering.
Corporate R&D explains whether the product can be theoretically manufactured and provides theoretical cost estimates.
Importantly, the supply chain and operations within the division has typically still not adequately engaged on the
product to determine whether it is even possible to manufacture and the actual cost estimate of manufacturing.
Richard Davies and Bill Burke then vote on proceeding to commercial engineering and trade marketing.
The division / brand leader can provide thoughts and input, but still has no ability to kill the product.
The division / brand leader still has no ability to kill the product
We may now be well over a year into the process and the division / brand leader, division operations,
and division trade marketing have had little involvement, resulting in retailers most likely not having
been told about the product
Source: Company filings, industry research and interviews.
The R&D Process Appears to Be a Key Reason for Inflated
Costs and Slowing Revenue Growth (cont’d)

68
Over a year into the process, and the retailer could have absolutely no interest!
Step 6: Engage with Division – Proceed with Commercial Engineering and Trade Marketing
Commercial Engineering:
Corporate R&D works with division supply chain and
operations to get quotes from suppliers to determine
actual vs. theoretical manufacturing costs and whether
the product can realistically be manufactured in volume.
Trade Marketing:
Trade marketing (within the division) is finally
involved in a meaningful way and discusses the product
with the retailers.
If supply chain and operations determines that
it will cost more to manufacture the product
than the theoretical estimates, it will either be
redesigned or killed
If the retailer does not like the product,
believes its pricing is too high or there are
already too many competitors for its shelves,
the product may be killed or will become an
“online only offer”
Typically when the retailer decided it didn’t want the product they
[the retailer] would say, “We should have discussed this a year ago”
-Former Senior Executive
Source: Company filings, industry research and interviews.
The R&D Process Appears to Be a Key Reason for Inflated
Costs and Slowing Revenue Growth (cont’d)

69
Step 7: Pursue tooling and investments
Step 8: Product Launch
Typically well over a year later, investments are made to pursue tooling and product launch.
Newell tested over 1,300 concepts in
2017? How many products were killed
and how much time was wasted?
If everything goes well and the new concept
gets through this backwards process that
could take years, then the product is finally
launched.
In 2017 Newell tested over 1,300 new
concepts, but how many were killed?
Source: Company filings, industry research and interviews.
The R&D Process Appears to Be a Key Reason for Inflated
Costs and Slowing Revenue Growth (cont’d)
Newell appears to measure success based on concepts tested, rather than actual new products and
revenue growth

70
Oster’s Air Fryer Mishap Represents an Example of
Miscommunication
This could have been avoided if Newell’s teams worked in coordination
Oster’s “new” concept driven by Kalamazoo and the corporate marketing team resulted in a missed
opportunity for the business.
While Cuisinart was developing its Air Fryer Toaster Oven, the R&D team in Kalamazoo and brand marketing team in corporate
thought of a similar idea for Newell’s Oster brand.
The R&D team designed a product that received fantastic index scores from the consumer research group.
Importantly, price and competitive products were never discussed as part of these scores, and corporate decided to go
through with the product.
The R&D team then developed a theoretical cost estimate for the product.
However, since the division operations and supply chain was not involved, this cost was nothing more than theoretical.
When it finally came time for division operations and supply chain, along with division marketing, to become involved, they found:
1) The cost to manufacture would be far higher than the theoretical cost based on corporate R&D’s product design.
2) The retailer was already speaking with a competitor about a similar product, which was going to have a retail price that was
actually lower than the division operations’ cost estimate.
Conclusion – The product never came to market and Cuisinart launched its own Air Fryer Toaster Oven and now dominates the
market. If the division / brand could have been involved earlier, they would have been able to speak to retailers, understand the
competitive landscape, and recommend product changes that could have increased the chances of getting the product launched.
No Oster
product
exists; the
Cuisinart
product leads
the market
Consumer
report scores
Newell Regularly Touts its Consumer Scores
Source: Company filings, industry research and interviews.

71
The E-commerce Group Needs to Better Communicate
with the Brands
Newell’s lack of a comprehensive e-commerce strategy has led to numerous missteps
Source: Company filings, Crain’s New York Business, industry research and interviews.
In November 2017, Newell announced the opening of a Brooklyn office to support its growing e-commerce
business.
With this new facility, we would have thought that Newell had a fully-integrated e-commerce team firing on all cylinders.
In reality, as we show in the following pages, Newell’s e-commerce strategy appears to lack sufficient communication with
the brands, causing customer issues.
“This lease signing is evidence of our
company's commitment to expanding our e-
commerce division, Brooklyn is an ideal
location to grow our footprint, accommodate
our growing team and move forward with
the transformation and build-out of our
industry-leading e-commerce capability.”
- Mark Tarchetti, Newell’s President

72
Division / Brand
E-commerce Group
Walmart
(brick-and-mortar)
Walmart.com
(online)
Responsible for
in-store pricing
Responsible for
online pricing
“Often times we would be sitting at a meeting with a customer where they [the customer] would say that the
online business is giving us a different price.”
- Former Newell executive
The lack of communication between the division / brands and the e-commerce group results in pricing issues
with large customers.
While the division / brand is responsible for in-store pricing, Newell’s e-commerce group is responsible for online pricing,
even when it is the same customer (i.e. Walmart vs Walmart.com).
Can go to the same
customer with
completely different
plans and
promotions for the
same product
Source: Company filings, industry research and interviews.
The E-commerce Group Needs to Better Communicate
with the Brands (cont’d)

73
Why aren’t e-commerce and the brands talking to each other?
The lack of communication resulted in Newell violating its own Minimum Advertised Price (MAP) policy,
forcing the Company to provide concessions to retailers.
On a number of different occasions, we understand that Newell’s e-commerce group offered pricing to online
customers that actually violated the Company’s own Minimum Advertised Price (MAP) that the division / brand would
provide to the brick-and-mortar retailer.
This would result in frustrated retail customers that would then demand price adjustments or significant promotional
funding, resulting in negative impacts to margins.
Apparently, this is not only happening with sales to online customers, but also on Newell’s own website.
“In one such instance, after finding out that Newell’s own website was selling a product online for
substantially cheaper than the retailer, the retailer slid across a piece of paper and said ‘your own website
is violating your Minimum Advertised Price policy.’”
- Former Newell executive
Source: Company filings, industry research and interviews.
The E-commerce Group Needs to Better Communicate
with the Brands (cont’d)

74
The lack of communication between division / brands and e-commerce has resulted in frustrated
customers and significant margin issues for the Company
The lack of communication resulted in Newell violating its own Minimum Advertised Price (MAP) policy,
forcing the Company to provide concessions to retailers.
Example – Fishing Reels
Most likely in an effort to grow near-term sales, the e-
commerce team began to aggressively discount prices on
fishing reels.
Shortly thereafter, a major sporting goods retailer (and
prominent Newell customer) realized they were able to
purchase this product online at a lower price than they
were currently purchasing it wholesale from the brands.
Example – Calphalon
A major brick-and-mortar retailer was selling a set of
Calphalon pots.
Amazon was selling the same set at a materially lower
price that was apparently below the brick-and-mortar
retailers’ minimum advertised price.
Result:
Newell lowered the price
for the sporting goods
retailer, hurting margins
Result:
In an effort to appease
the frustrated retailer,
Newell offered
substantial promotional
funding, hurting margins
Source: Company filings, industry research and interviews.
The E-commerce Group Needs to Better Communicate
with the Brands (cont’d)

75
We Believe Newell Needs to Improve Its Communication
Issues Rather than Distract Itself
Newell needs to focus on improving the communication with its brands before being distracted with
other e-commerce opportunities
Source: Company filings.
What is “The Heart of Life”?
From Newell’s proxy statement:
“There's a really powerful idea that the e-commerce team is working
on in partnership with the design team, which is a brand store, an
integrated brand store platform, called ‘The Heart of Life,’ that will
give consumers and employees, but largely consumers, access to our
portfolio through a direct interface, and there's a lot more to come on
this, but at the tail end of this year, we expect to be in market with
this platform live, and we will not only have our brand stores, like
Marmot.com or Coleman.com, or YankeeCandle.com, but also this
Newell interface and marketplace up and running.”
We question whether creating an Amazon-like, Newell-products-only, e-commerce
website (which will presumably have less than 30 brands available vs. over half a
billion products available on Amazon) is a good business strategy for Newell.
2018 CAGNY Presentation
While we can understand Newell’s desire to further increase e-commerce penetration, we question whether the
Company should distract itself in creating an Amazon-like competitor.

76
III. Underperformance Creates Opportunity
C. Culture

77
We believe that empowering Newell’s employees is paramount to a successful turnaround of the Company
We Believe that Transforming Newell Brands Begins with
the Employees and the CultureThe Company’s greatest assets are its employees. We believe that the culture can be repaired through
improved management and communication.
Glassdoor rankings indicate that the employee base believes there is significant room for improvement.
Newell ranks dead last among its peers in several key categories – “Overall”, Culture & Values”, “CEO
Approval”, and “Senior Management”.
Furthermore, all of these categories have deteriorated over the past two years.
Improving communication is the first step towards fixing the culture.
Communication issues between corporate and the divisions / brands have resulted in negative financial
consequences for the Company. They have also resulted in employees feeling marginalized and caused
poor morale within the organization.
We believe that tenets of our plan will improve employee morale through an enhanced sense of
ownership in the Company’s future.
Source: Company filings.

78
The Culture at Newell Needs to Be Improved
Glassdoor.com provides current and former employees the opportunity to anonymously review companies and their management.
Peer Average: 3.7
Glassdoor Ratings Category – “Overall”
“Newell has struggled to find its identity and with it, its priorities. There is constant changes in leadership, direction and not a
lot of clarity. It can be a tough environment to navigate.”- Anonymous Employee Review
Representative Glassdoor Review:
Source: Glassdoor ratings as of April 3, 2018.
Newell Brands ranks last among peers in Glassdoor’s “Overall” employee ratings

79
Employees of Newell Brands have made it clear that they are not happy with the culture of the organization.
Glassdoor Ratings Category – “Culture & Values”
Peer Average: 3.7
“Culture is incredibly harsh. It doesn’t feel like a team environment. And then the exec team puts on an act during employee
facing meets where they pretend to be smiley and nice. We all know it’s fake. We don’t trust any of them. It’s obvious.”- Anonymous Employee Review
Representative Glassdoor Review:
The Culture at Newell Needs to Be Improved (cont’d)
Source: Glassdoor ratings as of April 3, 2018.
Newell Brands ranks last among peers in Glassdoor’s “Culture & Values” employee ratings

80
Glassdoor Ratings Category – “CEO Approval”
Peer Average: 89%
While peer CEOs are revered by their employees and given high approval ratings on Glassdoor, Newell’s employees have voiced their skepticism of management.
The Culture at Newell Needs to Be Improved (cont’d)
Representative Glassdoor Review:
“Executive leadership is incompetent, arrogant and out of touch and does not make time to meet with management…”
- Anonymous Employee Review
Michael Polk ranks last among peer CEOs in Glassdoor’s “CEO Approval” employee ratings
Source: Glassdoor ratings as of April 3, 2018.

81
Employees are questioning the leadership and strategic direction of Newell Brands’ senior management.
Glassdoor Ratings Category – “Senior Management”
Peer Average: 3.3
Representative Glassdoor Review:
“There is no planning, process, strategy, ownership or accountability here at all, and as such, everyone is always operating in
crisis mode. Executive leadership is incompetent, arrogant and out of touch and does not make time to meet with
management or even the Board when needed.”- Anonymous Employee Review
The Culture at Newell Needs to Be Improved (cont’d)
Newell Brands ranks last among peers in Glassdoor’s “Senior Management” employee ratings
Source: Glassdoor ratings as of April 3, 2018.

82
Employees are voicing significant frustration inside the Company.
“Overall” Rating - Historical Trend “Culture & Values” - Historical Trend
“Senior Management” - Historical Trend“CEO Approval” - Historical Trend
Improving the culture is key to a successful turnaround
Source: Glassdoor ratings as of April 3, 2018.
And Trends Are Continuing in the Wrong Direction

83
IV. The Opportunity to Improve Newell

84
Unacceptable Performance Provides an Opportunity for
Substantial ImprovementBased on our research, we are confident that there is an opportunity to improve EBITDA by $585 to $966
million based on actions that should be within management’s control.
Margins significantly below management’s targets and best-in-class peers
Bloated corporate structure and unnecessary / redundant layers of management
Excessive Selling, General & Administrative (SG&A) costs throughout the Company
Inefficiency in logistics / distribution and procurement
Suboptimal Working Capital management practices draining cash

85
We Have Identified Specific Opportunities to Increase
Annual EBITDA by $585 – $966 Million
– Selling, General & Administrative expenses are bloated, causing inefficiencies.
– Transformation and integration spend appears excessive and is not fully accounted for in the adjusted numbers.
– Layers of redundant executives and vice presidents add complexity.
– Newell is inefficient in business support categories, such as HR and Finance & Accounting.
– The Company appears to have a large Information Technology & support staff for a company of its size.
– Newell’s lax Travel & Entertainment expense policies have resulted in unnecessary costs.
Selling, General &
Administrative
Working Capital
Logistics
Procurement
– Newell’s Working Capital usage is currently much higher than comparable company benchmarks.
– Days Sales Outstanding and Days Inventory Outstanding are significantly higher than industry averages.
– Inventory levels are materially higher than peers.
– The Company has failed to meaningfully improve its cash conversion cycle over time.
– The Company has failed to integrate legacy Newell Rubbermaid and Jarden warehousing networks.
– Multiple Transportation Management Systems (TMSs) present organizational challenges and increase costs.
– Newell concentrated its product discharge to Southern California, giving the appearance of consolidation, but
costs may have actually increased on the back-end because a mile transported on land is much more expensive.
– Lack of collaboration with major retailers has led to unnecessary steps in the distribution process.
– The Company lacks a well structured low-cost-country (LCC) sourcing strategy and make-vs-buy strategy.
– Products in several segments are “over-spec’d” or “over-engineered” versus the competition.
– A decentralized sourcing strategy for materials hinders the Company’s ability to leverage best-in-class processes.
We believe that significant cost savings opportunities exist across various functional areas of Newell to
substantially increase EBITDA.
Source: Starboard’s proprietary report by a leading consulting firm.

86
IV. The Opportunity to Improve Newell
A. SG&A Improvements

87
We believe that there are numerous initiatives to improve SG&A that are well within management’s control.
We Believe There Is an Opportunity to Improve SG&A by
$399 million to $693 million
If properly executed, we believe Newell’s SG&A expenses can be significantly reduced
Savings Estimate
Lever Initiatives Estimated Timing Low High
Organizational Design - Eliminate excessive corporate costs and unnecessary layers of management 6 – 12 months $70 $120
Transformation Office - Significantly reduce or fully eliminate Transformation Office spending 3 – 9 months $95 $196
Corporate R&D & Marketing - Redesign product development process; eliminate centralized design; etc. 6 – 12 months $60 $124
Project Management Resources - Improve program management and eliminate unnecessary costs 6 – 12 months $6 $12
Finance & Accounting - Reduce redundant finance teams and improve organization design 6 – 12 months $27 $47
Human Resources - Reduce redundant HR resources and eliminate non-core functions 6 – 12 months $5 $11
Operations Support - Reorganize operations support; outsource non-core functions 12 – 18 months $18 $28
IT Organizational Efficiency - Eliminate redundant IT systems; improve service delivery 12 – 18 months $39 $55
T&E Expense Policies - Review travel policies; tighten approval for 3rd party spend 3 – 6 months $64 $64
Corporate Jet Maintenance - Eliminate 2 to 3 corporate jets 3 – 6 months $6 $8
Leverage Global Scale - Utilize global shared services to leverage lower-cost regions 12 – 18 months $9 $28
Total SG&A Opportunity: $399M $693M
Source: Starboard’s proprietary report by a leading consulting firm.

88
Mergers typically result in office consolidation, but, after acquiring Jarden, Newell actually increased its main
corporate office locations.
Newell’s Corporate Offices Should Be Consolidated…
Corporate office consolidation is typically among the first synergies realized; yet Newell absorbed dis-
synergies by expanding its corporate office footprint!
Jarden Corporation Newell Rubbermaid
Corporate Office –
Executive Management
Miami, FL
Boca Raton, FL
Corporate Office -
Legal
Norwalk, CT
Corporate Office - IT
Corporate
Headquarters
Atlanta, GA
Newell Brands
Atlanta, GA
Corporate Office
Norwalk, CT
Corporate Office
Corporate
Headquarters
Hoboken, NJ
Corporate Office -
E-Commerce
Brooklyn, NY
Corporate Office -
Legal
Boca Raton, FL
3 1 5??
Source: Starboard’s proprietary report by a leading consulting firm.

89
We believe that Newell’s private jet usage is excessive and needs to be immediately reviewed
Dassault Falcon 2000EX Dassault Aviation Falcon 2000EX
Fixed wing; multi-engine
(19 seats / 2 engines)
N-Number: 716CQEstimated Value:
$12 - $15 million
Dassault Falcon 900EX
Fixed wing; multi-engine
(21 seats / 3 engines)
N-Number: 904NBEstimated Value:
$10 - $12 million
Cessna 750
Fixed wing; multi-engine
(12 seats / 2 engines)
N-Number: N72FDEstimated Value:
$3 - $4 million
Dassault Falcon 900EX
Cessna 750
…And Usage of Corporate Jets Should Be Rationed…
We believe that Newell has 3-5 corporate jets in addition to numerous NetJets contracts.
Source: Starboard’s proprietary report by a leading consulting firm.

90
…Despite the Senior Management Team Being Spread Out
Newell’s senior executive leadership team is scattered across the US and UK, making communication with teams difficult and resulting in, what we believe to be, an extremely elevated T&E budget.
London
How can senior management focus on running the business when they are so scattered?
Chicago
Kalamazoo
Hoboken
Boston
Atlanta
Huntersville
A number of senior
executives commute
from other cities on
private planes
Source: Starboard’s proprietary report by a leading consulting firm.

91
Corporate Costs Are Increasing…
CEO
COO CFO CLO CMO R&D
Corporate: R&D – Kalamazoo, MI
(100s of People)
Corporate: Marketing – Hoboken, NJ & UK
(100s of People)
Corporate: Online – Brooklyn, NY
(~500 people) Significant
Direct
Staff(HR, Finance,
etc.)
Newell continues to add numerous additional layers within
its senior management ranks, resulting in significant and
unnecessary duplicative costs and responsibilities.
Newell has created additional global layers in R&D,
Marketing, Online / E-commerce, etc. that not only burden
the P&L, but also create unnecessary complexity and
bottlenecks.
Illustrative Organizational Structure Additional Corporate Layers / Silos
Observations
Over the past several years, and especially since the Jarden acquisition, Newell has continued to add layers of management and additional executives, resulting in, what we believe to be, a large corporate cost reduction opportunity.
The combination of Newell’s “corporate cloud” and additional layers / silos has resulted in Newell
operating a bloated corporate structure
Division Presidents with Staff
Brand Managers with Staff
Brand Employees
The “Corporate Cloud”
Source: Starboard’s proprietary report by a leading consulting firm.

92
…And Corporate Bureaucracy Appears Excessive…
CORPORATE
Division CEO / Head of Brand
CFO │ COO │ Supply Chain │ HR │
Regional Presidents
Field Sales
Trade Marketing
Engineering (Plant
and Supply Chain)
Reports to e-commerce head
Determines online pricing regardless of
whether retailer has brick-and-mortar
store
Can also reside in Corporate
depending on the division /
brand
If no Field Sales in Division,
would have to speak with
channel sales in corporate to
know product sales trends;
Very limited communication
with Brand Marketing
Very limited communication
with R&D, resulting in new
products having to be
redesigned along with
sourcing issues
Division / Brand Level E-commerce
Research and
Development
Brand Marketing
Limited communication among the different functional groups not only results in duplicative costs, but also
frustrates customers and causes poor employee morale.
Responsible for
ultimately selling the
product
Responsible for in-store
promotions and in-store
support
Responsible for
manufacturing
engineering products
Reports to Richard Davies
New product design operated out of
Kalamazoo, MI
Works on new product development
Reports to Richard Davies
National marketing and website design
New product development and pricing
Prices online products
without the knowledge of
division / brand, sometimes
violating Company’s own
minimum pricing policy for
some retailers, and in other
cases, results in presenting
different prices to the same
retailer (i.e. Walmart vs
Walmart.com)
Operates Design center in a
silo away from Division;
months or years of research
with high kill rate because
Division leaders have little
to no input
Limited communication
with Division Trade
Marketing and Sales (who
have customer relationships)
which results in bringing
forward products that
retailers don’t want
Given revenue and
operating plan from
corporate with
limited control over
actual P&L levers
Source: Industry research and interviews.
Lack of communication

93
With ~500 VP and Executive level titles,
Newell appears to be overweight in
management layers.
Newell has multiple management layers
and we believe this additional
hierarchical infrastructure creates
added complexity in the organization.
Developing an organizational structure
that increases executive responsibility
and reduces top level positions, while
maintaining shared services, would
minimize disruption while reducing costs.
Based on best-in-class peers, we believe Newell’s corporate and executive leadership should be
consolidated, resulting in ~$70 to $120 million in savings
Observations
…Resulting in Unnecessary Layers of Management…
Layers of Management (Total: ~49,000; Total Spend: ~$4 billion)
PositionEstimated
Headcount
Number of
Employees
Reporting to
Position (Span)
Est. Cost Per
Employee
Est.
Personnel
Spend
Target
“Span”
Est.
Savings
Range
VP/
Executive500 1.8X $360K $180M
3.0X –
6.0X
$70M -
$120M
Director 900 6.8X $225K $200M
Manager 6,100 6.8X $155K $950M
Staff 41,500 $67K $2.8B
VP / Executives have fewer direct reports,
indicating a top heavy corporate structure
Newell has additional, unnecessary layers of management, which drives up the number of VPs and C-level
executive titles within the organization.
We believe that the current structure has resulted
in Newell obstructing entrepreneurial decision
making and creating bottlenecks, causing the
Company to miss opportunities in the marketplace
Source: Starboard’s proprietary report by a leading consulting firm.
Note: Cost per employee assumes a 25% benefits rate and variable annual incentive bonuses; adjusts for regional pay variance; A portion of the high-end of cost savings target has been captured in the Transformation Office.

94
Several years after its formation, the Transformation Office continues to operate and will continue to be
a drag on both operating income and cash flow
The Transformation Office was supposed to be a temporary business unit, but it continues to weigh on the P&L
with no end in sight.
The understood purpose of the Transformation Office (“TO”),
which operates as a separate team within corporate, is to execute
on Newell’s cost savings plans.
We believe that the Transformation Office was supposed to be a
temporary cost. However, in reality, it has become an ongoing
cash expense for over 3 years with seemingly no end in sight.
We estimate that the TO – which, we believe, employs a
combination of consultants and Newell business unit
employees – had collective costs of ~$247 million in 2017, but
those costs are excluded from adjusted operating metrics.
…And an Overstaffed “Transformation Office”
Source: Company filings, industry research and interviews.
“We've formed a transformation office that is diving on a
number of different work streams to see whether there's
paths to pull forward 2016 savings into 2015. It's too
early to know whether we'll be able to do that. But
clearly, that's something that's top of mind for John
[Stipancich], for myself, for the whole executive
leadership team.”- CEO Michael Polk, January 2015
Q4 2014 Earnings Call
“So, we've organized our synergy and savings delivery
through what we call the Transformation Office. Those
costs get normalized out of the P&L…They don't stop
this year. The program was never designed that way.”
- CEO Michael Polk, February 2018
Q4 2017 Earnings Call
- Consumer Analyst Group of New York, February 2016

95
$120
$247
$80
$16
$30
Transformation
Office
Personnel Costs
3rd Party
Expense
Travel
& Entertainment
Other
Expenses
Total
We believe that the Transformation Office (TO) is made up of a large number of full-time employees (FTEs), significant 3rd party expenses (e.g. consultants), an enormous T&E budget, and other non-value added expenses.
– Many of the employees allocated to the Transformation Office will eventually have to return to the business segments, creating a future drag on the P&L.
We believe that the Transformation Office is unwarranted as the Company is unnecessarily relying on excessive consultants, which is a recurring cash cost, and operating with bloated T&E budgets (e.g., private air travel, company cars, etc.).
Newell should immediately review the P&L and policies (especially T&E) of the Transformation Office and determine what amount, if any, is absolutely necessary and justified.
Estimated Transformation Office Cost Structure
($ in millions)
Observations
Transformation and integration costs continue to significantly burden the P&L and cash flow.
A significant portion of Newell’s Transformation Office expenditures are unnecessary and should be eliminated
Transformation and Integration Spend Appears Excessive
Opp: $120M $48M $16M $12M $196M
Est. %
Savings100% 60% 100% 40%
Source: Starboard’s proprietary report by a leading consulting firm.

96
1) Headcount Reduction:
a) Conduct bottom-up review of TO org structure and identify non-value add activities and resources
Implement cultural shifts required to execute on streamlined transformation group
Review existing internal projects and ensure they are ROI- and time-based, allowing for
headcount reduction
Identify key performance indicators (KPIs), metrics and benchmarks to establish clear goals and
objectives for the Transformation Office
2) Significantly Reduce 3rd Party Spend:
a) Review all 3rd party activities and overlap with business unit capabilities
b) Reassign overlapping initiatives to business units
c) Reduce remaining unnecessary 3rd party spend
Review and renegotiate existing 3rd party contracts to establish “more skin in the game”
Define and build / hire key capabilities internally to reduce reliance on 3rd party resources
3) Improve Management of T&E Policies:
a) Immediately review all T&E policies (e.g., transportation, private planes, cars, etc.) and determine
how much is absolutely necessary
Define revised travel parameters that are aligned with the revised corporate culture and budgetary
goals, but flexible enough to account for travel in response to business dynamics
Implement expense reporting and travel reservation / monitoring software (e.g., Concur) that
provides “travel guardrails” (e.g., air, meal, hotel, and ground transportation policies)
Establish random expense report auditing, including spend benchmarks to ensure compliance
Cost Savings Opportunity
We have identified several initiatives, and outlined an implementation plan, by which Newell can
eliminate a significant portion of the Transformation Office
Unnecessary Transformation Office costs continue to burden Newell’s actual profitability and cash flow, and
should be eliminated.
Implementation Plan
We believe Newell could reduce or fully
eliminate a majority of the
Transformation Office (TO) and save
between $95 and $196 million by
streamlining its organization and executing
several initiatives:
1) Headcount reduction
2) Significantly reduce reliance on 3rd
parties (e.g., consultants) and/or
renegotiate existing agreements (e.g.,
gain share agreements vs. fixed fee)
3) Implement improved Travel &
Entertainment policies (e.g., coach
vs. business, per diem limits,
preferred airline carriers and hotels,
etc.)
Significantly Reducing or Fully Eliminating a Majority of the
Transformation Office Could Potentially Save ~$95 to $196 million
Source: Starboard’s proprietary report by a leading consulting firm.

97
Newell has a plethora of product management, development, design, and engineering personnel in its corporate R&D and corporate brand marketing organization.
Many of the design personnel are located in Kalamazoo, MI, while others are scattered throughout several corporate locations.
In fact, we believe Newell’s product management, development, design, and engineering staff is >3x that of top quartile peers (without leading to more innovation).
Corporate R&D and corporate brand marketing operate in silos, developing new products without the proper oversight and input from the business units.
This leads to excessive new product concepts without an appreciation for cost and return on investment.
In fact, in 2017 alone, Newell tested >1,300 concepts. However, such a large volume of concepts often leads to high product concept kill rates, lengthy time to market, and unnecessary cost increases.
Due to a complex and inefficient corporate product development process, we believe Newell’s R&D and
marketing organization has >3x as many personnel as top quartile peers
When benchmarking the size of Newell’s R&D and marketing organization versus peers, Newell’s organization
appears bloated and inefficient.
Observations
Newell’s Corporate R&D and Corporate Marketing
Organization Is Burdened by Inefficiencies
R&D & Marketing FTEs per $1B in Revenue
Est. Savings $60 million $124 million
(71%)
Source: Starboard’s proprietary report by a leading consulting firm.
Note: A portion of the Benchmark Top Quartile cost savings target has been captured in the Transformation Office.

98
1) Increase Focus & Accountability on ROI:
a) Establish stricter metrics for ROI and move more
quickly with go/no-go decisions
b) Fully engage business units early and throughout the
product development process
2) Eliminate Centralized Design & Innovation Hubs:
a) Consolidate corporate R&D and corporate brand
management locations and personnel where prudent
b) Optimize layers and personnel within the
restructured organization
3) Product Development Model:
a) Identify core and non-core areas of product
development
b) For non-core areas, develop an outsourced operating
model
Cost Savings Opportunity
There is a substantial opportunity to improve the corporate R&D and corporate marketing
organization and significantly reduce costs
We have identified several initiatives, and outlined an implementation plan, by which Newell can significantly
improve its corporate R&D and corporate brand marketing organization.
Implementation Plan
Streamlining the Inefficient Corporate R&D and Corporate
Marketing Organization Could Save ~$60 to $124 million
We believe Newell could save between $60 and
$124 million by streamlining its corporate R&D
and corporate brand marketing organization
through several initiatives:
1) Redesign the product development process
with an increased focus and accountability
on ROI
2) Eliminate centralized design and
innovation hubs
3) Shift to an outsourced product
development model
Source: Starboard’s proprietary report by a leading consulting firm.

99
IT
Other
0
5
10
15
20
25
30
35
Newell Brands Median
Benchmark
Top
Quartile
Newell Utilizes Almost Twice the Project Management (PM)
Personnel Compared to Top Quartile Peers
Newell appears to have excessive personnel associated with program and project management across its business.
We believe that this is due to executive leadership across the organization (e.g., operations, R&D, etc.) over-utilizing PM resources for unknown return-on-investment (ROI) projects.
– In addition, spending on these resources is inadequately tracked, resulting in certain areas of Newell receiving outsized resources relative to the value generated.
For example, for the >1,000 product concepts annually generated by R&D, each concept is tasked with PM personnel to manage the development process from concept to production.
– Because the hit rate is so low, this results in excess project managers relative to potential successful products and ultimate revenue opportunities.
Project Management Resources per $1B Revenue
Est. Savings $6 million $12 million
Program and PM personnel utilization should be improved to save ~$6 to $12 million
Observations
Due to Newell’s complex product development process, the Company utilizes superfluous project management resources.
31
27
18
(41%)
Source: Starboard’s proprietary report by a leading consulting firm.
Note: A portion of the Top Quartile cost savings target has been captured in the Transformation Office.

100
We believe that Newell can more efficiently utilize project management personnel
Project Management resources appear excessive and do not appear to be tied to any return-on-investment
(ROI) metrics.
More Efficient Utilization of Program and Project
Management Personnel Can Save ~$6 to $12 million
1) Improve Focus on New Concept Design:
a) Improve efficiency, accountability, and expense
management of concept design process
b) Shift more responsibility to the business units,
thereby reducing reliance on PM resources
2) Demand Manage Project Selection:
a) Establish a standardized program management
playbook and methodology including: guidelines
required to activate PM personnel, job scope
details, and expense policies
b) Set criteria / threshold (e.g., capital investment,
complexity, etc.) for PM usage
c) Allocate resources based on ROI framework and
likelihood of project success
Cost Savings Opportunity Implementation
We believe Newell could save between $6 and
$12 million by executing the following
initiatives:
Improve focus on new concept design,
thereby reducing excessive program
management personnel
Source: Starboard’s proprietary report by a leading consulting firm.

101
F&A FTEs Per $1 Billion in Revenue
By consolidating its finance groups, Newell can significantly reduce F&A costs
106
92
72
50
75
100
125
Newell Brands Benchmark
Median
Benchmark
Top Quartile
Est. Savings $27 million $47 million
We believe that Newell is operating multiple redundant finance teams, which leads to internal confusion,
unclear reporting structures, and excess costs.
Finance & Accounting (F&A) Costs Are Well Above Top Quartile
Peers, Which Is the Result of Newell’s Numerous Finance Groups
We believe that there may be separate finance teams for almost every functional group at Newell.
– For example, in addition to each business having its own CFO or finance team, we believe that each of the following executives have their own finance team – CEO (partial), President, COO, Chief Development Officer, CEO of E-commerce, R&D) – in addition to the finance organization reporting to the CFO.
Observations
One former senior executive put it bluntly when
talking about reporting his division’s financial
results to corporate:
“It was not really clear who I was supposed to
report to.”
(33%)
Source: Starboard’s proprietary report by a leading consulting firm.
Note: A portion of the Benchmark Top Quartile cost savings target has been captured in the Transformation Office.

102
Based on benchmarks, Newell has the opportunity to reduce headcount in business support categories and
achieve cost savings of approximately $27 to $47 million.
Reducing Finance & Accounting Costs Can Save ~$27 to $47 million
1) Centralize Finance / Organization Design:
a) Centralize finance and remove redundant finance
teams
b) Clearly indicate finance reporting lines to the
business units
c) Identify critical needs for financial analysis and
planning in the organization
d) Identify required personnel for the new operating
model
2) Automation / Technology Systems:
a) Reduce / eliminate redundant technology systems
b) Automate highly manual or critical processes
c) Improve and simplify complex Finance &
Accounting approvals and workflows
Cost Savings Opportunity Implementation
To reduce costs in Finance & Accounting (F&A),
Newell should:
1) Centralize finance and remove redundant
finance teams
2) Improve organizational design and
financial analysis coverage model
3) Reduce overall workload through
automation and improved workflows
Reducing F&A costs can save ~$27 to $47
million
Reducing redundant finance teams and improving organization design are crucial to reducing internal
complexity and optimizing Finance and Accounting expenditures
Source: Starboard’s proprietary report by a leading consulting firm.

103
HR FTE Per $1 Billion in Revenue
44
41
35
20
30
40
50
Newell Brands Benchmark
Median
Benchmark
Top Quartile
Est. Savings $5 million $11 million
By eliminating redundant Human Resource groups, Newell can significantly reduce HR costs
We believe that Newell is operating redundant HR teams – at the corporate and business unit level – which
creates internal confusion, excess resources, and elevated costs.
Human Resource (HR) Costs Are Well Above Top Quartile
Peers Due to Duplicative Internal HR Groups
Human Resource spending is incredibly bloated because there are multiple layers – i.e., a divisional HR layer and a large corporate HR layer that is responsible for all of the various corporate business functions.
– This creates significant duplicative functionsand excess costs.
HR infrastructure is also likely burdened by an increase of dedicated resources to non-core HR areas such as training, professional development, and organizational development.
– By focusing the roles of key HR employees and reducing or eliminating expendable, non-core functions, Newell can reduce the Company’s bloated HR costs.
Observations
(21%)
Source: Starboard’s proprietary report by a leading consulting firm.
Note: A portion of the Benchmark Top Quartile cost savings target has been captured in the Transformation Office.

104
Based on benchmarks, Newell Brands has the opportunity to reduce HR headcount and achieve cost savings of
approximately $5 to $11 million.
Reducing HR Costs Can Save ~$5 to $11 million
1) Consolidate HR Groups:
a) Review workflows for corporate and division
HR personnel
b) Reduce and consolidate corporate and division
HR groups
c) Clearly outline reporting structure, roles, and
responsibilities
2) Non-Core HR Functions:
a) Reduce expectations by management for use of
HR for typical managerial functions such as
personnel management, interviewing, and
recruiting
b) Identify non-core HR functions
c) Reduce or eliminate personnel in these areas,
shifting responsibility of these functions to
management
Cost Savings Opportunity Implementation
Newell can effectively reduce costs in Human
Resources by:
1) Reducing and consolidating redundant
HR groups
2) Reducing or eliminating non-core HR
functions
Reducing HR costs can save ~$5 to $11
million
By focusing the roles of key HR employees and reducing or eliminating expendable, non-core functions,
Newell can reduce the Company’s bloated HR costs
Source: Starboard’s proprietary report by a leading consulting firm.

105
Newell Has Greater Than Twice the Operations Support Compared to
Top Quartile Peers Likely Due to Inefficient Organizational Planning
Opportunity exists to reduce overall operations
support, as we believe that this group exacerbates
the “analysis paralysis” (e.g., superfluous market
share studies, sales reports, etc.) problem at Newell.
Newell Brands currently has 1 support person for
every ~4 to 5 sales personnel.
The top tier in the industry is closer to 1
support person for every ~7 to 10 sales
personnel.
Potential levers for reduction include:
• Workflow process improvement
• Enhanced system automation
• Streamlined order management
• Use of outsourced providers for routine or
low-value addition requests
Operations support to customer-facing sales professionals is suboptimal due to substandard support workflows,
technology complexity, and inefficient operating models.
Sales Personnel per Operations Support Personnel
Est. Savings $28 million $18 million
Sufficient support for the salesforce is essential, but we believe Newell is not maximizing resources
1
2
3
4
Observations
(54%)10.0x
Source: Starboard’s proprietary report by a leading consulting firm.

106
1) Workflows and Technology:
a) Reduce complexity and systems to be
managed and monitored by operations
support personnel
b) Identify high touch and manual steps in
workflows and processes
c) Reduce workload through automation
d) Examine usefulness and necessity of the
various functions
2) Outsourced Support Model:
a) Identify core and non-core processes and
functions
b) Shift non-core functions to an outsourced or
lower cost model
Cost Savings Opportunity
By reducing complexity and shifting to a more outsourced support model, we believe that Newell can
improve the profitability of its sales organization
Implementation
Rightsizing the Operations Support Group Could Save
~$18 to $28 million
We believe Newell could save between $18 and
$28 million by rightsizing the operations support
to customer-facing sales professionals by
executing the following initiatives:
1) Improve workflows and technology
2) Shift lower value additional support
functions to an outsourced model
There is an opportunity to streamline operations support to improve efficiency and reduce costs.
Source: Starboard’s proprietary report by a leading consulting firm.

107
Newell Operates Redundant IT Systems that Can Be
Consolidated to Generate Significant Savings
Newell appears to have a high level of IT
staffing (employees that maintain the IT
infrastructure – e.g., computers, applications,
office suite, etc.) for a company of its size.
Legacy infrastructure and limited system
consolidation may be a factor in maintaining this
high level of staffing.
Management’s delay in integrating to a
consolidated ERP system has limited the
Company’s ability to effectively reduce this
staffing need.
Newell can achieve savings of $39 to $55 million in IT, with the higher-end savings potentially driven by system
consolidation.
IT FTEs Per $1 Billion Revenue
Est. Savings $39 million $55 million
Newell appears to have a high level of IT staffing, likely driven by historical reluctance to integrate
legacy infrastructure
Observations
77
51
24
Newell Brands Benchmark
Median
Benchmark
Top Quartile
Source: Starboard’s proprietary report by a leading consulting firm.
Note: a portion of the Benchmark Top Quartile cost savings target has been captured in the Transformation Office.
(69%)

108
Newell can significantly reduce IT staffing expenditures with the elimination of redundant systems and
operating delivery model improvement
High levels of IT personnel are driven by the sheer number of IT applications, redundant ERP systems, and
inefficient operating models.
Consolidating IT Systems and Eliminating Redundant IT
Staffing Needs Can Save ~$39 to $55 million
1) System Consolidation:
a) Identify future state architecture and future state
systems for consolidation
b) Develop a roadmap for system consolidation
and data migration
c) Execute on the roadmap with an aim to
consolidate to one ERP system and eliminate
redundant applications across the entire
organization
2) Service Delivery Model:
a) Identify inefficiencies in IT relationships and
coverage model
b) Implement a consistent and standard procedural
model
c) Improve the service delivery model to improve
agility and leverage outsourcing and offshore
opportunities when possible
Cost Savings Opportunity Implementation
Cost reduction levers within IT staffing
include:
1) Eliminate large number of IT applications
or redundant ERP systems
2) Improve operating and service delivery
model
Consolidating IT systems can save ~$39 to
$55 million
Source: Starboard’s proprietary report by a leading consulting firm.

109
We Believe T&E Policies Need to Be Reconsidered
Newell’s management has built a lavish corporate bureaucracy with little focus on best practices
Newell Brands Industry Best Practice
Executive Perks
(corporate jets &
NetJets accounts)
Senior employees frequently commute by private
aircraft and private car services.
Corporate jets for executive travel have been eliminated
or reduced.
Fly commercial airlines whenever practical.
Use private aircraft as needed for multi-office day visits
and special meetings.
Charter planes for exceptional circumstances, rather
than purchasing planes and keeping crews on standby.
Corporate Retreats
Newell schedules numerous retreats on an
annual basis, frequently in lavish locations and
drawing employees from all over the world.
Corporate executives should fly commercial whenever
possible.
Locations should prioritize functionality and
convenience over luxury.
Company should use best efforts to limit excessive
T&E.
Headquarters
Building
Newell operates 5 corporate offices including
one waterfront property in Hoboken, NJ, and
another waterfront property in the chic Brooklyn
village, Dumbo.
Headquarters are designed for efficiencies and to
minimize total cost.
Other
Bureaucratic senior management with numerous
duplicative executive staff for corporate officers.
VP titles of seemingly endless permutations
(e.g., VP, Brand Activation and Trade
Marketing, Consumer and Commercial Solutions
at Newell Brands).
Promote lean and productive teams / managers.
Outsource non-critical functions to drive profitability
and maintain focus on core objectives.
Enforce tight and standard policies, audit, and strictly
enforce.
Conduct annual employee reviews to judge
performance.
Source: Starboard’s proprietary report by a leading consulting firm.

110
Newell’s Lax T&E Expense Policies Have Resulted in an
Expense Ratio Well Above Top Quartile Peers
Newell can potentially save ~$64 million through
increased oversight of, and accountability for, its
T&E practices.
Potential levers in this category include:
Improved and tightened travel policies (e.g.,
private air travel, company cars, company
retreats / off-sites, etc.)
Ensure Concur policies are instituted, up to
date, and being adhered to
Tighten approval process for, and governance
of, 3rd party spend
We believe that the expense policies at Newell are excessive and appear unregulated, presenting an opportunity
to save ~$64 million through increased oversight and adopting industry best practices.
ObservationsT&E Expense (% of Total Costs)
Newell shareholders would benefit from the Company instituting the mantra “spend the Company's
money like it's your own”
1
2
3
We believe that spending policies may differ greatly
between corporate and the divisions, creating
misalignment of incentives and employee morale issues
(50%)
1.50%
1.00%
0.75%
0.0%
0.5%
1.0%
1.5%
2.0%
Newell Brands Benchmark
Median
Benchmark
Top Quartile
Source: Starboard’s proprietary report by a leading consulting firm.

111
Newell’s Corporate Retreat to Nantucket…T&E Policies
Clearly Need to Be Reviewed
We believe that this retreat cost shareholders millions and millions of dollars
We believe Newell hosted a company offsite / retreat in Nantucket, MA during the summer of 2017 (Nantucket’s
peak season) with approximately 100 to 150 employees arriving in private planes from all over the world.
Private planes on the tarmac at Nantucket
airport (ACK)
Many employees
stayed at the
White Elephant,
the most
expensive hotel
on Nantucket
Source: Company filings, Industry expert interviews, and Capital IQ.

112
We Believe There Is an Opportunity to Significantly Reduce or Completely
Eliminate Newell’s Fleet of Private Planes and Reduce Operating Costs
Eliminating 2 to 3 corporate jets could save approximately ~$6 to $8 million in annual operating costs
Dassault Falcon 2000EX Dassault Aviation Falcon 2000EX
Fixed wing; multi-engine
(19 seats / 2 engines)
N-Number: 716CQEstimated Value:
$12 - $15 million
Dassault Falcon 900EX
Fixed wing; multi-engine
(21 seats / 3 engines)
N-Number: 904NBEstimated Value:
$10 - $12 million
Cessna 750
Fixed wing; multi-engine
(12 seats / 2 engines)
N-Number: N72FDEstimated Value:
$3 - $4 million
Dassault Falcon 900EX
Cessna 750
Newell possesses several private planes, which are expensive to operate and maintain.
Newell absorbs significant costs associated with maintaining a fleet of private planes, including:
Pilots and crew members
Normal maintenance
Hangar fees
Insurance
Source: Starboard’s proprietary report by a leading consulting firm.

113
Increased Utilization of a Global Shared Services Model to
Leverage Low-Cost Locations Can Save $9 to $28 million
Function
Estimated Savings ($M)
Low High
Accounting $5 $16
Finance $2 $6
Human Resources $2 $6
Estimated
Opportunity:$9 million $28 million
Strategically centralizing services into a global
shared service center may allow for demand
aggregation.
Centralizing accounting may allow for the
largest opportunity with centralized ERP.
Certain Finance and Human Resources savings
are available through leveraging low-cost
locations for specific functions.
Opportunities to Leverage Low-Cost Locations
We believe that there are numerous opportunities to generate savings from increased utilization of global
shared services
Observations
Source: Starboard’s proprietary report by a leading consulting firm.
Given Newell’s global footprint, the Company should be reaping more savings from global shared services.

114
Develop an organizational structure that eliminates excessive corporate
costs and unnecessary layers of management
Significantly reduce or eliminate the Transformation Office spending
through headcount reductions, decreased reliance on 3rd party spend, and
improved T&E spend policies
Streamline the corporate R&D and corporate marketing organization, and
redesign the product development process
Reduce reliance on and eliminate unnecessary costs from project
management resources
Centralize finance functions and reduce redundancies
Reduce redundant HR resources and eliminate non-core functions
Reorganize operations support and outsource non-core functions
Eliminate redundant IT systems and improve IT's service delivery model
Review and tighten T&E policies (e.g., private planes, company cars, etc.)
Increase utilization of global shared services
We estimate the opportunity to reduce SG&A costs to be $399 to $693 million by achieving spend levels in line with those of peers and the elimination of unnecessary / redundant positions.
We estimate the opportunity to reduce SG&A costs to be $399 to $693 million
Implementing the SG&A Opportunity
Key Initiatives
1
2
3
4
5
6
7
Low High
Organizational Design $70 $120
(+) Transformation Office $95 $196
(+) Corporate R&D & Marketing $60 $124
(+) Project Management Resources $6 $12
(+) Finance & Accounting $27 $47
(+) Human Resources $5 $11
(+) Operations Support $18 $28
(+) IT Organizational Efficiency $39 $55
(+) T&E Expense Policies $64 $64
(+) Corporate Jet Maintenance $6 $8
(+) Leverage Global Scale $9 $28
Total SG&A Opportunity: $399M $693M
Cost Opportunity
8
9
10
Source: Starboard’s proprietary report by a leading consulting firm.

115
IV. The Opportunity to Improve Newell
B. Procurement Improvements

116
Finished Goods
Resin
Chemicals
Packaging
Metal - Steel
Glass
Textiles
Wax
Other
Newell’s Cost of Goods Sold Is Greater Than $9 Billion;
Therefore, Procurement Optimization Is Essential
Newell Brands Estimated Breakdown of Materials in Cost of Goods Sold
We estimate the breakdown of Newell’s Cost of Goods Sold (COGS) based on a thorough, bottom-up analysis,
industry interviews, competitive benchmarks, and sector experience.
COGS is Newell’s largest expense item and presents significant opportunity for rationalization
Polyethylene,
Polypropylene, Polystyrene,
Colorants, etc.
Inks, Fragrances, etc.
(Other metals, wood, rubber, etc.)
Items purchased from
contract manufacturers
Source: Starboard’s proprietary report by a leading consulting firm.

117
Opportunity
CategoryLow-Cost-Country
(LCC) Sourcing
Manufacturing
Process Materials Sourcing
Finished Goods
Resin
Chemicals
Packaging
Metal – Steel
Glass
Textiles
Wax
Paper
Electrical Components
All Other
While cost improvements may vary by expense category depending on the key drivers, we are confident that
in combination there are significant savings opportunities within procurement spend.
We believe a lack of focus and the inability to integrate acquisitions has caused bloated procurement
spending at Newell
A Large Procurement Opportunity Exists Across Multiple
Expense Categories
Source: Starboard’s proprietary report by a leading consulting firm.

118
We Believe There Are Several Key Levers to Generate
Procurement Savings of ~$137 to $200 million
We believe there is an opportunity to improve procurement operations by $137 to $200 million
We believe a Company-wide, collective focus can help generate significant procurement savings, driven by
increased effectiveness in core categories while taking other categories to the next level of cost management.
Savings Estimate
Lever Initiatives Estimated Timing Low High
Low-Cost-Country Sourcing &
Production
- Move procurement / production to low-cost countries
when viable
- Consolidate underutilized manufacturing facilities
9 – 18 months $45 $64
Optimize Manufacturing
Processes / Eliminate
Inefficiencies
- Comprehensive review of product & packaging design to
drive cost reductions (i.e. convert packaging similar to
peers, focus on uniform parts, reduce complexity, etc.)
9 – 18 months $62 $93
Improve Material Sourcing
Practices
- Improve total cost management approach to materials
- Leveraging scale to reduce pricing6 – 9 months $30 $43
Total Procurement Opportunity: $137M $200M
Source: Starboard’s proprietary report by a leading consulting firm.

119
33.0%
38.9% 39.5% 44.2%
49.6% 52.9% 54.2% 55.6% 57.1%
62.2% 62.9% 63.3% 65.1%
TUP LSE
RB
CL PBH PG XTRA
HEN3
CHD CLX LSE
ULVR
SWK SPB FBHS NWL
Newell’s Sourcing & Production Strategies Are
Inconsistent and Rely on Too Many High-Cost Locations
We believe Newell’s sourcing inefficiencies are due to its poor integration of Jarden and its ongoing
lack of focus on core cost containment initiatives
We believe high-cost sourcing and production are major contributors as to why Newell has the highest Cost of
Goods Sold as a percentage of revenue among its closest peers.
Cost of Goods Sold (% of Sales)
Peer Average: 51%
Newell does not appear to have a well structured low-cost-country sourcing strategy or make-vs-buy strategy,
resulting in:
– Products being manufactured in high-cost countries;
– Similar products being manufactured / sourced from multiple regions, both of which result in higher costs.
We have found these inconsistencies throughout the organization, within certain business segments and even within
specific brands.
Source: Company filings, Starboard’s proprietary report by a leading consulting firm, and CapitalIQ.
Note: Reflects LTM Cost of Goods Sold.

120
Example: Inconsistent Sourcing of Commercial Products
Newell’s sourcing strategy has resulted in higher costs compared to the competition
Newell appears to be sourcing commercial products in both higher-cost, as well as geographically different,
locations, driving up costs compared to competitors.
Competition
Made in USA Made in Mexico Made in Pakistan
Low-Cost Countries
High-Cost Countries
Same Product / Different LocationsCompetitors are taking advantage of
lower-cost manufacturing
Source: Starboard’s proprietary report by a leading consulting firm.

121
Specifically within Quickie, there appears to be an inconsistent sourcing and production strategy, presenting
an opportunity to source from lower-cost countries, which could generate significant savings.
Quickie products appear to be manufactured in multiple countries – both higher-cost and lower-cost –
rather than being consolidated into lower-cost locations
Low-Cost Countries
High-Cost Countries
Made in ItalyMade in Mexico Made in China
Example: Inconsistent Strategy within Quickie Products
Source: Starboard’s proprietary report by a leading consulting firm.

122
We believe that there is a significant opportunity to move volume to low-cost countries
Observations
A number of Newell’s brands operate in one or more facilities in the United States, presenting a significant
opportunity to lower costs by sourcing products from low-cost countries.
Several brands have one or more
manufacturing facilities in the US.
In total, Newell Brands has 48
manufacturing facilities in North
America.
There is a significant opportunity to
move volume to low-cost countries to
reduce costs.
Specifically, moving products that have
less automated manufacturing processes,
more labor / assembly, and are not too
bulky to ship (example: Quickie) are
clear opportunities.
Switching to Low-Cost-Country Sourcing Is a Significant
Opportunity
Brand
US Manufacturing
Facilities Count
Manufacturing
Locations in US
Sunbeam 2 MO, TX
Calphalon 1 OH
Rubbermaid 2 KS, OH
Ball 1 IN
NUK 1 WI
Yankee US wholesale 2 MD, MA
Sharpie 3 TN, TN, TN
EXPO 3 TN, TN, TN
Elmer's 1 NC
Jostens 3 CA, TN, TX
Rubbermaid Commercial 2 TN, VA
Quickie/Spontex/MAPA 6 KS, NC, NJ, TX, TX, VA
Waddington 7 CA, GA, MA, NY, TX, TX, TX
Coleman 2 KS, MN
Shakespeare/Berkeley/ABU Garcia 1 IA
Rawlings 1 MN
Process Solutions 7 ME, MO, NA, PA, SC, TN, TN
Rainbow 1 MI
Bicycle +others 1 KY
Source: Starboard’s proprietary report by a leading consulting firm.
Includes shared locations; does not include all manufacturing facilities in North America

123
More Efficient Sourcing & Production Could Also Result
in Manufacturing Plant Consolidation Opportunities
Example:
Potential offshore opportunity
for Quickie manufacturing sites
Consolidating into low-cost countries would result in substantial manufacturing consolidation opportunities.
Existing Newell Brands Footprint (Estimated)
Newell operates multiple higher-cost manufacturing sites than can be consolidated
Source: Starboard’s proprietary report by a leading consulting firm.

124
For Reference, a More Efficient Sourcing Strategy Could Result
in a 10 – 15% Reduction in Manufacturing & Distribution Costs
Operating a more efficient manufacturing & distribution footprint can yield significant cost savings.
Typical Cost Breakdown for a Manufacturing Company
(% of Net Sales)
Opportunity
Newell’s inefficient and underutilized
manufacturing network lends itself to potential
plant consolidation opportunities.
For individual site closures, typical savings
are 25-50% of the site’s operating costs.
For the network as a whole, savings are
typically 10-15% of the ‘Total Delivered Costs’
for the same total production volume.
We believe these changes would yield a 10-15% reduction in the Company’s total manufacturing and
distribution costs
10-15% cost reduction in
Manufacturing & Distribution
Expenses is reasonable
Source: Starboard’s proprietary report by a leading consulting firm.

125
We believe that there are numerous areas at Newell to improve LCC sourcing, which can result in significant
cost savings.
We estimate the opportunity to improve profitability through low-cost-country sourcing & production
is $45 to $64 million
Cost Opportunity for Low-Cost-Country (LCC) Sourcing
& Production
Category Lever
Savings Estimate
Low High
Finished Goods $34 $46
Resin $4 $6
Chemicals $3 $4
Packaging - - -
Metal – Steel <$1 $2
Glass - - -
Textiles $2 $3
Wax <$1 <$1
Paper <$1 <$1
Electrical Components <$1 $1
All Other <$1 $1
Total LCC Sourcing & Production $45 $64
Midpoint of estimated
savings represents less
than 1% of total Cost of
Goods Sold
Best-in-class peers continuously review their portfolio to
increase low-cost-country sourcing & manufacturing
consolidation.
Through a comprehensive review of its portfolio, Newell
can:
– First, consolidate manufacturing of similar
products in near-shore locations, like Mexico.
– Next, aggressively source more products from
China.
1
2
Source: Starboard’s proprietary report by a leading consulting firm.

126
We believe it is essential to perform a comprehensive review of product and packaging design to drive
technical cost reductions.
We believe these inefficiencies speak to the overall lack of focus towards cost saving initiatives
Newell’s Packaging Strategy Is Inconsistent and Results in
Higher Costs
We have found a number of circumstances where Newell’s production and packaging processes differ from peers,
leaving Newell at a distinct cost disadvantage:
– Newell appears to be using more expensive packaging for products than peers;
– Box labels are excessive and designs are not optimized, resulting in a cost disadvantage versus peers as well
as shipping inefficiencies;
– Plastic products weigh substantially more than the equivalent products marketed by peers, resulting in higher
costs. However, these products also fail to demand higher prices, which hurts margins;
– Newell appears to be “over-engineering” its Writing segment products, which use more complex product
designs and more components than peers, resulting in higher costs.
1
2
3
4
Source: Starboard’s proprietary report by a leading consulting firm.

127
Newell Appears to Use More Expensive Packaging Than Peers
Newell appears to use more expensive packaging material than peers. However, kitchen appliances (as shown
below) are already on display, reducing the need for the more expensive packaging to attract attention.
Converting to packaging similar to peers can save 5-7% on packaging costs without sacrificing visual appeal
Appliance In-Store Display – Coffee Makers Appliance In-Store Display – Blenders
Source: Starboard’s proprietary report by a leading consulting firm.

128
Competition uses brown corrugate box instead of mottled which is 5% - 8% cheaper.
Graco also has 4+ color labels pasted on box, increasing costs even further.
2
1
1
2
Car Seat Packaging Evaluation
For car seats, significant packaging optimization opportunities exist
Excessive Use of Color Labels Also Increases Packaging Costs…
1
Source: Starboard’s proprietary report by a leading consulting firm.

129
…Which Appears Unnecessary for Products that Are
Reviewed by Consumers Outside of the Box As depicted below, car seats are typically viewed in stores outside of their boxes.
It appears that Newell is needlessly spending on packaging details that play little role in customer
purchasing decisions
Target Car Seat Aisle Babies “R” Us Car Seat Aisle
buybuy BABY Car Seat Aisle
Source: Starboard’s proprietary report by a leading consulting firm.

130
In Addition, Box Design Inefficiencies Needlessly Increase
Material and Shipping Costs…
Current corrugate box for car seat results in a lot of empty
space, which in turn results in higher material costs and
shipping inefficiencies.
Competition
1
1
2
Corrugate design improvements can lead to improved shipping efficiencies, particularly for products being
shipped from China.
Britax optimized space usage with an
“L” shaped design that provides
better nesting and yields improved
shipping efficiencies.
Graco’s box design is less optimized than the competition which results in a cost disadvantage
2
Source: Starboard’s proprietary report by a leading consulting firm.

131
Paper Mate uses 47% more packaging when
compared to its competitor
Uni-Ball uses 10% more packaging when
compared to its competitor
Mechanical Pencil Packaging Gel Roller Pen Packaging
Competitive analysis of packaging indicates Newell uses substantially more material than its competitors
…And the Use of Excess Packaging Material Spans Multiple
Areas of Newell’s Product Portfolio…
Packaging:
3.5” x 7.75”
Total Area:
27 Sq”
Packaging:
5.0” x 8.0”
Total Area:
40 Sq”
Packaging:
3.5” x 7”
Total Area:
25 Sq”
Packaging:
3.6” x 7.5”
Total Area:
27 Sq”
Source: Starboard’s proprietary report by a leading consulting firm.

132
…Which Appears Even More Unnecessary in Markets with
More Significant and Rising E-Commerce Penetration
As e-commerce penetration increases, product packaging design becomes less of a competitive differentiator.
Despite Newell’s alleged focus on e-commerce, the Company is not designing its products appropriately
to maximize profitability in this channel
Newell Brands 2018 CAGNY Conference Presentation
As e-commerce further
penetrates Newell’s
core markets, box
design becomes less and
less a function of
marketing and more of
a commodity. In these
instances (i.e. Graco
packaging within the
“Baby” category), box
design efficiency is even
more important.
Source: Company filings.

133
2 Quart Pitcher
Rubbermaid is using substantially more plastic than its competitors to manufacture the same product.
248g 204g
Rubbermaid: 22% Heavier
346g 282g
Rubbermaid: 23% Heavier
230g 222gRubbermaid: 4% Heavier
(2 oz less of storage)
Does having more material result in increased consumer preference?
1 Gallon Pitcher Rubbermaid 23oz vs. Glad 25oz Storage
Product Weight
Product Comparisons
2 Quart Pitcher 1 Gallon Pitcher Rubbermaid 23oz vs. Glad 25oz Storage
Rubbermaid Appears to Use More Plastic in Its Design Than
Competitors, Resulting in Significantly Higher Material Costs
Source: Starboard’s proprietary report by a leading consulting firm.

134
Storage - Rubbermaid vs. GladPitchers – Rubbermaid vs. Sterilite
Customer reviews often rank peer equivalent products above Rubbermaid. Studies should be conducted to
justify the value Newell receives from the added weight to the products.
Based on customer reviews, Rubbermaid is not receiving many benefits from its heavier, more costly
materials, as its products generally appear to be ranked below peers
Competitors:
Product Rating (Company Websites)
Rating: 3.4 / 5
Rating: 4.9 / 5 Rating: 4.7 / 5
Rubbermaid Appears to Use More Plastic in Its Design Than
Competitors, Resulting in Significantly Higher Material Costs (cont’d)
Rating: 3.8 / 5
Storage - Rubbermaid vs. Glad
Product Rating (Walmart)
Rating: 3.3 / 5
Rating: 4.1 / 5 Rating: 4.8 / 5
Rating: 3.9 / 5
Pitchers – Rubbermaid vs. Sterilite
Source: www.rubbermaid.com, www.sterilite.com, www.glad.com, and www.walmart.com.

135
Product Complexity Results in Significantly Higher Costs
We have found numerous examples of
Newell’s products that seem to have
unnecessary levels of product complexity.
An evaluation of the Elmer’s products indicates
various base colors and glue tips. What is the
purpose or benefit of this?
While we understand some aspects of complexity
can create value (e.g. product assortment,
flexibility, responsiveness to customer demands,
etc.), complexity can also drive up costs due to
higher inventory levels, multiple lower-volume
components, etc.
Despite being similar products, Newell uses a number of different cap designs, which seems unnecessary and
drives up costs.
Elmer’s Glue Product Evaluation
By focusing on more uniform parts, Newell can decrease product complexity and reduce sourcing and
manufacturing costs
Observations
Source: Starboard’s proprietary report by a leading consulting firm.

136
1
2
34
5
6
7
8
9
10
1
2
3
4
5
6
Despite being similar options for consumers, Paper Mate uses almost twice as many parts as BIC due to
unnecessary over-engineering.
Paper Mate – Mechanical Pencil Teardown BIC – Mechanical Pencil Teardown
Does the added complexity result in higher consumer preference?
Competitive Teardowns Illustrate Newell’s Product Complexity Issues
Source: Starboard’s proprietary report by a leading consulting firm.

137
While Newell’s More Complex Design Adds Costs, It Does Not Appear
to Add a Price Premium and Receives Worse Customer Reviews
What benefit is Paper Mate receiving from adding extra complexity to its mechanical pencils?
Mechanical Pencil Comparison
Paper Mate BIC
Am
azo
n.c
om
PAPER MATE WRITE BROS MECHANICAL PENCILS (24 COUNT) BIC XTRA-PRECISION MECHANICAL PENCILS (24 COUNT)
Price: $5.99 Price: $6.02
Wa
lma
rt.c
om
10 COUNT 10 COUNT
Price: $2.64Price: $2.58
The mechanical
pencils are priced very
similarly on various
different retail sites
Yet, BIC’s mechanical
pencil has actually
received better
reviews
Source: Starboard’s proprietary report by a leading consulting firm.

138
We estimate the opportunity to improve profitability through optimizing manufacturing processes and
eliminating inefficiencies is $62 to $93 million
Category Lever
Savings Estimate
Low High
Finished Goods $28 $39
Resin $10 $15
Chemicals $6 $8
Packaging $8 $14
Metal – Steel $3 $6
Glass <$1 $2
Textiles $3 $4
Wax <$1 $1
Paper $1 $2
Electrical Components $1 $2
All Other $1 $2
Total Manufacturing Process &
Inefficiency Elimination Opportunity$62 $93
Midpoint of estimated
savings represents less
than 1% of total Cost
of Goods Sold
Cost Opportunity for Optimizing Manufacturing Processes
& Eliminating InefficienciesWe believe that there are numerous areas at Newell to optimize manufacturing processes and eliminate
inefficiencies, which can result in significant cost savings.
Newell’s products in several segments are “over-
spec’d” vs. the competition. These over-engineered
products and packaging are not necessarily valued by
customers, which is evident from customer reviews of
the product, but does result in higher material and
shipping costs.
Implementing best-in-class practices includes:
– Rigorous programs that bring together
competitor product teardowns
– Market research to understand customer
perception and demand
1
2
Source: Starboard’s proprietary report by a leading consulting firm.

139
Leveraging its scale, Newell can generate significant savings in categories like packaging & chemicals
Cost Opportunity for Improvements in Material Sourcing
PracticesWe believe that there are numerous areas at Newell to improve material sourcing practices which can result in
significant cost savings.
Purchasing appears to be decentralized across a
number of different categories.
While resin is consolidated, other categories
like packaging and chemicals are not and
present consolidation opportunities.
Leveraging scale will result in reduced pricing
and better terms for Newell overall. This will
result in more centralized procurement
resources and less business unit specific
resources.
Category Spend
Business Units
Procuring
Consolidation
Opportunity
Resin
Metal – Steel
Metal – Aluminum
Metal – Other
Precious Metals
Glass
Wax
Textiles
Chemicals
Electrical Components
Wood
Paper
Rubber
Packaging
Other Materials
Source: Starboard’s proprietary report by a leading consulting firm.

140
We estimate the opportunity to improve profitability through improvements in material sourcing
practices is $30 to $43 million
Category Lever
Savings Estimate
Low High
Finished Goods $3 $4
Resin $4 $6
Chemicals $6 $8
Packaging $9 $12
Metal – Steel $4 $8
Glass $1 $2
Textiles <$1 <$1
Wax <$1 $1
Paper $1 $2
Electrical Components - - -
All Other <$1 <$1
Total Material Sourcing
Practice Opportunity$30 $43
Midpoint of estimated
savings represents less
than 1% of total Cost
of Goods Sold
Cost Opportunity for Improvements in Material Sourcing
Practices (cont’d)While Newell has consolidated purchases across businesses for some categories like resin, purchasing for
several other categories appears decentralized and located within the business units.
The decentralized nature of Newell’s material
sourcing strategy results in an inability to
leverage best-in-class procurement processes and
the Company’s scale to negotiate reduced pricing
from suppliers.
Leveraging scale will result in reduced pricing
and better terms for Newell overall. This will
result in more centralized procurement resources
and less business unit specific resources.
Source: Starboard’s proprietary report by a leading consulting firm.

141
We estimate the opportunity to improve procurement efficiencies to be $137 to $200 million by driving
increased procurement effectiveness in key categories while taking other categories to a more efficient level of
cost management.
Implementing the Procurement Opportunity
– Comprehensive review of Newell’s portfolio to, first, consolidate manufacturing of similar products in near-
shore locations like Mexico and, next, aggressively source more products from China
– Move procurement and production of certain products to low-cost countries (Quickie example)
– Review of product & packaging design to drive cost reductions
Design improvements to reduce costs and improve shipping efficiencies, particularly for products being
shipped from China
– Design complexity reduction in packaging using best-in-class competitor product teardowns and market
research to understand customer demand
– Complexity reduction in products to help rationalize product specifications
– Leverage best-in-class procurement processes and Newell's scale to get reduced pricing from suppliers,
increase centralized purchasing, and leverage scale across businesses
1
2
3
4
5
6
We estimate the opportunity to improve procurement efficiencies to be $137 to $200 million
Low High
Low-Cost-Country Sourcing & Production $45 $64
(+) Optimize Manufacturing Process $62 $93
(+) Material Sourcing Practices $30 $43
Total Procurement Opportunity: $137M $200M
Key Initiatives
($ in millions)
Source: Starboard’s proprietary report by a leading consulting firm.

142
IV. The Opportunity to Improve Newell
C. Logistics Improvements

143
$0
$400
$800
$1,200
Logistics Total Personnel Trucking Ocean Warehousing &
3PL
Rail Other (Equip, IT,
Airfreight, etc.)
Non-Personnel Spend = ~$800M
5-6% of Revenue
Logistics spend represents a large expense category; therefore, optimization is essential
Newell Brands Estimated Logistics Spend Breakdown
($ in millions)
We Believe Newell Currently Spends Over $1 Billion on
Logistics with Numerous Opportunities for Improvement
Source: Starboard’s proprietary report by a leading consulting firm.

144
A meaningful opportunity exists to drive savings through improved freight and logistics practices
We Believe There Is an Opportunity to Improve Logistics
Operations by $49 to $73 millionWe believe there are a number of initiatives within management’s control to materially improve logistics.
Savings Estimate
Lever Initiatives Estimated Timing Low High
Warehouse Consolidation- Consolidating warehouses into nearby facilities with capacity
- Leveraging existing network to optimize distribution points9 – 18 months $17 $20
Freight Sourcing & Mode
Optimization
- RFPs for Truckload (TL) and Less-Than-Truckload (LTL)
shipments
- Shifting LTL to TL and TL to Intermodal (IM) where possible
3 – 9 months $16 $27
Transportation Management
System (TMS) Consolidation
- Implement a single TMS solution to capture network freight
synergies3 – 9 months $1 $2
Ocean Network Optimization- Potentially shift volumes to Gulf and East Coast ports to minimize
more expensive over-the-road transportation costs6 – 9 months $5 $6
Transfer Importing to Retailers- Collaborate with retailers to own a portion of the imports for
direct shipping to their distribution centers6 – 9 months $4 $5
Inventory Reduction - Operational impacts of reducing inventory: less storage fees,
improved purchasing, etc.3 – 9 months $7 $13
Total Logistics Opportunity: $49M $73M
Source: Starboard’s proprietary report by a leading consulting firm.

145
Newell’s Distribution Footprint Should be Consolidated
Scenario #4
Imports only 5 containers per week
- not enough to substantiate a DC
Scenario #1
Small Calphalon WH potentially
consolidated into Jarden’s Pataskala DC
Scenario #2
Jarden brands operating 4 separate
Facilities combining for over 2MM SF
Scenario #3
Potential to distribute Elmer’s and Quickie
through Newell DC in Atlanta
It appears Newell Brands has failed to integrate legacy Newell Rubbermaid and Jarden warehousing networks.
Distribution Footprint
After the Newell / Jarden combination, we believe there is a meaningful opportunity to consolidate DCs
Following the combination of Jarden and
Newell, numerous opportunities exist to
consolidate the distribution footprint.
We believe these opportunities have yet to be
executed upon, and therefore, can drive
meaningful additional savings.
For example, the South Florida distribution
center (DC) only imports a limited number of
containers per week, which, in our opinion,
does not validate the operation of a full
standalone DC.
Additionally, in Missouri, there are 4 separate
facilities, with over 2 million combined square
feet, that should be consolidated.
Source: Starboard’s proprietary report by a leading consulting firm.
Observations

146
There Is Also an Opportunity to Improve Utilization for
Truckload and LTL Shipments
By consolidating its DC footprint and improving freight utilization, we believe Newell can substantially lower its costs
Segment Freight Warehousing Total Footprint
Writing $3 -- $3
Outdoor Solutions $2 $3 $4
Rubbermaid $2 $3 $5
Baby & Parenting -- -- --
Branded Consumables $2 $1 $3
Consumer Solutions $2 $1 $4
Process Solutions -- -- --
Total Savings $10 $9 $19
Improving load utilization for Truckload and Less-Than-Truckload (LTL) shipments
Reducing final miles shipped via LTL and parcel
Capitalizing on freight rates from more competitive markets
Key opportunities to drive freight savings:
Footprint Consolidation and Improvement in Truckload Utilization Savings ($ in millions)
Source: Starboard’s proprietary report by a leading consulting firm.
Savings Estimate
Segment Low High
Writing $2 $4
Outdoor Solutions $4 $6
Rubbermaid $3 $5
Baby & Parenting $1 $2
Branded Consumables $3 $5
Consumer Solutions $2 $4
Process Solutions <$1 <$1
Total Savings $16 $27
Freight Sourcing & Mode Optimization Savings ($ in millions)
1
2
3

147
0.90
0.95
1.00
1.05
1.10
1.15
1.20
1.25
BU 1 BU 2 BU 3 BU 4 Nat'l Avg-Contract
National Average -Contract
Recent changes in freight costs
Contract Carrier Index – Actual Cost per Load Trend
Newell is not unified; however, the Company should be leveraging its entire network to extract more
attractive rates from transporters
Using a Decentralized Approach to Manage Freight Results
in Heightened Costs
Observations
Freight costs have dramatically increased over the last year and need to be closely watched and managed.
Recent rate trends reflect a tightening
market over the past 6 – 8 months.
We believe this is more carrier “margin
up” than true cost inflation.
There was some marginal relief in
1Q18, but carriers still maintain
pricing power over shippers.
Costs can escalate quickly when
each business unit or brand
operates independently.
Routing guide erosion can force
reliance on expensive brokers.
No true owner of carrier relationships to
keep pricing and service in-line.
BU = Business Unit
Managing different business units
separately results in higher costs than
if the Newell were to negotiate with
carriers as a whole company
Source: Starboard’s proprietary report by a leading consulting firm.

148
Challenges Benefits of Consolidation
Duplication of licensing fees and other support costs
Duplication of expertise and skill sets
Fragmentation of transportation spend
Multiple sets of KPIs
Multiple carrier portals
Loss of network efficiency
Round trip / triangle opportunities
Minimize deadhead miles
Leveraging the best technologies across entire spend
Cross train more people to reduce staff and
potentially enable shared services in one location
Reduce software fees from the other systems
Enable global visibility to carrier usage to support
cost control
Single instance of reporting for ease of management
Further, Newell Makes it Tougher on Itself by Operating
Multiple Systems Which Results in Higher Costs
By using a rigorous and strategic mindset to Truckload and LTL RFPs, as well as using a single TMS
platform, we believe Newell can improve freight costs by 3% to 5%
Newell appears to be utilizing multiple Transportation Management Systems (TMS) driving freight costs
higher; therefore, an opportunity exists for the Company to consolidate to a single TMS platform.
Without a unified and focused approach to freight management, freight costs can quickly and dramatically increase.
A single, unified TMS can generate 0.5 – 1.0% freight cost reduction through automated mode optimization and identifying round trips.
Source: Starboard’s proprietary report by a leading consulting firm.

149
Reconfiguring Newell’s Discharge Port Strategy May
Present Another Savings Opportunity
25,130
19,592
4,732 3,991
2,901
1,742 1,092 874 750 538 531
-
5,000
10,000
15,000
20,000
25,000
30,000
Having concentrated freight discharge in LA / Long Beach may increase onward distribution costs. Shipping
more volume directly to the Gulf and East Coast should be considered to potentially decrease on-carriage mileage
Discharge Ports (>500 containers/Yr)
Newell has concentrated much of its product discharge in Southern California, giving the appearance of
discharge consolidation; however, we believe that diversifying discharge ports may reduce costs because a mile
transported on land is much more expensive than on the ocean.
Source: Starboard’s proprietary report by a leading consulting firm.

150
EXISTING NETWORK
• Vast majority of imports discharged in Los Angeles &
Long Beach
• High volume lanes inland to Springfield, Kansas City,
St. Louis, and San Antonio
• Potentially high freight costs to distribution centers,
plus potentially high freight costs / customer pick-up
allowance for inventory destined for SE and NE
POTENTIAL SAVINGS
• Increased direct shipment to Houston, Savannah,
and NY / NJ
• Lower freight cost to San Antonio from Houston
for 2% of imports
• Retain inventory closer to final consumption in NE
and SE for 19% of imports
Increasing direct shipments to Gulf ports could potentially save $600/shipment to San
Antonio, and relocating inventory closer to customers could save $300-550/shipment.
Shipping more volume directly to the Gulf and East Coast ports may decrease on-carriage mileage. Newell is
currently discharging ~70% to LA / Long Beach, and we believe there may be an opportunity to shift ~20% of
this to more productive ports and potentially reduce costs.
Changing port of discharge and shifting warehousing for ~20% of imports could potentially save $6 million
Source: Starboard’s proprietary report by a leading consulting firm.
Reconfiguring Newell’s Discharge Port Strategy May
Present Another Savings Opportunity (cont’d)

151
0
150
300
450
600
750
900
TE
Us
('000s)
Retail Food & Bev Conglomerate Electronics Apparel Consumer Goods Appliances
Newell Brands imported 108,900
TEU to the US in 2016
Many CPG Companies Let Retailers Assume the
Importing Responsibility, But Newell Imports on Its OwnIn fact, Newell Brands is the only CPG company in the Top 50 U.S. importers by volume.
Top 20 US Importers by Volume
Only Spectrum Brands (15,600 TEU,
99th) ranks in top 100 importers
among comparable companies
Letting retailers assume the importing responsibility has many benefits:
Likely have scale and better
pricing than Newell
1 Reduces Newell inventory on
the water
2 Less warehouse space
required in the US
3
Why wouldn’t Newell allow its largest customers (i.e. Walmart and Target) to assume the importing responsibility if it is cost efficient and reduces the Company’s already high inventory levels?
Today’s strategy leads to unnecessary “double handling.”
Source: Starboard’s proprietary report by a leading consulting firm.

152
Newell appears to send inventory directly to its DC, even
when the retailer may be only a few miles away, resulting
in extra touch points.
Large scale retailers such as Walmart and Target commonly
own the importing process on behalf of their vendors.
Newell’s warehousing network often overlaps with retailer
distribution centers (e.g. LA Inland Empire), causing
unnecessary steps in the distribution process.
Observations
By eliminating these extra steps, the Company could
save $4 – 5 million.
Frees up warehousing capacity to allow for network
consolidations.
Reduces Newell’s inventory on the water as well as on-
hand at the warehouses.
Increases collaboration with core customers.
Newell’s facility is
within 2.5 miles of
Walmart’s!
Current Strategy: Newell to Walmart (Riverside)
Capitalizing on Newell’s Opportunity to Shift Ownership
Volume to Retailers Can Drive Substantial SavingsBest-in-class companies collaborate with their retail partners to optimize total cost of ownership; transferring importing
responsibilities to the customer streamlines the supply chain by eliminating the extra touch at Newell's warehouses.
Allowing Walmart to control
the process allows for Newell
to capitalize on network
consolidation
New Strategy: Go Direct to Walmart
Shifting ownership of import volumes to retailers eliminates the extra touch, reduces miles traveled, shortens lead
times, and could save Newell $4 to $5 million annually
Opportunity
2 touch points
1 touch point
Source: Starboard’s proprietary report by a leading consulting firm.

153
836,692
699,500
600,000
650,000
700,000
750,000
800,000
850,000
Newell Top
Quartile
Cost Driver
Potential Benefit
($ millions)
Procurement
• Improved EOQ purchasing $2 – 5
Storage Costs
• External WH storage fees $2 – 3
Manufacturing
• Reduced changeovers & setups
$2 – 5Obsolescence
• Reduced discounting, write-offs
Inter-DC Transfers
• External WH storage fees $0.4 – 1
Total Benefit $7 – 13
Improving Inventory Management Practices Can Have a
Ripple Effect Throughout the Supply Chain
Operational Benefits of Improved Inventory Practices
Notable benefits come from reducing the overall need for warehousing storage, more efficient purchasing, and
streamlining manufacturing operations, which, in total, can reduce costs by ~$7 to $13 million
Domestic Pallets on Hand
In addition to Working Capital benefits, improved inventory management practices can positively impact
EBITDA throughout several nodes of the supply chain.
137,000 pallets in storage
=
1.8 million square feet
Source: Starboard’s proprietary report by a leading consulting firm.

154
Implementing the Logistics Opportunity
– Consolidate warehouses into nearby facilities with capacity and leverage the existing network to optimize
distribution
– Implement a single, unifying Transportation Management System (TMS) to generate freight cost reduction
through automated mode optimization and identifying round trips
– Explore shifting ocean volumes to Gulf and East Coast ports to minimize more expensive over-the-road
transportation costs
– Collaborate with retailers to transfer a portion of the imports to direct shipping to their DCs to help optimize total
cost of ownership; transferring the importing responsibilities to the customer streamlines the supply chain by
eliminating the extra steps for the product to reach the customer
1
2
3
4
We estimate there is an opportunity to improve logistics operations at Newell which would increase
profitability by $49 to $73 million
Low High
Warehouse Consolidation $17 $20
(+) Freight Sourcing & Mode Optimization $16 $27
(+) TMS Consolidation $1 $2
(+) Ocean Network Optimization $5 $6
(+) Transfer Importing to Retailers $4 $5
(+) Inventory Practices $7 $13
Total Logistics Opportunity: $49M $73M
Key Initiatives
($ in millions)
Source: Starboard’s proprietary report by a leading consulting firm.

155
IV. The Opportunity to Improve Newell
D. Working Capital Improvements

156
We Believe There Is an Opportunity to Improve Working
Capital by $800 million to $1.1 billionThere are several key initiatives which we believe need to be enacted to improve Working Capital.
We believe that there is a substantial opportunity to improve Working Capital
Savings Estimate
Lever Initiatives Estimated Timing Low High
Days Sales Outstanding
(DSOs)
- Evaluate and negotiate existing terms with customers;
Enforce utilization of agreed upon terms9 – 12 months $600 $650
Days Payable Outstanding
(DPOs)
- Evaluate and negotiate existing terms with customers;
Minimize early payment; take all applicable discounts9 – 12 months $200 $450
Total 1x Cash Opportunity: $800M $1,100M
Source: Starboard’s proprietary report by a leading consulting firm.

157
$57 $91 $131$351 $363
$556
$1,938
Church &
Dwight
The Clorox
Company
Prestige
Brands
Fortune
Brands
Spectrum
Brands
Stanley Black
& Decker
Newell
Brands
Newell Maintains Significantly Higher Net Working
Capital Compared to Its Peers
There appears to be a significant opportunity to improve Newell’s Working Capital management practices
FY 2017 Net Working Capital
Opportunity
($ in millions)
Improve purchasing by negotiating standard payment terms, e-payables / corporate card program, etc.
Rationalize SKUs by decreasing scope of SKUs to reduce operations complexity, improve demand planning,
inventory management, etc.
Improve collections by focusing on finance integration and AR systems implementation.
1
2
3
Source: Starboard’s proprietary report by a leading consulting firm.
Note: Peers with over 50% of revenue coming from non-US market have been excluded in Working Capital slides.

158
7.7%8.8%
11.0%
13.1%
15.5% 15.8%16.9%
The Clorox
Company
Church &
Dwight Co.
Fortune
Brands
Prestige
Brands
Spectrum
Brands
Stanley Black
& Decker
Newell
Brands
Newell’s Inventory Levels Are ~42% Higher Than
Industry Averages
Inventory as % of Revenue
Newell maintains significantly higher inventory levels compared to peers
Newell’s inventory levels – expressed as a percentage of revenue – are significantly higher than peers.
Peer Average: 12.0%
Source: Starboard’s proprietary report by a leading consulting firm.
Note: Peers with over 50% of revenue coming from non-US market have been excluded in Working Capital slides.

159
Newell Has An Opportunity to Meaningfully Improve Its
Cash Conversion Cycle Over Time
Days Sales Outstanding (# of Days)
Days Inventory Outstanding (# of Days)
Days Payable Outstanding (# of Days)
Source: Starboard’s proprietary report by a leading consulting firm.
Note: Peers with over 50% of revenue coming from non-US market have been excluded in Working Capital slides.

160
2630
34
5460
77
87
2230
4250
58
95 98
Church
& Dwight
The Clorox
Company
Stanley Black
& Decker
Spectrum
Brands
Fortune
Brands
Newell
Brands
Prestige
Brands
FY 2016 FY 2017
Cash Conversion Cycle has
increased ~18 days in one year
In Fact, Newell Has Allowed Its Cash Conversion Cycle to
Increase ~23% Year-over-Year in FY 2017
Cash Conversion Cycle (# of Days)
(3.3) 0.2 8.2 (3.7) (1.9) 18.2 11.1Day
Change:
Newell has a significantly higher cash conversion cycle compared to peers
Newell experienced a significant increase in its cash conversion cycle in FY 2017.
BEST-IN-
CLASS
WORST-
IN-CLASS
Source: Starboard’s proprietary report by a leading consulting firm.
Note: Peers with over 50% of revenue coming from non-US market have been excluded in Working Capital slides.

161
Days Sales Outstanding (DSO)
Days Inventory Outstanding (DIO)
Lower is more
efficient
Peer Median: 38
Lower is more
efficient
Peer Median: 71
Days Payable Outstanding (DPO)
Higher is more
efficient
Peer Median: 58
Several Components of Newell’s Cash Conversion Cycle
Are Well Below Best-in-Class Peers
BEST WORST
BEST WORST
BEST WORST
Source: Starboard’s proprietary report by a leading consulting firm.
Note: Peers with over 50% of revenue coming from non-US market have been excluded in Working Capital slides.

162
95
46
33
Newell Brands Peer Median Best in Class
In Total, a Significant Cash Benefit Exists by Improving
Working Capital
DSOs are nearly twice the median of the peer group
By improving collections through finance integration and AR
systems implementation, we estimate $1.2 – $1.3 billion in
Working Capital improvements.
DIOs are ~24% higher than the industry average
By focusing on reducing operations’ complexity, improving
demand planning, and inventory management, driving lower
DIOs could lead to $400 – $900 million in Working Capital
improvements.
Newell
Brands
Peer
Median
Best in
Class
Potential
Savings
DSO 67 days 38 days 35 days $1.2 – 1.3B
DPO 60 days 58 days 72 days $0B
DIO 88 days 71 days 55 days $0.4 – $0.9B
Est. One-Time Cash Benefit $1.6 – 2.2B
Cash Conversion Cycle Summary
Est. One-time Cash
Benefit$1.6 billion $2.2 billion
Reduction in Days 49 days 62 days
Newell Working Capital Metrics vs. Peer Group
Newell’s Working Capital ratios, specifically DSO and DIO, are significantly higher than the industry average and
best-in-class peers due to the significant – but unnecessary – complexity of its business, as previously discussed.
We believe there is the potential to improve Working Capital by $800 million to $1.1 billion
Due to the complexity of Newell’s supply chain, we believe that
approximately half of the available Working Capital savings, or
$800 million to $1.1 billion, are achievable by the Company.
Source: Starboard’s proprietary report by a leading consulting firm.
Note: Peers with over 50% of revenue coming from non-US market have been excluded in Working Capital slides.
- -

163
IV. The Opportunity to Improve Newell
E. Empowering the Workforce to Improve Revenue Growth

164
Core Revenue Growth Is Declining and Management
Consistently Blames the Macro Environment
Source: Company filings.
Core Revenue Growth
Core revenue growth has massively decelerated and turned negative in 4Q’17
Core revenue growth has significantly declined over the last 8 quarters!
Management Commentary
“That said, like most others in our industry, we continue to face
pressure from retailer inventory reductions and retailer
consolidation in the U.S.” – CEO Michael Polk
Q2 2017 Earnings Call (August 4, 2017)
“The landscape issue is really retail environment related and also
market growth related.” – CEO Michael Polk
Barclays Conference (September 7, 2017)
“We had unrelenting retailer inventory destocking, creating a
headwind for revenue as our retail partners adjust to slowing market
growth and changes in shopping patterns.” – CEO Michael Polk
Q3 2017 Earnings Call (November 2, 2017)
“…exposure to the stressed segment of the U.S. retail landscape.
And that will continue to be bit of an overhang…” – CEO Michael Polk
Q4 2017 Earnings Call (February 16, 2018)
“The external environment is tougher than what we anticipated when we
did the deal and even at the beginning of this year…” – CEO Michael Polk
CAGNY Conference (February 22, 2018)Significant deceleration in revenue
growth over the past 8 quarters!

165
6%
5%
3%
3% 3% 3%
0%
(2%)
5%
4% 4%5%
7% 7%
8%
5%
4%
1%
2%
3%3%
5%5% 5%
2%
1%
0%
2%2%
8%
6%
2%
5%
5%
4% 4%
5%
-3%
-1%
1%
3%
5%
7%
9%
Q1'16 Q2'16 Q3'16 Q4'16 Q1'17 Q2'17 Q3'17 Q4'17
NWL SWK CHD CL FBHS
But Peers Are Growing Consistently, Indicating that
Newell’s Decelerating Growth Is Not an Industry Issue
Peers have been able to weather the difficult environment without reporting a quarter of negative
organic revenue growth; unfortunately, Newell cannot say the same
Organic Revenue Growth
While the macro environment may be more difficult, Newell Brands’ peers are demonstrating substantially
better organic revenue growth than Newell.
Source: Company filings, peer filings, and Starboard estimates.

166
We Believe in Empowering the Workforce and Reducing
Bureaucracy…
We believe that empowering managers with a sense of ownership of their brands is essential for future success
We believe that many of the issues affecting revenue growth have been primarily self-inflicted due to issues such
as poor communication, unending bureaucracy, and avoidable customer disputes, among others.
Communication between corporate and the business units has been poor.
– We believe that many brand-level decisions (e.g., pricing decisions, product development, etc.) must be run through
corporate, but the corporate officers are frequently out of touch with the real-time dynamics (e.g., customer
relationships, competitive dynamics, etc.) of the businesses, resulting in uninformed decision-making.
– As we have outlined in this presentation, there are numerous examples of miscommunication leading to poor
execution and negative financial impacts on the business units.
Newell’s bureaucratic corporate structure disenfranchises business unit leaders rather than empowering them.
– We believe Newell has lost the culture of entrepreneurial decision-making by creating corporate bottlenecks causing
the businesses to miss opportunities in the marketplace.
– Business unit leaders frequently do not understand the employee reporting structure, resulting in confusion and
inefficiency.
– Furthermore, business units are frequently allocated costs from projects that they neither have input in nor decision
making authority over. However, the business leaders are then held accountable for the future success of these
projects.
Source: Industry research and interviews.
We believe Newell should empower and motivate brand managers and employees by instilling a sense of ownership in
their businesses and having fewer edicts coming down from senior management (e.g., major decisions regarding
product roadmaps, pricing decisions, etc.).

167
…And Not Needlessly Fighting with Large Customers
We believe that issues with specific customers have hampered revenue growth, and further, these issues
were avoidable
Issues with large customers have affected revenue growth.
Source: Wall Street Journal and Bloomberg.
Why would Newell
knowingly and willingly
fight with one of its
largest customers??
Why would Newell defiantly stop shipping
product and risk damaging a major
customer relationship rather than trying to
come to a mutually beneficial resolution?

168
An Effective Multi-Channel Strategy and Knowing the
Customer Are Paramount
A comprehensive multi-channel strategy and deep customer relationships are essential in the current
retail environment
We believe that an effective multi-channel strategy and strong relationships with key customers are essential in
today’s retail environment.
Multi-Channel Retail
Easy access to brands and products across multiple channels is the customer’s new norm.
With integrated technology (e.g., mobile, social, cloud) and the availability of constructive data, brands are able to
have a laser focus into a customer’s journey, within and across channels.
This supports always having the right mix of product along with optimized pricing and personalized engagement for
all points of distribution.
Direct-to-Consumer (DTC)
DTC is a critical component of a multi-channel strategy.
A distinctive, compelling, and seamless online retail experience allows brands to have influence over the customer’s
impression while cultivating relationships that transcend retail channels.
Consumers are demanding more authentic and engaging interactions.
Brand sites provide the opportunity for relevant content and personalized experiences and communications.
Smart multi-channel brands understand how to leverage DTC channels to test products and campaigns and gather
customer insights that benefit the overall brands and their retail partners.
Source: Industry research and interviews.

169
The E-commerce Strategy and the Brands Need to Work
Hand-in-Hand
We believe that Newell’s product development group has excessive, unilateral authority for channel
strategy; however, cooperation between teams is key to success
There needs to be a clear strategy and accountability for each brand and business.
Brand leaders must have the authority to drive:
Brand identity and positioning
Product architecture
Design and innovation
Assortment and pricing
Marketing / Social
Customer insights
Launches, promotions, and events
Visual display and merchandising
Demand planning and inventory management
Brand leaders are fully responsible for sales, market
share, margin, inventory management, and operating
expenses, and incentivized on DTC performance.
Brand Leaders Direct Team
Direct team responsibilities include:
E-commerce and mobile store performance
Site merchandising and optimization
Product and calendar coordination
Technical operations and web development
Site reporting and analytics
Customer experience
Omni-channel services
Direct teams are held accountable to the e-commerce
P&L as well as speed and agility for driving a digital
culture.
Source: Industry research and interviews.

170
V. Conclusion

171
$546
$776
$169
$61
$0
$200
$400
$600
$800
SG&A Procurement Logistics Total
EBITDA Impact
Midpoint of Potential EBITDA Improvement
from Enhanced Operational Execution
We believe that there is a substantial cost improvement and Working Capital opportunity at Newell
Source: Starboard’s proprietary report by a leading consulting firm.
We Have Identified Specific Opportunities to Increase
Annual EBITDA by $585 – $966 Million
Working Capital Opportunity
($ in millions)
We believe there is also the
potential to improve
Working Capital by $800
million to $1.1 billion,
which would significantly
increase cash available for
capital deployment
We have retained one of the leading operationally-
focused consulting firms to assist us with this analysis

172
We Believe That Newell Is Undervalued with Substantial
Opportunities to Create Value
We believe Newell could be worth $47.92 per share, or 81% upside from where Newell currently trades
Source: Bloomberg, Company filings, and Starboard estimates.
Note: Stock price as of April 20, 2018.
Value Creation Opportunity
$26.44
$47.92
$16.78
$2.74$1.96
$0
$5
$10
$15
$20
$25
$30
$35
$40
$45
$50
$55
Current
Stock Price
EBITDA Improvement
(10.5x Multiple)
Current EBITDA
(10.5x Multiple)
Working Capital
Improvements
Pro Forma
Stock Price
Pro forma for an operational turnaround, we believe Newell trades at an extremely attractive valuation.