Embed Size (px)
Citation preview


5,915

Vulnerability Factors1. Liver Disease
2. End-Stage Renal Disease
3. HIV+/AIDS
4. Age over 60 years
5. History of Cold Weather Injury
6. 3 or more ER visits in the previous 3 months
7. 3 or more ER/Inpatient episodes in the past year
8. Tri-morbidity
1.Local team and political will
2.Clarify the demand
3.Line up housing supply
4.Getting people off the streets
5.Keeping people housed
6.Health Integration
Key areas of change:

Housing First Model
ApproachNo requirements -sobriety, treatment engagement, or medication managementPermanent, affordable housing linked to services to help maintain housingOpportunity to live more independent, healthy and fulfilling livesStrengthens communities and helps integrate people with disabilities and other special needs into the life of their neighborhoods
ResearchPermanent housing sticks“Hardest to serve” are similar to “more desirable” individualsSingle most effective, and most cost-efficient, way to reduce homelessness

* indicates higher than national average
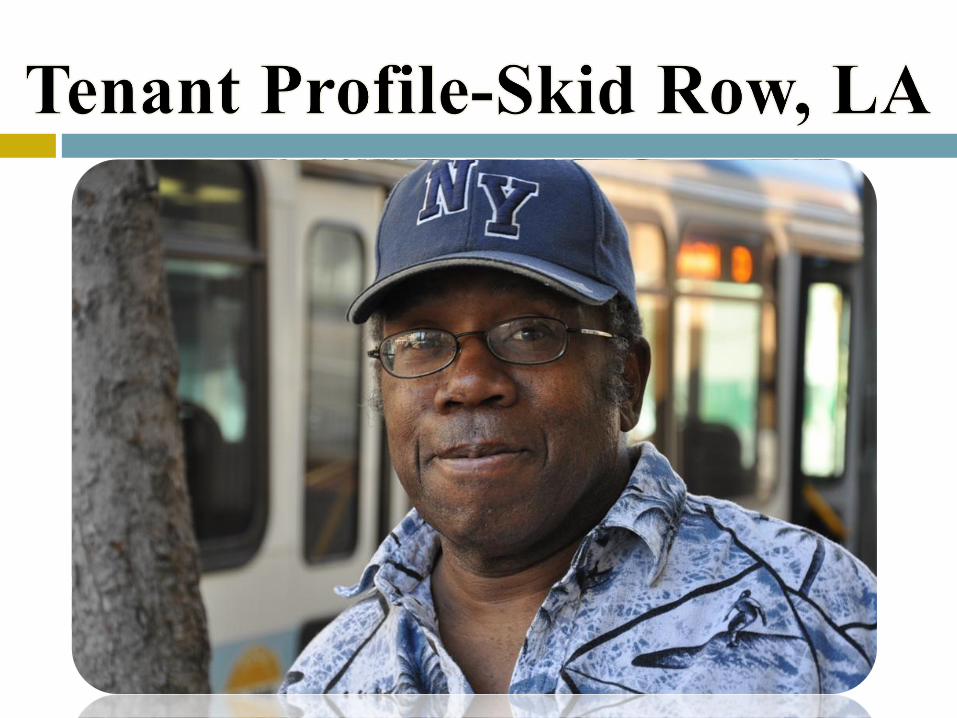
Risk indicator US Average Australia Average Sydney
Sample Size Total 12,820 417 262
Number of Vulnerable
5,668 234 139
% vulnerable 44% 56% 53%
3x ER or Hospital last year
44% 42% 35%
3x ER last 3 months 25% 24% 12%
> 60 years old 22% 11% 14%
HIV+/AIDS 6% 4% 5%
Liver Disease 17% 34% 23%
Kidney Disease 9% 12% 8%
Cold/Wet Weather Injury
14% 11% 21%
Tri-morbid 50% 62% 55%

Disability US Average Australia Average Sydney
Heart Disease 14% 23% 13%
Asthma 17% 32% 18%
Diabetes 10% 9% 5%
Hepatitis C 10% 34% 25%
Emphysema 5% 13% 12%
Cancer 4% 9% 8%
Any Serious Medical Condition
49% 85% 63%
Mental Health 47% 73% 54%
Substance Abuse 61% 90% 82%
Dually Diagnosed 35% 67% 48%

Average Age: 40 (non-vulnerable)/46 (vulnerable)Average Length of Time Homeless: 5 (non-vulnerable 11 (vulnerable)
89
10 Gender

0
10
20
30
40
50
60
70
80
Income Support

Special Populations and Frequent Users
Sub-Populations Number Percent
Veterans 20 7%
Youth under 25 15 5%
Seniors over 55 54 20%
Seniors over 65 12 4%
Foster Care 64 23%
Police Cells 219 79%
Prison 155 56%
Frequent Hospital Users 62 22%
Victims of Attack 122 44%

Frequent Hospital Users
Average inpatient hospitalization cost in NSW-$4,295
Emergency department cost per occasion of service in NSW-$197
Average spending per frequent user-$11,233
Total spending for frequent user-$640,306

$22,995$39,420
$88,695
$209,875
$511,000
$0
$100,000
$200,000
$300,000
$400,000
$500,000
$600,000
Common Ground Supportive Housing
Crisis accomm Prison mental health bed Hospital bed
The Cost of Serving Homelessness vs Housing