Embed Size (px)
Citation preview

1
Development of a Real-Time Boundary Layer Analysis
Jeff McQueen, Caterina Tassone, MarinaTsidulko, Yanqui Zhu, Lidia Cucurull, Shun Liu, Geoff Manikin and Geoff DiMego
NOAA/NWS/NCEP/EMC
May 14, 2023
2
Collaborators• ACARS estimates:
– Marina Tsidulko and Caterina Tassone, NCEP/EMC
• MPLNET:– Judd Welton, Larry Belcher, NASA/GSFC
• COSMIC:– UCAR , Sharome Goode
• NexRad Radars: – Laurie Bianco/Pam Heinselmenn (OAR/NSSL)
• NCAS lidars & CALIPSO : – Everette Joseph, Michael Hicks, Belay (Howard U. - DC)– Ray Hoff, Ruben Delgado, Wallace McMillan (U. Maryland-Baltimore Campus)
• Dispersion model impacts: – Roland Draxler, W. Pendergrass, C. Vogel (NOAA/ARL)– Kyle Dedrick (DTRA)– Matt Simpson (DHS/IMAAC)
3
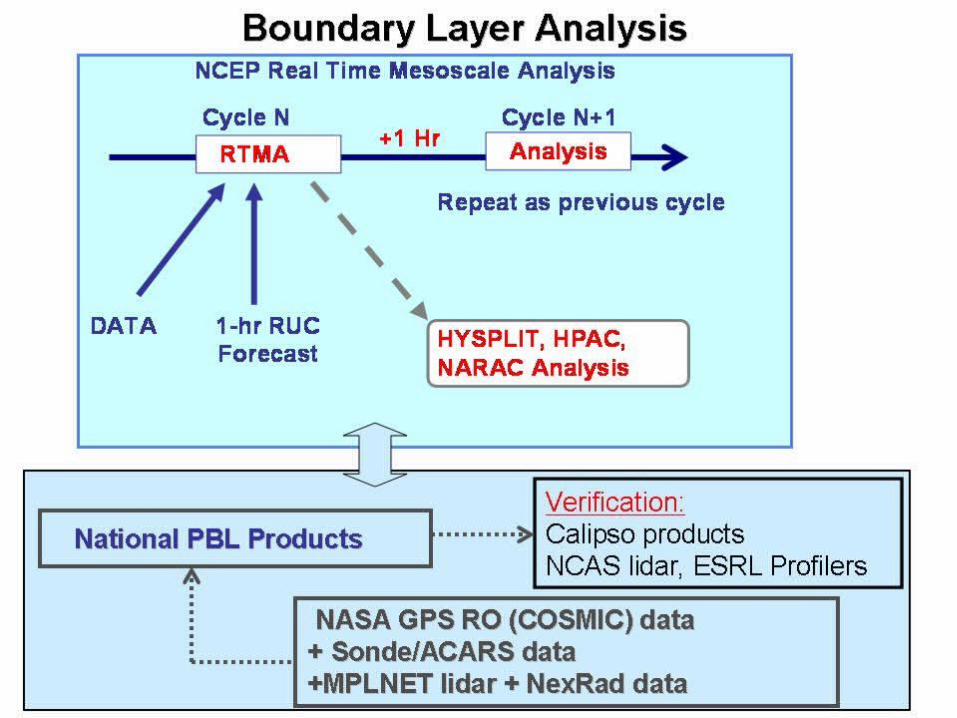
•NOAA-NASA-NCAS High Resolution
Boundary Layer Analysis Project •
NOAA-NASA-NCAS High Resolution Boundary Layer Analysis Project

4
Program Tasks
• Derivation of PBL heights from: – RAOB and ACARS Aircraft profiles – MPLNET LIDAR measurements– ESRL/CAP Profilers– COSMIC Radio Occultation Measurements– NWS NEXRAD radars ( w/ NOAA/NSSL)– CALIPSO backscatter profiles for evaluation (UMBC)– NCAS LIDAR measurements for evaluation
• Evaluation of RUC model 1st guess fields used for RTMA– Modified bulk Richardson number based PBL
• Assimilation of PBL heights into RTMA• Evaluation of plume dispersion models with RTMA
analyses• Evaluation of low-level RTMA winds and stability products
5
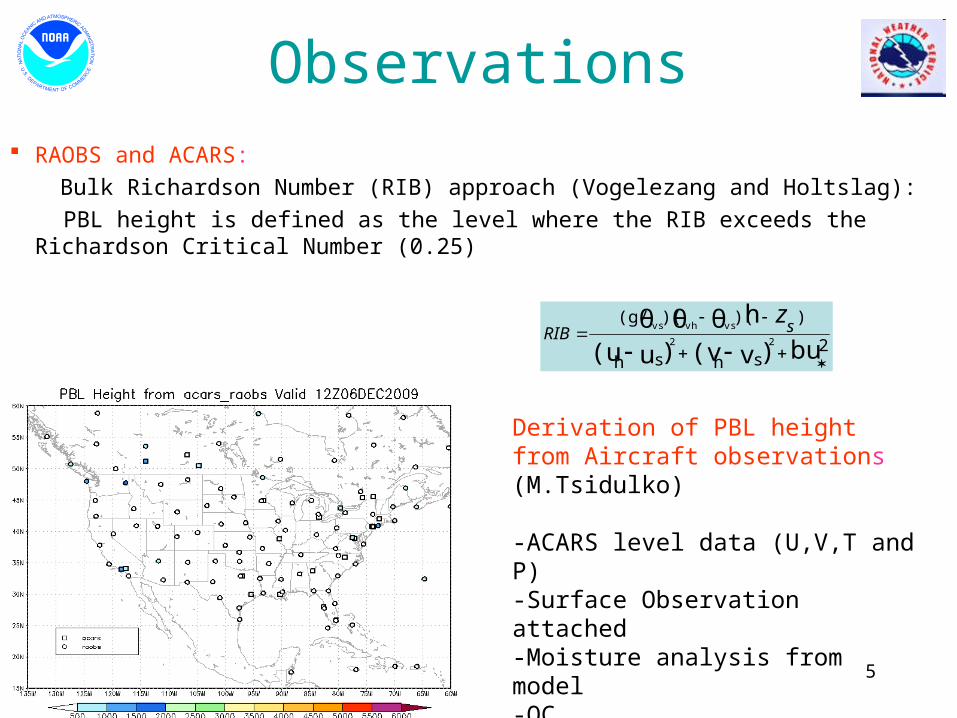
Observations RAOBS and ACARS: Bulk Richardson Number (RIB) approach (Vogelezang and Holtslag): PBL height is defined as the level where the RIB exceeds the Richardson
Critical Number (0.25)
Derivation of PBL height from Aircraft observations (M.Tsidulko)
-ACARS level data (U,V,T and P)-Surface Observation attached-Moisture analysis from model-QC
2shsh
))()((g/
bu)v(v)u(uhθθθ
22
vsvhvs
sRIBz

6
Radar comparison to raobs Shun Liu & Caterina Tassone
•Current estimates are too low•Compared to nearby airports within 30 minutes•Radar PBL Z computed by looking at maximum reflectivity
•Include VAD wind profiles also ?•Limit computations to below 4 km
7
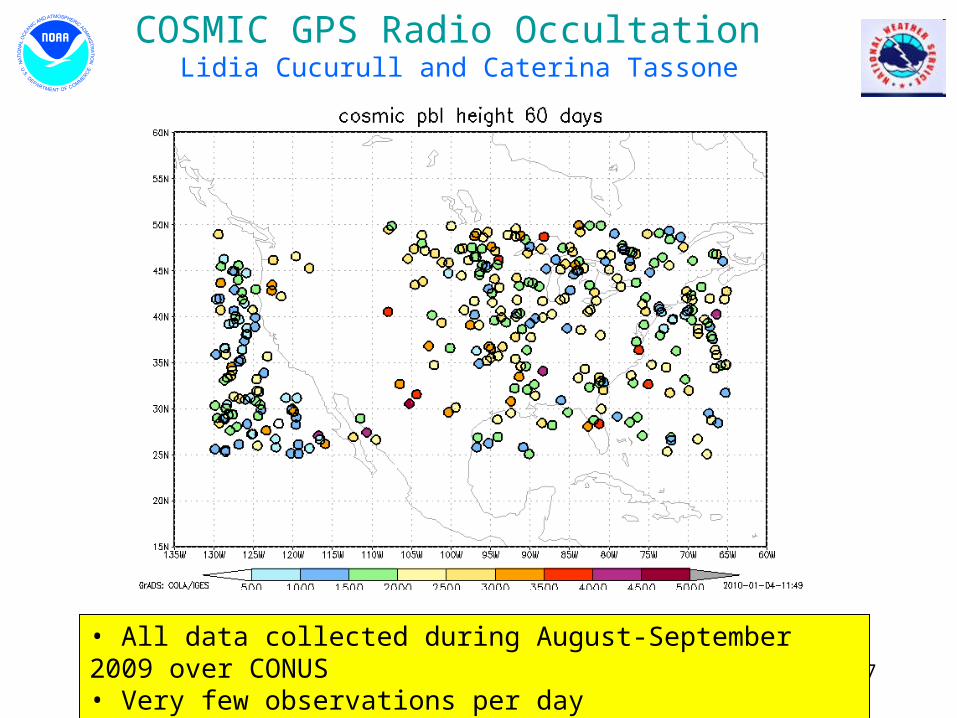
COSMIC GPS Radio Occultation Lidia Cucurull and Caterina Tassone
• All data collected during August-September 2009 over CONUS• Very few observations per day
8
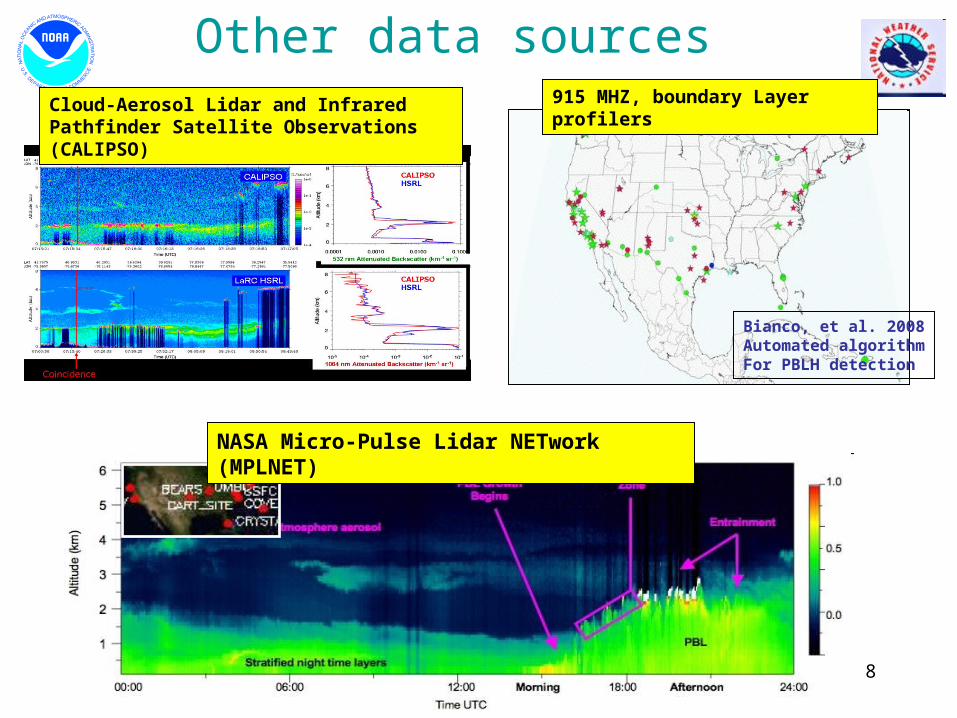
Other data sources
Bianco, et al. 2008Automated algorithmFor PBLH detection
915 MHZ, boundary Layer profilersCloud-Aerosol Lidar and Infrared Pathfinder Satellite Observations (CALIPSO)
NASA Micro-Pulse Lidar NETwork (MPLNET)

9
NCEP Real-Time Mesoscale AnalysisYanqui Zhu
• 5 km hourly analysis 10 m winds, 2m temperature and dew point, cloud cover and precip
• 2-D variational Assimilation (NCEP GSI)• RUC 13 km 1 hour forecast used as background analysis
• NCEP format PREPBUFR PBL Height files for ingest:– ACARS– RAOBS– Radar– COSMIC– MPLNET– Boundary Layer Profilers
• Background Errors: NMC Method• Determine weighting functions:
– By stability, low level temperature ???

10
Evaluation of RUC first guess PBLH
PBL depth - Using a vertical profile of virtual potential temperature from RUC native levels, find the height above surface at which theta-v (virtual potential temperature) again exceeds theta-v at surface (lowest native level - 5 m above surface). Surface theta-v is boosted by an additional 0.5 K.

11
RTMA 5 km PBL Analysis Yanqiu Zhu, NCEP/EMC
-Background field: RUC 13 km 1h forecast-Observations: ACARS and RAOBS
12
PBL Variability Experiment DC-Baltimore Area Sept 14-15 and 19-20 2009 Purpose:
Investigate the evolution and spatial variability of the urban atmospheric PBL height
Evaluate various instrument platforms for detecting PBL height Data collected:
Radiosondes: HU-Downtown, RFK stadium, Beltsville, Baltimore Raman lidar: Beltsville Elastic Lidar Facility: Baltimore Sodar: DOE Forrestal Bldng, DC Microwave radiometer: Beltsville Wind lidar: Baltimore, Navy Annex MPLNET COSMIC CALIPSO
13
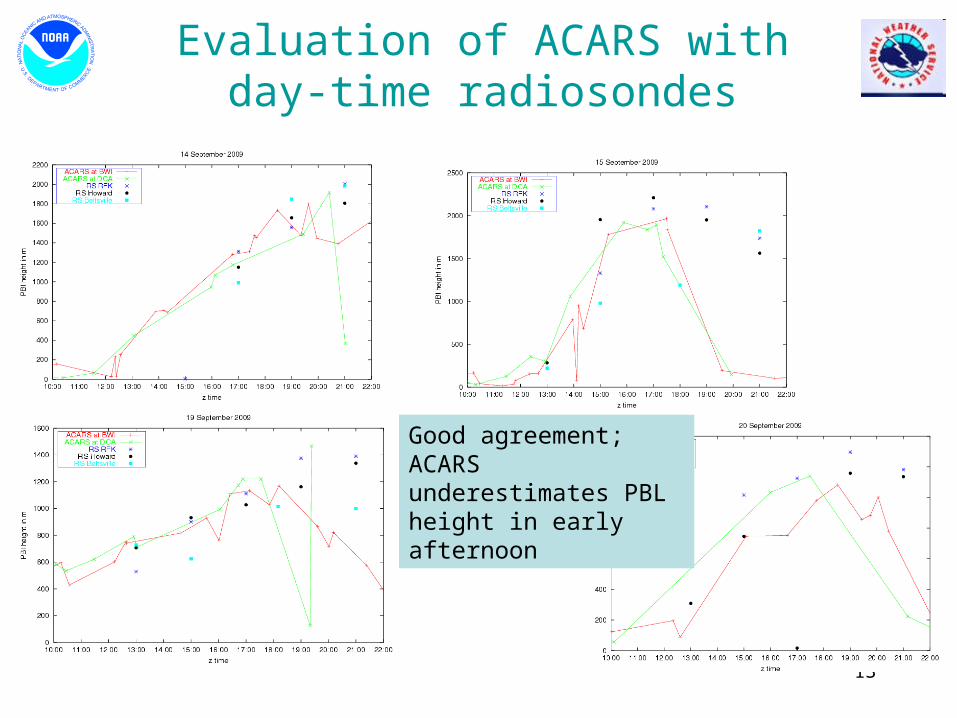
Evaluation of ACARS withday-time radiosondes
Good agreement;ACARS underestimates PBL height in early afternoon

14
Different methods for deriving PBL height from ACARS: Local Richardson Number Parcel method Modified RIB (unstable)
14 September 2009
0.5Kθvsθ'vs
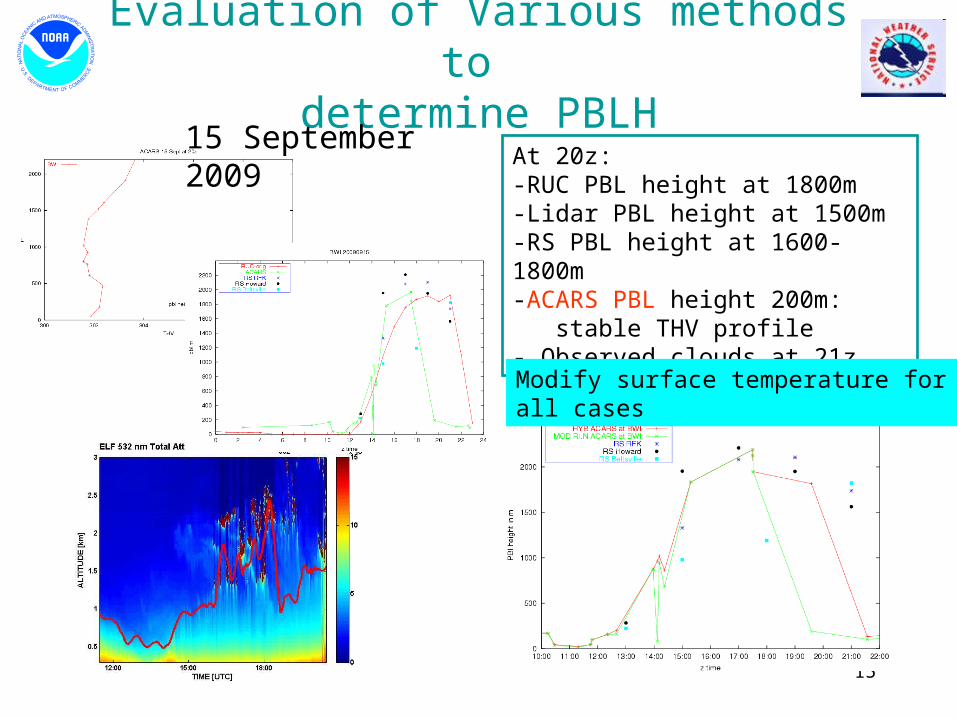
Evaluation of Various methods to determine PBLH
15
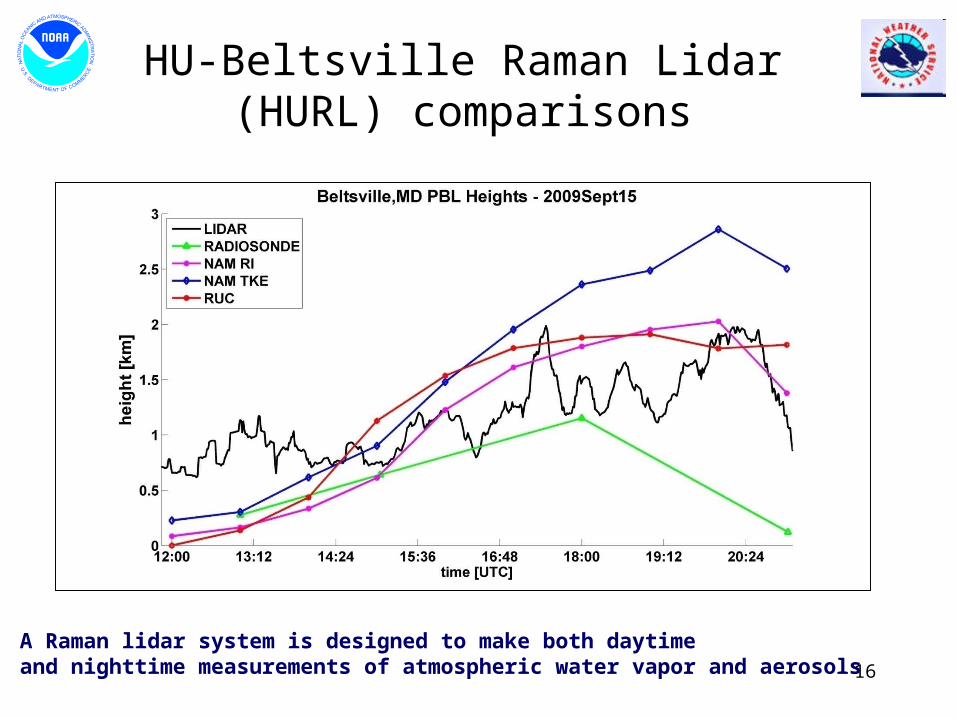
At 20z:-RUC PBL height at 1800m-Lidar PBL height at 1500m-RS PBL height at 1600-1800m-ACARS PBL height 200m: stable THV profile - Observed clouds at 21z
Modify surface temperature for all cases
Evaluation of Various methods to determine PBLH
15 September 2009
16
HU-Beltsville Raman Lidar (HURL) comparisons
A Raman lidar system is designed to make both daytime and nighttime measurements of atmospheric water vapor and aerosols

17
UMD Baltimore Campus Elastic Lidar Facility (ELF) comparisons
• ACARS Bulk RI number estimate under-estimates PBLH for clear sky case.
• Very late on estimating growth of PBL compared to sondes and lidar

18
19
Possible Additional Products
• Hourly analyses of the following 2.5 km PBL products are expected from this project: – PBL height – Ventilation index – Boundary layer transport wind – Pasquill-Gifford stability – Sigma-Theta stability profiles
20
Summary & Future Work• DC PBL experiment
– RUC background PBLH agrees well w/ daytime convective PBL measurements (radiosondes, lidar) but too low at night
– ACARS PBLH estimates improved with sfc temperature adjustments
• ACARS PBLH: – good diurnal pattern– Under-estimates PBLH in late afternoon– use closest surface observation at flight level to compute PBLH
• COSMIC, radar : quantify biases for assimilation
Additional PBLH estimates from: CAP, MPLNET, multi-level towers, ceiliometers &, sfc flux sites
Begin RTMA PBL evaluation w/ lidars, CALIPSO Evaluate Impact on dispersion model simulations

21
BACKUPS

22
ATDD Radiosondes
Howard U. Downtown RFK Stadium
09, 11,13,14,15,17 EDT
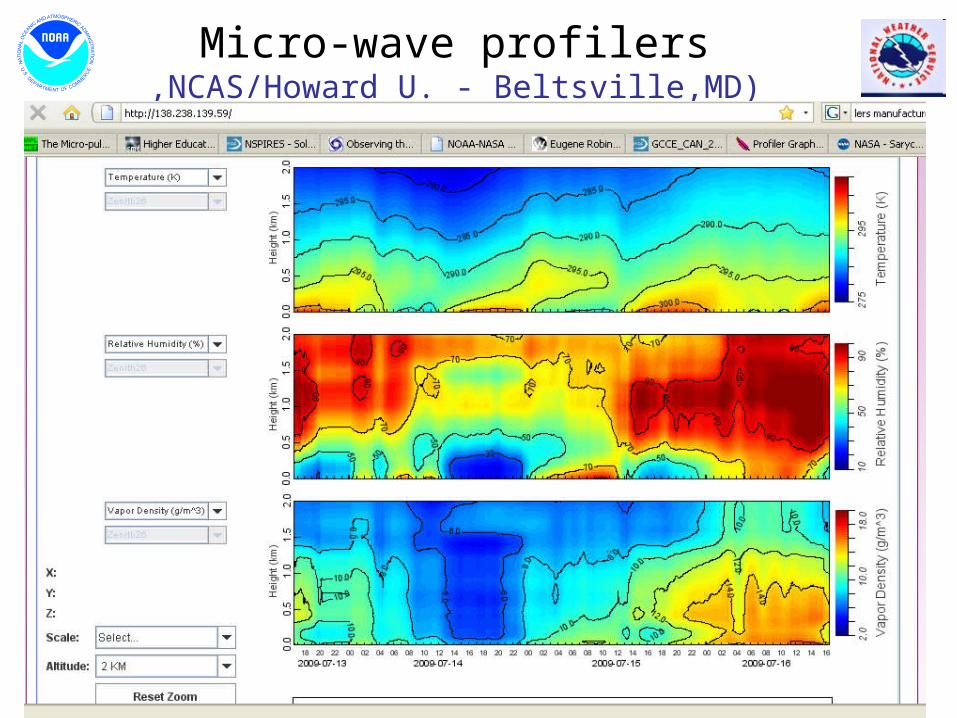
23
Micro-wave profilers,NCAS/Howard U. - Beltsville,MD)