Embed Size (px)
Citation preview
Name: Class: Date:
PowerPoint Module 6: Enhancing Charts
Copyright Cengage Learning. Powered by Cognero. Page 1
1. Excel is integrated with PowerPoint.
a. True
b. False
ANSWER: True
POINTS: 1
REFERENCES: PowerPoint 122 Work with Charts in PowerPoint
QUESTION TYPE: True / False
HAS VARIABLES: False
LEARNING OBJECTIVES: OFFI.PARS.13.161 - Explain PowerPoint charts
DATE CREATED: 3/1/2016 12:08 PM
DATE MODIFIED: 3/1/2016 12:08 PM
2. When you create an Excel chart in PowerPoint, you can perform advanced commands on Excel data in the worksheet window in PowerPoint.
a. True
b. False
ANSWER: False
POINTS: 1
REFERENCES: PowerPoint 122 Work with Charts in PowerPoint
QUESTION TYPE: True / False
HAS VARIABLES: False
LEARNING OBJECTIVES: OFFI.PARS.13.161 - Explain PowerPoint charts
DATE CREATED: 3/1/2016 12:08 PM
DATE MODIFIED: 3/1/2016 12:08 PM
3. Excel charts can be embedded or linked in PowerPoint.
a. True
b. False
ANSWER: True
POINTS: 1
REFERENCES: PowerPoint 122 Work with Charts in PowerPoint
QUESTION TYPE: True / False
HAS VARIABLES: False
LEARNING OBJECTIVES: OFFI.PARS.13.161 - Explain PowerPoint charts
DATE CREATED: 3/1/2016 12:08 PM
DATE MODIFIED: 3/1/2016 12:08 PM
4. You can add trendlines and error bars to a chart.
a. True
b. False
Illustrated Course Guide Microsoft Office 365 and PowerPoint 2016 Advanced Spiral bound Version 1st Edition Beskeen Test BankFull Download: http://testbanklive.com/download/illustrated-course-guide-microsoft-office-365-and-powerpoint-2016-advanced-spiral-bound-version-1st-edition-beskeen-test-bank/
Full download all chapters instantly please go to Solutions Manual, Test Bank site: testbanklive.com
Name: Class: Date:
PowerPoint Module 6: Enhancing Charts
Copyright Cengage Learning. Powered by Cognero. Page 2
ANSWER: True
POINTS: 1
REFERENCES: PowerPoint 122 Work with Charts in PowerPoint
QUESTION TYPE: True / False
HAS VARIABLES: False
DATE CREATED: 3/1/2016 12:08 PM
DATE MODIFIED: 5/2/2016 9:01 PM
5. A linked chart is saved as a separate file.
a. True
b. False
ANSWER: True
POINTS: 1
REFERENCES: PowerPoint 122 Work with Charts in PowerPoint
QUESTION TYPE: True / False
HAS VARIABLES: False
LEARNING OBJECTIVES: OFFI.PARS.13.161 - Explain PowerPoint charts
DATE CREATED: 3/1/2016 12:08 PM
DATE MODIFIED: 3/1/2016 12:08 PM
6. To change PowerPoint settings, click File on the Ribbon, then click Preferences.
a. True
b. False
ANSWER: False
POINTS: 1
REFERENCES: Format Chart ElementsPowerPoint 129
QUESTION TYPE: True / False
HAS VARIABLES: False
DATE CREATED: 5/2/2016 9:59 PM
DATE MODIFIED: 5/2/2016 10:01 PM
7. The Chart Styles button allows you to show or hide axes, labels, or gridlines.
a. True
b. False
ANSWER: False
POINTS: 1
REFERENCES: PowerPoint 122 Work with Charts in PowerPoint
QUESTION TYPE: True / False
HAS VARIABLES: False
Name: Class: Date:
PowerPoint Module 6: Enhancing Charts
Copyright Cengage Learning. Powered by Cognero. Page 3
LEARNING OBJECTIVES: OFFI.PARS.13.161 - Explain PowerPoint charts
DATE CREATED: 3/1/2016 12:08 PM
DATE MODIFIED: 3/1/2016 12:08 PM
8. If your presentation is closed when you update a linked object, a security dialog box opens the next time you open the presentation.
a. True
b. False
ANSWER: True
POINTS: 1
REFERENCES: PowerPoint 136 Update a Linked Excel Worksheet
QUESTION TYPE: True / False
HAS VARIABLES: False
DATE CREATED: 5/3/2016 10:00 AM
DATE MODIFIED: 5/3/2016 10:02 AM
9. The Chart Styles button provides chart styles and color themes you can apply to charts.
a. True
b. False
ANSWER: True
POINTS: 1
REFERENCES: PowerPoint 122 Work with Charts in PowerPoint
QUESTION TYPE: True / False
HAS VARIABLES: False
LEARNING OBJECTIVES: OFFI.PARS.13.161 - Explain PowerPoint charts
DATE CREATED: 3/1/2016 12:08 PM
DATE MODIFIED: 3/1/2016 12:08 PM
10. You can use a picture as a slide background for one or more slides.
a. True
b. False
ANSWER: True
POINTS: 1
REFERENCES: Animate a Chart PowerPoint 131
QUESTION TYPE: True / False
HAS VARIABLES: False
DATE CREATED: 5/2/2016 10:13 PM
DATE MODIFIED: 5/2/2016 10:15 PM
11. To change the chart colors, click the Change Colors button in the Chart Format group.
a. True
Name: Class: Date:
PowerPoint Module 6: Enhancing Charts
Copyright Cengage Learning. Powered by Cognero. Page 4
b. False
ANSWER: False
POINTS: 1
REFERENCES: Change Chart Design and StylePowerPoint 124
QUESTION TYPE: True / False
HAS VARIABLES: False
DATE CREATED: 5/2/2016 9:26 PM
DATE MODIFIED: 5/2/2016 9:28 PM
12. Minor gridlines can also be identified by a tick mark.
a. True
b. False
ANSWER: True
POINTS: 1
REFERENCES: Customize a Chart PowerPoint 126
QUESTION TYPE: True / False
HAS VARIABLES: False
LEARNING OBJECTIVES: OFFI.PARS.13.162 - Apply tick marks
DATE CREATED: 3/1/2016 12:08 PM
DATE MODIFIED: 3/1/2016 12:08 PM
13. If you animate a chart’s data markers as a series, the entire data series is animated as a group.
a. True
b. False
ANSWER: True
POINTS: 1
REFERENCES: Animate a Chart PowerPoint 130
QUESTION TYPE: True / False
HAS VARIABLES: False
LEARNING OBJECTIVES: OFFI.PARS.13.163 - Animate chart data markers
DATE CREATED: 3/1/2016 12:08 PM
DATE MODIFIED: 3/1/2016 12:08 PM
14. You can embed all or part of an Excel worksheet in a PowerPoint slide.
a. True
b. False
ANSWER: True
POINTS: 1
REFERENCES: Embed an Excel ChartPowerPoint 133

Name: Class: Date:
PowerPoint Module 6: Enhancing Charts
Copyright Cengage Learning. Powered by Cognero. Page 5
QUESTION TYPE: True / False
HAS VARIABLES: False
DATE CREATED: 5/2/2016 10:36 PM
DATE MODIFIED: 5/2/2016 10:39 PM
15. The object you create with a source program is called the destination file.
a. True
b. False
ANSWER: False
POINTS: 1
REFERENCES: Embed an Excel Chart PowerPoint 132
QUESTION TYPE: True / False
HAS VARIABLES: False
LEARNING OBJECTIVES: OFFI.PARS.13.164 - Insert an Excel chart
DATE CREATED: 3/1/2016 12:08 PM
DATE MODIFIED: 3/1/2016 12:08 PM
16. A linked object is stored in its source file.
a. True
b. False
ANSWER: True
POINTS: 1
REFERENCES: Link an Excel Worksheet PowerPoint 134
QUESTION TYPE: True / False
HAS VARIABLES: False
LEARNING OBJECTIVES: OFFI.PARS.13.165 - Link an Excel worksheet
DATE CREATED: 3/1/2016 12:08 PM
DATE MODIFIED: 3/1/2016 12:08 PM
17. When a file is linked to PowerPoint and you want to edit it in its source program, PowerPoint must be closed.
a. True
b. False
ANSWER: False
POINTS: 1
REFERENCES: PowerPoint 136 Update a Linked Excel Worksheet
QUESTION TYPE: True / False
HAS VARIABLES: False
LEARNING OBJECTIVES: OFFI.PARS.13.166 - Edit and update a linked worksheet
DATE CREATED: 3/1/2016 12:08 PM
DATE MODIFIED: 3/1/2016 12:08 PM
Name: Class: Date:
PowerPoint Module 6: Enhancing Charts
Copyright Cengage Learning. Powered by Cognero. Page 6
18. The Change Chart Type button is in the ____ group.
a. Type b. Chart
c. Style d. Change
ANSWER: a
POINTS: 1
REFERENCES: Change Chart Design and Style PowerPoint 124
QUESTION TYPE: Multiple Choice
HAS VARIABLES: False
LEARNING OBJECTIVES: OFFI.PARS.13.167 - Change the chart type
DATE CREATED: 3/1/2016 12:08 PM
DATE MODIFIED: 3/1/2016 12:08 PM
19. ____ are small lines of measurement that intersect an axis and identify the categories, values, or series in a chart.
a. Error bars b. Trendlines
c. Tick marks d. Axis lines
ANSWER: c
POINTS: 1
REFERENCES: Customize a Chart PowerPoint 126
QUESTION TYPE: Multiple Choice
HAS VARIABLES: False
LEARNING OBJECTIVES: OFFI.PARS.13.162 - Apply tick marks
DATE CREATED: 3/1/2016 12:08 PM
DATE MODIFIED: 3/1/2016 12:08 PM
20. Click the ____ button in the Chart Layouts group to choose a chart layout from the Layout Gallery.
a. Chart Style b. Chart Layout
c. Quick Access d. Quick Layout
ANSWER: d
POINTS: 1
REFERENCES: Change Chart Design and Style PowerPoint 124
QUESTION TYPE: Multiple Choice
HAS VARIABLES: False
LEARNING OBJECTIVES: OFFI.PARS.13.168 - Modify a chart layout
DATE CREATED: 3/1/2016 12:08 PM
DATE MODIFIED: 3/1/2016 12:08 PM
21. The actual value for each data series marker is called a ____.
a. data label b. trendline
c. value d. data marker
ANSWER: a
Name: Class: Date:
PowerPoint Module 6: Enhancing Charts
Copyright Cengage Learning. Powered by Cognero. Page 7
POINTS: 1
REFERENCES: Customize a Chart PowerPoint 126
QUESTION TYPE: Multiple Choice
HAS VARIABLES: False
LEARNING OBJECTIVES: OFFI.PARS.13.169 - Add data labels to data markers
DATE CREATED: 3/1/2016 12:08 PM
DATE MODIFIED: 3/1/2016 12:08 PM
22. You can embed a chart using the _____ button on the Insert tab.
a. Chart b. Graphic
c. Object d. Excel
ANSWER: c
POINTS: 1
REFERENCES: PowerPoint 122 Working with Charts in PowerPoint
QUESTION TYPE: Multiple Choice
HAS VARIABLES: False
DATE CREATED: 5/2/2016 9:08 PM
DATE MODIFIED: 5/2/2016 9:11 PM
23. A longer duration, or animation timing, slows down the the animation.
a. True
b. False
ANSWER: True
POINTS: 1
REFERENCES: Animate a Chart PowerPoint 130
QUESTION TYPE: True / False
HAS VARIABLES: False
DATE CREATED: 5/2/2016 10:19 PM
DATE MODIFIED: 5/2/2016 10:21 PM
24. Major ____ identify major units on the axis and are usually identified by a tick mark.
a. axis b. labels
c. borders d. gridlines
ANSWER: d
POINTS: 1
REFERENCES: Customize a Chart PowerPoint 126
QUESTION TYPE: Multiple Choice
HAS VARIABLES: False
LEARNING OBJECTIVES: OFFI.PARS.13.170 - Add gridlines to a chart
Name: Class: Date:
PowerPoint Module 6: Enhancing Charts
Copyright Cengage Learning. Powered by Cognero. Page 8
DATE CREATED: 3/1/2016 12:08 PM
DATE MODIFIED: 3/1/2016 12:08 PM
25. You can add tick marks in the ____pane.
a. Title b. Chart Options
c. Format Axis d. Format Chart
ANSWER: c
POINTS: 1
REFERENCES: Customize a Chart PowerPoint 126
QUESTION TYPE: Multiple Choice
HAS VARIABLES: False
LEARNING OBJECTIVES: OFFI.PARS.13.162 - Apply tick marks
DATE CREATED: 3/1/2016 12:08 PM
DATE MODIFIED: 3/1/2016 12:08 PM
26. To change the space between data series markers in the chart, ____.
a. adjust the number in the Series Overlap text box b. drag a data series marker left or right
c. change the width of the data series marker outline d. modify the data series marker formula
ANSWER: a
POINTS: 1
REFERENCES: Format Chart Elements PowerPoint 128
QUESTION TYPE: Multiple Choice
HAS VARIABLES: False
LEARNING OBJECTIVES: OFFI.PARS.13.171 - Modify data markers overlap
DATE CREATED: 3/1/2016 12:08 PM
DATE MODIFIED: 3/1/2016 12:08 PM
27. When adjusting the space between data series markers, a positive number ____.
a. moves the data markers up in the plot area b. adds space between the data markers
c. moves the data markers to the left in the plot area d. overlaps the data markers
ANSWER: d
POINTS: 1
REFERENCES: Format Chart Elements PowerPoint 128
QUESTION TYPE: Multiple Choice
HAS VARIABLES: False
LEARNING OBJECTIVES: OFFI.PARS.13.171 - Modify data markers overlap
DATE CREATED: 3/1/2016 12:08 PM
DATE MODIFIED: 3/1/2016 12:08 PM
28. Linear Up is a type of ____ that you can apply to data series markers.
Name: Class: Date:
PowerPoint Module 6: Enhancing Charts
Copyright Cengage Learning. Powered by Cognero. Page 9
a. Gradient b. Pattern
c. Trendline d. Tick Mark
ANSWER: a
POINTS: 1
REFERENCES: Format Chart Elements PowerPoint 128
QUESTION TYPE: Multiple Choice
HAS VARIABLES: False
LEARNING OBJECTIVES: OFFI.PARS.13.172 - Add gradient fill to data markers
DATE CREATED: 3/1/2016 12:08 PM
DATE MODIFIED: 3/1/2016 12:08 PM
29. You can enter a value from ____ percent to 100 percent in the Series Overlap text box.
a. -100 b. -10
c. 0 d. 50
ANSWER: a
POINTS: 1
REFERENCES: Format Chart Elements PowerPoint 128
QUESTION TYPE: Multiple Choice
HAS VARIABLES: False
LEARNING OBJECTIVES: OFFI.PARS.13.171 - Modify data markers overlap
DATE CREATED: 3/1/2016 12:08 PM
DATE MODIFIED: 3/1/2016 12:08 PM
30. You can animate data makers of the same color individually ____.
a. by category b. by chart
c. by group d. by series
ANSWER: d
POINTS: 1
REFERENCES: Animate a Chart PowerPoint 130
QUESTION TYPE: Multiple Choice
HAS VARIABLES: False
LEARNING OBJECTIVES: OFFI.PARS.13.163 - Animate chart data markers
DATE CREATED: 3/1/2016 12:08 PM
DATE MODIFIED: 3/1/2016 12:08 PM
31. Which group in PowerPoint allows you to modify the chart title and axis labels?
a. Arrange b. Shape Styles
c. Chart Styles d. Chart Designs
ANSWER: b
POINTS: 1

Name: Class: Date:
PowerPoint Module 6: Enhancing Charts
Copyright Cengage Learning. Powered by Cognero. Page 10
REFERENCES: Format Chart Elements PowerPoint 128
QUESTION TYPE: Multiple Choice
HAS VARIABLES: False
LEARNING OBJECTIVES: OFFI.PARS.13.173 - Format chart title and axis labels
DATE CREATED: 3/1/2016 12:08 PM
DATE MODIFIED: 3/1/2016 12:08 PM
32. The program used to create an embedded object is called the ____.
a. source program b. embedded program
c. destination program d. linked program
ANSWER: a
POINTS: 1
REFERENCES: Embed an Excel Chart PowerPoint 132
QUESTION TYPE: Multiple Choice
HAS VARIABLES: False
LEARNING OBJECTIVES: OFFI.PARS.13.164 - Insert an Excel chart
DATE CREATED: 3/1/2016 12:08 PM
DATE MODIFIED: 3/1/2016 12:08 PM
33. The object you create with the source program is saved to a file called the ____.
a. destination file b. linked file
c. source file d. fixed layout file
ANSWER: c
POINTS: 1
REFERENCES: Embed an Excel Chart PowerPoint 132
QUESTION TYPE: Multiple Choice
HAS VARIABLES: False
LEARNING OBJECTIVES: OFFI.PARS.13.164 - Insert an Excel chart
DATE CREATED: 3/1/2016 12:08 PM
DATE MODIFIED: 3/1/2016 12:08 PM
34. A destination file is ____.
a. the file that is saved by a source program when creating an embedded object
b. another type of source file
c. a linked object
d. the file, such as a presentation file, where an object is embedded
ANSWER: d
POINTS: 1
REFERENCES: Embed an Excel Chart PowerPoint 132
Name: Class: Date:
PowerPoint Module 6: Enhancing Charts
Copyright Cengage Learning. Powered by Cognero. Page 11
QUESTION TYPE: Multiple Choice
HAS VARIABLES: False
LEARNING OBJECTIVES: OFFI.PARS.13.164 - Insert an Excel chart
DATE CREATED: 3/1/2016 12:08 PM
DATE MODIFIED: 3/1/2016 12:08 PM
35. A link is a ____.
a. connection between a source file and a destination file
b. connection between an embedded object and a source file
c. picture that is pasted to a slide
d. chart created using Microsoft Graph
ANSWER: a
POINTS: 1
REFERENCES: Link an Excel Worksheet PowerPoint 134
QUESTION TYPE: Multiple Choice
HAS VARIABLES: False
LEARNING OBJECTIVES: OFFI.PARS.13.165 - Link an Excel worksheet
DATE CREATED: 3/1/2016 12:08 PM
DATE MODIFIED: 3/1/2016 12:08 PM
36. Which tab is used for modifying a chart?
a. Chart Tools Design b. Excel
c. Excel Tools d. Modify Chart
ANSWER: a
POINTS: 1
REFERENCES: Embed an Excel Chart PowerPoint 132
QUESTION TYPE: Multiple Choice
HAS VARIABLES: False
LEARNING OBJECTIVES: OFFI.PARS.13.175 - Modify an Excel chart
DATE CREATED: 3/1/2016 12:08 PM
DATE MODIFIED: 5/2/2016 10:30 PM
37. When you change the source file of a linked object, ____.
a. the linked object becomes invalid and is removed from the slide
b. a new linked object is created
c. the linked object reflects the changes made
d. access to the linked object is restricted
ANSWER: c
POINTS: 1
REFERENCES: Link an Excel Worksheet PowerPoint 134
Name: Class: Date:
PowerPoint Module 6: Enhancing Charts
Copyright Cengage Learning. Powered by Cognero. Page 12
QUESTION TYPE: Multiple Choice
HAS VARIABLES: False
LEARNING OBJECTIVES: OFFI.PARS.13.165 - Link an Excel worksheet
DATE CREATED: 3/1/2016 12:08 PM
DATE MODIFIED: 3/1/2016 12:08 PM
38. To format a linked Excel worksheet, right-click it and then click ____.
a. Format Object b. Format Painter
c. Format Linked Object d. Format
ANSWER: a
POINTS: 1
REFERENCES: Link an Excel Worksheet PowerPoint 134
QUESTION TYPE: Multiple Choice
HAS VARIABLES: False
LEARNING OBJECTIVES: OFFI.PARS.13.176 - Format a linked worksheet
DATE CREATED: 3/1/2016 12:08 PM
DATE MODIFIED: 3/1/2016 12:08 PM
39. The _____ function key repeats the last formatting action.
a. F2 b. F3
c. F4 d. F5
ANSWER: c
POINTS: 1
REFERENCES: Customize a ChartPowerPoint 126
QUESTION TYPE: Multiple Choice
HAS VARIABLES: False
DATE CREATED: 5/2/2016 9:41 PM
DATE MODIFIED: 5/2/2016 9:43 PM
40. To edit or change a linked object, ____.
a. click the object, then click the Link button on the Home tab
b. double-click the source program
c. open the linked object’s source file
d. open the Links dialog box
ANSWER: c
POINTS: 1
REFERENCES: PowerPoint 136 Update a Linked Excel Worksheet
QUESTION TYPE: Multiple Choice
HAS VARIABLES: False
LEARNING OBJECTIVES: OFFI.PARS.13.166 - Edit and update a linked worksheet
Name: Class: Date:
PowerPoint Module 6: Enhancing Charts
Copyright Cengage Learning. Powered by Cognero. Page 13
DATE CREATED: 3/1/2016 12:08 PM
DATE MODIFIED: 3/1/2016 12:08 PM
41. To duplicate a slide, press _____ in the Slides tab.
a. [Ctrl][D] b. [Ctrl][H]
c. [Ctrl][G] d. [Ctrl][R]
ANSWER: a
POINTS: 1
REFERENCES: Embed an Excel ChartPowerPoint 132
QUESTION TYPE: Multiple Choice
HAS VARIABLES: False
DATE CREATED: 5/2/2016 10:33 PM
DATE MODIFIED: 5/2/2016 10:36 PM
42. The following statement is not true about linked objects: ____.
a. Your PowerPoint presentation must be open to update a linked object.
b. You must have access to the linked object’s source file.
c. You must have access to the linked object’s source program.
d. You can open a linked object by double-clicking it.
ANSWER: a
POINTS: 1
REFERENCES: PowerPoint 136 Update a Linked Excel Worksheet
QUESTION TYPE: Multiple Choice
HAS VARIABLES: False
LEARNING OBJECTIVES: OFFI.PARS.13.166 - Edit and update a linked worksheet
DATE CREATED: 3/1/2016 12:08 PM
DATE MODIFIED: 3/1/2016 12:08 PM
Case-Based Critical Thinking Question
Julie is working on a financial presentation that involves a number of complex charts. She wants her charts to be clear andeasy to read. She also wants to use some of PowerPoint’s advanced charting features.
43. What would Julie add to her chart to make sure her categories are clearly identified on the category axis?
a. Trendlines b. Tick marks
c. Error bars d. Up bars
ANSWER: b
POINTS: 1
REFERENCES: Customize a Chart PowerPoint 126
QUESTION TYPE: Multiple Choice
HAS VARIABLES: False
Name: Class: Date:
PowerPoint Module 6: Enhancing Charts
Copyright Cengage Learning. Powered by Cognero. Page 14
PREFACE NAME: Case 6-1
LEARNING OBJECTIVES: OFFI.PARS.13.162 - Apply tick marks
TOPICS: Critical Thinking
DATE CREATED: 3/1/2016 12:08 PM
DATE MODIFIED: 3/1/2016 12:08 PM
44. What could Julie add to her chart that would predict future developments?
a. Trendlines b. Tick marks
c. Error bars d. Up bars
ANSWER: a
POINTS: 1
REFERENCES: PowerPoint 122 Work with Charts in PowerPoint
QUESTION TYPE: Multiple Choice
HAS VARIABLES: False
PREFACE NAME: Case 6-1
LEARNING OBJECTIVES: OFFI.PARS.13.161 - Explain PowerPoint charts
TOPICS: Critical Thinking
DATE CREATED: 3/1/2016 12:08 PM
DATE MODIFIED: 3/1/2016 12:08 PM
45. What could Julie add to her chart that would identify potential inaccuracies in data?
a. Trendlines b. Tick marks
c. Error bars d. Up bars
ANSWER: c
POINTS: 1
REFERENCES: PowerPoint 122 Work with Charts in PowerPoint
QUESTION TYPE: Multiple Choice
HAS VARIABLES: False
PREFACE NAME: Case 6-1
LEARNING OBJECTIVES: OFFI.PARS.13.161 - Explain PowerPoint charts
DATE CREATED: 3/1/2016 12:08 PM
DATE MODIFIED: 3/1/2016 12:08 PM
46. You can create custom theme colors by clicking the Colors button in the _____ group.
a. Background b. Master Layout
c. Edit Master d. Edit Themes
ANSWER: a
POINTS: 1
REFERENCES: Link an Excel WorksheetPowerPoint 134
QUESTION TYPE: Multiple Choice

Name: Class: Date:
PowerPoint Module 6: Enhancing Charts
Copyright Cengage Learning. Powered by Cognero. Page 15
HAS VARIABLES: False
DATE CREATED: 5/3/2016 9:55 AM
DATE MODIFIED: 5/3/2016 9:59 AM
47. You can animate ____ in a chart.
a. data markers b. gridlines
c. the legend d. the entire chart
ANSWER: a, d
POINTS: 1
REFERENCES: Animate a Chart PowerPoint 130
QUESTION TYPE: Multiple Response
HAS VARIABLES: False
LEARNING OBJECTIVES: OFFI.PARS.13.163 - Animate chart data markers
DATE CREATED: 3/1/2016 12:08 PM
DATE MODIFIED: 5/2/2016 10:08 PM
48. Data marker animation options for a chart include ____.
a. compound animation by series and category
b. individual data markers by series
c. all data markers
d. individual data markers by category
ANSWER: b, d
POINTS: 1
REFERENCES: Animate a Chart PowerPoint 130
QUESTION TYPE: Multiple Response
HAS VARIABLES: False
LEARNING OBJECTIVES: OFFI.PARS.13.163 - Animate chart data markers
DATE CREATED: 3/1/2016 12:08 PM
DATE MODIFIED: 3/1/2016 12:08 PM
49. A(n) ___________________ is a graphical representation of an upward or downward trend in a data series, also used to predict future trends.
ANSWER: trendline
POINTS: 1
REFERENCES: PowerPoint 122 Work with Charts in PowerPoint
QUESTION TYPE: Completion
HAS VARIABLES: False
LEARNING OBJECTIVES: OFFI.PARS.13.161 - Explain PowerPoint charts
DATE CREATED: 3/1/2016 12:08 PM
DATE MODIFIED: 3/1/2016 12:08 PM

Name: Class: Date:
PowerPoint Module 6: Enhancing Charts
Copyright Cengage Learning. Powered by Cognero. Page 16
50. ___________________ identify potential error amounts relative to each data marker in a data series.
ANSWER: Error bars
POINTS: 1
REFERENCES: PowerPoint 122 Work with Charts in PowerPoint
QUESTION TYPE: Completion
HAS VARIABLES: False
LEARNING OBJECTIVES: OFFI.PARS.13.161 - Explain PowerPoint charts
DATE CREATED: 3/1/2016 12:08 PM
DATE MODIFIED: 3/1/2016 12:08 PM
51. You can change the color and effects of chart elements by applying one of the ____________ in the Chart Styles gallery.
ANSWER: styles
POINTS: 1
REFERENCES: Change Chart Design and Style PowerPoint 124
QUESTION TYPE: Completion
HAS VARIABLES: False
LEARNING OBJECTIVES: OFFI.PARS.13.168 - Modify a chart layout
DATE CREATED: 3/1/2016 12:08 PM
DATE MODIFIED: 3/1/2016 12:08 PM
52. Major___________________ identify major units on the axis and are usually identified by tick marks.
ANSWER: gridlines
POINTS: 1
REFERENCES: Customize a Chart PowerPoint 126
QUESTION TYPE: Completion
HAS VARIABLES: False
LEARNING OBJECTIVES: OFFI.PARS.13.170 - Add gridlines to a chart
DATE CREATED: 3/1/2016 12:08 PM
DATE MODIFIED: 3/1/2016 12:08 PM
53. ___________________gridlines identify minor units on the axis and are usually identified by tick marks.
ANSWER: Minor
POINTS: 1
REFERENCES: Customize a Chart PowerPoint 126
QUESTION TYPE: Completion
HAS VARIABLES: False
LEARNING OBJECTIVES: OFFI.PARS.13.170 - Add gridlines to a chart
DATE CREATED: 3/1/2016 12:08 PM
DATE MODIFIED: 3/1/2016 12:08 PM
Name: Class: Date:
PowerPoint Module 6: Enhancing Charts
Copyright Cengage Learning. Powered by Cognero. Page 17
54. Animating data markers individually by ____________________ displays the data markers of each category in the chart.
ANSWER: category
POINTS: 1
REFERENCES: Animate a Chart PowerPoint 130
QUESTION TYPE: Completion
HAS VARIABLES: False
LEARNING OBJECTIVES: OFFI.PARS.13.163 - Animate chart data markers
DATE CREATED: 3/1/2016 12:08 PM
DATE MODIFIED: 3/1/2016 12:08 PM
55. The ____________________ task pane helps you find information on a selected word or phrase.
ANSWER: Insightsinsights
POINTS: 1
REFERENCES: Customize a ChartPowerPoint 127
QUESTION TYPE: Completion
HAS VARIABLES: False
DATE CREATED: 5/2/2016 9:44 PM
DATE MODIFIED: 5/2/2016 9:46 PM
56. The Chart ____________________ button allows you to show or hide specific data in a chart, such as a data series or category.
ANSWER: Filtersfilters
POINTS: 1
REFERENCES: PowerPoint 122 Work with Charts in PowerPoint
QUESTION TYPE: Completion
HAS VARIABLES: False
DATE CREATED: 5/2/2016 9:17 PM
DATE MODIFIED: 5/2/2016 9:19 PM
57. To insert a picture as a slide background, use the _____________________ Background button in the Customize group.
ANSWER: Formatformat
POINTS: 1
REFERENCES: Animate a Chart PowerPoint 131
QUESTION TYPE: Completion
HAS VARIABLES: False
Name: Class: Date:
PowerPoint Module 6: Enhancing Charts
Copyright Cengage Learning. Powered by Cognero. Page 18
DATE CREATED: 5/2/2016 10:16 PM
DATE MODIFIED: 5/2/2016 10:18 PM
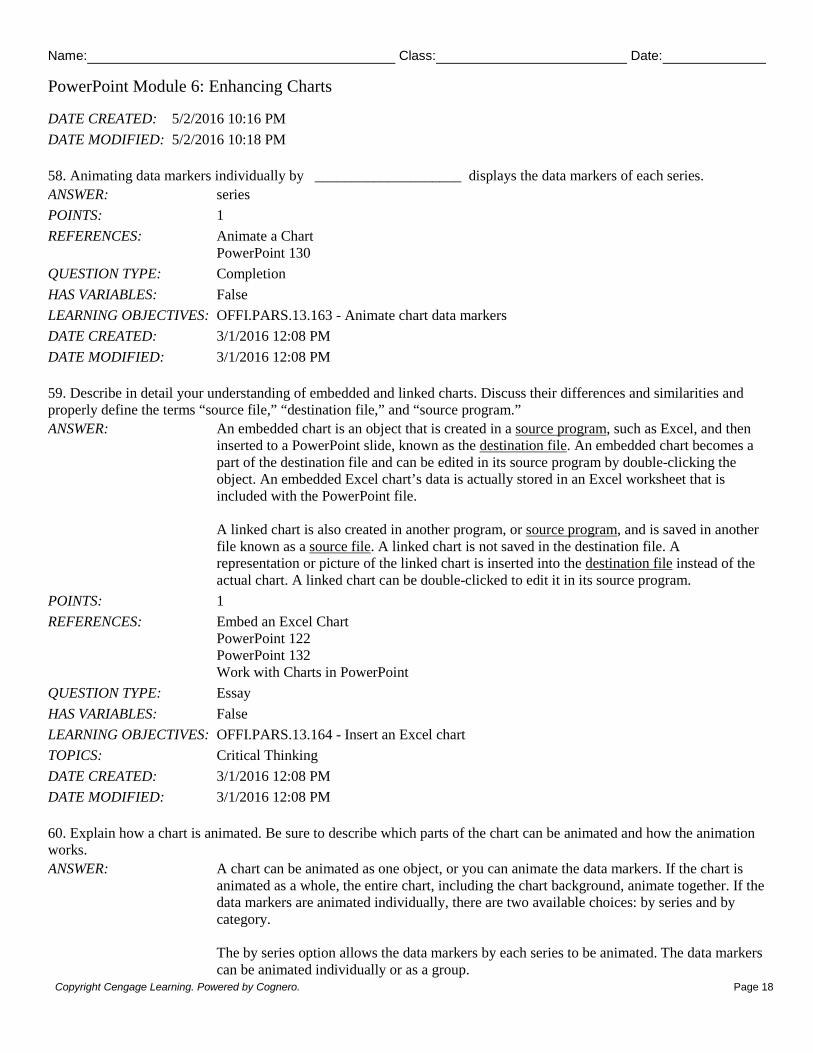
58. Animating data markers individually by ____________________ displays the data markers of each series.
ANSWER: series
POINTS: 1
REFERENCES: Animate a Chart PowerPoint 130
QUESTION TYPE: Completion
HAS VARIABLES: False
LEARNING OBJECTIVES: OFFI.PARS.13.163 - Animate chart data markers
DATE CREATED: 3/1/2016 12:08 PM
DATE MODIFIED: 3/1/2016 12:08 PM
59. Describe in detail your understanding of embedded and linked charts. Discuss their differences and similarities and properly define the terms “source file,” “destination file,” and “source program.”
ANSWER: An embedded chart is an object that is created in a source program, such as Excel, and then inserted to a PowerPoint slide, known as the destination file. An embedded chart becomes a part of the destination file and can be edited in its source program by double-clicking the object. An embedded Excel chart’s data is actually stored in an Excel worksheet that is included with the PowerPoint file.
A linked chart is also created in another program, or source program, and is saved in another file known as a source file. A linked chart is not saved in the destination file. A representation or picture of the linked chart is inserted into the destination file instead of the actual chart. A linked chart can be double-clicked to edit it in its source program.
POINTS: 1
REFERENCES: Embed an Excel Chart PowerPoint 122 PowerPoint 132 Work with Charts in PowerPoint
QUESTION TYPE: Essay
HAS VARIABLES: False
LEARNING OBJECTIVES: OFFI.PARS.13.164 - Insert an Excel chart
TOPICS: Critical Thinking
DATE CREATED: 3/1/2016 12:08 PM
DATE MODIFIED: 3/1/2016 12:08 PM
60. Explain how a chart is animated. Be sure to describe which parts of the chart can be animated and how the animation works.
ANSWER: A chart can be animated as one object, or you can animate the data markers. If the chart is animated as a whole, the entire chart, including the chart background, animate together. If thedata markers are animated individually, there are two available choices: by series and by category.
The by series option allows the data markers by each series to be animated. The data markers can be animated individually or as a group.
Name: Class: Date:
PowerPoint Module 6: Enhancing Charts
Copyright Cengage Learning. Powered by Cognero. Page 19
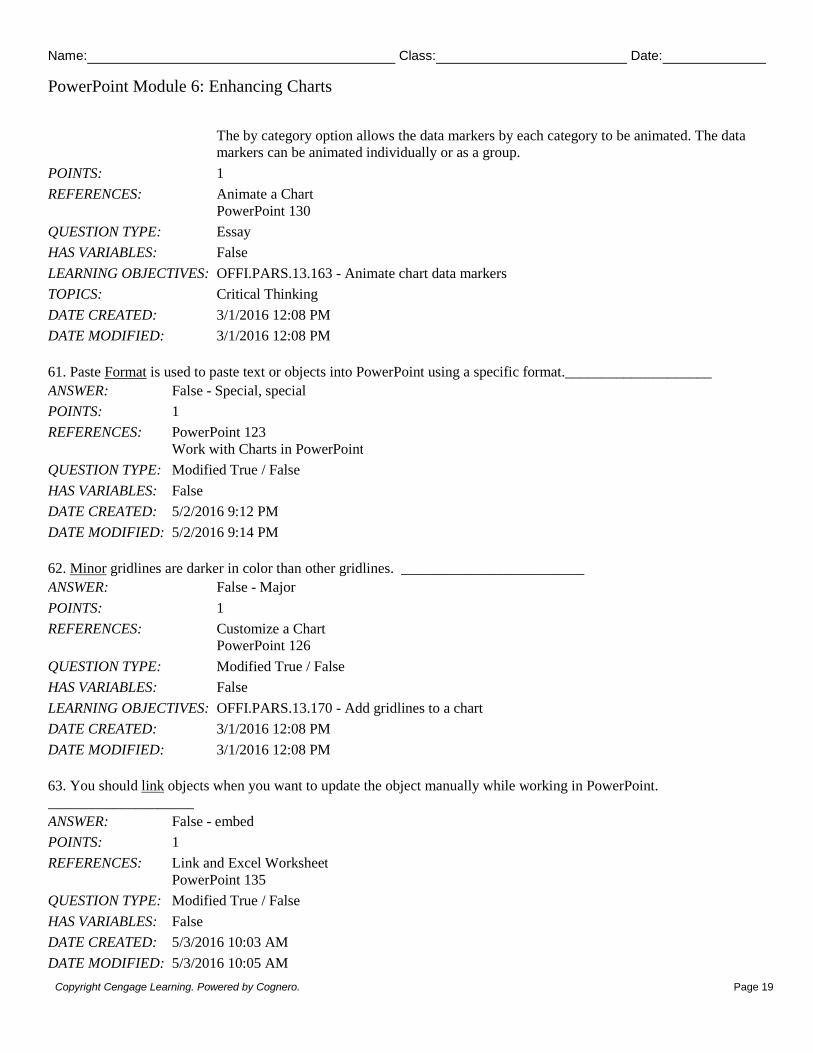
The by category option allows the data markers by each category to be animated. The data markers can be animated individually or as a group.
POINTS: 1
REFERENCES: Animate a Chart PowerPoint 130
QUESTION TYPE: Essay
HAS VARIABLES: False
LEARNING OBJECTIVES: OFFI.PARS.13.163 - Animate chart data markers
TOPICS: Critical Thinking
DATE CREATED: 3/1/2016 12:08 PM
DATE MODIFIED: 3/1/2016 12:08 PM
61. Paste Format is used to paste text or objects into PowerPoint using a specific format.____________________
ANSWER: False - Special, special
POINTS: 1
REFERENCES: PowerPoint 123 Work with Charts in PowerPoint
QUESTION TYPE: Modified True / False
HAS VARIABLES: False
DATE CREATED: 5/2/2016 9:12 PM
DATE MODIFIED: 5/2/2016 9:14 PM
62. Minor gridlines are darker in color than other gridlines. _________________________
ANSWER: False - Major
POINTS: 1
REFERENCES: Customize a Chart PowerPoint 126
QUESTION TYPE: Modified True / False
HAS VARIABLES: False
LEARNING OBJECTIVES: OFFI.PARS.13.170 - Add gridlines to a chart
DATE CREATED: 3/1/2016 12:08 PM
DATE MODIFIED: 3/1/2016 12:08 PM
63. You should link objects when you want to update the object manually while working in PowerPoint. ____________________
ANSWER: False - embed
POINTS: 1
REFERENCES: Link and Excel WorksheetPowerPoint 135
QUESTION TYPE: Modified True / False
HAS VARIABLES: False
DATE CREATED: 5/3/2016 10:03 AM
DATE MODIFIED: 5/3/2016 10:05 AM

Name: Class: Date:
PowerPoint Module 6: Enhancing Charts
Copyright Cengage Learning. Powered by Cognero. Page 20
64. Exit animation effects cause an object to leave the slide. _________________________
ANSWER: True
POINTS: 1
REFERENCES: Animate a Chart PowerPoint 130
QUESTION TYPE: Modified True / False
HAS VARIABLES: False
LEARNING OBJECTIVES: OFFI.PARS.13.174 - Set animation effects
DATE CREATED: 3/1/2016 12:08 PM
DATE MODIFIED: 3/1/2016 12:08 PM
65. The information that appears in the Insights task pane is generated by the Google search engine.____________________
ANSWER: False - Bing, bing
POINTS: 1
REFERENCES: Customize a Chart PowerPoint 127
QUESTION TYPE: Modified True / False
HAS VARIABLES: False
DATE CREATED: 5/2/2016 9:48 PM
DATE MODIFIED: 5/2/2016 9:50 PM
66. The object you create with a source program is saved in a destination file. _________________________
ANSWER: False - source
POINTS: 1
REFERENCES: Embed an Excel Chart PowerPoint 132
QUESTION TYPE: Modified True / False
HAS VARIABLES: False
LEARNING OBJECTIVES: OFFI.PARS.13.164 - Insert an Excel chart
DATE CREATED: 3/1/2016 12:08 PM
DATE MODIFIED: 3/1/2016 12:08 PM
67. A linked object is stored in its source file, not on a presentation slide such as embedded objects. _________________________
ANSWER: True
POINTS: 1
REFERENCES: Link an Excel Worksheet PowerPoint 134
QUESTION TYPE: Modified True / False
HAS VARIABLES: False
LEARNING OBJECTIVES: OFFI.PARS.13.165 - Link an Excel worksheet
DATE CREATED: 3/1/2016 12:08 PM
Name: Class: Date:
PowerPoint Module 6: Enhancing Charts
Copyright Cengage Learning. Powered by Cognero. Page 21
DATE MODIFIED: 3/1/2016 12:08 PM
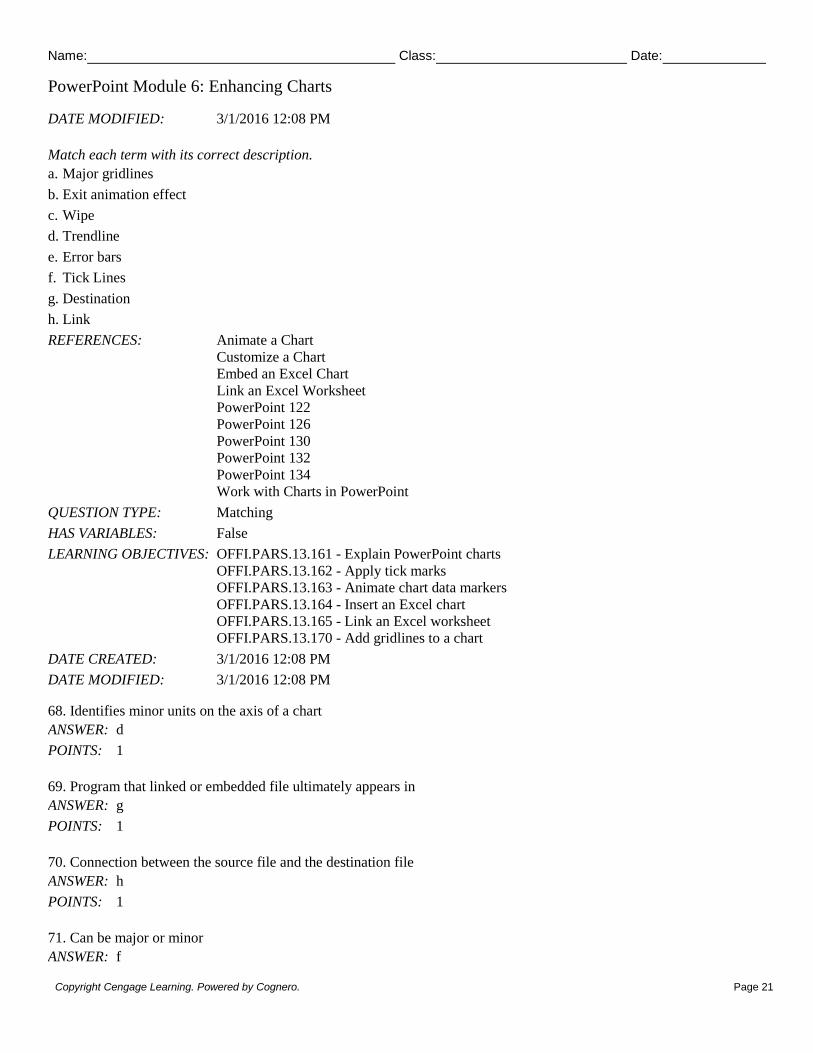
Match each term with its correct description.
a. Major gridlines
b. Exit animation effect
c. Wipe
d. Trendline
e. Error bars
f. Tick Lines
g. Destination
h. Link
REFERENCES: Animate a Chart Customize a Chart Embed an Excel Chart Link an Excel Worksheet PowerPoint 122 PowerPoint 126 PowerPoint 130 PowerPoint 132 PowerPoint 134 Work with Charts in PowerPoint
QUESTION TYPE: Matching
HAS VARIABLES: False
LEARNING OBJECTIVES: OFFI.PARS.13.161 - Explain PowerPoint chartsOFFI.PARS.13.162 - Apply tick marks OFFI.PARS.13.163 - Animate chart data markersOFFI.PARS.13.164 - Insert an Excel chart OFFI.PARS.13.165 - Link an Excel worksheet OFFI.PARS.13.170 - Add gridlines to a chart
DATE CREATED: 3/1/2016 12:08 PM
DATE MODIFIED: 3/1/2016 12:08 PM
68. Identifies minor units on the axis of a chart
ANSWER: d
POINTS: 1
69. Program that linked or embedded file ultimately appears in
ANSWER: g
POINTS: 1
70. Connection between the source file and the destination file
ANSWER: h
POINTS: 1
71. Can be major or minor
ANSWER: f
Name: Class: Date:
PowerPoint Module 6: Enhancing Charts
Copyright Cengage Learning. Powered by Cognero. Page 22
POINTS: 1
72. Type of animation
ANSWER: c
POINTS: 1
73. Causes an object to leave the slide during a slide show
ANSWER: b
POINTS: 1
74. Identify potential error amounts relative to each data marker in a data series
ANSWER: e
POINTS: 1
75. Identifies major units on the axis of a chart
ANSWER: a
POINTS: 1
Illustrated Course Guide Microsoft Office 365 and PowerPoint 2016 Advanced Spiral bound Version 1st Edition Beskeen Test BankFull Download: http://testbanklive.com/download/illustrated-course-guide-microsoft-office-365-and-powerpoint-2016-advanced-spiral-bound-version-1st-edition-beskeen-test-bank/
Full download all chapters instantly please go to Solutions Manual, Test Bank site: testbanklive.com


![[Excel 2013] (MOS : Microsoft Office Specialist) …cc-syus.agu.ac.jp/extension/2016/38.pdf[Excel 2013] (MOS : Microsoft Office Specialist) Word Excel Excel < MOS Words Excels PowerPoint](https://img.pdfslide.us/doc/110x75/5fbae5ba164b2a009e0d4607/excel-2013-mos-microsoft-office-specialist-cc-syusaguacjpextension201638pdf.jpg)