Embed Size (px)
Citation preview
PowerPoint Lesson 6Working with Tables and Charts
Microsoft Office 2010 Advanced
Cable / Morrison1

Po
we
rPo
int
Les
so
n 6
Cable / Morrison Microsoft Office 2010 Advanced2
Objectives
Change the table structure. Use the drawing tools to modify a table and
create a new table. Apply a custom table style. Use multiple slides to build a table.
22
Po
we
rPo
int
Les
so
n 6
Cable / Morrison Microsoft Office 2010 Advanced
Objectives (continued)
Choose the correct chart type and identify data to be represented in a chart.
Link to data in an Excel chart. Animate chart data. Modify and animate an organization chart.
3
Po
we
rPo
int
Les
so
n 6
Cable / Morrison Microsoft Office 2010 Advanced4
Vocabulary
axis axis title data label data series
embedded object legend linked object plot area
44
Po
we
rPo
int
Les
so
n 6
Cable / Morrison Microsoft Office 2010 Advanced5
Working with Tables
Design and layout tools on the Table Tools tab can be used to modify the table’s structure and format.
Changing the Table Structure If table contents need to be rearranged, drag
and drop the data to a new location in the table.
Po
we
rPo
int
Les
so
n 6
Cable / Morrison Microsoft Office 2010 Advanced
Working with Tables (continued)
Changing the Table Structure (continued) You can split a cell to create a new border
within a cell. You can change the column width and row
height of cells. You can merge two or more cells by using
the Table Eraser tool.
6
Po
we
rPo
int
Les
so
n 6
Cable / Morrison Microsoft Office 2010 Advanced
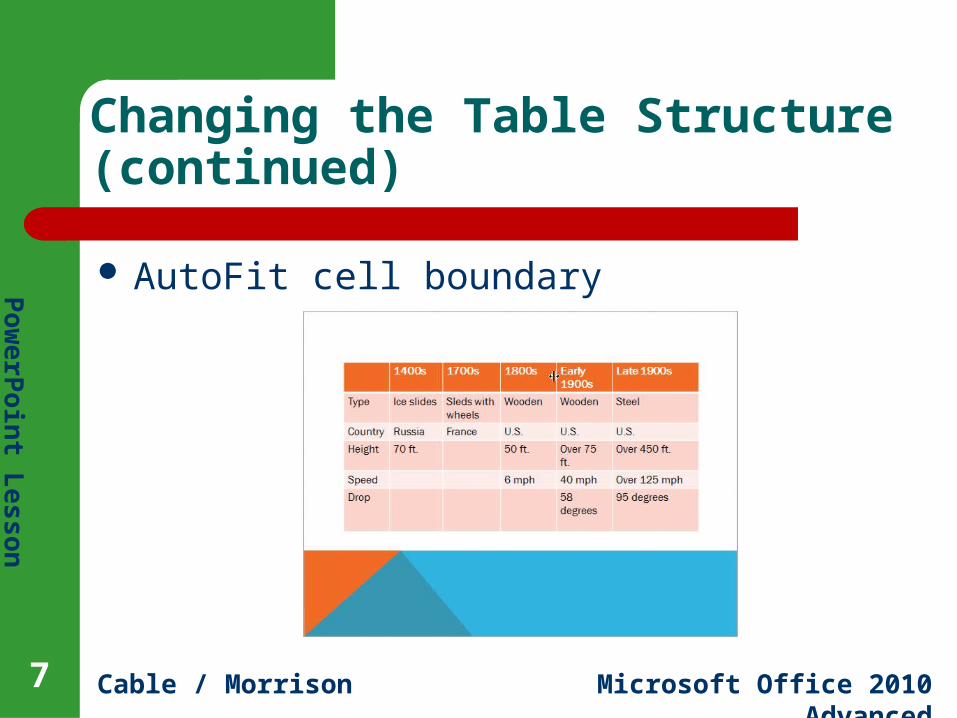
Changing the Table Structure (continued)
7
AutoFit cell boundary
Po
we
rPo
int
Les
so
n 6
Cable / Morrison Microsoft Office 2010 Advanced
Changing the Table Structure (continued)
Creating a Table Using the Draw Table Tool
The Draw Table tool gives you considerable flexibility in creating a table.– Can be used to split and merge a number of cells
collectively– Enables you to size cells precisely within the table– Text can be rotated within a table cell so that it
appears vertical or stacked
8
Po
we
rPo
int
Les
so
n 6
Cable / Morrison Microsoft Office 2010 Advanced
Changing the Table Structure (continued)
Applying a Custom Table Style When a new table is created in PowerPoint,
a style is applied to the table.– Style provides formats for shading, borders, and
effects You can change the style by:
– Applying a different style– Modifying the existing style by changing some of
the formats9
Po
we
rPo
int
Les
so
n 6
Cable / Morrison Microsoft Office 2010 Advanced
Changing the Table Structure (continued)
Using Multiple Slides to Build a Table in a Presentation
A table can be built using more than one slide.– Showing all the information in a table all at once
can be overwhelming for your audience Duplicate Slides command enables you to
quickly copy and paste one or more selected slides.
10
Po
we
rPo
int
Les
so
n 6
Cable / Morrison Microsoft Office 2010 Advanced
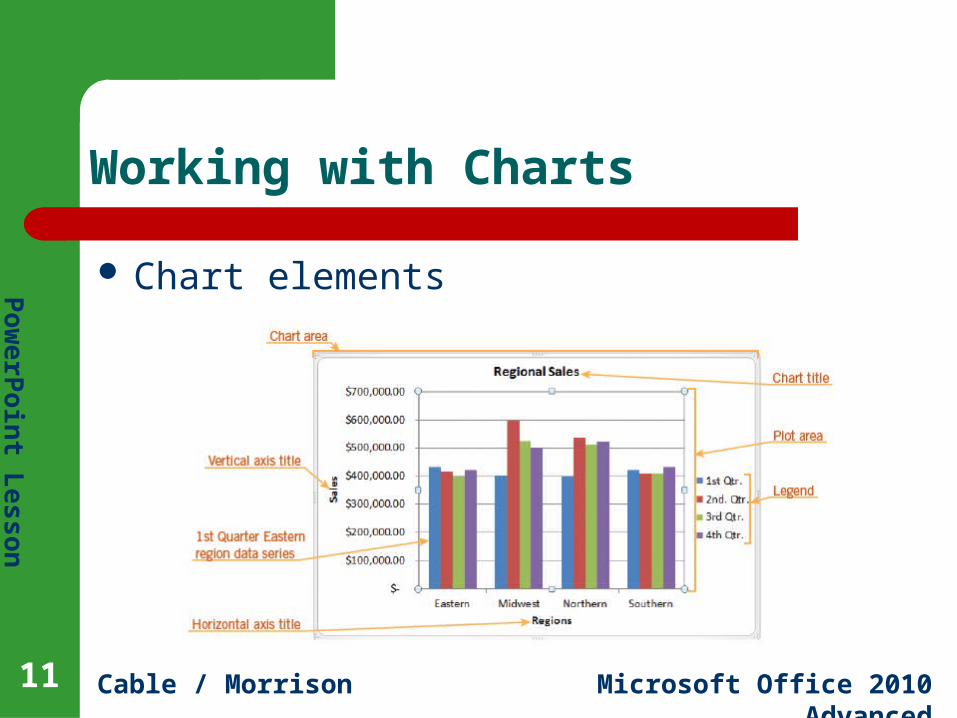
Working with Charts
11
Chart elements
Po
we
rPo
int
Les
so
n 6
Cable / Morrison Microsoft Office 2010 Advanced
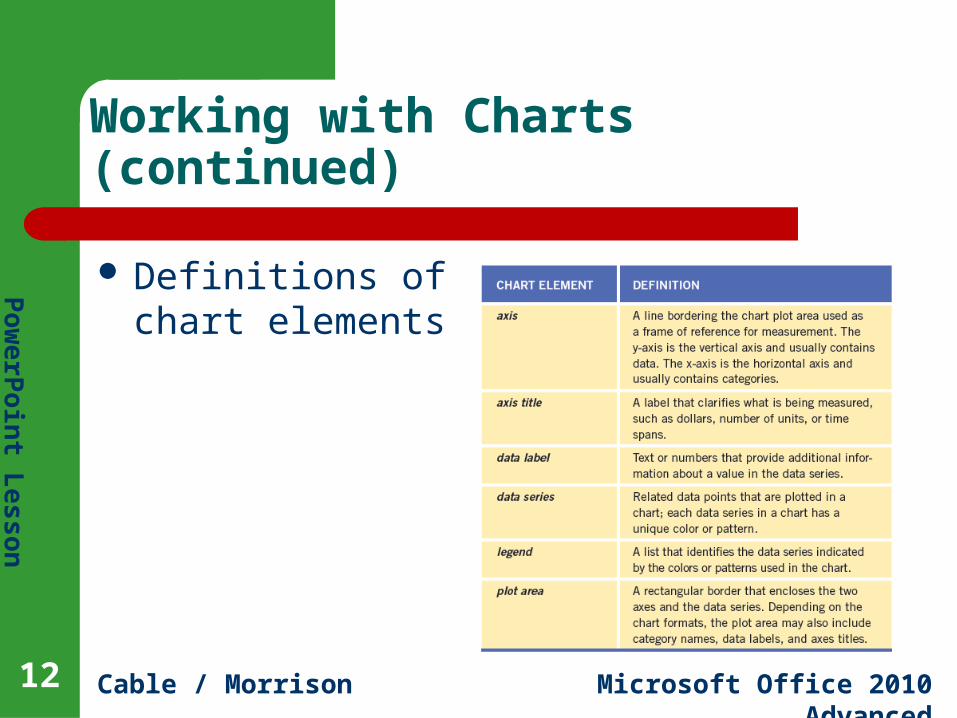
Working with Charts (continued)
Definitions of chart elements
12
Po
we
rPo
int
Les
so
n 6
Cable / Morrison Microsoft Office 2010 Advanced
Working with Charts (continued)
Choosing the Right Chart Type PowerPoint offers many different types of
charts. PowerPoint provides several different slide
layouts and color schemes for each chart type.
13
Po
we
rPo
int
Les
so
n 6
Cable / Morrison Microsoft Office 2010 Advanced
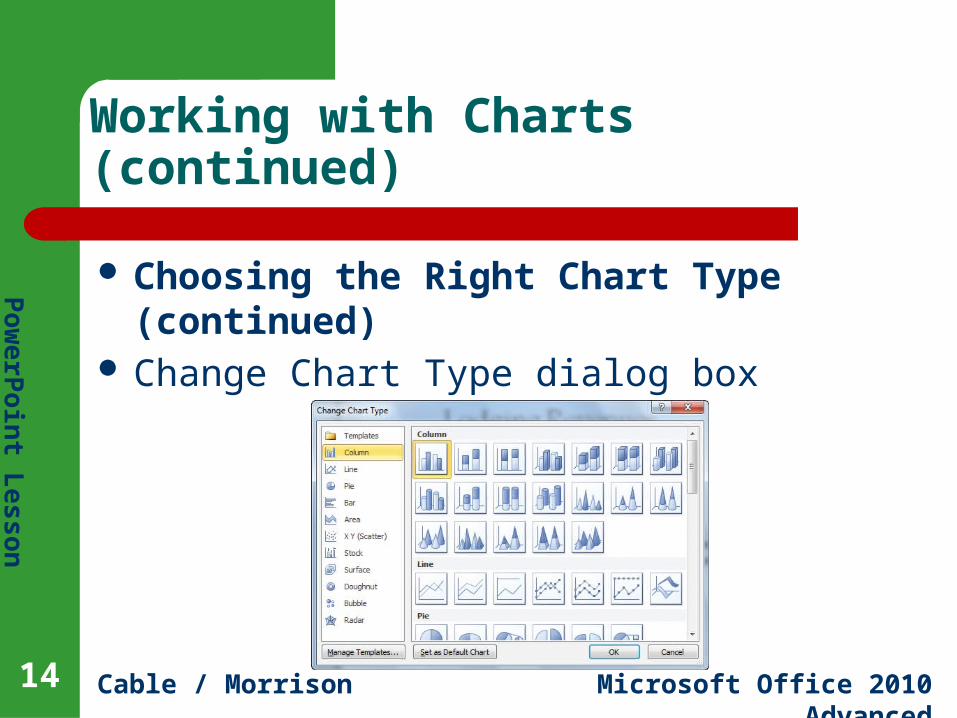
Working with Charts (continued)
Choosing the Right Chart Type (continued)
Change Chart Type dialog box
14
Po
we
rPo
int
Les
so
n 6
Cable / Morrison Microsoft Office 2010 Advanced
Working with Charts (continued)
Identifying the Data to be Represented in a Chart
You can specify the data that you want to include in the chart.
You can change the direction in which PowerPoint plots data.
15
Po
we
rPo
int
Les
so
n 6
Cable / Morrison Microsoft Office 2010 Advanced
Working with Charts (continued)
16
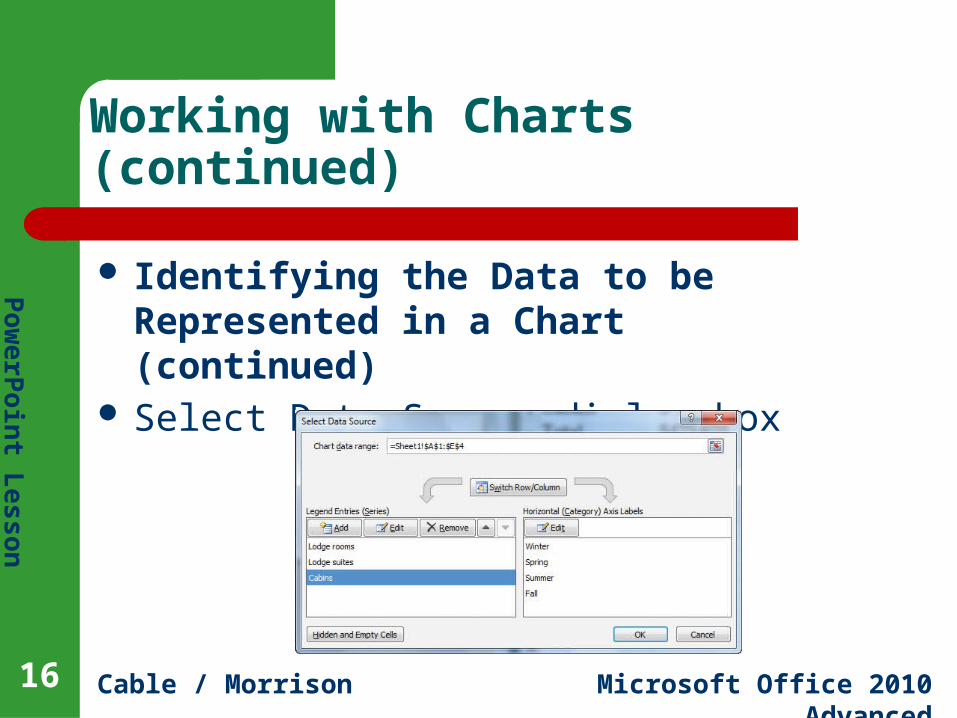
Identifying the Data to be Represented in a Chart (continued)
Select Data Source dialog box
Po
we
rPo
int
Les
so
n 6
Cable / Morrison Microsoft Office 2010 Advanced
Working with Charts (continued)
Customizing a Data Chart You can customize a chart by modifying the
chart elements.– For example:
Add a title to the chart and each axis. Position the legend. Choose data labels.
You can create an exploded slice on a pie chart to make that slice more obvious.
17
Po
we
rPo
int
Les
so
n 6
Cable / Morrison Microsoft Office 2010 Advanced
Working with Charts (continued)
Linking Chart Data An embedded object becomes part of the
destination file.– Can be edited in the destination file
A linked object is inserted as a static object and accesses data stored in the source file.– You edit linked data by editing the data in the
Excel worksheet.
18
Po
we
rPo
int
Les
so
n 6
Cable / Morrison Microsoft Office 2010 Advanced
Working with Charts (continued)
Animating Chart Data PowerPoint offers several effect options to
animate the chart elements.– For example, you can animate the chart to
appear: As one object By series or category By elements in a series or elements in a category
You can create hyperlinks in a chart.
19
Po
we
rPo
int
Les
so
n 6
Cable / Morrison Microsoft Office 2010 Advanced
Modifying an Organization Chart
It is easy to add and delete text boxes in an organization chart.
To enhance the presentation of the organization chart, you can:– Animate the SmartArt graphic.– Format the elements so that they appear in
segments.
20
Po
we
rPo
int
Les
so
n 6
Cable / Morrison Microsoft Office 2010 Advanced
Summary
In this lesson, you learned: After creating a table on a slide, you can easily
rearrange the content. You can also adjust the font size, AutoFit the columns, and distribute the rows and columns for equal spacing.
The Draw Table tools are useful for creating or modifying a table, especially for merging and splitting cells.
21
Po
we
rPo
int
Les
so
n 6
Cable / Morrison Microsoft Office 2010 Advanced
Summary (continued)
PowerPoint provides several features for modifying table styles.
It is important to choose the correct chart type so that the data and values are represented correctly and for maximum effect.
22
Po
we
rPo
int
Les
so
n 6
Cable / Morrison Microsoft Office 2010 Advanced
Summary (continued)
You can introduce parts of a table in segments, emphasizing each point individually, and building the table as you progress through the slides.
You can specify the data that is represented in a chart.
You can modify the chart elements to clarify the information represented in the chart.
23
Po
we
rPo
int
Les
so
n 6
Cable / Morrison Microsoft Office 2010 Advanced
Summary (continued)
A linked object must be edited in the source application. The edits will appear in the linked object automatically if the destination document is already open, or the updates will appear when the destination document is reopened.
You can animate chart objects for progressive disclosure.
24
Po
we
rPo
int
Les
so
n 6
Cable / Morrison Microsoft Office 2010 Advanced
Summary (continued)
PowerPoint offers many features to help you modify the structure of an organization chart as well as change the chart formats.
25