Embed Size (px)
Citation preview
12/25/2012
1
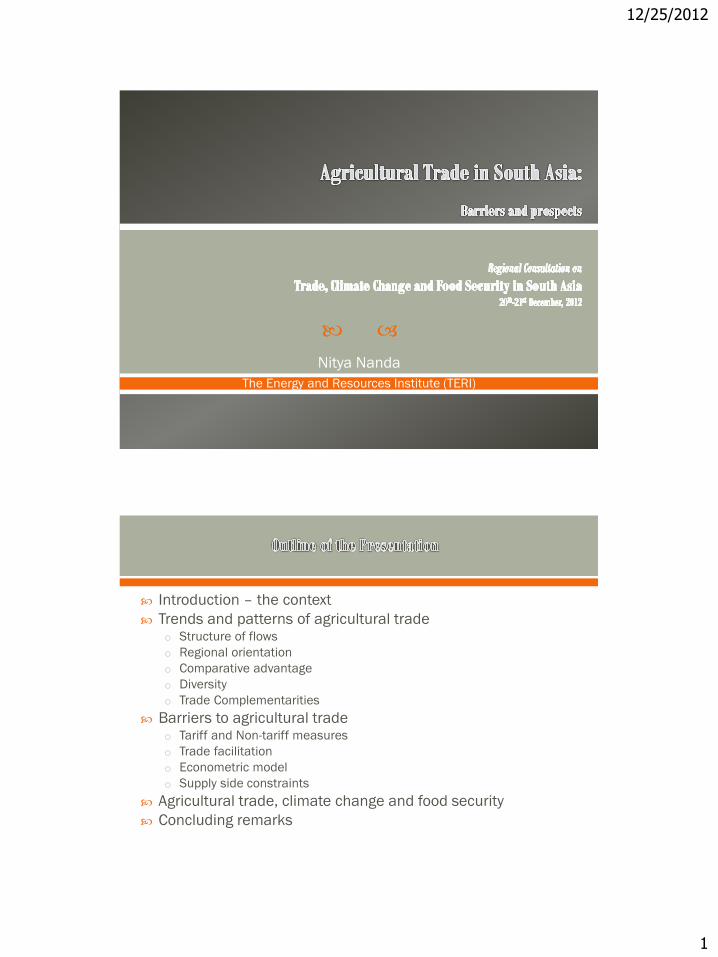
Nitya Nanda
The Energy and Resources Institute (TERI)
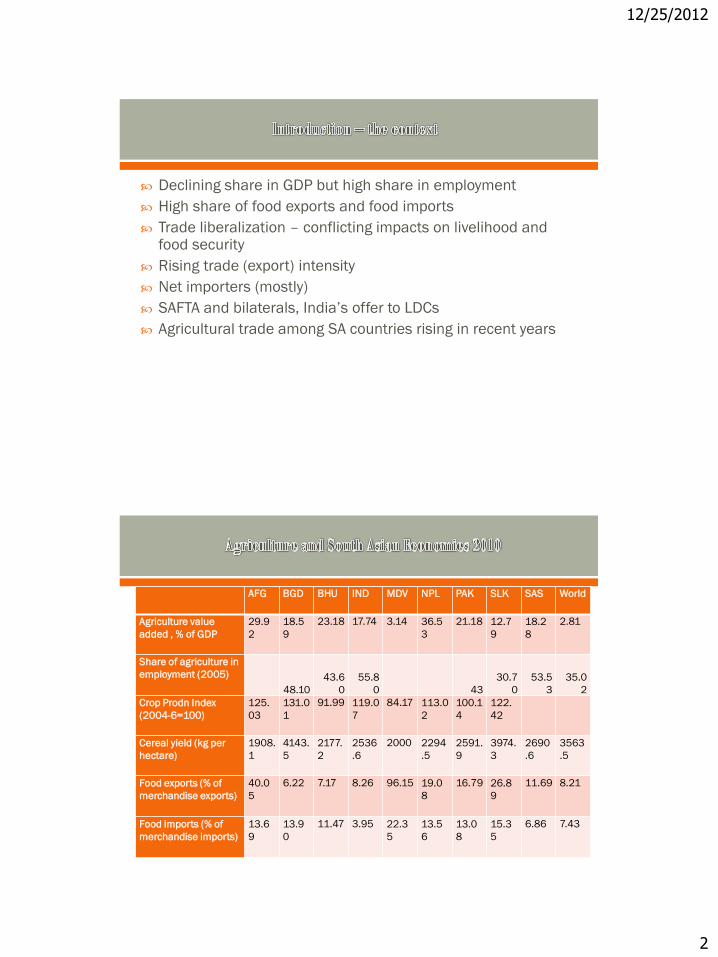
Introduction – the context
Trends and patterns of agricultural trade o Structure of flows
o Regional orientation
o Comparative advantage
o Diversity
o Trade Complementarities
Barriers to agricultural trade o Tariff and Non-tariff measures
o Trade facilitation
o Econometric model
o Supply side constraints
Agricultural trade, climate change and food security
Concluding remarks
12/25/2012
2
Declining share in GDP but high share in employment
High share of food exports and food imports
Trade liberalization – conflicting impacts on livelihood and food security
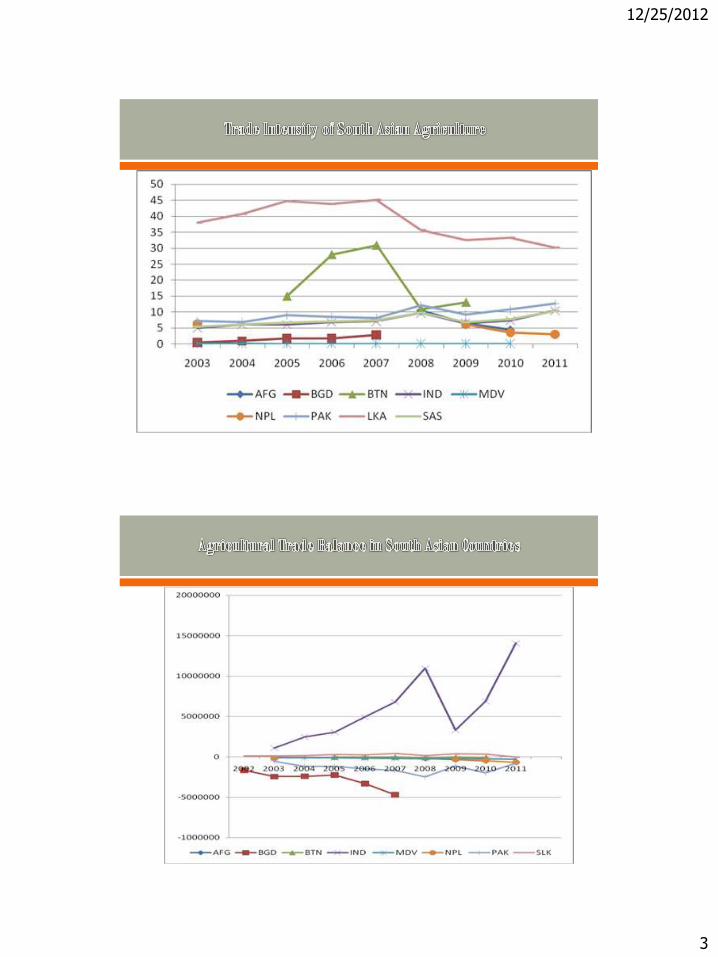
Rising trade (export) intensity
Net importers (mostly)
SAFTA and bilaterals, India’s offer to LDCs
Agricultural trade among SA countries rising in recent years
AFG BGD BHU IND MDV NPL PAK SLK SAS World
Agriculture value
added , % of GDP
29.9
2
18.5
9
23.18 17.74 3.14 36.5
3
21.18 12.7
9
18.2
8
2.81
Share of agriculture in
employment (2005)
48.10
43.6
0
55.8
0 43
30.7
0
53.5
3
35.0
2
Crop Prodn Index
(2004-6=100)
125.
03
131.0
1
91.99 119.0
7
84.17 113.0
2
100.1
4
122.
42
Cereal yield (kg per
hectare)
1908.
1
4143.
5
2177.
2
2536
.6
2000 2294
.5
2591.
9
3974.
3
2690
.6
3563
.5
Food exports (% of
merchandise exports)
40.0
5
6.22 7.17 8.26 96.15 19.0
8
16.79 26.8
9
11.69 8.21
Food imports (% of
merchandise imports)
13.6
9
13.9
0
11.47 3.95 22.3
5
13.5
6
13.0
8
15.3
5
6.86 7.43
12/25/2012
3
12/25/2012
4
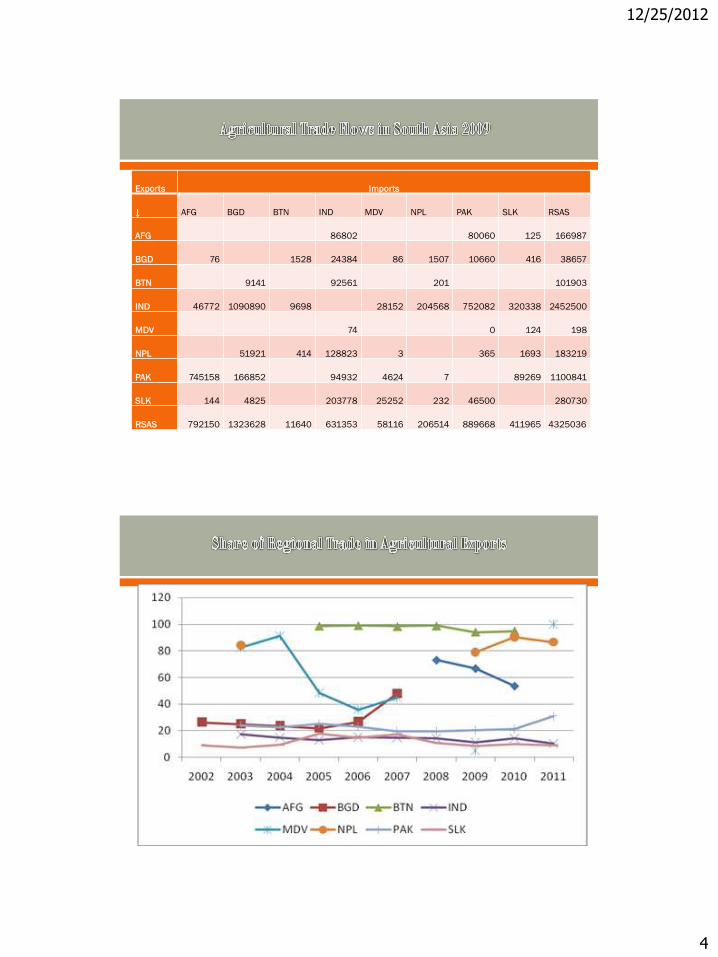
Exports Imports
↓ AFG BGD BTN IND MDV NPL PAK SLK RSAS
AFG 86802 80060 125 166987
BGD 76 1528 24384 86 1507 10660 416 38657
BTN 9141 92561 201 101903
IND 46772 1090890 9698 28152 204568 752082 320338 2452500
MDV 74 0 124 198
NPL 51921 414 128823 3 365 1693 183219
PAK 745158 166852 94932 4624 7 89269 1100841
SLK 144 4825 203778 25252 232 46500 280730
RSAS 792150 1323628 11640 631353 58116 206514 889668 411965 4325036
12/25/2012
5
12/25/2012
6
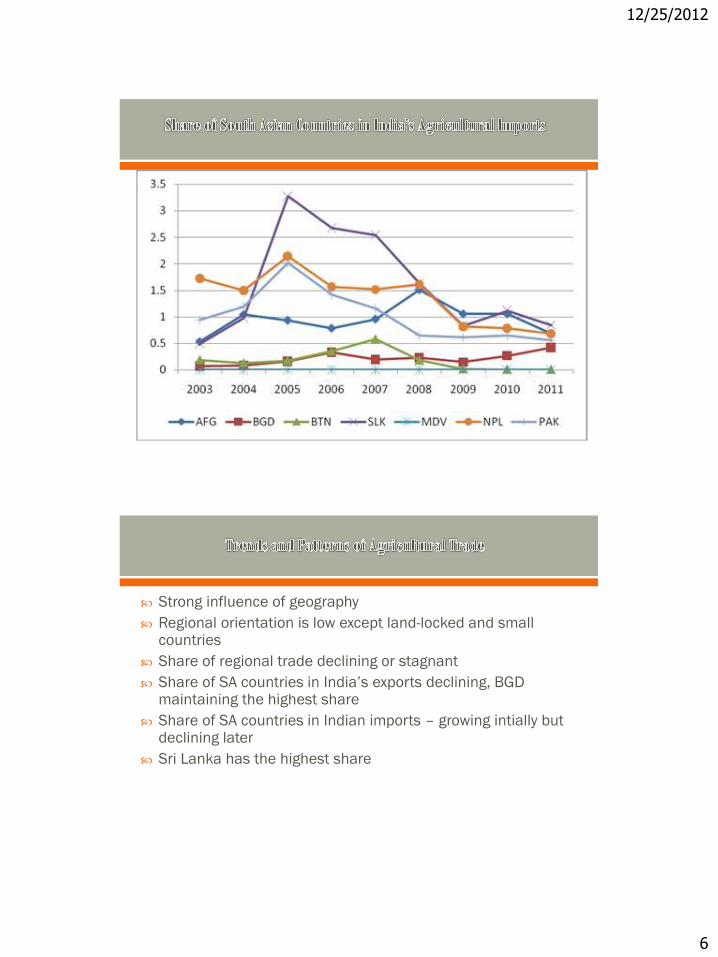
Strong influence of geography
Regional orientation is low except land-locked and small countries
Share of regional trade declining or stagnant
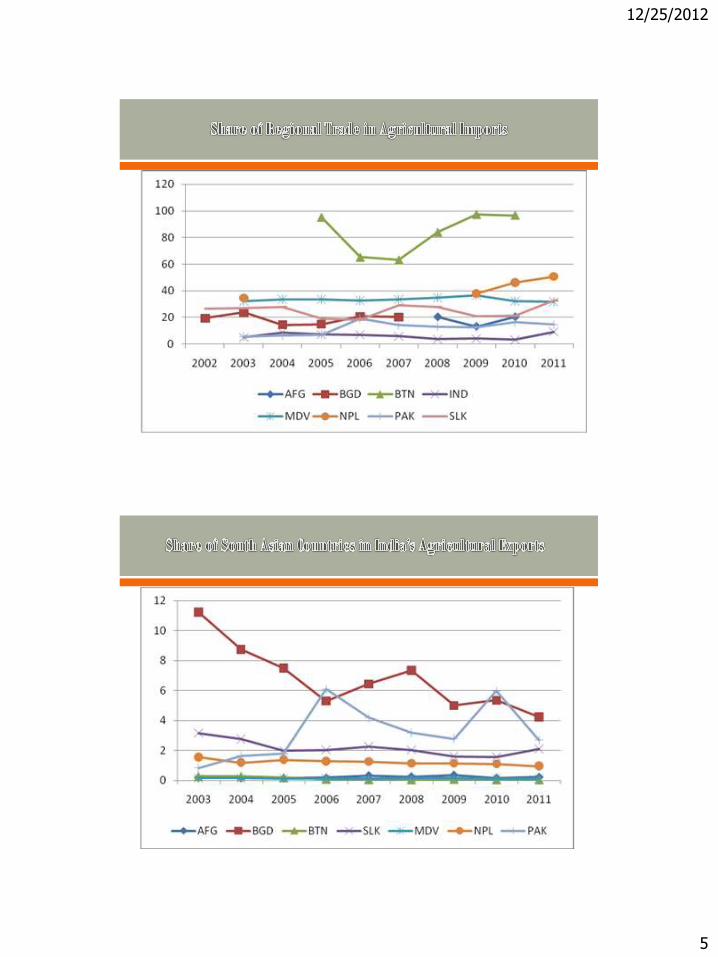
Share of SA countries in India’s exports declining, BGD maintaining the highest share
Share of SA countries in Indian imports – growing intially but declining later
Sri Lanka has the highest share
12/25/2012
7
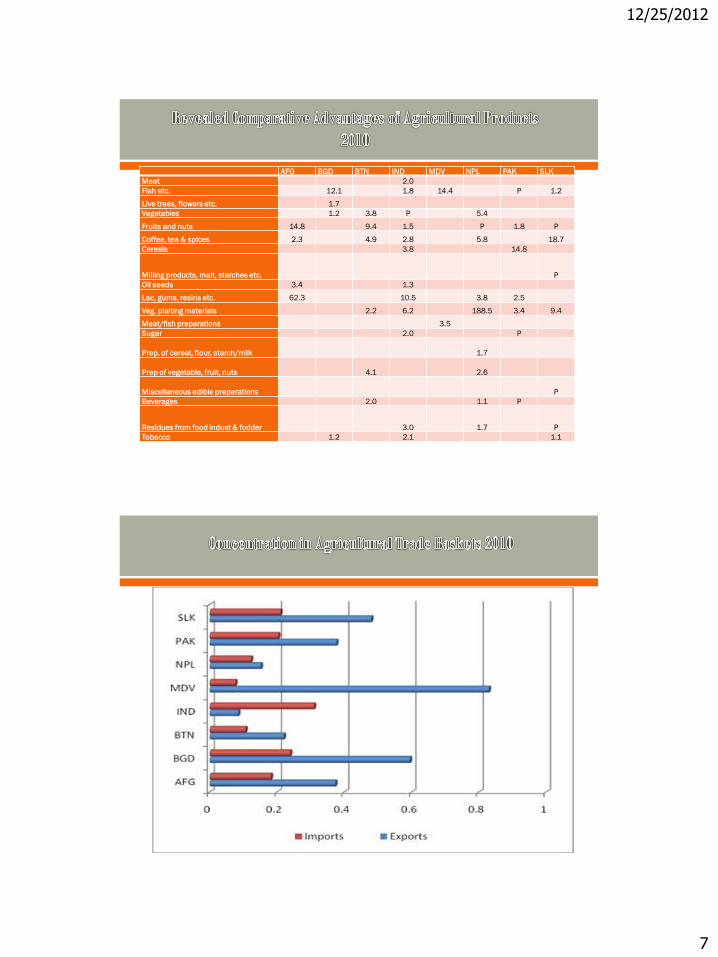
AFG BGD BTN IND MDV NPL PAK SLK
Meat 2.0
Fish etc. 12.1 1.8 14.4 P 1.2
Live trees, flowers etc. 1.7
Vegetables 1.2 3.8 P 5.4
Fruits and nuts 14.8 9.4 1.5 P 1.8 P
Coffee, tea & spices 2.3 4.9 2.8 5.8 18.7
Cereals 3.8 14.8
Milling products, malt, starches etc. P
Oil seeds 3.4 1.3
Lac, gums, resins etc. 62.3 10.5 3.8 2.5
Veg. plaiting materials 2.2 6.2 188.5 3.4 9.4
Meat/fish preparations 3.5
Sugar 2.0 P
Prep. of cereal, flour, starch/milk 1.7
Prep of vegetable, fruit, nuts 4.1 2.6
Miscellaneous edible preparations P
Beverages 2.0 1.1 P
Residues from food indust & fodder 3.0 1.7 P
Tobacco 1.2 2.1 1.1
12/25/2012
8
12/25/2012
9
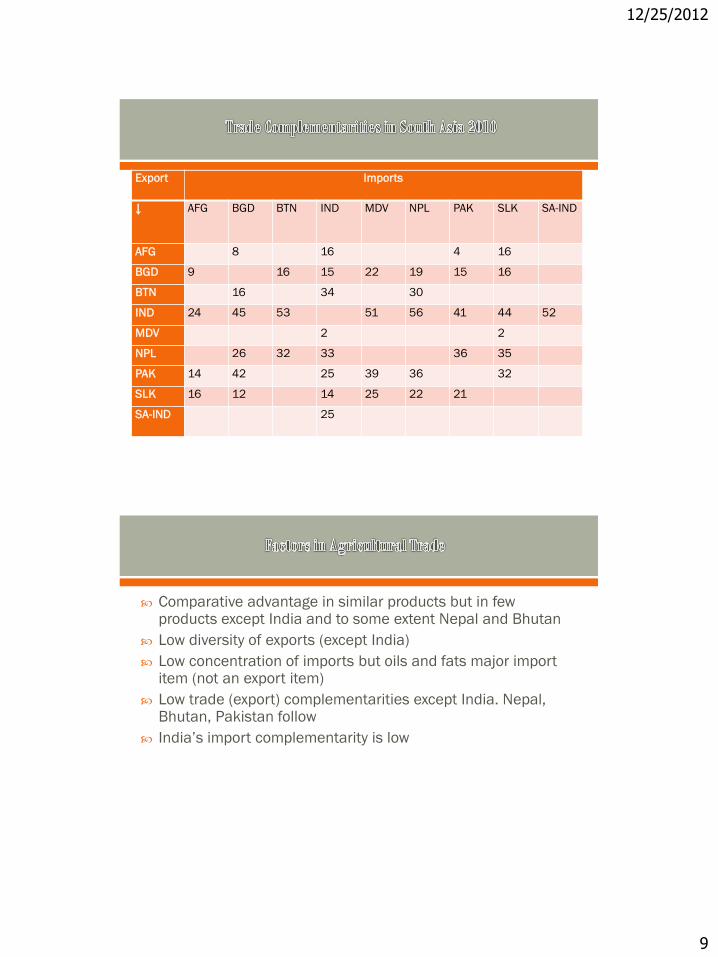
Export Imports
↓ AFG BGD BTN IND MDV NPL PAK SLK SA-IND
AFG 8 16 4 16
BGD 9 16 15 22 19 15 16
BTN 16 34 30
IND 24 45 53 51 56 41 44 52
MDV 2 2
NPL 26 32 33 36 35
PAK 14 42 25 39 36 32
SLK 16 12 14 25 22 21
SA-IND 25
Comparative advantage in similar products but in few products except India and to some extent Nepal and Bhutan
Low diversity of exports (except India)
Low concentration of imports but oils and fats major import item (not an export item)
Low trade (export) complementarities except India. Nepal, Bhutan, Pakistan follow
India’s import complementarity is low

12/25/2012
10
Exporting
Country/Regi
on
Importing Country
AFG BGD BTN IND MDV NPL PAK SLK
WLD 7.26 18.52 49.34 34.6 17.07 14.56 19.1 21.8
AFG 19.5 34.69 11.54 15
BGD 4.38 36.67 37.36 23.93 19.29 12.22 24.78
BTN 24.05 1.07 22.5 15.88
IND 5.57 14.64 44.48 15.51 11.29 9.16 19.6
MDV 65 31.43 25.15
NPL 11.34 46 39.17 25 8.67 13.66
PAK 6.61 17.76 27.29 14.13 8.91 11.02
SLK 7.13 18.27 9.13 15.48 18.33 15.93
Import into IND requires SPS certifications – time and resource
BGD ban on IND poultry products even after avian influenza was over
PAK MFN and positive list issue with IND (changing)
India more developed in standards setting, some countries cannot afford to maintain high standards
SAFTA provides for harmonization of standards but little progress
Export ban from time to time
12/25/2012
11
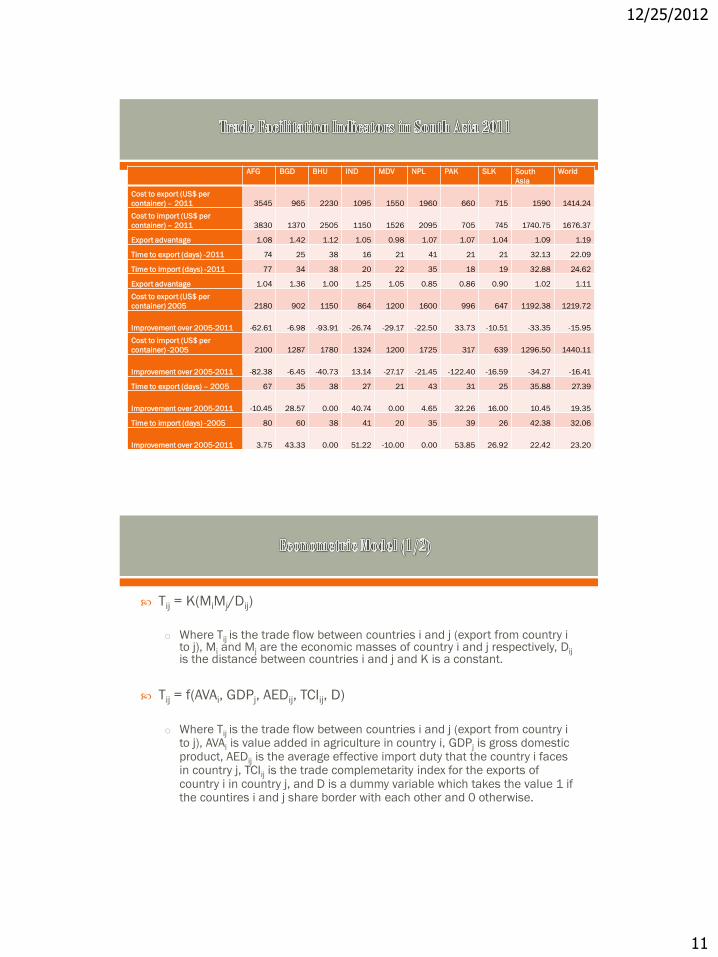
AFG BGD BHU IND MDV NPL PAK SLK South
Asia
World
Cost to export (US$ per
container) – 2011 3545 965 2230 1095 1550 1960 660 715 1590 1414.24
Cost to import (US$ per
container) – 2011 3830 1370 2505 1150 1526 2095 705 745 1740.75 1676.37
Export advantage 1.08 1.42 1.12 1.05 0.98 1.07 1.07 1.04 1.09 1.19
Time to export (days) -2011 74 25 38 16 21 41 21 21 32.13 22.09
Time to import (days) -2011 77 34 38 20 22 35 18 19 32.88 24.62
Export advantage 1.04 1.36 1.00 1.25 1.05 0.85 0.86 0.90 1.02 1.11
Cost to export (US$ per
container) 2005 2180 902 1150 864 1200 1600 996 647 1192.38 1219.72
Improvement over 2005-2011 -62.61 -6.98 -93.91 -26.74 -29.17 -22.50 33.73 -10.51 -33.35 -15.95
Cost to import (US$ per
container) -2005 2100 1287 1780 1324 1200 1725 317 639 1296.50 1440.11
Improvement over 2005-2011 -82.38 -6.45 -40.73 13.14 -27.17 -21.45 -122.40 -16.59 -34.27 -16.41
Time to export (days) – 2005 67 35 38 27 21 43 31 25 35.88 27.39
Improvement over 2005-2011 -10.45 28.57 0.00 40.74 0.00 4.65 32.26 16.00 10.45 19.35
Time to import (days) -2005 80 60 38 41 20 35 39 26 42.38 32.06
Improvement over 2005-2011 3.75 43.33 0.00 51.22 -10.00 0.00 53.85 26.92 22.42 23.20
Tij = K(MiMj/Dij)
o Where Tij is the trade flow between countries i and j (export from country i
to j), Mi and Mj are the economic masses of country i and j respectively, Dij is the distance between countries i and j and K is a constant.
Tij = f(AVAi, GDPj, AEDij, TCIij, D)
o Where Tij is the trade flow between countries i and j (export from country i to j), AVAi is value added in agriculture in country i, GDPj is gross domestic product, AEDij is the average effective import duty that the country i faces in country j, TCIij is the trade complemetarity index for the exports of country i in country j, and D is a dummy variable which takes the value 1 if the countires i and j share border with each other and 0 otherwise.
12/25/2012
12
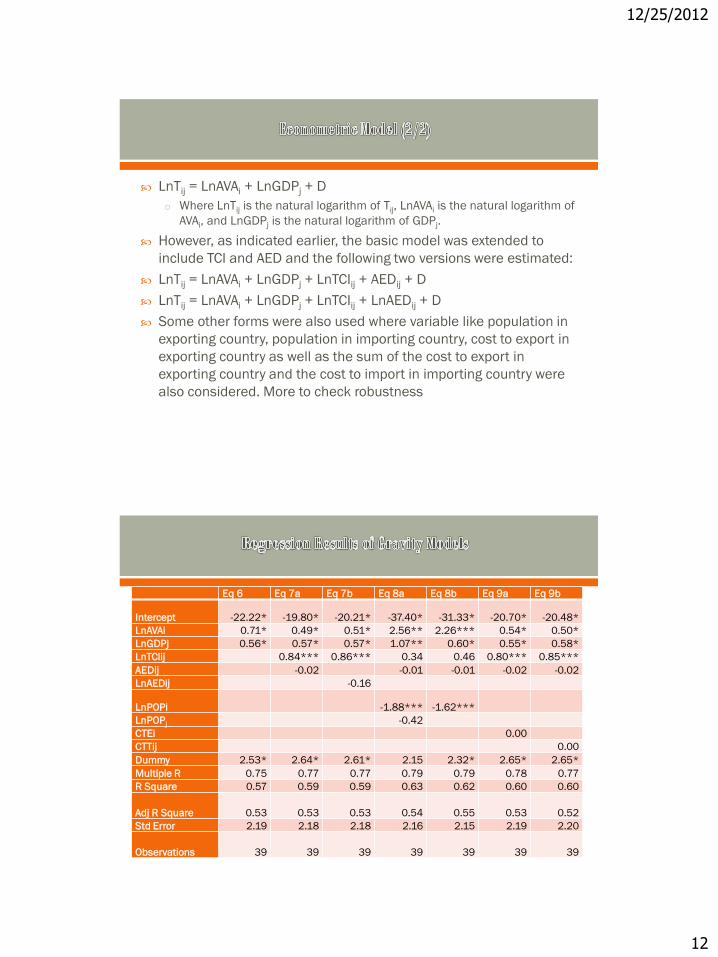
LnTij = LnAVAi + LnGDPj + D
o Where LnTij is the natural logarithm of Tij, LnAVAi is the natural logarithm of
AVAi, and LnGDPj is the natural logarithm of GDPj.
However, as indicated earlier, the basic model was extended to
include TCI and AED and the following two versions were estimated:
LnTij = LnAVAi + LnGDPj + LnTCIij + AEDij + D
LnTij = LnAVAi + LnGDPj + LnTCIij + LnAEDij + D
Some other forms were also used where variable like population in
exporting country, population in importing country, cost to export in
exporting country as well as the sum of the cost to export in
exporting country and the cost to import in importing country were
also considered. More to check robustness
Eq 6 Eq 7a Eq 7b Eq 8a Eq 8b Eq 9a Eq 9b
Intercept -22.22* -19.80* -20.21* -37.40* -31.33* -20.70* -20.48*
LnAVAi 0.71* 0.49* 0.51* 2.56** 2.26*** 0.54* 0.50*
LnGDPj 0.56* 0.57* 0.57* 1.07** 0.60* 0.55* 0.58*
LnTCIij 0.84*** 0.86*** 0.34 0.46 0.80*** 0.85***
AEDij -0.02 -0.01 -0.01 -0.02 -0.02
LnAEDij -0.16
LnPOPi -1.88*** -1.62***
LnPOPj -0.42
CTEi 0.00
CTTij 0.00
Dummy 2.53* 2.64* 2.61* 2.15 2.32* 2.65* 2.65*
Multiple R 0.75 0.77 0.77 0.79 0.79 0.78 0.77
R Square 0.57 0.59 0.59 0.63 0.62 0.60 0.60
Adj R Square 0.53 0.53 0.53 0.54 0.55 0.53 0.52
Std Error 2.19 2.18 2.18 2.16 2.15 2.19 2.20
Observations 39 39 39 39 39 39 39

12/25/2012
13
In the basic model, all the variables included are highly
significant
All the variables also show expected signs, i.e., agricultural
value added in exporting country, GDP of importing country as
well as the neighbourhood dummy, all influence trade
positively
Trade complementarity low significance but AED insignificant
Population of importing country insignificant but exporting
country shows low significance with negative sign
Basic variables are stable - robustness
AFG BGD BTN IND MDV NPL PAK SLK SAS WLD
Agriculture value added
per worker (constant
2000 US$) 480.14 465.32 479.01
2671.3
8 242.05 962.62 906.88 510.35
1064.3
8
Arable land (hectares
per person) 0.23 0.05 0.11 0.13 0.01 0.08 0.12 0.06 0.12 0.20
Average precipitation in
depth (mm per year) 327.00
2666.0
0
2200.0
0
1083.0
0
1972.0
0
1500.0
0 494.00
1712.0
0
Cereal yield (kg per
hectare)
2045.2
0
4140.8
0
2159.1
0
2571.9
0
2041.7
0
2373.9
0
2789.7
0
3663.6
0
2728.8
7
3567.9
4
Droughts, floods,
extreme temperatures
(% of population,
average 1990-2009) 1.06 4.58 0.01 4.36 0.03 0.70 1.06 2.16

12/25/2012
14
Climate change => agriculture through weather and water and natural calamities => trade
Wheat and rice yields will drop=> less exports and more imports
Food security (Availability, Accessibility, Affordability, Acceptability)
Trade => Availability ; Not accessibility and affordability; Food from regional sources more acceptable
Accessibility is a national issue but SAARC Food Bank will complement national efforts
Agricultural trade is linked with livelihood and food security and needs to be approached with caution
Lack of comparative advantage, diversity and complementarity are important barriers
Supply side constraints are also important
Tariff and non-tariff barriers could be less important
o Most countries are net importers
o Intra-regional trade is higher for agricultural goods compared to overall trade
India-Sri Lanka FTA was helpful but could not be generalized as SL was the only other country with surplus
In climate change scenario trade and agricultural goods/food can play limited role in food security

12/25/2012
15