Embed Size (px)
Citation preview

PowerLogic PM1000 Series Power Meters User manual
PLSED309039EN
08/2010

2 © 2010 Schneider Electric. All rights reserved.

© 2010 Schneider Electric. All rights reserved. 3
Hazard Categories and Special Symbols Read these instructions carefully and look at the equipment to become
familiar with the device before trying to install, operate, service or maintain it.
The following special messages may appear throughout this manual or on the
equipment to warn of potential hazards or to call attention to information that
clarifies or simplifies a procedure.
SAFETY SYMBOLS
The addition of either symbol to a ―Danger‖ or ―Warning‖ safety label indicates
that an electrical hazard exists which will result in personal injury if the
instructions are not followed.
This is the safety alert symbol. It is used to alert you to potential personal
injury hazards. Obey all safety messages that follow this symbol to avoid
possible injury or death.
SAFETY MESSAGES
DANGER indicates an imminently hazardous situation which, if not avoided, will
result in death or serious injury.
WARNING indicates a potentially hazardous situation which, if not avoided, can
result in death or serious injury.
CAUTION indicates a potentially hazardous situation which, if not avoided, can
result in minor or moderate injury.
CAUTION used without the safety alert symbol, indicates a potentially hazardous
situation which, if not avoided, can result in property damage.
OTHER SYMBOLS
This symbol indicates direct and alternating currents
This is double insulation symbol which indicates that, the user-accessible area
is protected throughout by double insulation or reinforced insulation.

4 © 2010 Schneider Electric. All rights reserved.
PLEASE NOTE
Electrical equipment should be installed, operated, serviced, and maintained only by qualified personnel. No responsibility is assumed by Schneider Electric for any consequences arising out of the use of this material.
REACH Compliance
Complies with Regulation (EC) n° 1907/2006 of Dec 18 2006 named REACH (related to the Registration, Evaluation, Authorization and restrictions applicable to Chemical substances)
FCC Notices
This equipment has been tested and found to comply with the limits for a class A digital device, pursuant to Part 15 of the FCC Rules. These limits are designed to provide reasonable protection against harmful interference when the equipment is operated in a commercial environment. This equipment generates, uses, and can radiate radio frequency energy and, if not installed and used in accordance with the instruction manual, may cause harmful interference to radio communications. Operation of this equipment in a residential area is likely to cause harmful interference in which case the user will be required to correct the interference at his own expense.
This class A digital apparatus complies with Canadian ICES-003.
Modifications: Modifications to this device which are not approved by Schneider Electric may void the authority granted to the user by the FCC to operate this equipment.

PLSED309039EN PM1000 Series Power Meters 08/2010 Table of contents
© 2010 Schneider Electric. All rights reserved. 5
Chapter 1 – PM1000 Series Power Meters Product Description .................................................................... 7
Physical Description .......................................................................................................................................... 7 Front Panel...................................................................................................................................................... 8
Eight-segment LED display .......................................................................................................................... 8 Analog Load Bar .......................................................................................................................................... 8 The Indicators – Kilo, Mega, and Negative .................................................................................................. 9 Smart Keys .................................................................................................................................................10 Keypad Operation ......................................................................................................................................11 Auto-scroll ..................................................................................................................................................12 Default Display (View) Page ......................................................................................................................12
Rear Panel ....................................................................................................................................................13 Parameters with PM1000 Series Power Meters ..............................................................................................14 PM1000 Series Power Meters Technical Specification ...................................................................................16
Chapter 2: Quick Start Guide ..........................................................................................................................17
PROG Menu — Setup .....................................................................................................................................17 Quick setup – While powering ON ................................................................................................................17 Enter Setup Menu in View (Read-Only) Mode ..............................................................................................19 Enter Setup Menu in Edit Mode ....................................................................................................................19 Setup Parameters in View and Edit Modes ..................................................................................................20 Edit Set Parameters in PROG Menu ............................................................................................................21
Edit and Accept Setup ...............................................................................................................................21 Save the New Value to Setup ....................................................................................................................22
Clear INTG and MD ......................................................................................................................................23 Energy Integrator .............................................................................................................................................25
Integrator Overflow .......................................................................................................................................25 OLD Data Register .....................................................................................................................................25
Demand Power Calculation Methods ..............................................................................................................26 Auto (sliding block) .....................................................................................................................................26 User (fixed block) .......................................................................................................................................26
PM1000 Series Power Meters Menu Hierarchy ..............................................................................................27
Chapter 3: AC Power Measurement ................................................................................................................31
3-Phase Systems .............................................................................................................................................31 Consumption and Poor Power Factor .............................................................................................................32 ―3D‖ kVA Measurement ...................................................................................................................................32
Chapter 4: Safety Precautions ........................................................................................................................33
CHAPTER 5: Installation ..................................................................................................................................35
Mechanical Installation ....................................................................................................................................35 Installation Procedure ...................................................................................................................................36
Usage .........................................................................................................................................................36 Panel Considerations and Environment ....................................................................................................36 Viewing .......................................................................................................................................................36 Mounting ....................................................................................................................................................37
Electrical Installation ........................................................................................................................................38 Auxiliary Supply (Control Power) ..................................................................................................................39 PTs (VTs) and CTs .......................................................................................................................................39
PT (VT), CT Wiring.....................................................................................................................................39 Voltage Signal Connections ..........................................................................................................................40
PT Connections..........................................................................................................................................40 Selecting the voltage fuses ........................................................................................................................40
Current Signal Connections ..........................................................................................................................40 CT Connections .........................................................................................................................................41 CT Polarity .................................................................................................................................................41 CT Connection Reversal ............................................................................................................................41
Setup — System Type ..................................................................................................................................42 Phase Labels ................................................................................................................................................43 Connection Diagrams ...................................................................................................................................43

PM1000 Series Power Meters PLSED309039EN Table of contents 08/2010
6 © 2010 Schneider Electric. All rights reserved.
Connection Diagram Symbols ...................................................................................................................43 3-phase 4-wire WYE connection with three CTs and three PTs ...............................................................43 3-phase 3-wire delta connection with two CTs and three PTs ..................................................................44 3-phase 3-wire open delta connection with two CTs and two PTs ............................................................44 Figure 5-5: 3-phase 3-wire open delta connection ....................................................................................44 2-phase 3-wire connection with two CTs ...................................................................................................45 Single-phase connection with 1 CT ...........................................................................................................45
Chapter 6: Data Communication .....................................................................................................................47
RS 485 Data Port .............................................................................................................................................47 Installation ........................................................................................................................................................47 Communication Capabilities ............................................................................................................................48 Daisy-chaining Devices to the Power Meter ....................................................................................................48 Data Formats and Settings ..............................................................................................................................49
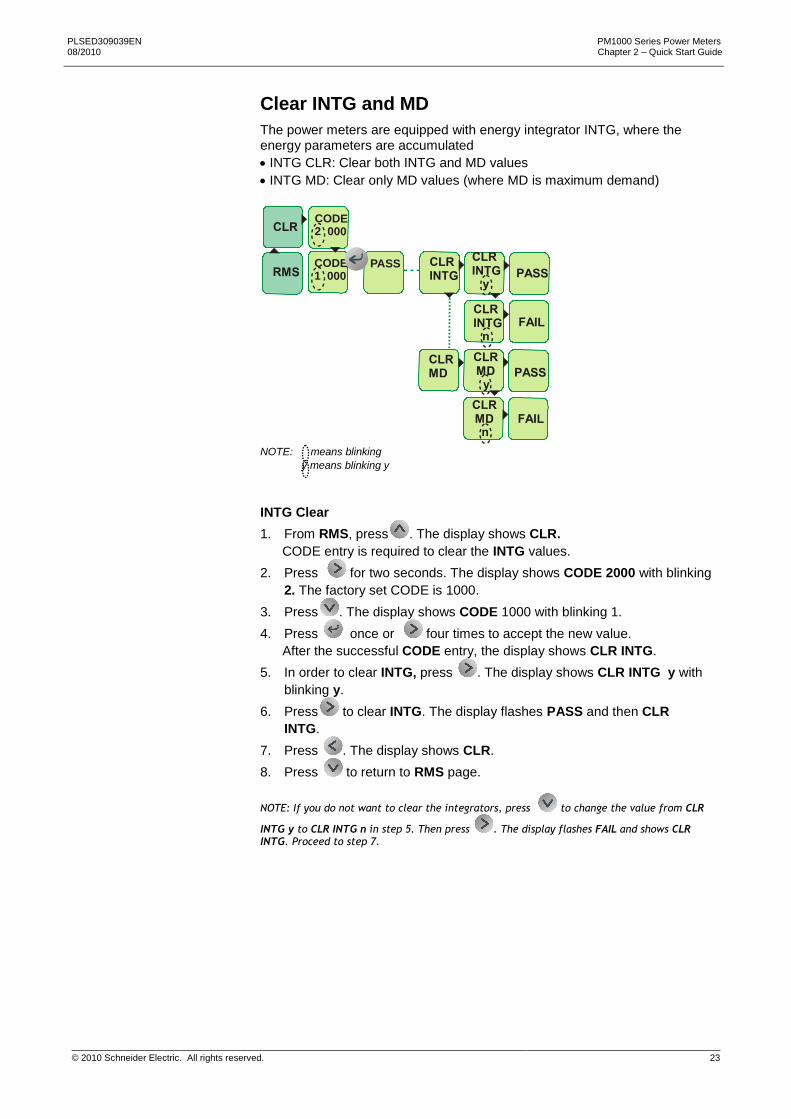
Parameter Settings for Different SCADA Software.......................................................................................50 Communication Test .....................................................................................................................................51 Data Address ................................................................................................................................................53
Individual Parameter Address ....................................................................................................................53 Block Parameter Address ..........................................................................................................................55
Chapter 7: Maintenance and Troubleshooting ..............................................................................................67
Introduction ......................................................................................................................................................67 Troubleshooting ...............................................................................................................................................68
Appendix A – Technical Data ..........................................................................................................................71
Accuracy ..........................................................................................................................................................71 Auxiliary supply (Control power) ......................................................................................................................71 Front Panel Display .........................................................................................................................................71 Installation and Input Ratings ..........................................................................................................................72 Environmental Conditions ................................................................................................................................72 Construction .....................................................................................................................................................72
Dimensions and Shipping .............................................................................................................................72
Appendix B: SIM (simulation) Mode ...............................................................................................................73
Appendix C: Glossary ......................................................................................................................................75
Terms ............................................................................................................................................................75 Abbreviations ................................................................................................................................................77
INDEX .................................................................................................................................................................79

PLSED309039EN PM1000 Series Power Meters 08/2010 Chapter 1 – PM1000 Series Power Meters Product Description
© 2010 Schneider Electric. All rights reserved. 7
Chapter 1 – PM1000 Series Power Meters
Product Description
The PM1000 series power meters are digital power meters that offer comprehensive 3-phase electrical instrumentation and load management facilities in a compact and rugged package.
This chapter contains the main operating instructions. The remaining chapters explain the installation and set up steps, before the meter is ready for use, and maintenance and troubleshooting procedures for the power meter after installation.
The PM1000 series power meter is an universal power meter. Before use, please program the SYS (measurement system configuration) and the PT (VT) and CT ratios through the front panel keys. Otherwise, it will read your system incorrectly. Other settings, such as communication parameters, must also be programmed as needed.
Schneider Electric stands behind your PM1000 power meters with complete user support and service.
Intended use: PM1000 series power meter is designed for use in industrial and commercial installations by trained and qualified professionals, not for domestic use.
Physical Description
FRONT: The front panel has three rows of four digits/characters each, with auto scaling kilo (K), Mega (M), and minus (-) indications. The K and M indicators lit together to show Giga readings. The load bar graph to the right of the display gives the indication of consumption in terms of the % amperes load with respect to the FS (full scale) selected. Five smart keys make navigating the parameters very quick and intuitive for viewing data and configuring the power meter.
REAR: The voltage and current terminals and the communication port are located on the back of the power meter. Refer to ―Rear Panel‖ on page 13 for more information.

PM1000 Series Power Meters PLSED309039EN Chapter 1 – PM1000 Series Power Meters Product Description 08/2010
8 © 2010 Schneider Electric. All rights reserved.
Front Panel
The front panel contains the following indicators and controls:
Three rows of alphanumeric displays, four digits each, display three RMS parameters simultaneously or one energy parameter. The displayed readings update every second.
For each row: Kilo, Mega (Kilo + Mega = Giga) indicator, and a Negative (-) indicator.
Load bar, which gives a unique analog indication of % loading (% FS CT Pri).
Five keys to scroll through the display page.
Figure 1-1: Parts of PM1000 series front panel
Eight-segment LED display
The power meter solves the problem of tiny cluttered indicators by prominently displaying the parameter name right on the large, alphanumeric readouts.
For the first time in a panel meter, the parameter name is as clearly readable as the value.
In order to know which parameter value is currently displayed, the power meter displays the parameter name for two seconds, as well as each time you press a key, and then the value for eight seconds.
This method also allows programmable phase soft-Labels in the power meters. You can choose from 123 (factory setting), ABC, RYB, PQR or RST.
Analog Load Bar
Unique indication of total load % with respect to the full scale through the 12 LEDs at the right side of the display.
This is bar graph, where each LED indicates 10% of load.
To find the total load, count the number of illuminated LEDs, and then multiply by 10.
Table 1-1: Load percentage and bar graph indication
Load percentage
Bar graph display
Less than 10%
No LEDs are lit.
Between 10 to 40 %
Amber LEDs are lit.
Between 50 to 80%
Green LEDs are lit to indicate that the load is acceptable and should not increase further.
Above 80% Red LEDs are lit to indicate that the load has exceeded the sanctioned limit and is dangerous.
Gig
aG
iga
Gig
a
L1
L2
L3
™PowerLogic
PM1200
%A FS
Eight-segment LED display
Analog load bar
Indicators
Keys

PLSED309039EN PM1000 Series Power Meters 08/2010 Chapter 1 – PM1000 Series Power Meters Product Description
© 2010 Schneider Electric. All rights reserved. 9
The Indicators – Kilo, Mega, and Negative
Table 1-2 Indicators
Kilo: When lit, indicates that the reading is in Kilo (103). 10,000 is displayed
as 10.00 K and 1.0 K as 1000.
Mega: When lit, indicates that the reading is in Mega, (106). 10,000 K is
shown as 10.00 M. and 1.0 M as 1000 K.
Giga: When Kilo and Mega are lit together, the reading is in Giga (109).
10,000 M is shown as 10.00 G and 1.0 G as 1000 M.
Negative: When lit, indicates that the reading is negative as per IEEE 100 and industry standard practice by meter-men:
When PF (power factor) is lead (capacitive load): Both PF and VAR (reactive power) sign will be negative. When current is reversed: W (active power) is negative.
Table 1-3: Giga, Mega (M), Kilo (K), and decimal point scaling
RMS readings are four digits. Energy readings have eight digits, including four additional fractional digits. The maximum number the power meter handles is 9,999 G for RMS and energy values.
This means that the energy readings of the power meter will overflow at three values of Wh (active energy) or VAh (Apparent energy) (selectable through PROG menu - setup) depending upon the PT (VT) and CT ratios programmed.
RMS Reading Indicator
Less than 0.001 K, M OFF, displays 0.000
Less than 9999 K, M OFF
Above 9999 K ON, M OFF
Above 9999 K M ON, K OFF
Above 9999 M Giga (k + M indicators ON)
Up to 9999 G Giga
Above 9999 G Display shows Hi for positive numbers, Lo for negative numbers

PM1000 Series Power Meters PLSED309039EN Chapter 1 – PM1000 Series Power Meters Product Description 08/2010
10 © 2010 Schneider Electric. All rights reserved.
Smart Keys
Operating the power meter is easy, using the five smart keys to navigate through the keypad operations Table. The display pages expand as you go to the right, much like the directory or explorer tree displayed on any computer. The display shows where you’re headed.
Table 1-4: Smart keys description
Right Key
Go forward into sub-parameter pages.
Going right past EDIT in SET and CLR requires code entry to enter PROG menu (setup and clear)
During setup, select next (right side) digit.
Left Key:
Go back towards to the main parameter pages.
During edit setup, selects previous (left side) digit
Exits from Edit mode, back to the PROG menu – setup.
The meter enters the SIM (simulation) mode when you press the left key continuously during powerup of the power meter. See ―SIM (Simulation) mode‖ on page 73 for more information.
Up Key:
Scroll up through display pages at the same level, within the same function.
Continuous pressing for three seconds initiates limited auto-scroll (within the same function). See ―Auto-scroll‖ on page 12 for more information.
While editing, increases the value of the blinking digit during edit.
Down Key:
Scroll down through other display pages at the same level, through all functions.
Continuous pressing for three seconds initiates the full auto-scroll mode, through all functions. See ―Auto-scroll‖ on page 12 for more information.
While editing, decreases the value of the blinking digit.
TURBO Key:
TURBO key is simple one touch access to the most commonly used parameters pages (Factory set). The TURBO pages for PM1000 series are given below.
RMS (home page), VLL, A, PF VLN, A, F VA, W, PF VA, W,VAR W, VAR, PF PF1, PF2, PF3, V% 1 2 3, A % 1 2 3, VAd RD TR, MD HR, VAh, Wh, RVAh, RWh, tVAh, tWh. This gives simple one-touch access to the most commonly used parameters, even for unskilled operators.
If you’re lost, the TURBO key is a quick way to get back to the RMS home page.
Continuous pressing for three seconds initiates auto scrolling through the above TURBO pages. See ―Auto-scroll‖ on page 12 for more information.
During the powerup, if the TURBO key is pressed, power meter will go in to PROG menu – Setup directly. This is the easiest way to enter in to the setup menu.
See ―Quick setup – While powering on‖ on page 17 for more information.

PLSED309039EN PM1000 Series Power Meters 08/2010 Chapter 1 – PM1000 Series Power Meters Product Description
© 2010 Schneider Electric. All rights reserved. 11
Keypad Operation Navigating with the power meter is very easy and intuitive. Press the key in the direction you want to go. The display shows where you’re headed. Press the key that takes you in the desired direction.
Follow these simple steps:
First take a quick look at what the keys do.
The following example explains how you can navigate from the RMS page to the VLN A F page, back to RMS in the power meters.
1. From the RMS page, press . The display shows VLL A
PF
2. Now press .The display shows VLN
A
F
3. To return to RMS, press .The display shows RMS.
Using the left key, you can go back towards to the main parameter pages from the sub-parameter pages.
Now, try getting around to other parameters, by moving up, down, right, and left. The readings are organized as display pages to the right of RMS and INTG.
The Kilo, Mega, and Negative Indicators are automatic. Kilo and Mega light up together to show Giga. See ―The indicators‖ on page 9 for more
information.
You cannot go right into CLR, to clear INTG and MD values, unless you enter a code.
Going right through SET, you can go down to VIEW or EDIT. Going right through EDIT requires code entry to program these power meter settings.
When done:
Go Left all the way back to SET.
Go down to CLR.
Go Right into RMS to view the display pages again.
VLL
A
PF
V12
23
31
VLN
A
F
RMS
Navigation Concept

PM1000 Series Power Meters PLSED309039EN Chapter 1 – PM1000 Series Power Meters Product Description 08/2010
12 © 2010 Schneider Electric. All rights reserved.
Auto-scroll
Auto-scroll allows you to monitor a group of display pages sequentially, every five seconds, without constant key pressing. This is convenient for viewing from a distance. The power meter shows the parameter name (one second) followed by the value (four seconds) on the same large displays.
To auto-scroll within a page group (e.g., Within RMS group)
Go to a particular page in the desired page group. Press continuously for three seconds and then release. The display flashes AUTO and starts auto-scroll within the page group.
To auto-scroll down the entire column of pages
Go to the desired page. Press continuously for three seconds and then release. The display flashes AUTO and starts auto-scroll down the entire column of pages.
To auto-scroll through TURBO pages
Press of continuously for three seconds and then release. The display flashes AUTO and starts auto-scroll through the TURBO pages.
NOTE:
Press any key to revert to manual scrolling.
Auto scrolling is not possible in the setup parameters.
Default Display (View) Page
You can select any page as user-set default display page. You can scroll to other display pages. The user-set page is displayed two minutes after
manual scrolling was stopped by the user.
To lock the user-set default page:
Go to the page you want to set as default page.
Press and simultaneously to lock the page. The power meter displays LOCK.
To unlock the user-set default page:
Once default display page is active, press and simultaneously to
unlock the key page. The power meter displays ULOC.
NOTE: Entry into setup (PROG) is allowed only when the display page is unlocked.

PLSED309039EN PM1000 Series Power Meters 08/2010 Chapter 1 – PM1000 Series Power Meters Product Description
© 2010 Schneider Electric. All rights reserved. 13
Rear Panel
The power meter terminals are located on the rear panel. 14 terminals are provided, seven terminals on each side:
Six terminals for current, one in and one out per phase
Four terminals for voltage, for three phases and neutral
Two terminals for auxiliary power supply (control power)
Two terminals for the RS 485 communication port (PM1200)
Figure 1-2: Rear panel
Warranty void if this label is tampered with
Made in India
D-D
-IE
RS
485-
THM
Opt
ion
List
:V
ER
:03.
04.0
0
mA
to6A
50
S/ N
: CO
YY
WW
DX
XX
XA
ccC
l:1.
0 80to
480
Vac
LL44
to2
7V
50/6
0H
z<
5V
A
RS 485
HAZARD OF ELECTRIC SHOCK, EXPLOSION OR ARC FLASHRIESGO DE DESCARGA ELECTRICA, EXPLOSION O DESTELLO DE ARCORISQUE D ELECTROCUTION, D EXPLOSION OU D ARC ELECTRIQUE
Input current terminals A1, A2, A3
Input Voltage terminals V1, V2, V3, VN
Auxiliary supply (Control power)terminals
RS 485 Communicationterminals (PM1200)

PM1000 Series Power Meters PLSED309039EN Chapter 1 – PM1000 Series Power Meters Product Description 08/2010
14 © 2010 Schneider Electric. All rights reserved.
Parameters with PM1000 Series Power Meters
The power meter can measure, locally display and remotely transfer over Modbus RTU (PM1200), the following parameters:
Table 1-5: Models and parameters with PM1000 series
Parameter PM1000 PM1200
RMS VLL V12, V23, V31
VLN V1, V2, V3
A A1 A2 A3
An - Neutral current
F
%L – Amps
% V Unbal, % A Unbal
PF PF1 PF2 PF3
%A FS
Analog color-coded load bar
RPM
Aº Phase Angle
Aº1 A
º2 A
º3
W W1 W2 W3
VA VA1 VA2 VA3
VAR VAR1 VAR2 VAR3
THD V%1 V%2 V%3
A%1 A%2 A%3
DM Demand VA/ W/ A
Rising demand
Time remaining
MD Maximum demand
Hr MD occurred
INTG FWD
Wh
VAh
VARh
-VARh
Run hours
ON hours
INTR
INTG REV
R.Wh
R.VAh
R.VARh
-R.VARh
Run hours
ON hours
INTG TOT
t.Wh
t.VAh
t.VAR
-t.VAR
t.Run
On.h
INTR
OLD FWD
Wh
VAh
VARh
-VARh
Run hours

PLSED309039EN PM1000 Series Power Meters 08/2010 Chapter 1 – PM1000 Series Power Meters Product Description
© 2010 Schneider Electric. All rights reserved. 15
Parameter PM1000 PM1200
OLD
REV
R.Wh
R.VAh
R.VARh
-R.VARh
Run hours
OLD
TOT t.Wh
t.VAh
t.VAR
-t.VAR
t.Run
RS 485 -
NOTE:
FWD: Forward indicating the import of power into the plant/grid
REV: Reverse indicating the export of power from the plant/grid
The PM1000 series displays:
Voltage: Three voltage measurements line-to-line: 1-2, 2-3, 3-1, and average, Three voltage measurements line-to-neutral: 1-4, 2-4, 3-4, and average.
Current: Three current measurements phase-wise (1, 2, 3), average current of all three phases, neutral current, and three current phase angles
(A1, A2, A3) with respect to the corresponding voltage line-neutral vector.
Phase wise load in %: Three currents in % of the FS (%A FS).
Unbalanced load in %: Current and voltage unbalance.
Frequency: Measures from whichever phase is active.
RPM: Measures the speed of the generator.
Power: VA, W, VAR, per phase and total. PF per phase and average. Per-Phase W readings provide a quick CT Polarity Check. A negated W phase reading indicates CT reversal.
Energy: VAh, Wh, +VARh (Ind), -VARh (Cap), Run hours, On Hrs, supply
interruptions (outage).
Energy (OLD): VAh, Wh, +VARh (Ind), -VARh (Cap), Run hours.
% Amperes load bar graph: Load bar graph indicates consumption in terms of %Amperes total. You can quickly estimate the load by viewing the display without operating any keys. The bar graph consists of 12 segments. Each segment indicates a current load of 10% of CT primary.
Kilo, Mega, Giga indication for the above parameters. See ―The indicators‖ on page 9 for more information.

PM1000 Series Power Meters PLSED309039EN Chapter 1 – PM1000 Series Power Meters Product Description 08/2010
16 © 2010 Schneider Electric. All rights reserved.
PM1000 Series Power Meters Technical Specification
The PM1000 series is a high-accuracy, low cost, ultra-compact, power, and energy meter series. It offers ISO 9001 quality, accuracy and functional flexibility. Selective models of this series have Modbus RTU communications capability. The standard unit flush-mounts in a DIN 96 cutout and conforms to UL product standards.
The power meters are designed for retrofit applications such as replacement of analog meters. Each can be used as standalone meter in electrical control panels, power distribution unit (PDU), switch boards, uninterrupted power supply (UPS), generator sets, and motor control center (MCC) systems. It also provides easy communication to program logic control (PLC), distributed control system (DCS), building management system (BMS), and other systems.
The following table gives the technical specifications of the power meters. Refer to ―Technical data‖ on page 71 for more information.
Table 1-6: Technical specifications
Description Specification
Sensing/Measurement True RMS, one second update time, four quadrant power and energy
Accuracy 1.0% of reading*
Auxiliary supply
(Control power)
44 to 277 VAC/DC
Burden Voltage and current input < 0.2 VA per phase
Auxiliary supply (Control power) < 3 VA at 240 V
Display Alphanumeric bright LED
Resolution RMS four digits, INTG eight digits
Input voltage Four voltage inputs (V1, V2, V3, VN) 110 or 415 VACLL
nominal (Range 80 to 480 VAC LL)
Input current
(Energy measurement)
Current inputs (A1, A2, A3)
Class 1.0: 50 mA to 6 A* (5 mA is the starting)
Frequency 45 to 65 Hz
Overload 10 A max continuous
Environmental Operating temperature: -10 C to 60 C (14 F to 140 F)
Storage temperature: -25 C to +70 C (-13 F to 158 F)
Humidity 5% to 95% non condensing
Standard - Measurement category III,
Pollution Degree 2,
- Double insulation at user-accessible area
Weight 400 gms (0.9 lb) approx, unpacked
500 gms (1.1 lb) approx, shipping
Communication (PM1200)
RS 485 serial channel connection Industry standard Modbus RTU protocol
PM1000 Series conforms to
Emission : CISPR11 class A; Fast Transient: 4kV IEC 61000-4-4; Surge withstand: IEC 61000-4-5;
Damped Oscillatory: IEC 61000-4-12; ESD: IEC 61000-4- 2;
Impulse voltage: 6 kV, IEC 60060, 1.2/50 µs Protection against dust and water
Front – IP 51; Back – IP 40
NOTE: * Additional error of 0.05% of full scale, for power meter input current below 100 mA

PLSED309039EN PM1000 Series Power Meters 08/2010 Chapter 2 – Quick Start Guide
© 2010 Schneider Electric. All rights reserved. 17
Chapter 2: Quick Start Guide
PROG Menu — Setup
The power meter must be configured to match the application settings, before use. Otherwise, the readings will be wrong.
All the setup values can be re-programmed at any time, using SET However, the settings: SYS (WYE (Star)/Delta/single-phase / 2-Phase), Vpri, Vsec, Apri, Asec critically determine the scaling of measured readings.
The scaling may be used to reduce the errors in readings due to Instrument Transformer errors. However, wrong settings will introduce errors in readings of other running systems.
HAZARD OF UNINTENDED OPERATION
Only qualified personnel are authorized to set up the power meter.
Failure to follow these instructions can result in injury or equipment
damage.
You can enter the PROG menu - setup in
View only mode: To view the set parameters.
Edit mode: To view or edit set parameters.
Quick setup – While powering ON
This is the easiest way to enter the PROG menu setup.
To make connections, see ―Connection diagrams‖ on page 43. Here are few tips.
Figure 2-1: Quick setup - connections
RS 485Only for PM1200
4
2 3
1
Use CT1
Use PT1
Use PT2
Use PT3
Use CT2
Use CT3

PM1000 Series Power Meters PLSED309039EN Chapter 2 – Quick Start Guide 08/2010
18 © 2010 Schneider Electric. All rights reserved.
1. Connect auxiliary supply (control Power) 44 – 277 VAC/DC to terminals 12 and 13 in order to power ON the power meter.
Keep pressed for two seconds, while powering up the power meter. The power meter directly enters into PROG menu setup and displays EDIT A.PRI 100.0.
Program the following setup parameters for accurate readings:
A.pri, A.sec: Set these values to match your CT primary and secondary values. For example, if your CT Ratio is 200:5, set A.pri = 200.0 and A.sec = 5.000.
V.pri, V.sec
Set these values to match the input voltage VLL of circuit, if the input voltage < 480 VAC LL. For example, if input voltage = 300 VAC LL, set V.pri = 300.0 and V.sec = 300.0.
Use potential transformer (PT/VT), if the input voltage > 480 VAC
LL. Set the V.pri and V.sec values to match the primary and
secondary of the PT(VT) respectively. For example, if PT(VT) ratio is 11 kV: 110, set V.pri = 11.00 k and V.sec = 110.0.
Select one of the following systems according to your wiring configuration:
SYS: DLTA for 3-phase 3-wire system
SYS: WYE/Star for 3-phase 4-wire system
SYS: 2-phase for 2-phase 3-wire system
SYS: single-phase for single-phase 2-wire system
2. Connect the current transformers (CTs).
3. Connect the voltage inputs. Use PT(VT), if voltage exceeds 480 VAC LL.
4. RS 485 terminals (PM1200)
CT1 CT2 CT3
1, 2 3, 4 5, 6
PT1 PT2 PT3 Neutral
8 9 10 11
+ve -ve
7 14

PLSED309039EN PM1000 Series Power Meters 08/2010 Chapter 2 – Quick Start Guide
© 2010 Schneider Electric. All rights reserved. 19
Enter Setup Menu in View (Read-Only) Mode
1. From RMS, press . The display shows CLR.
2. Press . The display shows SET.
3. Press . The display shows VIEW.
4. Press . Use and to scroll and view the setup parameters and their current settings.
Enter Setup Menu in Edit Mode
NOTE: means blinking
2 Means blinking 2
1. From RMS, press . The display shows CLR.
2. Press . The display shows SET.
3. Press . The display shows VIEW.
4. Press . The display shows EDIT. CODE entry is required to enter the setup menu in edit mode.
5. Press for two seconds. The display shows CODE 2000 with 2 blinking The factory set code is 1000.
6. Press . The display shows CODE 1000 with 1 blinking.
7. Press once or four times to accept the new CODE value. The display shows PASS and then EDIT A.PRI 100.0 indicating the
successful entry to the setup menu in edit mode.
NOTE: If you enter a wrong code, the display flashes FAIL, and then displays EDIT. Repeat the
procedure and make sure that you enter correct code.
RMS
CLR
SET VIEWVIEW
A.PRI
100.0
PASSEDITA.PRI100.0
CODE
1 000
CODE
2 000EDITCLR
RMS
SET VIEW

PM1000 Series Power Meters PLSED309039EN Chapter 2 – Quick Start Guide 08/2010
20 © 2010 Schneider Electric. All rights reserved.
Setup Parameters in View and Edit Modes
NOTE: Default setup values are given in BOLD.
* Changing these values while device is in use is not recommended.
BAUD, PRTY, and ID are applicable only for PM1200.
VIEW
VIEW
MODE
A.PRI
100.0
VIEW
A.SEC
5.000
VIEW
V.PRI
415.0
VIEW
V.SEC
415.0
VIEW
SYS
STAR
VIEW
LABL
123
VIEW
BAUD
9600
VIEW
PRTY
EVn1
VIEW
ID
1.000
VIEW
F.S%
100.0
VIEW
OFLO
Wh
VIEW
POLE
4.000
VIEW
VA.Fn
3D
VIEW
d.SEL
AUTO
VIEW
d.PAR
VA
VIEW
d.PRD
15.00
EDIT
EDIT
MODE
A.PRI
100.0
EDIT
A.SEC
5.000
EDIT
V.PRI
415.0
EDIT
V.SEC
415.0
EDIT
SYS
STAR
EDIT
LABL
123
EDIT
BAUD
9600
EDIT
PRTY
EVn1
EDIT
ID
1.000
EDIT
F.S%
100.0
EDIT
OFLO
Wh
EDIT
POLE
4.000
EDIT
VA.Fn
3D
EDIT
d.SEL
AUTO
EDIT
d.PAR
VA
EDIT
d.PRD
15.00
A.PRI= Current primary winding (CT)*
SYS= Power system's configuration*Select from: , DELTA, 2-phase, single-phase, STAR
V.PRI= Voltage primary winding (PT), line-line*
Input range: 100 V to 999 kV (415.0)
V.SEC= Voltage secondary winding (PT), line-line*
Input range: 80 V to 480 V (415.0)
Input range: 1 A to 99 kA (100.0)
A.SEC= Current secondary winding (CT) (5.000)
LABL= Phase labeling
Select from: 123, RYB, RST, PQR, ABC
VA.FN= VA function selection*
Set the VA function to: 3D, ARTH
F.S%= Full scale %
Set the full scale between 1 to 100 1
POLE = Number of poles for RPM
Select from: 2, 4, 6, 8, 10, 12, 14, 16
BAUD= Baud rate
ID = RS 485 Device ID number:001 to 247.
(Evn.1 = Even.1 stop bit)
PRTY= Parity & Stop bit settings:EVN.1 , EVN.2, ODD.1,
ODD.2, no.1, no.2
OFLO = Overflow parameter selection: Wh, VAh; INTG
clears when 9999 Run hours (almost 13.88 months)
d.SEL = Demand Selection*
d.PAR = Demand Parameter*
d.PRD = Demand Period
Select from: , userauto
Select from: , W, AVA
Select from: 5, 10, , 20, 25, 3015
Select from: 1200, 2400, 4800, , 192009600
WYE
PLSED309039EN PM1000 Series Power Meters 08/2010 Chapter 2 – Quick Start Guide
© 2010 Schneider Electric. All rights reserved. 21
Edit Set Parameters in PROG Menu
This example explains how to edit the value of A.SEC from 5.000 to 1.000 in PROG menu setup of the power meter. For easy understanding, setup parameter editing is explained two parts: edit and accept setup, and to save the new value in the setup.
NOTE: After entering into setup, when there is no key press for > 2 min, the power meter will exit from the setup automatically.
Edit and Accept Setup
NOTE: means blinking
2 Means blinking 2
1. After you have successfully entered setup menu in edit mode, (Refer to
―Enter setup menu in Edit mode‖ on page 19 for more information) press
. The display shows EDIT A.SEC 5.000.
2. Press . The display shows EDIT A.SEC 5.000 with blinking 5. The
value can be edited.
3. Press four times. The display shows EDIT A.SEC 1.000 with blinking
1.
4. Press to accept the new value.
To edit the next parameter, press and repeat the above steps.
EDIT
A.PRI
100.0
EDIT EDIT
EDIT EDIT
A.SEC A.SEC
A.SEC A.SEC
5.000 5. 000
1. 000 1.000
SET
RMS
CLR
VIEW
EDIT CODE2 000
CODE1 000 PASS

PM1000 Series Power Meters PLSED309039EN Chapter 2 – Quick Start Guide 08/2010
22 © 2010 Schneider Electric. All rights reserved.
Save the New Value to Setup
NOTE: means blinking
y means blinking y
1. After you edit the parameter as described above, press . The display
shows SAVE y with blinking y.
2. Press or to save the new value. The display flashes PASS and then shows EDIT.
3. Press to return to SET.
NOTE: If you do not want to save the new value, press to change the value from SAVE y to
SAVE n in step 1. Then press or . The display flashes FAIL and shows EDIT. Proceed
to step 3.
1.000 A.SEC
PLSED309039EN PM1000 Series Power Meters 08/2010 Chapter 2 – Quick Start Guide
© 2010 Schneider Electric. All rights reserved. 23
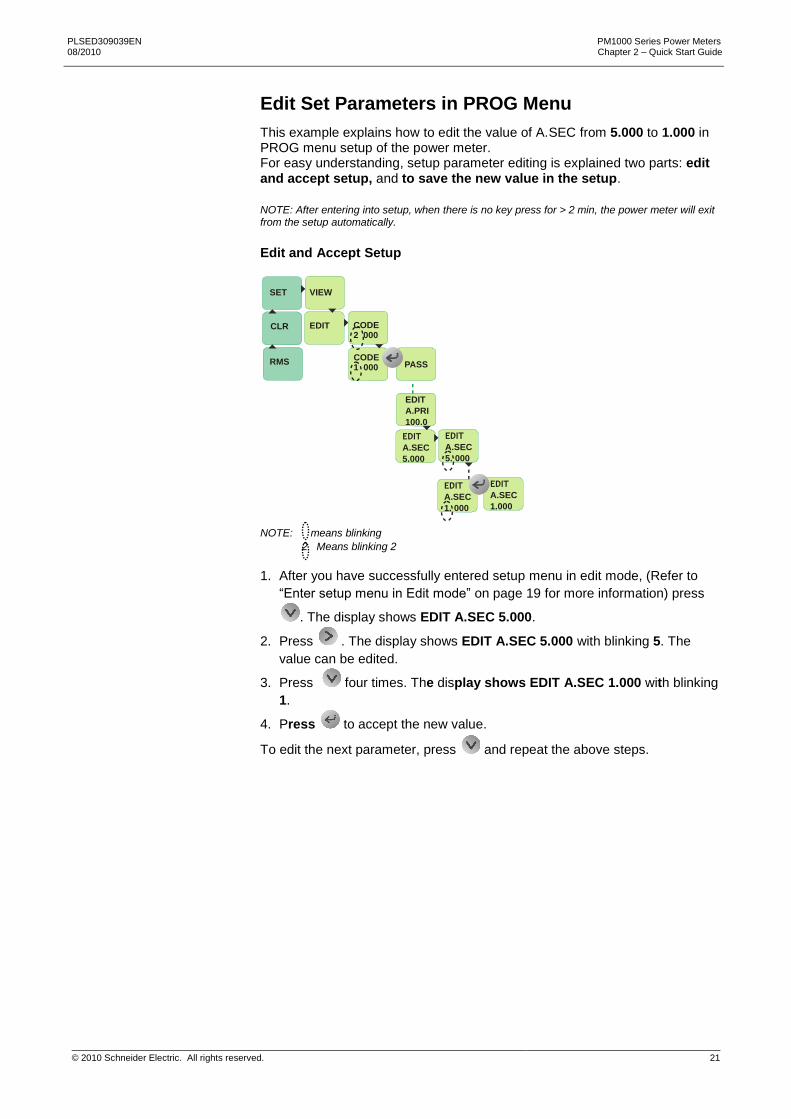
Clear INTG and MD
The power meters are equipped with energy integrator INTG, where the energy parameters are accumulated
INTG CLR: Clear both INTG and MD values
INTG MD: Clear only MD values (where MD is maximum demand)
NOTE: means blinking
y means blinking y
INTG Clear
1. From RMS, press . The display shows CLR.
CODE entry is required to clear the INTG values.
2. Press for two seconds. The display shows CODE 2000 with blinking
2. The factory set CODE is 1000.
3. Press . The display shows CODE 1000 with blinking 1.
4. Press once or four times to accept the new value.
After the successful CODE entry, the display shows CLR INTG.
5. In order to clear INTG, press . The display shows CLR INTG y with
blinking y.
6. Press to clear INTG. The display flashes PASS and then CLR
INTG.
7. Press . The display shows CLR.
8. Press to return to RMS page.
NOTE: If you do not want to clear the integrators, press to change the value from CLR
INTG y to CLR INTG n in step 5. Then press . The display flashes FAIL and shows CLR INTG. Proceed to step 7.
CODE2 000
CODE1 000
PASS

PM1000 Series Power Meters PLSED309039EN Chapter 2 – Quick Start Guide 08/2010
24 © 2010 Schneider Electric. All rights reserved.
MD Clear
1. From RMS, press . The display shows CLR.
CODE entry is required to clear the INTG values.
2. Press for two seconds. The display shows CODE 2000 with blinking
2. The factory set CODE is 1000.
3. Press . The display shows CODE 1000 with blinking 1.
4. Press once or four times to accept the new value.
After the successful CODE entry, the display shows CLR INTG.
5. Press . The display shows CLR MD
6. Press . The display shows CLR MD y with blinking y.
7. Press to clear MD. The display flashes PASS and then CLR MD.
8. Press . The display shows CLR.
9. Press to return to RMS page.
NOTE: If you do not want to clear the maximum demand, press to change the value from
CLR MD y to CLR MD n in step 6. Then press . The display flashes FAIL and shows CLR MD. Proceed to step 8.

PLSED309039EN PM1000 Series Power Meters 08/2010 Chapter 2 – Quick Start Guide
© 2010 Schneider Electric. All rights reserved. 25
Energy Integrator
The PM1000 series power meter is equipped with an energy integrator function. It provides several parameters for Energy Management: VAh, Wh, VARh (Ind), -VARh (Cap), run.h (run hours), on.h (on hours), INTR (Interruptions / outages).
A few of these need explanation:
RUN.h: Indicates the period the load has been ON and has run. This
counter accumulates as long as the load is ON.
On.h: The period for which the power meter (supply) is ON.
INTR: Number of supply outages, means the number of auxiliary supply interruptions. If the power meter auxiliary supply is from a UPS then the INTR (number of interruptions) will be zero (as long as the UPS stays ON), even if the voltage signals die out from time to time.
Integrator Overflow
The PM1000 series power meters contain a comprehensive Integrator to support energy management. It accumulates several parameters over time, as explained above. All values are direct readings and have a high resolution. This is necessary for accurate energy analysis over short intervals of time. It also means that the readings max out and reset sooner or later, as given below. Since the Integrator contains counters for several parameters (VAh, Wh, VARh, -VARh, Run Hours, On Hours, Interruptions), they all reset together when any one of them overflows (usually Wh – but can be changed to VAh via the OF Setup). This makes energy management calculations such as Average PF very easy.
The maximum number that the power meter handles is 9,999 Giga for RMS and energy values. The value at which the power meter overflows is given below.
The overflow value depends on the product of the primary voltage and current rating.
Table 2-1: Integrator overflow
OLD Data Register
The power meters have an OLD data register, where the cleared INTG values will be stored.
The energy values in the integrator are transferred to the OLD register when the INTG is cleared (manually/due to overflow). Thus the OLD energy values are not lost even after the integrator is cleared and can be viewed with the OLD parameter.
The values of parameters Wh, VAh, VARh, -VARh, and Run.h are stored in the OLD register when the INTG is cleared.
V.PRI x A.PRI x 1.732
Max reading
(Wh/VAh)
Max time to reset the integrator in Run Hours
Max time to overflow in months at full scale
1 VA to 1000 VA 9999 k 9999 13.88
1 kVA to 1000 kVA 9999 M 9999 13.88
1 MVA to 1000 MVA
9999 G 9999 13.88
> 1000 MVA <9999 <1 year

PM1000 Series Power Meters PLSED309039EN Chapter 2 – Quick Start Guide 08/2010
26 © 2010 Schneider Electric. All rights reserved.
Demand Power Calculation Methods Demand power is the energy accumulated during a specified period divided by the length of that period. How the power meter performs this calculation depends on the method you select. To be compatible with electric utility billing practices, the power meter provides the following types of demand power calculations:
Auto (sliding block)
User (fixed block)
Auto (sliding block)
In the auto demand power calculation, you select an interval between five and 30 minutes in steps of five minutes. The demand calculation updates every 15 seconds.
Auto demand power calculation is the default calculation for PM1000 series power meters.
User (fixed block)
In the user demand power calculation, you select an interval between five and 30 minutes in steps of five minutes. The demand calculation updates at the end of the interval. User demand power calculation can be selected through setup. See ―Setup parameters in View and Edit modes‖ on page 20 for more information.
15 minute interval 15 minute interval
15
Demand value is the average for the last
completed interval
Time
(Second)
User (Fixed block) demand calculation
15 30 45 60
Calculation updates
every 15 seconds
15 minute interval Demand value is the average for the last
completed interval
Time
(second)
Auto (Sliding block) demand calculation

PLSED309039EN PM1000 Series Power Meters 08/2010 Chapter 2 – Quick Start Guide
© 2010 Schneider Electric. All rights reserved. 27
PM1000 Series Power Meters Menu Hierarchy
An
VA 1 2 3
W 1 2 3
VAR1 2 3
PF 1 2 3
An = Neutral current
RMS
VLLAPF
V 12 23 31
V 1 2 3
A 1 2 3
L%1 2 3
Aº 1 2 3
A.UNBV.UNB RPM
VLNAF
VAWPF
VAWVAR
WVARPF
DMVA VAd
RdTR
MDHR
RMS = RMS value display pages are in sub level
THD = Total Harmonic Distortion
DM VA = VA Demand
VAd = VA demandRd = Rising demandTR = Time remaining
MD = Maximum demandHR = On hours at which maximum demand has occurred
VLL = Phase-Phase voltage average
V 1 = Voltage THD, Phase 10
0
A 1 = Current THD, Phase 10
0
A = Current average
V 2 = Voltage THD, Phase 20
0
A 2 = Current THD, Phase 20
0
PF = Power Factor average
V 3 = Voltage THD, Phase 30
0
A 3 = Current THD, Phase 30
0
VLN = Phase-Neutral voltage averageA = Current averageF = Frequency in Hz
V12 = RMS voltage, phase 12V23 = RMS voltage, phase 23V31 = RMS voltage, phase 31
V1 = RMS voltage phase 1 to neutralV2 = RMS voltage phase 2 to neutralV3 = RMS voltage phase 3 to neutral
A1 = RMS current, phase 1A2 = RMS current, phase 2A3 = RMS current, phase 3
THD V 1 2 3
00
A 1 2 3
00
VA = Apparent power totalW = Active power totalPF = Power factor average
L1% = % of load, phase 1
A.UNB = Current unbalance
VA1 = Volt-amperes, phase 1
VAR1 = VAR, phase 1
PF1 = Power factor, phase 1
W1 = Watts, phase 1
L2% = % of load, phase 2
V.UNB = Voltage unbalance
VA2 = Volt-amperes, phase 2
VAR2 = VAR, phase 2
PF2 = Power factor, phase 2
W2 = Watts, phase 2
L3% = % of load, phase 3
RPM = RPM of the motor
VA3 = Volt-amperes, phase 3
VAR3 = VAR, phase 3
PF3 = Power factor, phase 3
W3 = Watts, phase 3
A°1 = Current phase angle, phase 1 in degreesA°2 = Current phase angle, phase 2 in degreesA°3 = Current phase angle, phase 3 in degrees
1
34

PM1000 Series Power Meters PLSED309039EN Chapter 2 – Quick Start Guide 08/2010
28 © 2010 Schneider Electric. All rights reserved.
VAh
Wh
VARh
-VARh
Run.h
INTG Fwd
INTG Fwd = Forward Integrator
INTG Rev = Reverse Integrator
INTG TOT = Total Integrator
VAh = Fwd Volt-ampere hours
R.VAh = Reverse Volt-ampere hours
t.VAh = Total Volt-ampere hours
Wh = Fwd Watt hours
R.Wh = Reverse Watt hours
t.Wh = Total Watt hours
VARh = Fwd Reactive energy, inductive
R.VAR = Reverse Reactive energy, inductive
t.VAR = Total Reactive energy, inductive
-VARh = Fwd Reactive energy, capacitive
-R.VAR = Reverse Reactive energy, capacitive
-t.VAR = Total Reactive energy, capacitive
Run.h = Fwd Run hours
R.Run = Reverse Run hours
t.Run = Total Run hours
On.h = Duration of supply ON
INTR = Number of power interruptions
1
R.VAh
t.VAh
R.Wh
t.Wh
R.VAR
t.VAR
-R.VAR
-t.VAR
On.h
R.Run
t.Run
INTR
INTG Rev
INTG TOT
2

PLSED309039EN PM1000 Series Power Meters 08/2010 Chapter 2 – Quick Start Guide
© 2010 Schneider Electric. All rights reserved. 29
t.VAh
Dia1
VIEW
t.Wh
Dia2
EDIT
t.VAR
Dia3
-t.VAR
t.Run
OLD
DIAG
SET
CLR
TOT
2
3
4
R.VAh
R.Wh
R.VAR
-R.VAR
R.Run
OLD Rev
VAh
Wh
VARh
-VARh
Run.h
OLD Fwd
OLD TOT = OLD Total Integrator
DIAG = represents diagnostic pages. The values contained in these pages are for factory testing only
SET = Has two modes: EDIT/VIEW set parameters
CLR = Clears INTG and MD values
t.VAh = OLD Total Volt-ampere hours
Dia1 = Communication settings
VIEW = To view simultaneous setup parameter name and value display
Dia2 = Product model and version number
EDIT = To edit simultaneous setup parameter name and value display
Dia3 = Display scanning for display LED check
t.Wh = OLD Total Watt hours
t.VAR = OLD Total Reactive energy, inductive
-t.VAR = OLD Total Reactive energy, capacitive
t.Run = OLD Total Run hours
OLD Rev = OLD Reverse Integrator
R.VAh = OLD Reverse Volt-ampere hours
R.Wh = OLD Reverse Watt hours
R.VAR = OLD Reverse Reactive energy, inductive
-R.VAR = OLD Reverse Reactive energy, capacitive
R.Run = OLD Reverse Run hours
OLD Fwd = OLD Forward Integrator
VAh = OLD Fwd Volt-ampere hours
Wh = OLD Fwd Watt hours
VARh = OLD Fwd Reactive energy, inductive
-VARh = OLD Fwd Reactive energy, capacitive
Run.h = OLD Fwd Run hours

PM1000 Series Power Meters PLSED309039EN Chapter 2 – Quick Start Guide 08/2010
30 © 2010 Schneider Electric. All rights reserved.

PLSED309039EN PM1000 Series Power Meters 08/2010 Chapter 3 – AC Power Measurement
© 2010 Schneider Electric. All rights reserved. 31
Chapter 3: AC Power Measurement
3-Phase Systems
A 3-phase system delivers higher levels of power for industrial and commercial applications. The three phases correspond to three potential lines. A 120° phase shift exists between the three potential lines.
A typical configuration has either a Delta connection or a Wye (Star) connection
In a 3-phase system, the voltage levels between the phases and the neutral are ideally defined by V1 = V2 = V3 = V12 / √3 = V23 / √3 = V31 / √3. In practice, there will be some unbalance (difference).
Voltages between the phases vary, depending on loading factors and the quality of distribution transformers.
Power measurement in a poly-phase system is governed by Blondel's Theorem. Blondel’s Theorem states that, in a power distribution network, which has N conductors, the number of measurement elements required to determine power is N-1. A typical configuration of a poly-phase system has either a Delta connection or a Wye (Star) connection (see Figure below).
Where EAB= Voltage across points A and B
ECB= Voltage across points C and B
EAN= Voltage across points A and N (Neutral)
EBN= Voltage across points B and N (Neutral)
ECN= Voltage across points C and N (Neutral)
IA = Current through conductor A
IB = Current through conductor B
IC = Current through conductor C

PM1000 Series Power Meters PLSED309039EN Chapter 3 – AC Power Measurement 08/2010
32 © 2010 Schneider Electric. All rights reserved.
Consumption and Poor Power Factor
CONSUMPTION: Wh = W x T, where W = instantaneous power, T = time in hours.
The total electric energy usage over a time period is the consumption of Wh.
Typically, the unit in which consumption is specified is the kilowatt-hour (kWh): one thousand watts consumed over one hour. Utilities use the Wh equation to determine the overall consumption in a billing period.
Poor power factor: Results in reactive power consumption. Transferring reactive power over a distribution network causes energy loss. To force consumers to correct their power factor, utilities monitor reactive power consumption and penalize the user for poor power factor.
―3D‖ kVA Measurement
The power meters are equipped with 3D Measurement of kVA. This advanced method provides the most accurate and predictable measurement under unbalanced as well as distorted waveform conditions.
However, in case the power meters need to match the reading of older or simpler power meters, which use the Arithmetic kVA definition, this too is available as a Setup option.
Table 3-1: ―3D‖ kVA Measurement
kVA Function
Formula Other Names
Which one?
3D Factory setting 222
3DVARWkVA
D
Where D = Distortion Power per IEEE 100
U, Apparent, Vector kVA
Best, all around
Arth 321 kVAkVAkVA
ArthkVA Arithmetic,
Scalar kVA Good under Low unbalance, to match simpler meters without 3D capability

PLSED309039EN PM1000 Series Power Meters 08/2010 Chapter 4 – Safety Precautions
© 2010 Schneider Electric. All rights reserved. 33
Chapter 4: Safety Precautions
This section contains important safety precautions that must be followed before attempting to install, service, or maintain electrical equipment. Carefully read and follow the safety precautions outlined below.
HAZARD OF ELECTRIC SHOCK, EXPLOSION, OR ARC FLASH
Apply appropriate personal protective equipment (PPE) and follow safe electrical work practices. In the USA, see NFPA 70E.
Only qualified electrical workers should install this equipment. Such work should be performed only after reading this entire set of instructions.
If the equipment is not used in a manner specified by the manufacturer, the protection provided by the equipment may be impaired.
NEVER work alone.
Before performing visual inspections, tests, or maintenance on this equipment, disconnect all sources of electric power. Assume that all circuits are live until they have been completely de-energized, tested, and tagged. Pay particular attention to the design of the power system. Consider all sources of power, including the possibility of back feeding.
Turn off all power supplying the power meter and the equipment in which it is installed before working on it.
Always use a properly rated voltage sensing device to confirm that all power is off.
Before closing all covers and doors, inspect the work area for tools and objects that may have been left inside the equipment.
When removing or installing panels do not allow them to extend into the energized bus.
The successful operation of this equipment depends upon proper handling, installation, and operation. Neglecting fundamental installation requirements may lead to personal injury as well as damage to electrical equipment or other property.
NEVER bypass external fusing.
NEVER short the secondary of a PT.
NEVER open circuit a CT; use the shorting block to short circuit the leads of the CT before removing the connection from the power meter.
Before performing Dielectric (Hi-Pot) or Megger testing on any equipment in which the power meter is installed, disconnect all input and output wires to the power meter. High voltage testing may damage electronic components contained in the power meter.
The power meter should be installed in a suitable electrical enclosure.
Failure to follow these instructions will result in death or serious injury

PM1000 Series Power Meters PLSED309039EN Chapter 4 – Safety Precautions 08/2010
34 © 2010 Schneider Electric. All rights reserved.

PLSED309039EN PM1000 Series Power Meters 08/2010 Chapter 5 – Installation
© 2010 Schneider Electric. All rights reserved. 35
CHAPTER 5: Installation
Mechanical Installation
The PM1000 series power meters are panel-mounted and have reliable, rear-mounted terminal strips rated at 480 V.
The 92 x 92 mm (3.62 x 3.62 in.) cut-out and 96 x 96 mm (3.78 x 3.78 in.) bezel dimensions adhere to IEC 61554 and DIN 43700.
The diagram below displays the various dimensions of mechanical
installations.
Figure 5-1: Mechanical dimensions and recommended panel cut-out
90.0
80.03.15 0.31
8.00
3.54

PM1000 Series Power Meters PLSED309039EN Chapter 5 – Installation 08/2010
36 © 2010 Schneider Electric. All rights reserved.
Installation Procedure
Usage
First, decide how the power meter is to be used. If you do not already have an energy management program in operation, then your energy consultant should be able to help you identify which load(s) offer maximum savings potential. This will help you decide which point is to be monitored, where the readings will be viewed from, who must have access to the instrument and how often. Otherwise, decide the location of the power meter and install it. For best performance, choose a location that provides all the required signals with minimum wiring lengths.
Panel Considerations and Environment
The power meter is high-precision measuring instrument, and its operating environment is of utmost importance. For maximum performance, the instrument should be mounted in a dry, dust-free location, away from heat sources and strong electromagnetic fields. To operate reliably, the following conditions must be met:
Table 5-1: Environmental Conditions
Description Specification
Storage temperature -25 C to 70 C, (-13
F to 158 F)
Operating temperature -10 C to 60 C, (14
F to 140 F)
Relative humidity 5% to 95%, non-condensing
The power meters should be separated from other equipment, and sufficient space must be provided all around for cooling air to rise vertically past the instrument. The cooling air temperature must be below the specified operating temperature.
The panel or housing, in which the PM1000 power meter is mounted, should protect it from dust, moisture, oil, corrosive vapors, etc.
The panel doors must be easily opened to provide easy access to the power meter wiring for troubleshooting. Allow clearance if the unit is going to swing out, as well as adequate slack in the wiring. Allow space for terminal blocks, CT shorting blocks, fuses, auxiliary contactors, and other necessary components.
Viewing
For ease of operation, the location should be preferably at, or slightly above, eye-level. For viewing comfort, minimize glare and reflections from strong light sources.

PLSED309039EN PM1000 Series Power Meters 08/2010 Chapter 5 – Installation
© 2010 Schneider Electric. All rights reserved. 37
Mounting
The power meters are panel mountable.
Table 5-2: Mounting
Description Specification
Panel cut-out 92+0.5
-0 mm (w) x 92+0.5
-0 mm(h) (3.62+0.02
x 3.62
+0.02 in.)
IEC 61554 and DIN 43700
Panel thickness 0.5 to 4.0 mm (0.02 to 0.16 in.)
Instrumental bezel dimension 96 x 96 mm (3.78 x 3.78 in,)
Depth behind bezel 80 mm (3.15 in.) (82 mm (3.23 in.) with terminal cover. Leave clearance for wires)
Mounting clamps screws Slotted, two numbers
Terminal screws Combination Phillips and Slotted head
The cut-out should be punched with the proper tool and should be free from burrs. The following figure explains the mounting of the power meter.
Figure 5-2: Mounting
While supporting the power meter from the front, tighten both side clamp screws in a criss-cross pattern till all slack is taken up and then apply one full turn. Do not over-tighten. Over-tightening could result in breaking of the clamps.
The power meter should be separated from other equipments and sufficient space must be provided all around the power meter, to allow air to rise vertically around the power meter. Lack of sufficient air for cooling may result in over heating of the power meter.
NOTE: It is much easier to set up the meter before you mount the power meter on the panel. See “Quick setup” on page 17 for more information.
2 Gently slide the power meter through the cut-out.
3Put the mounting clamps back in the power meterand tighten the mounting clamps screws.
1 Remove the mounting clamps from the power meter.

PM1000 Series Power Meters PLSED309039EN Chapter 5 – Installation 08/2010
38 © 2010 Schneider Electric. All rights reserved.
Electrical Installation
This section describes the following:
The need for, and selection of, potential transformers (PTs) and current transformers (CTs).
Auxiliary supply (control power), PT (VT), and CT connections.
For best results, ensure the following specifications:
Torque driver preferred, hand screwdriver OK.
TIP: Phillips head is preferred, but flat head is acceptable. Do not use Pozidriv tips.
Screw head diameter = 3.5 mm (0.14 in.), TIP shaft diameter < 5 mm (0.2 in.).
IMPORTANT – Screwdriver shafts inserted angularly or of diameter ≥ 5 mm (0.2 in.) will get stuck in the cover
Tightening Torque: 0.25 to 1 N.m (2.21 to 8.85 lb-in)
Loosening Torque: 0.8 to 1 N.m (7.08 to 8.85 lb-in)
Screw Travel: 6 mm (0.24 in.) less wire thickness
Torque > 1 N.m (8.85 lb-in) may strip the screw or break the cover.
Connecting cable
Table 5-3: Connecting cable
Insulation Rating Current Rating
Voltage Circuit > 600 VAC > 0.1 A
Current Circuit > 600 VAC > 7.5 A
Or 2.5 mm2/ 14 AWG
minimum
Schneider Electric recommends the use of insulated sleeved U lugs (2.5 mm
2/14 AWG) for wiring terminals.
NOTE: Installations should include a disconnecting device, like a switch or circuit breaker, with clear ON/OFF markings to turn-off the auxiliary supply (control power). The disconnecting device should be placed within the reach of the equipment and the operator.

PLSED309039EN PM1000 Series Power Meters 08/2010 Chapter 5 – Installation
© 2010 Schneider Electric. All rights reserved. 39
Auxiliary Supply (Control Power)
The PM1000 power meter requires a single-phase AC/DC auxiliary (control) power supply to powerup its internal electronic circuitry. External surge suppressors are necessary in the auxiliary supply circuit for proper operation during extreme surge conditions, where the voltage surges exceed the auxiliary supply limits (e.g.,rural areas and outlying areas prone to lightning strikes).
Range:
44 to 277 VAC/DC.
Burden (load) < 3 VA at 240 V.
The control power may be derived from the voltage signals.
If you have a 440 V 3-wire delta system and a reliable neutral is not
available, use a 440 V: 240 V supply transformer to provide the standard 240 V auxiliary supply.
NOTE: It is much easier to set up the meter before you mount the meter on the panel. See “Quick setup” on page 17 for more information.
PTs (VTs) and CTs
Large electrical installations have high voltages and currents, which may exceed the direct connection rating of the power meter. In this case, potential transformers (PTs) and current transformers (CTs) are used to precisely step down or reduce the voltage and current levels to suit the power meter rating. Potential transformers usually have a full scale output of 110 VAC RMS line-line and current transformers usually have a full scale output of 5 A or sometimes 1 A.
The PTs (VTs) and CTs must be planned, installed, and tested by a qualified electrical contractor before wiring the power meter. The accuracy of the measurement also depends on the accuracy and phase angle error of the PTs (VTs) and CTs. Instrument class 1 or better PTs and CTs are recommended. Do not use protection class (10P10, etc.) CTs to feed the power meters; they have poor accuracy and phase characteristics.
Ensure that the CT primary rating has been selected so that your normal load variation lies between 40% and 80% of its full scale. If your CT is over-rated, say if the load is always less than 10% of the CT primary rating, accuracy suffers. On the other hand, if the CT is under-rated, then you may exceed its full scale and burn out both the CT and the power meter.
PT (VT), CT Wiring
The PTs (VTs) and CTs must have adequate VA rating to support the burden (loading) on the secondaries. You may want to support the auxiliary supply burden from one of the PTs (VTs). CT wiring can impose additional burden (loading) on the CT. For example, if the CT has a 5 A secondary and the wire resistance is 1.0 Ω, then the CT has to support an additional burden of 5 VA. If the wiring distance from the CT secondary is greater than stated in Table 5-5 on page 41, then the CT could get over-burdened and give large errors. Choosing a 1 A CT secondary can reduce this error. The CT secondary value must be user programmed into the power meter.
The power meters should be conveniently located for easy connections of voltage (PT), current (CT) signals, and auxiliary (control) supply.
NOTE: The power meters user programmable PT and CT primary or secondary settings, may be utilized to Calibrate out the PT and CT amplitude error, for improved accuracy.

PM1000 Series Power Meters PLSED309039EN Chapter 5 – Installation 08/2010
40 © 2010 Schneider Electric. All rights reserved.
Voltage Signal Connections
For proper power meter operation, the voltage connection must be maintained. The voltage must correspond to the correct terminal. The cable required to terminate the voltage sense circuit should have an insulation rating greater than 480 VAC and a current rating greater than 0.1 A.
There are four input voltage terminals marked V1, V2, V3, and Vn. See the connection diagrams that follow, for details. For Delta connection, the Vn terminal should be left unconnected.
PT Connections
The power meters directly accept LV voltage inputs of up to 480 VAC RMS line to line (277 VLN). Voltages greater than this, typically HV systems, must be connected through Potential transformers (PTs). The power meters allow user programming of both PT primary and secondary voltages.
User programmable PT primary range: 0.1 to 999 kVAC RMS LL
User programmable PT secondary range: 80 to 481 VAC RMS LL
Power meter voltage Input burden: 0.2 VA per input
NOTE: The PT primary and secondary values must be user programmed before using the power meter. Otherwise, the readings will be wrong.
Selecting the voltage fuses
We strongly recommend using fuses on each of the sense voltages (except for neutral) and the control / auxiliary power.
Table 5-4: Fuse recommendation
Power Source Source voltage Fuse (A)
Line voltage 80 to 600 VLL 0.25
Auxiliary supply (Control power)
0.25
Current Signal Connections
The power meter accepts up to 6 A AC RMS per channel directly. Above that, a current transformer must be interposed to scale down the current.
There are three pairs of current input terminals marked A1, A2, and A3. Each pair of input terminals is labeled as S1, S2 and has an arrow indicating the direction of current flow. For proper measurements, the phase identification, and the polarity of the current signals must be correct. The forward flow (import by consumer) current direction must be into the S1 terminal and the exit from the S2 terminal. Maintain the correct sequence and polarity to avoid wrong readings.
Any unused current input terminals must be shorted together, e.g., in Delta connection, the terminals A2 (S1, S2) must be shorted together. The shorted terminals do not need to be grounded.
Install the wiring for the current circuit at 480 VAC insulation as a minimum. The cable connection should be rated for 7.5 A or greater and have a cross-sectional area of 2.5 mm
2 (14 AWG) minimum.

PLSED309039EN PM1000 Series Power Meters 08/2010 Chapter 5 – Installation
© 2010 Schneider Electric. All rights reserved. 41
CT Connections
Mount the current transformers (CTs) as close as possible to the power meter for best accuracy. The following table illustrates the maximum recommended distances for various CT sizes, assuming the connection is via 2.5 mm
2 (14 AWG) cable.
Table: 5-5: CT size and maximum distance
5 A CT size Maximum Distance in metres (in feet/inch)
(CT to PM1000 power meter)
2.5 VA 3.05 m (10 ft/120 in.)
5.0 VA 4.6 m (15 ft/181 in,)
7.5 VA 9.15 m (30 ft/360 in.)
10.0 VA 12.2 m (40 ft/480 in.)
15.0 VA 18.3 m (60 ft/720 in.)
30.0 VA 36.6 m (120 ft/1441 in.)
User programmable CT primary range: 1 A to 99 kA AC.
CT secondary: 1 A or 5 A AC (programmable)
Other values are also programmable to compensate CT errors if desired.
Power meters CT burden: 0.2 VA maximum per input.
See the ―PROG menu — Setup‖ on page 17 for more information.
NOTE:
The PT primary and secondary values must be user programmed before using the power meter. Otherwise, the readings will be wrong.
With dual- range CTs; select the best range for programming the power meter. If you change the range thereafter without re-programming the power meter, the power meter will read erroneous values.
CT Polarity
When the power meter is connected using the CTs, you must maintain correct CT polarities. CT polarities are dependent upon correct connections of CT leads, and upon the direction the CTs are facing when clamped around conductors. The dot on the CT must face the line side; the corresponding secondary connection must connect to the appropriate input on the power meter.
Failure to connect CTs properly results in inaccurate power readings. If your power meter is not reading power properly, it is more than likely that the CT is incorrectly wired. If one or two CTs are reversed, then energy parameters accumulate only one phase value. If two or all the phases of the CT are reversed, energy will not accumulate. (Energy import will not be measured).
CT Connection Reversal
To check the polarity of the CT after the power meter has been installed, simply look at the phase-wise W (Watt) readings to see that each of the readings are positive (assuming you are consuming power). If one of the W readings is negative, that particular phase CT is reversed and must be corrected. On the other hand if you are exporting power, all three phase-wise W readings must be negative.

PM1000 Series Power Meters PLSED309039EN Chapter 5 – Installation 08/2010
42 © 2010 Schneider Electric. All rights reserved.
Setup — System Type
The power meter needs to know the type of system to which it is connected to. This information is programmed in the setup procedure, before using the power meter. The power meter does allow you to change this setting while it is running; however, this capability is meant for correcting a gross error, or for training or educational purposes; it is not to be changed on regular basis. The options are:
Wye/Star: For 3-phase 4-wire, three Watt-meter or three Element circuits. Here, all three voltage phase signals, the neutral voltage connection, and all three current input signals need to be wired in. This means all the four voltage terminals, and six current terminals described in the following section, need to be wired. For wye/star wiring configuration, see ―3-phase 4-wire WYE connection with 3 CTs and 3 PTs‖ on page 43 for more information.
Delta: For 3-phase 3-wire, two Watt-meter or two Element circuits. For delta and open delta wiring configuration, see ―3-phase 3-wire Delta
connection with 2 CTs and 3 PTs‖ and ―3-Phase 3-Wire Open Delta
connection with 2 CTs and 2 PTs‖ on page 44 for more information.
2-phase: For 2-phase 3-wire, two Watt-meter or two Element circuits. Here, the two voltage phase signals, the neutral voltage connection, and two current input signals need to be wired in. This means that the three voltage terminals and four current terminals described in the following section, need to be wired. For two phase wiring configuration, see ―2-phase
3-wire connection with 2 CTs‖ on page 45 for more information.
Single-phase: For single-phase 2-wire, one Watt-meter or one Element circuits. Here a single voltage Phase signal, the neutral voltage connection, and a single current input signal need to be wired in. This means that two voltage terminals and one current terminal described in the following section need to be wired. For Single phase wiring configuration, see ―Single phase connection with 1 CT‖ on page 45 for more information.

PLSED309039EN PM1000 Series Power Meters 08/2010 Chapter 5 – Installation
© 2010 Schneider Electric. All rights reserved. 43
Phase Labels
The phase labels shown on the display are programmable via the power meters front panel PROG menu. You can setup the meter to display phase labels convenient to your practice. The choices available are: 123 (factory set), RYB, RST, PQR, ABC.
Connection Diagrams
Choose the diagram below that best describes your application. You must ensure that the CT phase and corresponding PT phase are identical and that the CT polarity is correct. Follow the outlined procedure to verify correct connection.
Connection Diagram Symbols
Table 5-6: Connection diagrams symbols
Symbol Description
Fuse
Current transformer
Shorting block
Potential transformer
3-phase 4-wire WYE connection with three CTs and three PTs
Direct voltage connection for the input voltages L-L up to 480 VAC.
Figure 5-3: 3-phase 4-wire WYE connection
NOTE:
Make sure WYE/Star is programmed in the power meter PROG menu- Setup.
For High – leg (US connection)
L1 – N = 120 V
L2 – N = 208 V
L3 – N = 120 V
0.25 A
Aux supply(Control Power)44 to 277 VAC/DC
Communication(PM1200)
LOAD
LINEL1 L2 L3 N
Use PT, ifVAC LL 481 V
PT
80
to4
80
Va
cL
L
VE
R:0
3.04
.00
D-D
-IE
RS
48
5-T
HM
Op
tio
nL
ist:
RS 485
mA
to6A
50
S/ N
: CO
YY
WW
DX
XX
XA
ccC
l:1.
0
44to
277
V50
/60
Hz
<5
VA

PM1000 Series Power Meters PLSED309039EN Chapter 5 – Installation 08/2010
44 © 2010 Schneider Electric. All rights reserved.
3-phase 3-wire delta connection with two CTs and three PTs
Direct voltage connections for the input voltages L-L up to 480 VAC.
Figure 5-4: 3-phase 3-wire delta connection
NOTE : Make sure Delta is programmed in the power meter PROG menu- setup. Leave the Vn terminal disconnected.
3-phase 3-wire open delta connection with two CTs and two PTs
Direct voltage connections for the input voltages L-L up to 480 VAC.
Figure 5-5: 3-phase 3-wire open delta connection
NOTE: Make sure Delta is programmed in the power meter PROG menu-setup.
Use PT, if VAC LL 481 V
0.25 A
Aux supply(Control Power)44 to 277 VAC/DC
LOAD
LINE
Communication(PM1200)
PT
L1 L2 L3
80
to4
80
Va
cL
L
VE
R:0
3.04
.00
D-D
-IE
RS
48
5-T
HM
Op
tio
nL
ist:
RS 485
mA
to6A
50
S/ N
: CO
YY
WW
DX
XX
XA
ccC
l:1.
0
44to
277
V50
/60
Hz
<5
VA
Use PT, if VAC LL 481 V
0.25 A
Aux supply(Control Power)44 to 277 VAC/DC
LOAD
LINE
Communication(PM1200)
PT
L1 L2 L3

PLSED309039EN PM1000 Series Power Meters 08/2010 Chapter 5 – Installation
© 2010 Schneider Electric. All rights reserved. 45
2-phase 3-wire connection with two CTs
Direct voltage connections for the input voltages L-L up to 480 VAC. Otherwise, two PTs
Figure 5-6: 2-phase 3-wire connection
NOTE: Make sure 2-phase is programmed in the power meter PROG menu- setup.
Single-phase connection with 1 CT
Direct voltage connections for voltages up to 480 VAC LL. Otherwise, use one PT.
1. Program the power meter in single-phase mode.
However, voltages primary and secondary need to be programmed as Line to Line.
2. Connect the voltage and current inputs only to the V1 and A1 voltage and current terminals of the power meter.
3. The unused current terminals (A2 and A3) must be shorted together to reduce noise picked up in the power meter.
4. However, the energy parameter readings will be accurate.
Figure 5-7: Single-phase connection
Communication(PM1200)
0.25A
Aux supply(Control Power)44 to 277 VAC/DC
LINE
LOAD
L1 L2 N
PT if VAC LL 481 V
Communication(PM1200)
0.25 A
Aux supply(Control Power)44 to 277 VAC/DC
LINE
LOAD
L1 N
PT if VAC LL 481 V
80
to4
80
Va
cL
L
VE
R:0
3.04
.00
D-D
-IE
RS
48
5-T
HM
Op
tio
nL
ist:
RS 485
mA
to6A
50
S/ N
: CO
YY
WW
DX
XX
XA
ccC
l:1.
0
44to
277
V50
/60
Hz
<5
VA

PM1000 Series Power Meters PLSED309039EN Chapter 5 – Installation 08/2010
46 © 2010 Schneider Electric. All rights reserved.

PLSED309039EN PM1000 Series Power Meters 08/2010 Chapter 6 – Data Communication
© 2010 Schneider Electric. All rights reserved. 47
Chapter 6: Data Communication
This section is applicable only for PM1200 power meter.
RS 485 Data Port
Data Port advantages:
Rapid, on-line, real time readings into
Your own SCADA software or PLC.
Schneider Electric energy management software products such as ION™ Enterprise, Vijeo Citect, PowerLogic SCADA for pinpointing energy usage and waste.
Schneider Electric ConPAD: Power meter programming and basic data reading utility.
Data port has built-in impedance matched design for low reflectance on long data cables at high Baud rates. Eliminates need for complicated impedance matching resistors at the ends of long data cables.
Fast 16 ms power meter response, average time to read 10 parameters is 90 to 100 ms (9600 Baud, Even parity, One stop bit).
Direct reading, pre-scaled Float readings. Accurate, full precision low, and high readings. No need for additional scaling factors or decimal adjustment.
Fast, easy-to-use grouping of parameters tuned for field requirements.
TURBO area for single point polling (upto 50 per query)
Block area for even faster access to pre-configured data blocks
Installation
Figure 6-1: 2-wire half duplex communication connection
R
PM1200 power meters rear view
RS 485 communication port
R
RS 485
RS 232
RS 485 Data
Converter
+ - G

PM1000 Series Power Meters PLSED309039EN Chapter 6 – Data Communication 08/2010
48 © 2010 Schneider Electric. All rights reserved.
Figure 6-2: Closed loop, 2-wire half duplex.
Advantage – Reliable communications, tolerant to one break in the cable.
Communication Capabilities
Table 6-1: RS 485 communication distances
NOTE: Distances listed should be used as guide only and cannot be guaranteed for non- PowerLogic devices. Above distances subject to vary based on the quality of the cable.
Daisy-chaining Devices to the Power Meter
RS 485 slave port allows the power meter to be connected in a daisy chain with up to 31 2-wire devices. In this bulletin, communications link refers to a chain of devices that are connected by a communications cable. See Figure 6-3.
Figure 6-3: Daisy-chaining 2-wire devices
NOTE: Belden 3105A/9841 colors: Blue (+), White (-)
If the power meter is the first device on the daisy chain, connect it to the host device using a RS 232 to RS 422/RS 485 converter or RS 485 to Ethernet converter.
PM1200 power meters rear view
RS485
communication port
RS485 Data
Converter
RS485
RS232 +
G-
Baud Rate Maximum communication distances 1 to 32 devices
Meters ( Typical with Belden 3105A cables)
9600 1200
19200 900
Belden 3105A/9841 or equivalent
+
MCT2W-485 terminator on the last device of the daisy chain
Power Meter 1200 or other POWERLOGIC 2-wire compatible devices
-
Towards PC

PLSED309039EN PM1000 Series Power Meters 08/2010 Chapter 6 – Data Communication
© 2010 Schneider Electric. All rights reserved. 49
If the power meter is the last device on the daisy chain, terminate it with the terminator provided.
See ―Table 6-1‖ on page 48, for the maximum daisy-chain communications distances for 2-wire devices.
The terminal’s voltage and current ratings are compliant with the requirements of the EIA RS 485 communications standard.
Data Formats and Settings
Your SCADA software must be configured for Modbus RTU communication, before integrating the Schneider Electric PM1200 power meter.
The mode of transmission is defined in the following which is compatible with Modbus RTU Mode:
Table 6-2: Power meter communication and protocol settings
Power meter communication settings
Protocol Modbus RTU
Data bits 8
Baud rate 9600 Baud, User set 1200 to 19200
Range:1200, 2400, 4800, 9600, 19200
Normal use: 9600 Baud
Noisy, EMI, RFI, long data cable: 4800/2400 Baud
Short cable (<300 meters or 975 feet): 19200 Baud
Parity Even
Device Address 1
Stop bit 1
Modbus Protocol
Device Address 1 to 247
Upto 247 meters per COM port with repeaters
Function Code 03 (Read)
Data Address Refer to ‖Data address‖ on page 53 for more information
Data type
32-bit float (real) :
All parameters.
Direct reading, little endian float, no scaling required
32-bit unsigned integer :
INTR (number of interruptions (outages) - RMS Blocks)
RunSec (Run seconds – Integ Block)
No of Registers 2 to 50 (optional) per PM1200 data block of 10 x 32 bit values must be configured to suit the power meter
NOTE: The polling interval to poll the data from PM1200 will depend on baud rate. We recommend polling interval of one second at 9600 Baud rate.

PM1000 Series Power Meters PLSED309039EN Chapter 6 – Data Communication 08/2010
50 © 2010 Schneider Electric. All rights reserved.
Parameter Settings for Different SCADA Software
The following table explains how to read the parameter VA (See ―Individual parameter address‖ on page 53 for more information) in different Modbus master software/PLC’s.
Table 6-3: Parameter settings
SL. No
SCADA software Start Address
Function Code
No. of Register
Data Type Remarks
1 ION™ Enterprise 43901 Internally configured
2 Swapped Float Direct conversion
2 PowerLogic SCADA
43901 Internally configured
2 Real Direct conversion
3 Vijeo Citect 43901 Internally configured
2 Real Direct conversion
4 Intouch 43901 F Nil 2 Float Direct conversion
5 Modscan (Master)
3901 03 – HOLDING REGISTERS
2 Floating point Unswapped FP mode
6 MODTEST 43901 03 – Rosemount
Points -1 Float- Rosemount
7 CIMPLICITY 43901 Nil 100 Real Direct conversion. The array concept can be used here to poll all the data in single scan.
8 Allenbradly – Micrologix PLC (Slave/Master)
43901 03-HOLDING REGISTERS
2 Floating point Direct
9 GE Fanuc PLC 43901 03-HOLDING REGISTERS
2 Real Direct
10 ABB RTU 560 (Mater)
Index-3900 03- Read HOLDING REGISTERS
Query Range - 2
MFI – Analog measured Floating value
Under sub parameters, ―Sign and Exponent in First Register‖ should be disabled (Unchecked)
11 SEIMENS PLC (Master)
3900 03-HOLDING REGISTERS
2 Real Direct
12 MOVICON 43901 Nil 2 Real Direct
13 RSVIEW 43901 03-HOLDING REGISTERS
2 Real Direct
14
ABB Microscada 3900 Format – 9 Interval – 2 Real Direct
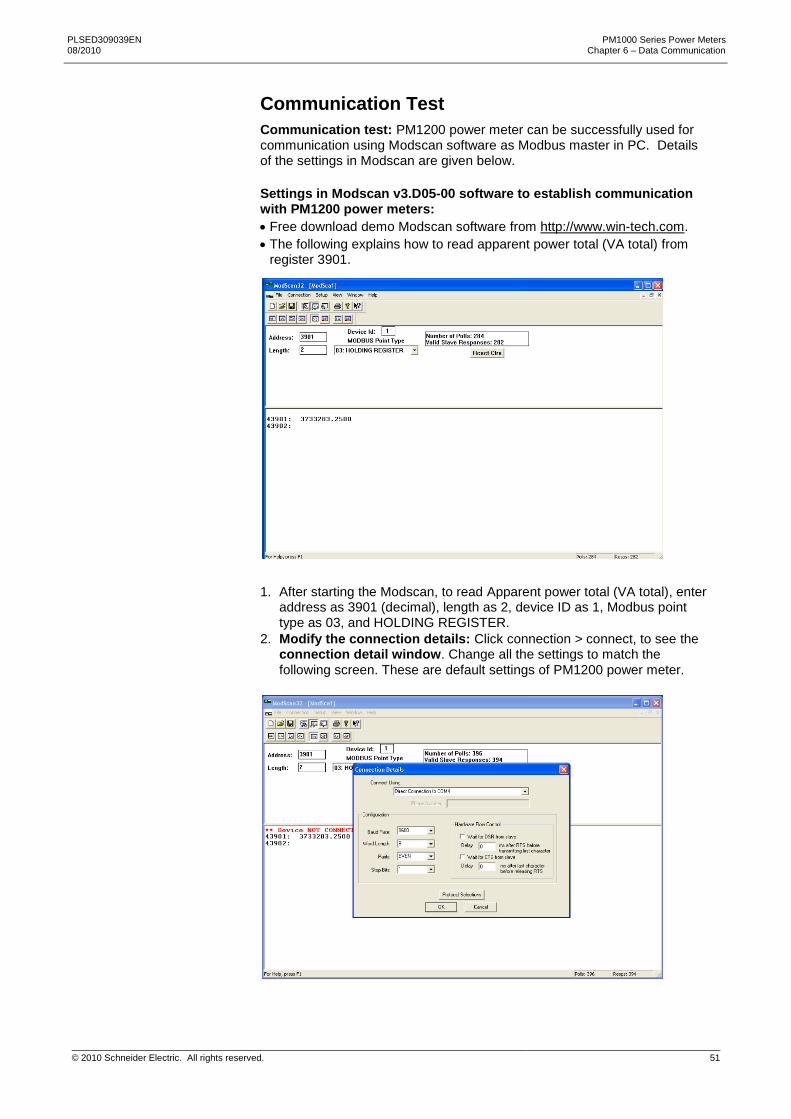
PLSED309039EN PM1000 Series Power Meters 08/2010 Chapter 6 – Data Communication
© 2010 Schneider Electric. All rights reserved. 51
Communication Test
Communication test: PM1200 power meter can be successfully used for communication using Modscan software as Modbus master in PC. Details of the settings in Modscan are given below.
Settings in Modscan v3.D05-00 software to establish communication with PM1200 power meters:
Free download demo Modscan software from http://www.win-tech.com.
The following explains how to read apparent power total (VA total) from register 3901.
1. After starting the Modscan, to read Apparent power total (VA total), enter address as 3901 (decimal), length as 2, device ID as 1, Modbus point type as 03, and HOLDING REGISTER.
2. Modify the connection details: Click connection > connect, to see the connection detail window. Change all the settings to match the
following screen. These are default settings of PM1200 power meter.

PM1000 Series Power Meters PLSED309039EN Chapter 6 – Data Communication 08/2010
52 © 2010 Schneider Electric. All rights reserved.
3. Set the Modbus protocol selections: On Connection details window (shown in previous step), click on Protocol Selections. Enter the protocol settings as shown below and click OK in all the windows.
4. The Modscan software starts polling the configured COM port for the Device ID 1.
Modscan Demo software will stop polling after 3.5 minutes on successful communication.
This shows that the power meter is communicating with the Modbus Modscan master software successfully on the PC. The power meter is Modbus RTU compliant.

PLSED309039EN PM1000 Series Power Meters 08/2010 Chapter 6 – Data Communication
© 2010 Schneider Electric. All rights reserved. 53
Data Address
The PM1200 power meter supports the transfer of whole block and also of individual data values (two registers are used for storing single data value).
In the transfer of individual data values, it treats two registers as an object with the starting address (e.g., 3900) considered as the object name. This enables you to transfer required data values for energy management.
In the transfer of the whole block, it basically treats each block as an object with the starting address (e.g.,3000) considered as the object name. This enables fast block transfers, since energy management usually requires a block of related readings for the same point of time. This method also eliminates time-skew within readings of that block.
The device address, block start address, number of registers, must be configured to suit the power meter. You must also make the related SCADA settings for polling priority, logging, and viewing the data. Refer your SCADA software instructions to learn how to do this.
Individual Parameter Address
Function Code: 03 Read
No scaling required
Read as block or individual parameters
Table 6-4: Individual parameter address
Parameter Description Address Type PM1200
Metering
Metering - Current
A Current average 3913 Float
A1 Current, phase 1 3929 Float
A2 Current, phase 2 3943 Float
A3 Current, phase 3 3957 Float
Metering – Voltage
VLL Line to line average voltage 3909 Float
VLN Line to neutral voltage 3911 Float
V12 Voltage phase 1 to phase 2 3925 Float
V23 Voltage phase 2 to phase 3 3939 Float
V31 Voltage phase 3 to phase 1 3953 Float
V1 Voltage phase 1 to neutral 3927 Float
V2 Voltage phase 2 to neutral 3941 Float
V3 Voltage phase 3 to neutral 3955 Float
Metering - Power
W Active power, total 3903 Float
W1 Active power, phase 1 3919 Float
W2 Active power, phase 2 3933 Float
W3 Active power, phase 3 3947 Float
VAR Reactive power, total 3905 Float
VAR1 Reactive power, phase 1 3921 Float
VAR2 Reactive power, phase 2 3935 Float
VAR3 Reactive power, phase3 3949 Float
VA Apparent power, total 3901 Float
VA1 Apparent power, phase 1 3917 Float
VA2 Apparent power, phase 2 3931 Float
VA3 Apparent power, phase 3 3945 Float
Metering – Power Factor
PF Power factor average 3907 Float
PF1 Power factor, phase 1 3923 Float
PF2 Power factor, phase 2 3937 Float
PF3 Power factor, phase 3 3951 Float

PM1000 Series Power Meters PLSED309039EN Chapter 6 – Data Communication 08/2010
54 © 2010 Schneider Electric. All rights reserved.
Parameter Description Address Type PM1200
Metering - Frequency
F Frequency, Hz 3915 Float
Power Quality
THD
%V1 Voltage THD, phase 1 3861 Float
%V2 Voltage THD, phase 2 3863 Float
%V3 Voltage THD, phase 3 3865 Float
%A1 Current THD, phase 1 3867 Float
%A2 Current THD, phase 2 3869 Float
%A3 Current THD, phase 3 3871 Float
NOTE: The PM1200 power meter shows current THD% as ---- in the display and -999.0 in communications during the following conditions.
When the secondary current is ≤ 0.49 A or ≥ 5.4 A.
When the frequency is > 65 Hz
Energy
FwdVAh Forward apparent energy 3959 Float
FwdWh Forward active energy 3961 Float
FwdVARh Forward reactive inductive energy
3963 Float
FwdVARh Forward reactive capacitive energy
3965 Float
RevVAh Reverse apparent energy 3967 Float
RevWh Reverse active energy 3969 Float
RevVARh Reverse reactive inductive Energy
3971 Float
RevVARh Reverse reactive capacitive Energy
3973 Float
On hrs 1.1.1. On hours 3993 Long
FwdRun secs Forward run seconds 3995 Long
RevRun secs Reverse run seconds 3997 Long
Intr Number of power interruptions
3999 Long
Demand
Present Demand Present demand 3975 Float
Rising Demand Rising demand 3977 Float
Max MD Maximum demand 3979 Float
Max DM Occurrence Time
1.1.2. Maximum demand occurrence time
3981 Long
Percentage of Load parameters
% Avg Load Average load percentage 3881 Float
%L1 Percentage of phase 1 load 3883 Float
%L2 Percentage of phase 2 load 3885 Float
%L3 Percentage of phase 3 load 3887 Float
Unbalanced %Load
1.1.3. Unbalanced %load 3889 Float
Unbalanced % voltage
1.1.4. Unbalanced % voltage 3891 Float

PLSED309039EN PM1000 Series Power Meters 08/2010 Chapter 6 – Data Communication
© 2010 Schneider Electric. All rights reserved. 55
Block Parameter Address
Total RMS Block
Function Code: 03H Read
Number of registers: 20
No scaling required
Read as block only
Table 6-5: Total RMS block
Parameter Description Address Type PM1200
VA Apparent power, total 3001 Float
W Active power, total 3003 Float
VAR Reactive power, total 3005 Float
PF Average PF 3007 Float
VLL Average line to line voltage 3009 Float
VLN Average line to neutral voltage 3011 Float
A Average current 3013 Float
F Frequency, Hz 3015 Float
Reserved Reserved 3017 Long
Intr Number of interruption 3019 Long
R phase RMS Block:
Function Code: 03H Read
Number of registers: 20
No scaling required
Read as block only
Table 6-6: R phase RMS block
Parameter Description Address Type PM1200
VA1 Apparent power, phase1 3031 Float
W1 Active power, phase1 3033 Float
VAR1 Reactive power, phase1 3035 Float
PF1 Power factor, phase1 3037 Float
V12 Voltage phase1 to phase2 3039 Float
V1 Voltage phase1 to neutral 3041 Float
A1 Current, phase1 3043 Float
F1 Frequency, Hz 3045 Float
Reserved Reserved 3047 Long
Intr1 Number of interruption 3049 Long

PM1000 Series Power Meters PLSED309039EN Chapter 6 – Data Communication 08/2010
56 © 2010 Schneider Electric. All rights reserved.
Y phase RMS Block:
Function Code: 03H Read
Number of registers: 20
No scaling required
Read as block only
Table 6-7: Y phase RMS block
Parameter Description Address Type PM1200
VA2 Apparent power, phase 2 3061 Float
W2 Active power, phase 2 3063 Float
VAR2 Reactive power, phase 2 3065 Float
PF2 Power factor, phase 2 3067 Float
V23 Voltage phase 2 to phase 3 3069 Float
V2 Voltage phase 2 to neutral 3071 Float
A2 Current, phase 2 3073 Float
F2 Frequency, Hz 3075 Float
Reserved Reserved 3077 Long
Intr2 Number of interruption 3079 Long
B phase RMS Block:
Function Code: 03H Read
Number of registers: 20
No scaling required
Read as block only
Table 6-8: B phase RMS block
Parameter Description Address Type PM1200
VA3 Apparent power, phase 3 3091 Float
W3 Active power, phase 3 3093 Float
VAR3 Reactive power, phase 3 3095 Float
PF3 Power factor, phase 3 3097 Float
V31 Voltage phase 3 to phase 1 3099 Float
V3 Voltage phase 3 to neutral 3101 Float
A3 Current, phase 3 3103 Float
F3 Frequency, Hz 3105 Float
Reserved Reserved 3107 Long
Intr3 Number of interruption 3109 Long

PLSED309039EN PM1000 Series Power Meters 08/2010 Chapter 6 – Data Communication
© 2010 Schneider Electric. All rights reserved. 57
Forward Integrated Block
Function Code: 03H Read
Number of registers: 20
No scaling required
Read as block only
Table 6-9: Forward integrated block
Parameter Description Address Type PM1200
FwdVAh Forward apparent energy 3121 Float
FwdWh Forward active energy 3123 Float
FwdVARh Forward reactive inductive energy
3125 Float
Reserved Reserved 3127 Float
Reserved Reserved 3129 Float
FwdVARh Forward reactive capacitive energy
3131 Float
Reserved Reserved 3133 Float
Reserved Reserved 3135 Float
Reserved Reserved 3137 Long
FwdRunsecs Forward run seconds 3139 Long
Reverse Integrated Block:
Function Code: 03H Read
Number of registers: 20
No scaling required
Read as block only
Table 6-10: Reverse integrated block
Parameter Description Address Type PM1200
RevVAh Reverse apparent energy 3151 Float
RevWh Reverse active energy 3153 Float
RevVARh Reverse reactive inductive energy 3155 Float
Reserved Reserved 3157 Float
Reserved Reserved 3159 Float
RevVARh Reverse reactive capacitive energy 3161 Float
Reserved Reserved 3163 Float
Reserved Reserved 3165 Float
Reserved Reserved 3167 Long
RevRunsecs Reverse run seconds 3169 Long

PM1000 Series Power Meters PLSED309039EN Chapter 6 – Data Communication 08/2010
58 © 2010 Schneider Electric. All rights reserved.
Total Integrated Block:
Function Code: 03H Read
Number of registers: 20
No scaling required
Read as block only
Table 6-11: Total integrated block
Parameter Description Address Type PM1200
TotVAh Total apparent energy 3181 Float
TotWh Total active energy 3183 Float
TotVARh Total reactive inductive energy 3185 Float
Reserved Reserved 3187 Float
Reserved Reserved 3189 Float
TotVARh Total reactive capacitive energy 3191 Float
Reserved Reserved 3193 Float
Reserved Reserved 3195 Float
Reserved Reserved 3197 Long
TotRunsecs Total run seconds 3199 Long
Demand Block:
Function Code: 03H Read
Number of registers: 22
No scaling required
Read as block only
Table 6-12: Demand block
Note: The address 3741 is overlapped between the demand and max demand blocks.
Parameter Description Address Type PM1200
Reserved Reserved 3721 Long
Reserved Reserved 3723 Float
Reserved Reserved 3725 Float
Reserved Reserved 3727 Float
Reserved Reserved 3729 Float
Reserved Reserved 3731 Float
Reserved Reserved 3733 Float
Present demand Present demand 3735 Float
Rising demand Rising demand 3737 Float
Time remaining Time remaining 3739 Long
Reserved Reserved 3741 Float
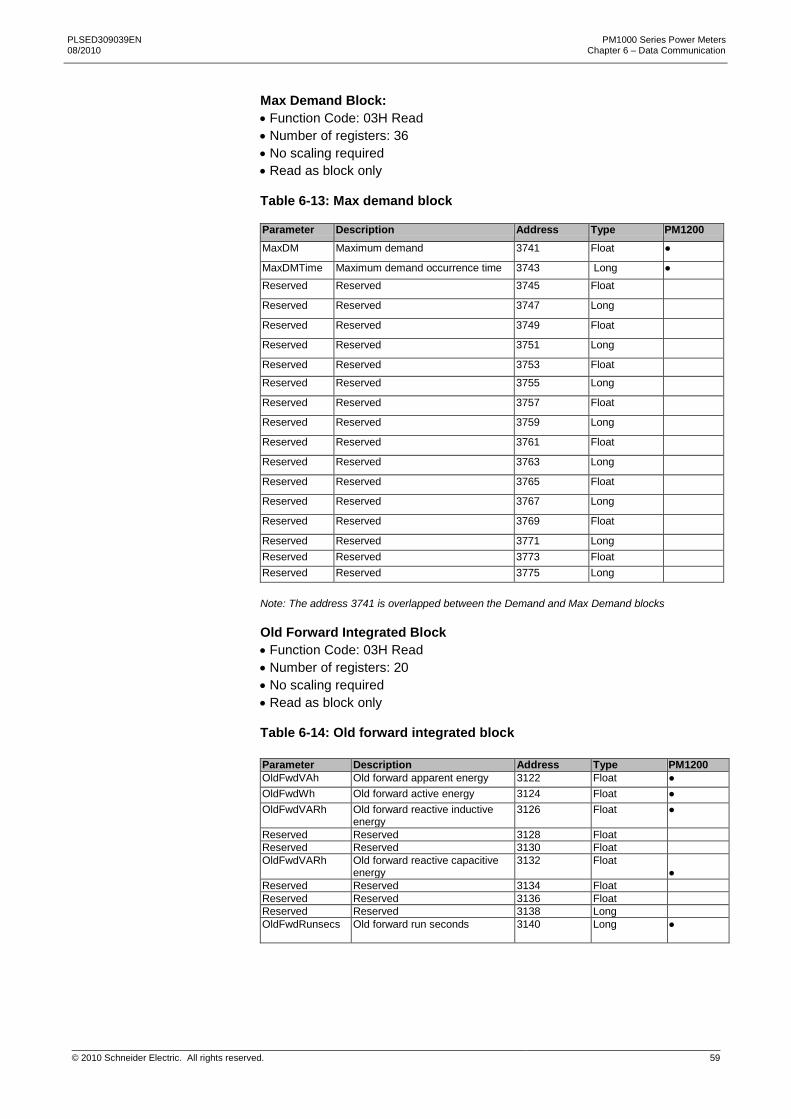
PLSED309039EN PM1000 Series Power Meters 08/2010 Chapter 6 – Data Communication
© 2010 Schneider Electric. All rights reserved. 59
Max Demand Block:
Function Code: 03H Read
Number of registers: 36
No scaling required
Read as block only
Table 6-13: Max demand block
Parameter Description Address Type PM1200
MaxDM Maximum demand 3741 Float
MaxDMTime Maximum demand occurrence time 3743 Long
Reserved Reserved 3745 Float
Reserved Reserved 3747 Long
Reserved Reserved 3749 Float
Reserved Reserved 3751 Long
Reserved Reserved 3753 Float
Reserved Reserved 3755 Long
Reserved Reserved 3757 Float
Reserved Reserved 3759 Long
Reserved Reserved 3761 Float
Reserved Reserved 3763 Long
Reserved Reserved 3765 Float
Reserved Reserved 3767 Long
Reserved Reserved 3769 Float
Reserved Reserved 3771 Long
Reserved Reserved 3773 Float
Reserved Reserved 3775 Long
Note: The address 3741 is overlapped between the Demand and Max Demand blocks
Old Forward Integrated Block
Function Code: 03H Read
Number of registers: 20
No scaling required
Read as block only
Table 6-14: Old forward integrated block
Parameter Description Address Type PM1200
OldFwdVAh Old forward apparent energy 3122 Float
OldFwdWh Old forward active energy 3124 Float
OldFwdVARh Old forward reactive inductive energy
3126 Float
Reserved Reserved 3128 Float
Reserved Reserved 3130 Float
OldFwdVARh Old forward reactive capacitive energy
3132 Float
Reserved Reserved 3134 Float
Reserved Reserved 3136 Float
Reserved Reserved 3138 Long
OldFwdRunsecs
Old forward run seconds 3140 Long

PM1000 Series Power Meters PLSED309039EN Chapter 6 – Data Communication 08/2010
60 © 2010 Schneider Electric. All rights reserved.
Old Reverse Integrated Block:
Function Code: 03H Read
Number of registers: 20
No scaling required
Read as block only
Table 6-15: Old reverse integrated block
Parameter Description Address Type PM1200
OldRevVAh Old reverse apparent energy 3152 Float
OldRevWh Old reverse active energy 3154 Float
OldRevVARh Old reverse reactive inductive energy
3156 Float
Reserved Reserved 3158 Float
Reserved Reserved 3160 Float
OldRevVARh Old reverse reactive capacitive energy
3162 Float
Reserved Reserved 3164 Float
Reserved Reserved 3166 Float
Reserved Reserved 3168 Long
OldRevRunsecs Old reverse run seconds 3170 Long
Old Total Integrated Block:
Function Code: 03H Read
Number of registers: 20
No scaling required
Read as block only
Table 6-16: Old total integrated block
Parameter Description Address Type PM1200
OldTotVAh Old total apparent energy 3182 Float
OldTotWh Old total active energy 3184 Float
OldTotVARh Old total reactive inductive energy 3186 Float
Reserved Reserved 3188 Float
Reserved Reserved 3190 Float
OldTotVARh Old total reactive capacitive energy 3192 Float
Reserved Reserved 3194 Float
Reserved Reserved 3196 Float
Reserved Reserved 3198 Long
OldTotRunsecs Old total run seconds 3200 Long

PLSED309039EN PM1000 Series Power Meters 08/2010 Chapter 6 – Data Communication
© 2010 Schneider Electric. All rights reserved. 61
Phase Angle Block:
Function Code: 03H Read
Number of registers: 18
No scaling required
Read as block only
Table 6-17: Phase angle block
Note: The parameters V1, V2, V3 (voltage phase angles) and neutral voltage are available only through communication.
Setup Block:
Function Code: 03H Read, 10H Write
Number of registers: 40
No scaling required
Read and write as block only
Table 6-18: Setup block
Parameter Description Address Type PM1200
Neutral voltage Neutral voltage 3701 Float
An Neutral current 3703 Float
V1 Voltage phase angle, phase 1 3705 Float
V2 Voltage phase angle, phase 2 3707 Float
V3 Voltage phase angle, phase 3 3709 Float
A1 Current phase angle, phase 1 3711 Float
A2 Current phase angle, phase 2 3713 Float
A3 Current phase angle, phase 3 3715 Float
RPM Rotations per minute 3717 Float
Parameter Description Address Type Range Default value
PM1200
A.Pri Current primary
0101 Float 1.0 to 99 k
100.0
A.Sec Current secondary
0103 Float 1.0 to 6.5
5.000
V.Pri Voltage primary
0105 Float 100.0 to 999 k
415.0
V.Sec Voltage secondary
0107 Float 50.00 to 601.0
415.0
SYS System Configuration
0109 Float 2.0 to 6.0 2.0 – Delta 3.0 – Star 4.0 – Wye 5.0 – 2 Ph 6.0 – 1 Ph
3.000
LABL Phase Labeling
0111 Float 0.0 to 4.0 0.0 – 123 1.0 – ABC 2.0 – RST 3.0 – PQR 4.0 – RYB
0.000
VA Fn VA Function selection
0113 Float 0.0 to 1.0 0.0 – 3D 1.0 – Arth
0.000
D sel Demand Selection
0115 Float 0.0 to 1.0 0.0 – Auto 1.0 – User
0.000
D Par Demand parameter
0117 Float 0.0 to 2.0 0.0 – VA 1.0 – W 2.0 A
0.000

PM1000 Series Power Meters PLSED309039EN Chapter 6 – Data Communication 08/2010
62 © 2010 Schneider Electric. All rights reserved.
NOTE: For efficient setup, read the setup parameters first and then edit the required setup parameter value.
Parameter Description Address Type Range Default value
PM1200
D Prd Demand period
0119 Float 1.0 to 6.0 1.0 – 5 Min 2.0 – 10 Min 3.0 – 15 Min 4.0 – 20 Min 5.0 – 25 Min 6.0 – 30 Min
3.000
BAUD Baud rate 0121 Float 1.0 to 5.0 1.0 – 1200 2.0 – 2400 3.0 – 4800 4.0 – 9600 5.0 – 19200
4.000
PRTY Parity and stop bit
0123 Float 0.0 to 5.0 0.0 – Even 1 1.0 – Even 2 2.0 – Odd 1 3.0 – Odd 2 4.0 – No 1 5.0 – No 2
0.000
ID Unit ID 0125 Float 1.0 to 255.0 1.000
F.S% % Full scale 0127 Float 1 to 100 100.0
OFLo Overflow parameter selection
0129 Float 0.0 to 1.0 0.0 – Wh 1.0 – VAh
0.000
POLE Number of poles for RPM
0131 Float 1.0 to 8.0 1.0 – 2 2.0 – 4 3.0 – 6 4.0 – 8 5.0 – 10 6.0 – 12 7.0 – 14 8.0 – 16
2.000
PWD Password 0133 Float 1000 1000
Reserved Reserved 0135 Float - 2.0
Reserved Reserved 0137 Float - 4126
Reserved Reserved 0139 Float - 0.0

PLSED309039EN PM1000 Series Power Meters 08/2010 Chapter 6 – Data Communication
© 2010 Schneider Electric. All rights reserved. 63
Clear Block
Function Code: 10H Write
Number of registers: 2
No scaling required
Write as block only
Table 6-19: Clear block
NOTE: For setup default, the power meter will send an exception for values other than 256.
Model Info Block:
Function Code: 03H Read
Number of registers: 14
No scaling required
Read as block only
Table 6-20: Model Info Block
Model Register Details
This section explains about the model register and helps you to understand the model number, version number, and options.
The following figure explains how the bits are organized in the model register.
Figure 6-4: Bits in model register
MSB LSB
31 30 29 28 27 26 25 24 23 22 21 20 19 18 17 16 15 14 13 12 11 10 9 8 7 6 5 4 3 2 1 0
Parameter Description Address Type Range PM1200
CLR_INTG_DMD_SETDEFAULT
INTG and demand clearing and setting up the setup default
0311 Long 1 - INTG and MD Clear 2 - MD Clear 256 - Setup default
Parameter Description Address Type Range PM1200
Reserved Reserved 0081 Long
Reserved Reserved 0083 Long
Model Version Model, Options and version numbers
0085 Long Bits 30 to 24 for model number; Bits 23 to 16 for options Bits 15 to 0 for version number E.g., PM1200 model no is 22
Reserved Reserved 0087 Long
Reserved Reserved 0089 Long
Reserved Reserved 0091 Long
Reserved Reserved 0093 Long
30 – 24
Model No
23 – 16
Options
15 – 0
Version No

PM1000 Series Power Meters PLSED309039EN Chapter 6 – Data Communication 08/2010
64 © 2010 Schneider Electric. All rights reserved.
Meter Model and Number: The following table bitwise explanation for
Meter model and number.
Table 6-21: Meter model and number
Meter model Model no (5A) Model Options
PM1200 22 (0x16) IE
DM
THD
Model options description: The following table gives the model options
bitwise description.
Table 6-22: Model options description
Interpretation of firmware version number: The following steps clearly
explain how to interpret the firmware (FW) version number.
1. Convert the hexadecimal values both MSB and LSB into decimal values. 2. Apply the formula ((MSB*256)+LSB). 3. The resulting value will be 30400 for the hexadecimal value 0x76 0xC0. 4. Insert a 0 before the result and parse it from the right with two digits each. 5. The result will be the FW version = 03.04.00.
Table 6-23: Firmware version interpretation
MSB LSB
Hexadecimal 0x76 0xC0
Decimal 118 192
VALUE=((MSB*256)+LSB) 30400
FW Version 03.04.00
NOTE: Firmware version representation only. To determine your power meter’s present firmware version, refer the diagnostic page in the power meter. See “PM1000 series power meters menu hierarchy”, on page 27 to navigate through the diagnostic page.
Bit23 Bit22 Bit21 Bit20 Bit19 Bit18 Bit17 Bit16 Remarks
0 0 0 0 0 0 0 0 No options available
0 0 0 0 0 0 0 1 Imp/Exp option available
0 0 0 0 0 0 1 0 DM option available
0 0 0 0 0 0 1 1 Imp/Exp and DM option available
0 0 0 0 0 1 0 0 THD option available
0 0 0 0 0 1 0 1 Imp/Exp and THD available
0 0 0 0 0 1 1 0 DM and THD available
0 0 0 0 0 1 1 1 Imp/exp, DM and THD available

PLSED309039EN PM1000 Series Power Meters 08/2010 Chapter 6 – Data Communication
© 2010 Schneider Electric. All rights reserved. 65
NOTE:
Most of the reserved and unavailable parameters return zero value.
The SCADA software must support register blocks consisting of different data types (integers and floats) to transfer of whole block.
Each Modbus register size is 16 bits. All PM1200 readings are 32 bits. Therefore, each PM1200 reading occupies two consecutive Modbus registers. For example, VA parameter absolute address is 3901. It occupies both 3901 and 3902 Modbus registers.
Address configuration: All addresses are in decimal. Some SCADA software supports Modbus register address instead of absolute register address. In this case add 40000 to the above address and use it. For example, VA parameter absolute address is 3901. Modbus address can be 43901 (40000+3901).
Phase Angle Block: Voltage phase angles (0,120,240) are hard coded (not measured). Hence, these values are also available in communication in the absence of input signals; however, these voltage phase angles are not available in the power meter display.
TURBO, and Percentage of Load Blocks: These parameters can be read individually or as a block
TURBO block: 50 parameters maximum
Percentage of Load block: 5 parameters maximum
All power meters addresses should be set between 1 and 247.
All power meters should have uniform communication settings like Baud rate, parity and stop bit.
Use Diagnostic mode display in the power meter to analyze the problem in communication.
Error: u – Invalid unit ID
A – Invalid Address
c – CRC error (cyclic redundancy checking)
t – Transmitting
r – Receiving
F – Invalid function code
o – Parity, framing or overrun error
O- Buffer overflow

PM1000 Series Power Meters PLSED309039EN Chapter 6 – Data Communication 08/2010
66 © 2010 Schneider Electric. All rights reserved.

PLSED309039EN PM1000 Series Power Meters 08/2010 Chapter 7 – Maintenance And Troubleshooting
© 2010 Schneider Electric. All rights reserved. 67
Chapter 7: Maintenance and Troubleshooting
Introduction This chapter describes information related to maintenance of your power meter.
The power meter does not contain any user-serviceable parts. If the power meter requires service, contact your local sales representative. Do not open the power meter. Opening the power meter voids the warranty.
HAZARD OF EQUIPMENT DAMAGE
Do not perform a Dielectric (Hi-Pot) or Megger test on the power meter, test voltages may damage the power meter..
Before performing Hi-Pot or Megger testing on any equipment in
which the power meter is installed, disconnect all input and output
wires to the power meter.
Failure to follow this instruction will result in equipment damage.

PM1000 Series Power Meters PLSED309039EN Chapter 7 – Maintenance And Troubleshooting 08/2010
68 © 2010 Schneider Electric. All rights reserved.
Troubleshooting
The information in Table 7–1 describes potential problems and their possible
causes. It also includes possible checks to perform or solutions to the
problems. After referring to this table, if you cannot resolve the problem, contact your local Schneider Electric sales representative for assistance.
DDANGER
HAZARD OF ELECTRIC SHOCK, EXPLOSION, OR ARC FLASH
Apply appropriate personal protective equipment (PPE) and follow safe electrical practices. For example, in the United States, see NFPA 70E.
This equipment must be installed and serviced only by qualified personnel.
Turn off all power supplying this equipment before working on or inside.
Always use a properly rated voltage sensing device to confirm that all power is off.
Carefully inspect the work area for tools and objects that may have been left inside the equipment.
Use caution while removing or installing panels so that they do not extend into the energized bus; avoid handling the panels, which could cause personal injury.
Failure to follow this instruction will result in death or serious injury.
Table 7-1: Trouble shooting
Potential Problem Possible Cause Possible Solution
The data being displayed is inaccurate or not what you expect.
Incorrect setup values Check that the correct values have been entered for power meter setup parameters (CT and PT ratings, system type, and so on). See ―PROG menu - Setup‖ on page 17 for setup instructions.
Usage of protection class (10P10 etc.) CTs/PTs
Use instrument class 1 or better CTs/PTs, which will have better accuracy than the protection class CTs/PTs.
Improper wiring Check whether all the PTs and CTs are connected properly (proper polarity is observed) and that they are energized. Check shorting terminals. See ―connection diagrams ―on page 43 for more information.
Active Power (W) reading is negative
CT may be reversed Check and correct the CT connections.
Power may be in export mode
1. Check the mode. If the mode is in import, s1 s2 need to be interchanged in one or two or in all the three phases. Under this condition, the energy will update in INTG Rev.
2. Check the mode. If it is in export, then the energy will update in INTG Rev.

PLSED309039EN PM1000 Series Power Meters 08/2010 Chapter 7 – Maintenance And Troubleshooting
© 2010 Schneider Electric. All rights reserved. 69
Potential Problem Possible Cause Possible Solution
The display went blank suddenly.
Over voltage/temperature Interrupt the power supply or reduce the voltage or temperature within the limit.
Fuse connection Check whether a fuse with rating of 0.25 A is connected on each voltage input. If not connect the 0.25 A rated fuse to the voltage input.
The power meter stopped communication abruptly.
Communications lines are improperly connected.
Verify the power meter communications connections. See ―Chapter 6 – Data communication‖ on page 47 for more information.
Over voltage/temperature Interrupt the power supply or reduce the voltage or temperature within the allowable limits.
Wrong Load bar indication Incorrect F.S% selection Select the full scale load percentage setting as per your circuit.
The Power meter is over heated
Lack of sufficient air for cooling
Provide sufficient space all around the power meter. Separate the power meter from other equipment for cooling air.

PM1000 Series Power Meters PLSED309039EN Chapter 7 – Maintenance And Troubleshooting 08/2010
70 © 2010 Schneider Electric. All rights reserved.

PLSED309039EN PM1000 Series Power Meters 08/2010 Chapter A: Technical Data
© 2010 Schneider Electric. All rights reserved. 71
Appendix A – Technical Data
Accuracy
Table A-1: Accuracy
Measurement Accuracy % of Reading
Class 1.0
Voltage LN per phase and average 1.0
Voltage LL per phase and average 1.0
Amp per phase and average 1.0
Amp, phase angle per phase 2º
Frequency 0.1
Active power, (kW) per phase and total 1.0
Reactive power, (kVAR) per phase and total
2.0
Apparent power, (kVA) per phase and total
1.0
Active energy (kWh) Import/Export 1.0
Reactive energy (kVARh) (Inductive / Capacitive)
2.0
Apparent energy ( kVAh) 1.0
RPM 1.0
NOTE:
Additional error of 0.05 % of full scale for input current below 100 mA.
PF error limit is same as W error limit in %.
Auxiliary supply (Control power)
The power meter needs a single-phase AC or DC control supply to power its internal electronics.
Range: 44 to 277 VAC/DC.
Burden (load): 0.2 VA max for each phase input voltage and current 3 VA max on Auxiliary supply.
Front Panel Display
Brilliant three lines four digit (digit height 14.2 mm/0.56 in.) per line, high readability alpha numeric LED display with auto scaling capability for Kilo, Mega, Giga.
The display provides the user access to all phase voltages (phase to neutral and phase to phase), currents (per phase and average), Watts, VARs, VA, power factor, frequency, kWh, kVAh, and kVARh.
The power meters display average volts, amps, and frequency simultaneously.
Load bar graph for the indication of consumption in terms of % amperes total.
Set of four red LED’s in the load bar start blinking when the load is greater than 120%, to indicate overload.
Easy setup through keys located on the faceplate for common configuration parameters.

PM1000 Series Power Meters PLSED309039EN Appendix A: Technical Data 08/2010
72 © 2010 Schneider Electric. All rights reserved.
Password protection for setup parameters.
User-selectable default display page through keypad lock.
Installation and Input Ratings
Auto-ranging voltage inputs should allow direct connection up to 277 VLN/480VLL AC systems, no PTs (VTs) required up to 480 VLL phase to phase).
Supports the following configurations (field configurable):
Direct 4-wire Wye (Star); 3-wire Wye (Star); 3-wire Delta; 2-phase 3-wire (2-phase), and single-phase.
3-phase voltage, and current inputs
Volts : 46 to 277 VAC phase-neutral, 80 to 480 VAC phase-phase, Overload: Continuous 480 VLL with full accuracy, 750 VLL Max, Hz. 50 / 60
Amps: 50 mA to 6 A, Overload: 10 A continuous, 50 A for three seconds
User programmable for 5 A or 1 A secondary CTs
Burden (Load): Less than 0.2 VA per Volt / Ampere input
Frequency (Both input and auxiliary): 50 / 60 Hz, 45 to 65 Hz
Environmental Conditions
Sealed dust- proof construction. Meets IP51 for the front panel and IP40 for rear panel.
Operating temperature: -10 C to 60 C , (14 F to 140 F)
Storage temperature: -25 C to 70 C, (-13 F to 158 F)
Humidity: 5% to 95%, non-condensing
Construction
Self-extinguishable V0 plastic, double insulation at accessible areas.
Pollution Degree II.
Measurements Category III.
Dimensions and Shipping
Basic unit installed depth 82 mm (3.23 in.) with the protected cover with 92 x 92 mm (3.62 x 3.62 in.) panel cutout, flush mount.
Bezels dimension 96 x 96 mm (3.78 x 3.78 in.). Panel Cut-out 92x92 mm (3.62 x 3.62 in.).
Weight 400 gms (0.9 lb) approx unpacked, 500 gms (1.1 lb) approx shipping. See ―Mechanical Installation‖ on page 35 for more information.

PLSED309039EN PM1000 Series Power Meters 08/2010 Appendix B: SIM Mode
© 2010 Schneider Electric. All rights reserved. 73
Appendix B: SIM (simulation) Mode
The PM1000 series power meters are provided with SIM mode for demo and exhibition display, where the user can see the functioning of the power meter without any input signals. The power meter will show a fixed voltage, current, frequency, and 0.5PF. Power and energy parameters are calculated based on the V, A, and PF displayed.
To Enter SIM mode
Keep the pressed, while powering up the power meter. The display shows RUN.
Press . The display shows SIM.
Press . The display shows RMS SIM. You have successfully
entered the SIM mode of the power meters.
To Exit from SIM mode
Press and hold the , until you reach the RMS page.
Press . The display shows SIM.
Press . The display shows RUN.
Press . The display shows RMS indicating the exit from SIM mode

PM1000 Series Power Meters PLSED309039EN Appendix B – SIM Mode 08/2010
74 © 2010 Schneider Electric. All rights reserved.

PLSED309039EN PM1000 Series Power Meters 08/2010 Appendix C – Glossary
© 2010 Schneider Electric. All rights reserved. 75
Appendix C: Glossary
Terms
Auto (sliding block): An interval selected from five to 30 minutes. The power meter calculates and updates the demand every 15 seconds.
Baud rate: Specifies how fast data is transmitted across a network port.
Communications link: A chain of devices connected by a communications cable to a communications port.
Current Transformer (CT): Current transformers for current inputs.
Demand: Average value of a quantity, such as power, over a specified interval of time.
Firmware: Operating system within the power meter.
Float: A 32-bit floating point value returned by a register (See ―Data Address‖ on page 53 for more information).
Forward: Importing the power into the plant/grid.
Frequency: Number of cycles in one second.
Line-to-line voltages: Measurement of the RMS line-to-line voltages of the circuit.
Line-to-neutral voltages: Measurement of the RMS line-to-neutral voltages of the circuit.
LOCK: Default display page lock (See ―Default display (View) page‖ on page 12 for more information).
Long: A 32-bit value returned by a register (See ―Data Address‖ on page 53 for more information).
Maximum demand: Highest average load during a specific time interval.
Nominal: Typical or average
Parity: Refers to binary numbers sent over the communications link. An extra bit is added so that the number of ones in the binary number is either even or odd, depending on your configuration. Used to detect errors in the transmission of data.
Power factor: True power factor is the ratio of real power to apparent power using the complete harmonic content of real and apparent power.
Reverse: Exporting the power from the plant/grid.
RMS: Root mean square. The power meters are true RMS sensing devices.
Run mode: This is the normal operating mode of the power meter, where the readings are taken.
Total Harmonic Distortion (THD): Indicates the degree to which the voltage or current signal is distorted in a circuit.
ULOC: Default display page unlock (See ―Default display (View) page‖ on page 12 for more information).

PM1000 Series Power Meters PLSED309039EN Appendix C – Glossary 08/2010
76 © 2010 Schneider Electric. All rights reserved.
User (fixed block): An interval selected between five to 30 minutes. The
power meter calculates and updates the demand at the end of each interval.
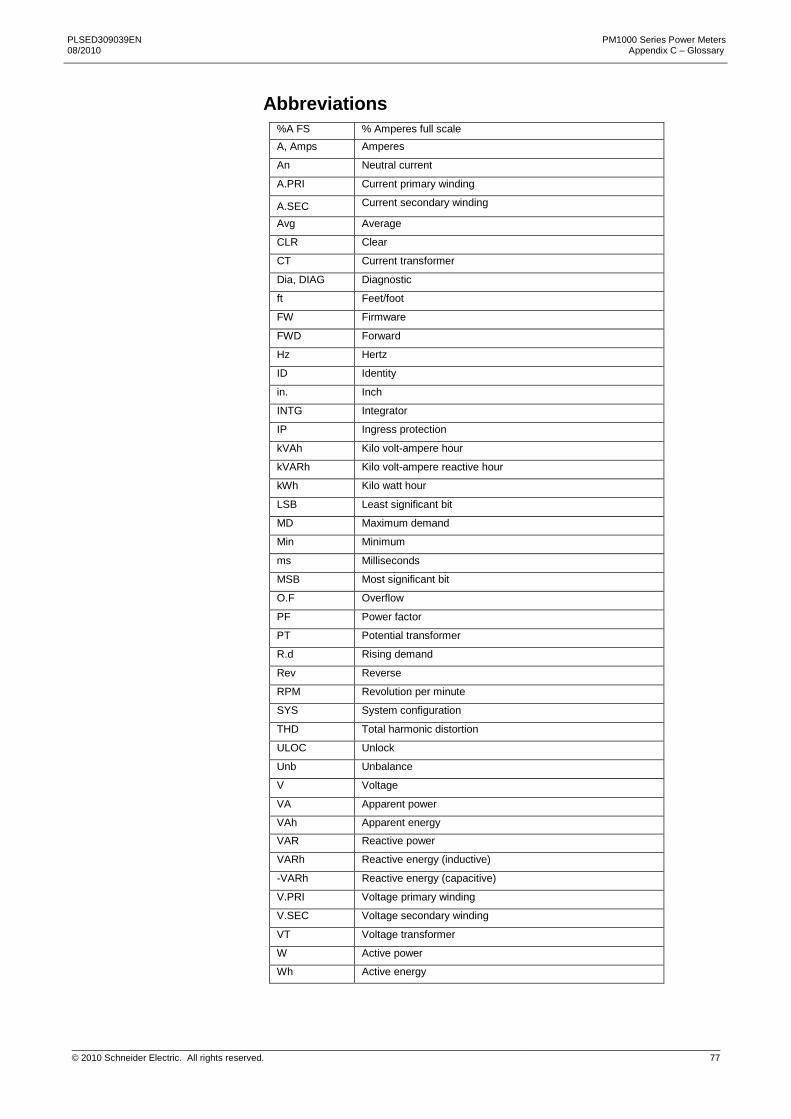
PLSED309039EN PM1000 Series Power Meters 08/2010 Appendix C – Glossary
© 2010 Schneider Electric. All rights reserved. 77
Abbreviations
%A FS % Amperes full scale
A, Amps Amperes
An Neutral current
A.PRI Current primary winding
A.SEC Current secondary winding
Avg Average
CLR Clear
CT Current transformer
Dia, DIAG Diagnostic
ft Feet/foot
FW Firmware
FWD Forward
Hz Hertz
ID Identity
in. Inch
INTG Integrator
IP Ingress protection
kVAh Kilo volt-ampere hour
kVARh Kilo volt-ampere reactive hour
kWh Kilo watt hour
LSB Least significant bit
MD Maximum demand
Min Minimum
ms Milliseconds
MSB Most significant bit
O.F Overflow
PF Power factor
PT Potential transformer
R.d Rising demand
Rev Reverse
RPM Revolution per minute
SYS System configuration
THD Total harmonic distortion
ULOC Unlock
Unb Unbalance
V Voltage
VA Apparent power
VAh Apparent energy
VAR Reactive power
VARh Reactive energy (inductive)
-VARh Reactive energy (capacitive)
V.PRI Voltage primary winding
V.SEC Voltage secondary winding
VT Voltage transformer
W Active power
Wh Active energy

PM1000 Series Power Meters PLSED309039EN Appendix C – Glossary 08/2010
78 © 2010 Schneider Electric. All rights reserved.

PLSED309039EN PM1000 Series Power Meters
08/2010 Index
© 2010 Schneider Electric. All rights reserved. 79
INDEX
AC Power Measurement
3D kVA Measurement, 32
Consumption and Poor PF, 32
3-phase systems, 31
Auto-scroll
Within page group, column of pages and TURBO pages, 12
Block parameter address
B Phase RMS block, 55
Clear block, 63
Forward Integrated block, Reverse Integrated block, 57
Max Demand block, OLD Forward Integrated block, 59
Model Info block, 63
OLD Reverse Integrated block, OLD Total Integrated block, 60
Phase angle block, SETUP block, 61
Total Integrated block, Demand block, 58
Total RMS block, R phase RMS block, 55
Y Phase RMS block, 56
Clear
INTG, 23
MD, 24
Communication Test, 51
Connections
Connection diagram symbols, 43
Delta connection, 44
Fuse recommendations, 40
Open delta connection, 44
Single phase connection, 45
2-phase connection, 45
WYE/Star connection, 43
Data Address
Block parameter address, 53
Individual parameter address, 55
Data communication, 47
Daisy-chaining devices to the power meter, 48
Data formats and settings,49
Default display (View) page
Display lock and unlock, 12
Demand Power Calculation Methods
Auto - Sliding block, User - Fixed block, 26
Electrical installation, 38
Energy Integrator
Integrator overflow, OLD data register, 25
Front panel
Kilo, Mega, Giga and negative indicators, 9
LED display, Load bar, 8
INTR, 25
Keys
Left, Right, Up, Down keys, 10
Operation, 11
Maintenance and troubleshooting, 67
Mechanical Installation, 35
Panel considerations and Environment, 36
on.h, 25
Parameters with PM1000 series power meters,14
PM1000 Series Menu hierarchy, 27
PM1000 series power meters product description, 7
PROG menu — Setup
List of setup parameters in View and Edit modes,20
Quick setup - While powering on, 17
Setup entry in View mode, 18
Setup entry in Edit mode, 19
Editing setup parameters, 21
Rear Panel, 13
Safety
Precautions,33
Symbols, 3
SIM (simulation) mode, 73
Technical specifications, 16
TURBO Key, 10

PM1000 Series Power Meters PLSED309039EN Index 08/2010
80 © 2010 Schneider Electric. All rights reserved.

Schneider Electric Industries SAS 35, rue Joseph Monier CS 30323 F - 92506 Rueil-Malmaison Cedex For technical support: [email protected] (00) + 1 250 544 3010
Contact your local Schneider Electric sales representative for assistance or go to www.schneider-electric.com.
PowerLogic and ION Enterprise are either trademarks or registered trademarks of Schneider Electric.
Electrical equipment should be installed, operated, serviced, and maintained only by qualified personnel. No responsibility is assumed by Schneider Electric for any consequences arising out of the use of this material.
© 2010 Schneider Electric All Rights Reserved v03.04.d15