Embed Size (px)
Citation preview

Powering Remedial Systems in Massachusetts
NEWMOA “Moving Toward More Sustainable Remediation”
Wednesday, December 4, 2013 – Dayville, CT Thursday, December 5, 2013 – Westford, MA
Thomas M. Potter
MADEP’s Acting Clean Energy Director
12/04-05/2013

Source: Groundwater Pump and Treat Systems: Summary of Selected Cost and Performance Information at Superfund-financed Sites, 2001
State Lead Groundwater Pump and Treat Systems
2
After 10 yrs states perform O&M Baird O&M similar to POTW or municipal 21E or Brownfield
12/04-05/2013

• Former Chemical Manufacturing Facility
Operated from 1912 to 1983 (70 years)
Located in Holbrook, MA – 32 Acres
• Site Listed on NPL in 1983
Baird & McGuire Facility, circa 1983Baird & McGuire Facility, circa 1983
Baird & McGuire History
3
12/04-05/2013

1986 ROD: Groundwater, Soil, Sediment
• Incineration of Soils and River Sediments
• From 1995 to 1998
• 248,000 cubic yards of soil & sediment incinerated (12.5 acres of soil)
• Residual ash buried on site (300 cubic yards failing TCLP stabilized)
• Pump and Treat System
• Started 1993 to treat incineration dewatering and process flows
• Effluent discharge to infiltration basins
• EPA RSE done in 2001 and upgrades completed in 2004
• Transferred to state (MassDEP) in 2004
• MassDEP improvements on-going
• Monitoring SVOC, Pesticides and Arsenic
• Cleanup Levels set at drinking water standards, MCLs & State GW1
• LNAPL discovered in 1996 and recovery from 1999 to present
4
12/04-05/2013

1989 ROD: Cochato River Sediment
• Dredged in 1994
• Wetland Restoration
1990 ROD: Municipal Water Supply
• Reopening of old well field to replace lost supply planned
• ESD issued in 2003 to expand existing water capacity at the Upper Reservoir/Great Pond
Site Map and Site Features
5
12/04-05/2013

Remediation – 1996 to 2006*
* Treatment must achieve groundwater restoration at drinking water standards, MCLs and GW1
B
F
A
A) Incinerator & Restored Wetland B) Groundwater Treatment Plant C) Bauer, Inc. D) Excavation E) Backfilled Incinerated Ash F) Cochato River
E D
F
B
C
A
6
12/04-05/2013

Arsenic 2004 to 2010 (blue area above MCL of 10 ug/l)
2004 2010 2010 arsenic investigation
7
12/04-05/2013

State Operation of Treatment System Since 2004 Concerned with plant operations, site conditions, cost, energy and GHG
• Significant Cost Reductions through Automation and Reduction in Staff, Elimination of On-Site Laboratory and Reduction of Process and Site Monitoring - 2004 to 2006
• Energy Efficiency Opportunity Study (SAIC for MassDEP) – 2006
• Utility Audits Phase One, National Grid (lights and sensors, VFDs on extraction, bio-clarifier, influent, filter press pumps) – 2008
• Carbon Footprint Analysis and CHP/GWSHP Study (US EPA OSRTI and MassDEP ) – 2009
• Utility Audits Phase Two, National Grid (VFD on blower, energy efficient blower motor) – 2010
• Feasibility Study of Third-Party Financing of 500 kW Solar PV to Provide All Electricity Needs for the P&T Facility (possibly GWSHP) with Power Purchase Agreement – 2012
• Optimization Study (US EPA and MassDEP) Assess Remaining Duration of Clean-up and Alternatives to Pump & Treat – 2013
• Replacement and Relocation of Extraction Wells to Treat Arsenic Contamination – On-going
8
12/04-05/2013

Metals Removal System and Neutralization
(4.25 HP)
Solids Handling 6 HP plus transport
Extraction System & Flow Equalization
120 gpm
(10.5 HP)
Bio Tanks Used as Inefficient Air Strippers
(45 HP)
Pressure Filters
(11.5 HP)
GAC (68,000 lbs/year)
(0.5 HP)
Effluent Tank and Discharge to Infiltration Galleries
(3 HP)
Off Gas Treatment 5 HP & 3,000 lbs GAC/yr
Average motor horsepower indicated in parentheses
Treatment Process Flow
9
12/04-05/2013
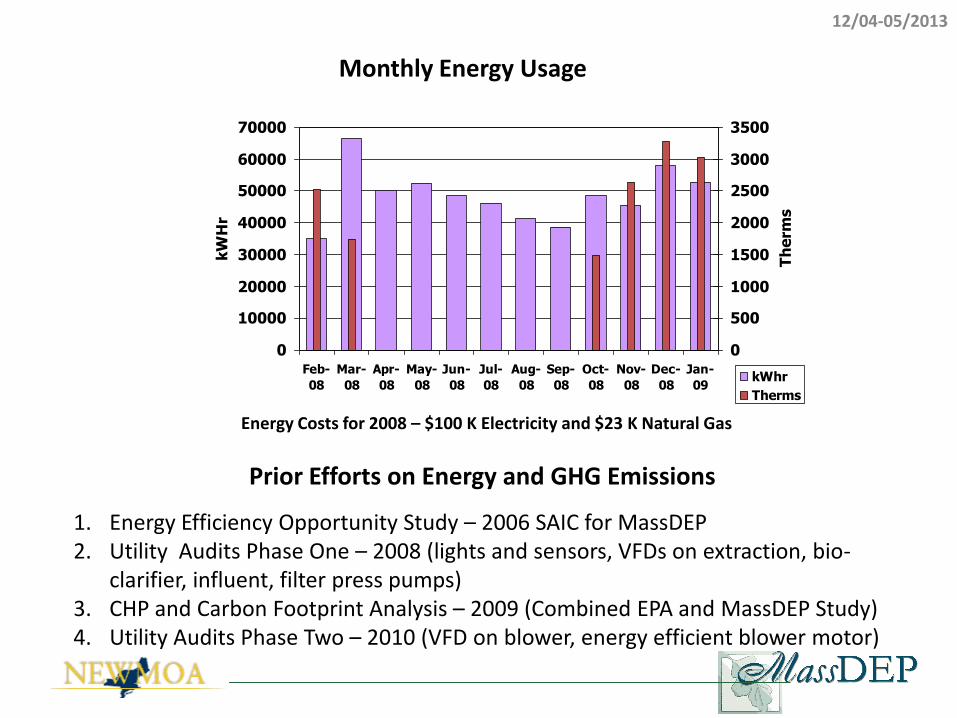
Monthly Energy Usage
0
10000
20000
30000
40000
50000
60000
70000
Feb-
08
Mar-
08
Apr-
08
May-
08
Jun-
08
Jul-
08
Aug-
08
Sep-
08
Oct-
08
Nov-
08
Dec-
08
Jan-
09
kWHr
0
500
1000
1500
2000
2500
3000
3500
Therms
kWhr
Therms
Prior Efforts on Energy and GHG Emissions
1. Energy Efficiency Opportunity Study – 2006 SAIC for MassDEP 2. Utility Audits Phase One – 2008 (lights and sensors, VFDs on extraction, bio-
clarifier, influent, filter press pumps) 3. CHP and Carbon Footprint Analysis – 2009 (Combined EPA and MassDEP Study) 4. Utility Audits Phase Two – 2010 (VFD on blower, energy efficient blower motor)
Energy Costs for 2008 – $100 K Electricity and $23 K Natural Gas
12/04-05/2013

11
Why Solar Baird? Continuation of On-Going Efforts Climate Registry Information System MassDEP 2008 Report GHG Emissions Report
1. GHG Reductions – 13% PV, 17% PV and GWSHP 2. Potential for Savings -Third Party Financing
12/04-05/2013

Third Party Financing Model of Solar at Baird&McGuire
Utility Net Metering Sells Electricity
PPA – Power Purchase Agreement
Interconnection Agreements
Payment
Electricity
12
SREC Prices ACP Ceiling Spot Market Clearinghouse Floor 0.28 $/kWhr
12/04-05/2013

Investigation of Solar PV for Meeting all Energy Needs at Baird Net Metering
Solar Carve Out Program Third-Party Financing Model for Solar no up front capital expenditure potential savings on energy from day one
• Examined the Size of Available Area (GIS) and Used IMBY NREL Solar Estimator and DOER Financial Spreadsheet • Issued an Request For Information to Gauge Interest • Funded Feasibility Study to Verify Assumptions and Expected Benefits, and Obtain Support for Power Purchase Agreement (PPA) and Procurement • PPA Duration – remaining duration of the remedy? alternatives to P&T? Questions lead to Optimization Study completed May 2013
13
12/04-05/2013
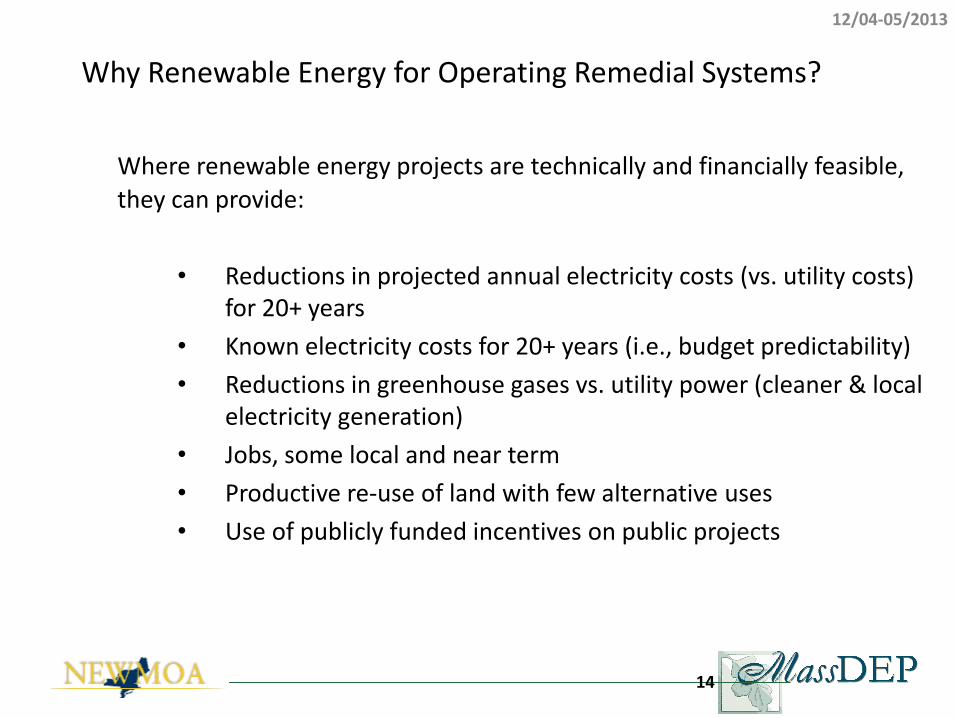
Why Renewable Energy for Operating Remedial Systems?
Where renewable energy projects are technically and financially feasible,
they can provide:
• Reductions in projected annual electricity costs (vs. utility costs) for 20+ years
• Known electricity costs for 20+ years (i.e., budget predictability)
• Reductions in greenhouse gases vs. utility power (cleaner & local electricity generation)
• Jobs, some local and near term
• Productive re-use of land with few alternative uses
• Use of publicly funded incentives on public projects
14
12/04-05/2013

Main Feasibility Study Topics
• How technical and financial feasibility review was conducted
• Results in benefits and risks of solar PV project at Baird & McGuire
• Tips for performing renewable energy feasibility reviews on contaminated sites
15
12/04-05/2013

How: Going from Land Availability through Technical & Financial Feasibility
• Is there enough land to (a) produce a feasible project, and (b) meet
the economic and environmental goals of the site owner/operator?
• If no, stop there OR find off-site project that can serve site and/or community via community net metering
• If yes,
• Size and design the system to optimize electricity production, cost, and/or local materials (allowing for remediation access)
• Determine preferred ownership structure
• Third-party ownership brings access to federal tax benefits, among other features
• Calculate project costs for different contract lengths
• Review & mitigate project risks
• SREC price risk can be a significant factor in many states
16
12/04-05/2013

How: Site Limitations Wetlands – 100 ft buffer Cochato River – 200 ft buffer 100 year Floodplain Property Ownership – PRP Setbacks and Easements Remedy and Contamination
17
12/04-05/2013

How: Establish Optimum Solar Array Size (502.32 kWDC) to Match On-Site Electricity Consumption
400,000
450,000
500,000
550,000
600,000
650,000
700,000
1 3 5 7 9 11 13 15 17 19 21 23 25 27 29
Annual Electricity
(kWh)
Year of Solar Project Operation
On-Site Electricity Consumption On-Site Solar Electricity Output
Note: On-site electricity consumption would increase with use of groundwater source heat pump for heating; solar array size could increase to match
18
12/04-05/2013

Replaced 3950 W Existing Lights High Pressure Sodium with 961 W LED Operation time 10 hrs/day Electricity savings 10,910 kWhr per year ~1.7% of total annual load Cost Savings 1,637 $/year
Outside Lighting Upgrade Project (Update)
19
12/04-05/2013

How: Design Optimum Solar Array on Site
Note: The seven red circles on the layout are monitoring wells
20
•Land Contours •Shading •Remediation Access •System Components
12/04-05/2013

How: Financial Feasibility
• 626,900 kWh of output in year 1, degrading by 0.5% annually
• 14.25% capacity factor in year 1
• Local measurements of sunlight at site
• Custom system design
• System output from NREL System Advisor Model (SAM)
• System costs from then-recent bids for 500 kWDC ground mounted systems using comparable equipment: $3,914/kW including interconnection study & sales tax, or $1.97 million total system cost
• Third-party financed using “power purchase agreement” (PPA) and net metering (eliminating some charges)
• Calculated PPA electricity rate for host (MassDEP) that provided sufficient (10% on equity) return for owner – DOER Financial Spreadsheet
• Assumed current federal solar incentives (investment tax credit and MACRS accelerated depreciation) stay in place
• Several additional assumptions using industry norms
21
12/04-05/2013

Harwich 02645 561.440 TBD Not Operational 7/23/2013 Information not yet provided No Cost Data No Cost Data
Tyngsborough 01879 555.000 TBD Not Operational 7/23/2013 INO Electrical Service Inc. $1,554,000.00 $2.80
Tisbury 02568 542.300 TBD Not Operational 7/23/2013 Information not yet provided No Cost Data No Cost Data
Edgartown 02539 541.200 TBD Not Operational 7/23/2013 Information not yet provided No Cost Data No Cost Data
Tewksbury 01876 535.000 TBD Not Operational 6/28/2013 The Green Stop, LLC $1,070,000.00 $2.00
Duxbury 02332 532.730 TBD Not Operational 7/23/2013 Information not yet provided No Cost Data No Cost Data
Acushnet 02745 516.220 TBD Not Operational 7/23/2013 Beaumont Solar Co. $1,367,983.00 $2.65
Northampton 01060 507.200 TBD Not Operational 6/28/2013 Nexamp, Inc. No Cost Data No Cost Data
Lancaster 01523 501.000 TBD Not Operational 7/23/2013 Aslan Electric Inc. $2,000,000.00 $3.99
Canton 02021 470.250 TBD Not Operational 5/10/2013 Florence Electric $1,676,306.00 $3.56
Fall River 02731 466.900 TBD Not Operational 7/23/2013 ESI $1,400,000.00 $3.00
Lee 01238 465.740 TBD Not Operational 4/17/2013 Broadway Electrical Company No Cost Data No Cost Data
Barnstable 02601 462.550 TBD Not Operational 4/17/2013 Broadway Electrical Company No Cost Data No Cost Data
Beverly 01915 461.160 TBD Not Operational 7/23/2013 Altantic Boston Construction, Inc. $1,844,000.00 $4.00
Recent Installation Costs (Update) DOER Spreadsheet Sensitive to Installation Costs
22
12/04-05/2013

Results: Economics
PPA Contract Length
Lifetime Net Present Value (NPV) Savings
to Site
% Savings to Site vs. Projected Utility Costs
10 years $69K 9%
15 years $279K 24%
20 years $438K 27%
25 years $654K 32%
30 years $887K 35%
Note: Results are very sensitive to Massachusetts Solar Renewable Credit (SREC) price ($.285/kWh for first 10 years, which is net auction floor) and conventional utility price (4%/yr escalation) assumptions, panel degradation, O&M costs, etc. Update: SREC II Program – proposed declining SREC pricing and SREC factors for market sectors
23
12/04-05/2013

Results: Emissions Reductions
• During first year of solar PV system operation (626 MWh):
• 518,328 pounds of CO2
• 48 pounds of CH4
• 9 pounds of N2O
• During 20 years of solar PV system operation (11,960 MWh, accounting for performance degradation against constant utility fuel mix):
• 9,902,880 pounds of CO2
• 921 pounds of CH4
• 179 pounds of N2O
~ 10 million lbs of CO2eq
24
Source: Climate Registry Information System emissions data for Baird & McGuire and emissions calculations do not consider life-cycle emissions of solar PV system production
12/04-05/2013

Results: Jobs
• During Construction and Installation:
• ~ 18 FTE Jobs on this ~ $2 million capital project
• Assumed (8 x 60 kW) inverters from Solectria (HQ in Lawrence, MA) and mounting system from Panel Claw (HQ in North Andover, MA)
• Sharp crystalline-silicon panels (Buy American-compliant, manufactured in Tennessee)
• Annual O&M: 0.1 to 0.2 FTE Jobs
25
Note: Modeled using NREL Jobs and Economic Development Impact (JEDI) tool.
12/04-05/2013

Project Risks System Owner
• Liability protections
• System access/control
• Massachusetts SREC market
• Utility interconnection/permitting time
• National cost of solar (modules & federal tax incentives)
System Host (MassDEP)
• Inflexibility of long-term contract
• Net metering & conventional electricity rates
• Site damage during construction and operations
• Owner default
• Soft costs (professional labor) for feasibility and procurement
Note: Some of the risks can be mitigated in the PPA contract, while others are market based and cannot be easily mitigated
26
12/04-05/2013

Tips: Overall
• Understand, and ideally improve, the electricity situation on-site before considering renewable energy supply
• High-quality data from the site are essential
• See example categories on next page
• Understand differences between direct ownership and third-party contracts
• Document each step – paves the way for procurement of successful projects and replication of the feasibility study
• Don’t reinvent the wheel
• US EPA Re-Powering America
• US DOE/NREL
• MassDEP & MassDOER
27
12/04-05/2013

THANK YOU!
Thomas M. Potter Massachusetts Department of Environmental Protection Bureau of Waste Site Cleanup Acting Clean Energy Director MassDEP, One Winter Street, 6th Fl Boston, MA 02108 617-292-5628 [email protected]
Mass Department of Environmental Protection (MassDEP) Clean Energy Results Program: http://www.mass.gov/dep/cleanenergy.htm Mass Department of Energy Resources (DOER) http://www.mass.gov/eea/grants-and-tech-assistance/guidance-technical-assistance/agencies-and-divisions/doer/ Massachusetts Clean Energy Center (CEC) http://masscec.com/
12/04-05/2013
28

29
RPS Solar Carve-Out Program v1.0
Key Scenario Definitions
Entry Cells Scenario A: Non-Taxable Rebate - Assumes that the state rebate is non-taxable, but is subtracted from the cost basis for purposes of determining tax credits and accelerated depreciation.
Calculation Cells (Not for Entry) Scenario B: Taxable Rebate - Assumes that the state rebate is taxable, but is not subtracted from the cost basis for purposes of determining tax credits and accelerated depreciation.
Both Scenarios assume that the project owner can use both federal and state tax benefits
Select Taxable or Non-Taxable Entity Taxable Taxable 1 2 3 4 5 6
Non-Taxable Tax Assumptions
Project and Customer Cost Assumptions Federal Tax Rate 35%
Solar Photovoltaic System Size 502320 Watts (DC STC) State Tax Rate 8%
Total System Cost/Watt 3.914$ $/Watt (DC STC) Effective Tax Rate 40%
Total System Cost 1,965,872.00$ Federal Tax Credit 30%
State Tax Deduction 100%
CEC Rebate Assumptions 5 Year Accelerated Depreciation Schedule (MACRS) 20.00% 32.00% 19.20% 11.52% 11.52% 5.76%
Rebate$ per/Watt -$ $/Watt (DC STC) Depreciation 20.00% 32.00% 19.20% 11.52% 11.52% 5.76%
Total Rebate Asset Basis
Gross Cost 1,965,872$
Rebate -$
Less 50% of Federal Tax Credit (294,881)$
Project Performance and Savings/ Cost Assumptions
Annual Net Capacity Factor 14.24667% kW (DC STC) to kWh AC Asset Basis 1,670,991$
Annual Production Degradation 0.50% % Financing Assumptions
Project Life 10 Years % Financed w/ Cash 100% Cash
Depreciation Life 10 Years % Financed w/ Loan 0%
Electricity Revenue (Avoided Costs) 0.0901$ $/kWh Loan Interest Rate 7.00% Loan
Electricity Revenue (Avoided Costs) Annual Adjustor 4.0% % Loan Period 20 Years (must be equal to or less than project life)
Solar Renewable Energy Certificate (SREC) Auction Price 0.285$ $/kWh Net Cost 1,965,872$
SREC Auction Opt-In Term 10 Years (must be equal to or less than project life) Customer Discount Rate 10.00%
SREC Revenue Annual Adjustor 0.0% % Loan -$
SREC Contract Price $/kWh
SREC Contract Term Years (must be equal to or less than project life)
Annual Operations and Maintenance Cost Factor 37.00$ $/kW/Year
Annual Operations and Maintenance Cost 18,586$ $/Year
Annual Operations and Maintenance Adjustor 3.0% % Solar Project Financial Analysis Summary
Future Inverter Replacement Cost 0.30$ $/Watt (DC STC) Net Present Value 250$
Inverter Life, Replace Every X Years 16 Year (must be equal to or less than project life) Simple Payback (100% Cash only) Year 6
Estimated Return on Equity 10.01%
Solar Photovoltaic Project Simple Financial Model
DATA ENTRY AND FINANCIAL SUMMARY
12/04-05/2013
30
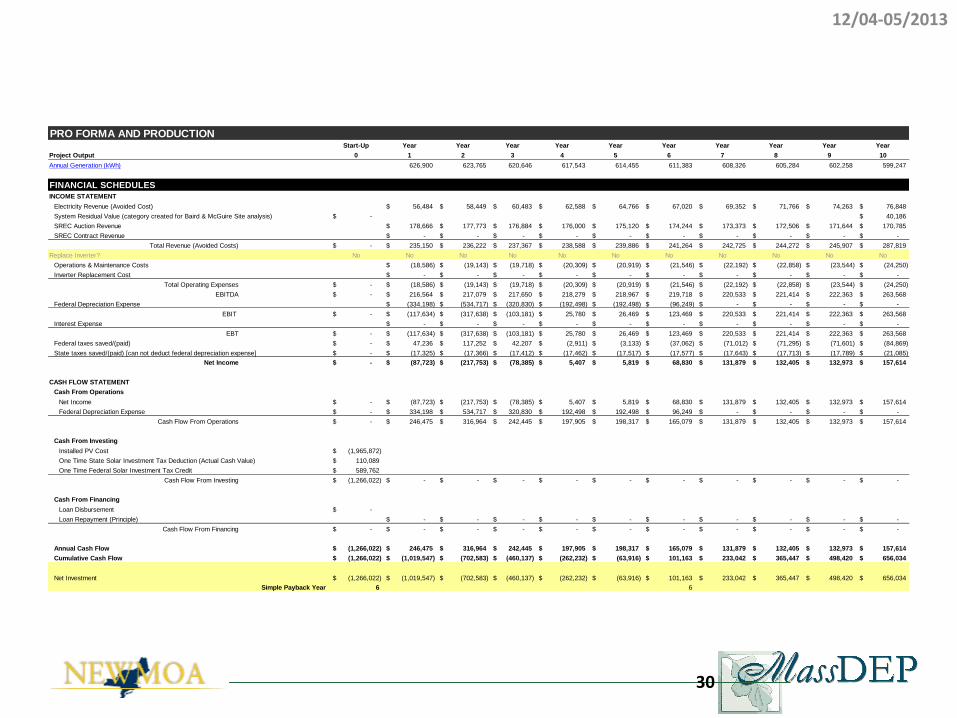
Start-Up Year Year Year Year Year Year Year Year Year Year
Project Output 0 1 2 3 4 5 6 7 8 9 10
Annual Generation (kWh) 626,900 623,765 620,646 617,543 614,455 611,383 608,326 605,284 602,258 599,247
FINANCIAL SCHEDULES
INCOME STATEMENT
Electricity Revenue (Avoided Cost) 56,484$ 58,449$ 60,483$ 62,588$ 64,766$ 67,020$ 69,352$ 71,766$ 74,263$ 76,848$
System Residual Value (category created for Baird & McGuire Site analysis) -$ 40,186$
SREC Auction Revenue 178,666$ 177,773$ 176,884$ 176,000$ 175,120$ 174,244$ 173,373$ 172,506$ 171,644$ 170,785$
SREC Contract Revenue -$ -$ -$ -$ -$ -$ -$ -$ -$ -$
Total Revenue (Avoided Costs) -$ 235,150$ 236,222$ 237,367$ 238,588$ 239,886$ 241,264$ 242,725$ 244,272$ 245,907$ 287,819$
Replace Inverter? No No No No No No No No No No No
Operations & Maintenance Costs (18,586)$ (19,143)$ (19,718)$ (20,309)$ (20,919)$ (21,546)$ (22,192)$ (22,858)$ (23,544)$ (24,250)$
Inverter Replacement Cost -$ -$ -$ -$ -$ -$ -$ -$ -$ -$
Total Operating Expenses -$ (18,586)$ (19,143)$ (19,718)$ (20,309)$ (20,919)$ (21,546)$ (22,192)$ (22,858)$ (23,544)$ (24,250)$
EBITDA -$ 216,564$ 217,079$ 217,650$ 218,279$ 218,967$ 219,718$ 220,533$ 221,414$ 222,363$ 263,568$
Federal Depreciation Expense (334,198)$ (534,717)$ (320,830)$ (192,498)$ (192,498)$ (96,249)$ -$ -$ -$ -$
EBIT -$ (117,634)$ (317,638)$ (103,181)$ 25,780$ 26,469$ 123,469$ 220,533$ 221,414$ 222,363$ 263,568$
Interest Expense -$ -$ -$ -$ -$ -$ -$ -$ -$ -$
EBT -$ (117,634)$ (317,638)$ (103,181)$ 25,780$ 26,469$ 123,469$ 220,533$ 221,414$ 222,363$ 263,568$
Federal taxes saved/(paid) -$ 47,236$ 117,252$ 42,207$ (2,911)$ (3,133)$ (37,062)$ (71,012)$ (71,295)$ (71,601)$ (84,869)$
State taxes saved/(paid) [can not deduct federal depreciation expense] -$ (17,325)$ (17,366)$ (17,412)$ (17,462)$ (17,517)$ (17,577)$ (17,643)$ (17,713)$ (17,789)$ (21,085)$
Net Income -$ (87,723)$ (217,753)$ (78,385)$ 5,407$ 5,819$ 68,830$ 131,879$ 132,405$ 132,973$ 157,614$
CASH FLOW STATEMENT
Cash From Operations
Net Income -$ (87,723)$ (217,753)$ (78,385)$ 5,407$ 5,819$ 68,830$ 131,879$ 132,405$ 132,973$ 157,614$
Federal Depreciation Expense -$ 334,198$ 534,717$ 320,830$ 192,498$ 192,498$ 96,249$ -$ -$ -$ -$
Cash Flow From Operations -$ 246,475$ 316,964$ 242,445$ 197,905$ 198,317$ 165,079$ 131,879$ 132,405$ 132,973$ 157,614$
Cash From Investing
Installed PV Cost (1,965,872)$
One Time State Solar Investment Tax Deduction (Actual Cash Value) 110,089$
One Time Federal Solar Investment Tax Credit 589,762$
Cash Flow From Investing (1,266,022)$ -$ -$ -$ -$ -$ -$ -$ -$ -$ -$
Cash From Financing
Loan Disbursement -$
Loan Repayment (Principle) -$ -$ -$ -$ -$ -$ -$ -$ -$ -$
Cash Flow From Financing -$ -$ -$ -$ -$ -$ -$ -$ -$ -$ -$
Annual Cash Flow (1,266,022)$ 246,475$ 316,964$ 242,445$ 197,905$ 198,317$ 165,079$ 131,879$ 132,405$ 132,973$ 157,614$
Cumulative Cash Flow (1,266,022)$ (1,019,547)$ (702,583)$ (460,137)$ (262,232)$ (63,916)$ 101,163$ 233,042$ 365,447$ 498,420$ 656,034$
Net Investment (1,266,022)$ (1,019,547)$ (702,583)$ (460,137)$ (262,232)$ (63,916)$ 101,163$ 233,042$ 365,447$ 498,420$ 656,034$
Simple Payback Year 6 6
PRO FORMA AND PRODUCTION
12/04-05/2013

31
Calendar Year 2013 2014 2015 2016 2017 2018 2019 2020 2021 2022
PPA Project Year 1 2 3 4 5 6 7 8 9 10
Projected Electricity
Consumption at GWTF Main
Meter (kWh): 625,603 625,603 625,603 625,603 625,603 625,603 625,603 597,451 597,451 597,451
Projected All-In Utility Electricity
Rate ($/kWh): $0.11850 $0.12324 $0.12817 $0.13330 $0.13863 $0.14417 $0.14994 $0.15594 $0.16218 $0.16866
Projected Utility Electricity Costs
(in absence of solar project) ($): $74,134 $77,099 $80,183 $83,391 $86,726 $90,195 $93,803 $93,165 $96,892 $100,768
Projected Solar Output On-Site
(kWh): 626,900 623,766 620,647 617,543 614,456 611,383 608,327 605,285 602,258 599,247
Assumed Solar PPA Rate
($/kWh): $0.09010 $0.09370 $0.09745 $0.10135 $0.10540 $0.10962 $0.11401 $0.11857 $0.12331 $0.12824
Projected Solar PPA Payments
by Site ($): $56,484 $58,449 $60,483 $62,588 $64,766 $67,020 $69,352 $71,766 $74,263 $76,848
Projected Physical Utility
Electricity Supply Directly Offset
by Solar Output (kWh): 125,121 125,121 125,121 125,121 125,121 125,121 125,121 119,490 119,490 119,490
Projected Loss Rate on Offset
Utility Electricity Supply ($/kWh): $0.01170 $0.01217 $0.01265 $0.01316 $0.01369 $0.01423 $0.01480 $0.01540 $0.01601 $0.01665
Projected Losses to Site on
Utility Electricity Supply Directly
Offset ($): $1,464 $1,522 $1,583 $1,647 $1,713 $1,781 $1,852 $1,840 $1,913 $1,990
Projected Net Metered Electricity
(kWh): 500,482 500,482 500,482 500,482 500,482 500,482 500,482 477,961 477,961 477,961
Projected Loss Rate on Net
Metered Electricity ($/kWh): $0.02000 $0.02080 $0.02163 $0.02250 $0.02340 $0.02433 $0.02531 $0.02632 $0.02737 $0.02847
Projected Losses to Site on Net
Metering Utility Credits ($): $10,010 $10,410 $10,826 $11,259 $11,710 $12,178 $12,665 $12,579 $13,082 $13,606
Projected Annual Solar
Overproduction vs. Site
Electricity Consumption (kWh): 1,297 0 0 0 0 0 0 7,834 4,807 1,796
Projected Avoided Utility Cost
Wholesale Rate ($/kWh): $0.03885 $0.04040 $0.04202 $0.04370 $0.04545 $0.04727 $0.04916 $0.05112 $0.05317 $0.05530
Projected Avoided Utility
Wholesale Payments to Site ($): ($50) $0 $0 $0 $0 $0 $0 ($400) ($256) ($99)
Assumed Replacement REC
Charges to Site ($): $0 $0 $0 $0 $0 $0 $0 $0 $0 $0
Projected Total Electricity Costs
at Site with Solar PV Project ($): $67,907 $70,382 $72,893 $75,494 $78,189 $80,979 $83,870 $85,784 $89,003 $92,344
Projected Savings (Loss) on
Solar PPA vs. Conventional
Utility Supply ($): $6,227 $6,717 $7,290 $7,896 $8,538 $9,216 $9,933 $7,381 $7,888 $8,424
Estimated Cost Savings to the Baird & McGuire Site from On-Site Solar PV PPA
Estimated Groundwater Treatment Facility (GWTF) Electricity Costs (without solar project)
Estimated Groundwater Treatment Facility (GWTF) Electricity Costs (with solar project)
Difference between GWTF's Estimated Utility Electricity Costs and Costs with Solar Project
12/04-05/2013