Embed Size (px)
Citation preview

April 2013
POWERING INCENTIVE COMPENSATION
HOW UTILITIES PAY FOR PERFORMANCE

FORWARD
Steven Hall & Partners
Dear Clients, Colleagues & Friends,
Paying executives for performance is not a new concept. Companies have been
following this mantra for years. Recently, however, companies have been subject to
increased scrutiny from shareholders and other stakeholders with respect to the type of
performance for which these companies are paying their top executives.
This project was born out of the desire to determine how different industries pay for
performance. We selected the utility industry as the focus of our first study due to the
unique characteristics of the industry, including the many stakeholders and regulatory
constraints under which the industry must operate. The fact that many utilities are held
to operating performance standards and have a portion or all of their revenues and
profits regulated by federal, state and local municipalities creates a situation that is
distinct from other public companies. As organizations that serve the public, the
compensation paid to executives is under the microscope of public scrutiny to a far
greater degree than other industries. Furthermore, interest rates, modest growth
expectations and their impact on stock price further influence the design of incentive
plans.
We invite you to review the study and share it with your colleagues. Should you have
any questions or comments while reviewing this information, we hope you won’t
hesitate to continue the dialogue by contacting us.
Regards,
Steven Hall & Partners
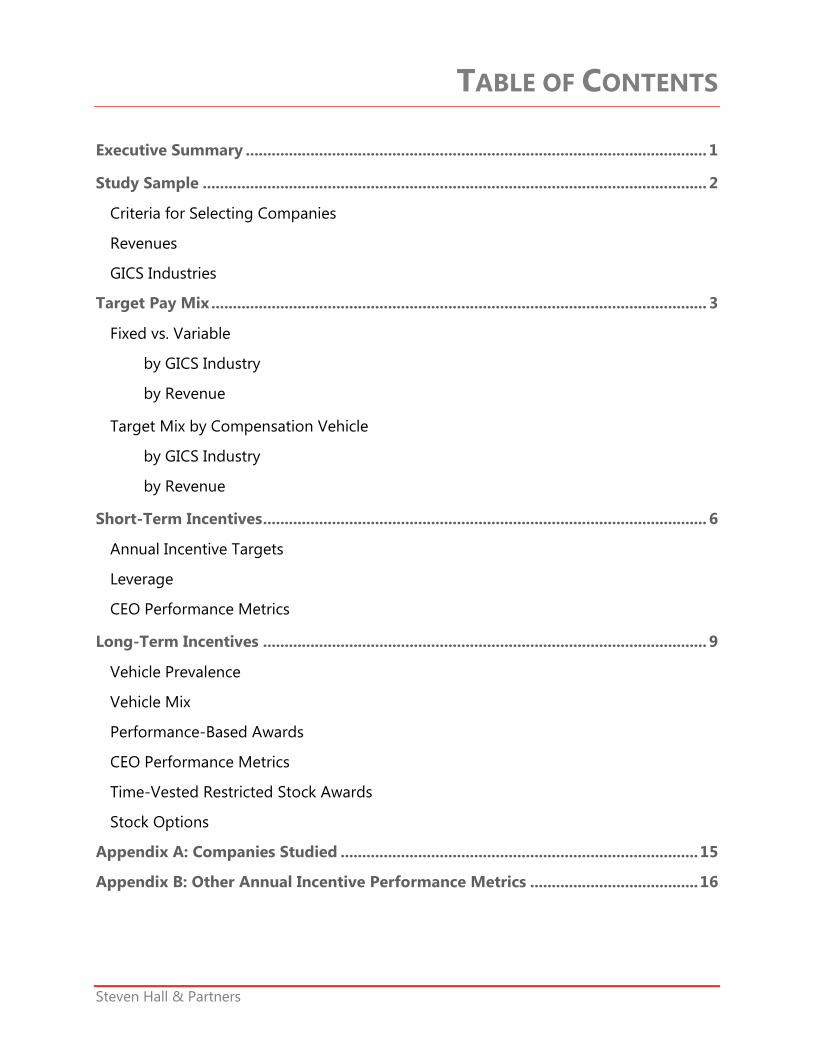
TABLE OF CONTENTS
Steven Hall & Partners
Executive Summary ........................................................................................................... 1
Study Sample ..................................................................................................................... 2
Criteria for Selecting Companies
Revenues
GICS Industries
Target Pay Mix ................................................................................................................... 3
Fixed vs. Variable
by GICS Industry
by Revenue
Target Mix by Compensation Vehicle
by GICS Industry
by Revenue
Short-Term Incentives ....................................................................................................... 6
Annual Incentive Targets
Leverage
CEO Performance Metrics
Long-Term Incentives ....................................................................................................... 9
Vehicle Prevalence
Vehicle Mix
Performance-Based Awards
CEO Performance Metrics
Time-Vested Restricted Stock Awards
Stock Options
Appendix A: Companies Studied ................................................................................... 15
Appendix B: Other Annual Incentive Performance Metrics ....................................... 16

EXECUTIVE SUMMARY
Steven Hall & Partners Page | 1
Steven Hall & Partners recently completed a study of incentive compensation programs at 73 of the largest utility companies (revenues greater than $500 million) in the United States utilizing data from 2012 proxy statements. We found that utility companies are unique from their non-utility counterparts in the way they pay their top executives.
In part due to the predictability of the business, we find the way they pay their top executives is less variable, with a higher percentage of total compensation being paid in the form of base salary than we see in other industries. We also found the focus on performance for utility companies is broader than among many other public companies. In addition to earnings and shareholder returns, utilities must also consider non-financial performance metrics such as safety and customer service, which we found to be prevalent among the companies studied. Additionally, our study found that:
• FIXED VS. VARIABLE COMPENSATION
− Target CEO compensation is 26% fixed (i.e. base salary) and 74% variable
.. Target compensation for other named executive officers (“NEOs”) is 38% fixed and 62% variable
− Companies with larger revenues pay more long-term incentive compensation and companies with smaller revenues pay more fixed compensation as a percentage of total compensation
• SHORT-TERM INCENTIVES
− Median annual incentive targets for CEOs equaled 100% of base salary
.. Median target range for other NEOs is 50% to 70% of base salary
− 97% of the companies studied used at least one earnings metric
.. 69% of these companies disclosed they weighted earnings 50% or greater for CEO short-term performance
• LONG-TERM INCENTIVES
− 93% of companies granted performance-based awards to the CEO
.. Performance-based awards comprised the largest portion of long term compensation for both the CEO and other NEOs
.. A majority of CEO long-term performance awards are based on total shareholder return (TSR) performance relative to a comparator group
− 56% of companies granted time-vested restricted stock to the CEO
− 25% of companies granted option awards to the CEO

STUDY SAMPLE
Steven Hall & Partners Page | 2
Criteria for Selecting Companies
For this study, we analyzed companies in the GICS utility sector that are publicly traded on US-based securities exchanges with revenues greater than $500 million. Seventy-three companies met these criteria. A list of the companies included in the study can be found in Appendix A. We analyzed the 2012 annual proxy filings and 10-Ks of these 73 utility companies to collect the data used for this study.
Revenues
Revenues ranged from $501 million to $19 billion, with median revenue equal to $3 billion. The largest number of companies, 37%, had revenues between $1 billion to $3 billion, followed by 20% with revenues greater than $10 billion.
GICS Industries
The study sample was largely comprised of electric utilities (38%) and multi-utilities (29%). The breakdown of companies according to GICS industry is as follows:
Revenue Distribution
$1 - $3 Billion37%
$5 - $10 Billion11%
$3 - $5 Billion18%
>$10 Billion20%
<$1 Billion14%
Number of % of Median ($ Millions) Median TSRGICS Industry Companies Total Revenue Net Income 1-Yr 3-Yr 5-Yr
Electric Utilities 28 38% $2,631 $176 +20% +14% +4%
Gas Utilities 17 23% $1,887 $115 +11% +17% +10%
Independent Power Producers & Energy Traders
4 6% $6,347 -$66 -19% -16% -20%
Multi-Utilities 21 29% $4,709 $387 +24% +15% +7%
Water Utilities 3 4% $712 $143 +1% +5% +2%
Total Sample 73 $2,943 $177 +18% +15% +6%
Note: Data relates to proxy reporting period.
TARGET PAY MIX
Steven Hall & Partners Page | 3
Fixed vs. Variable
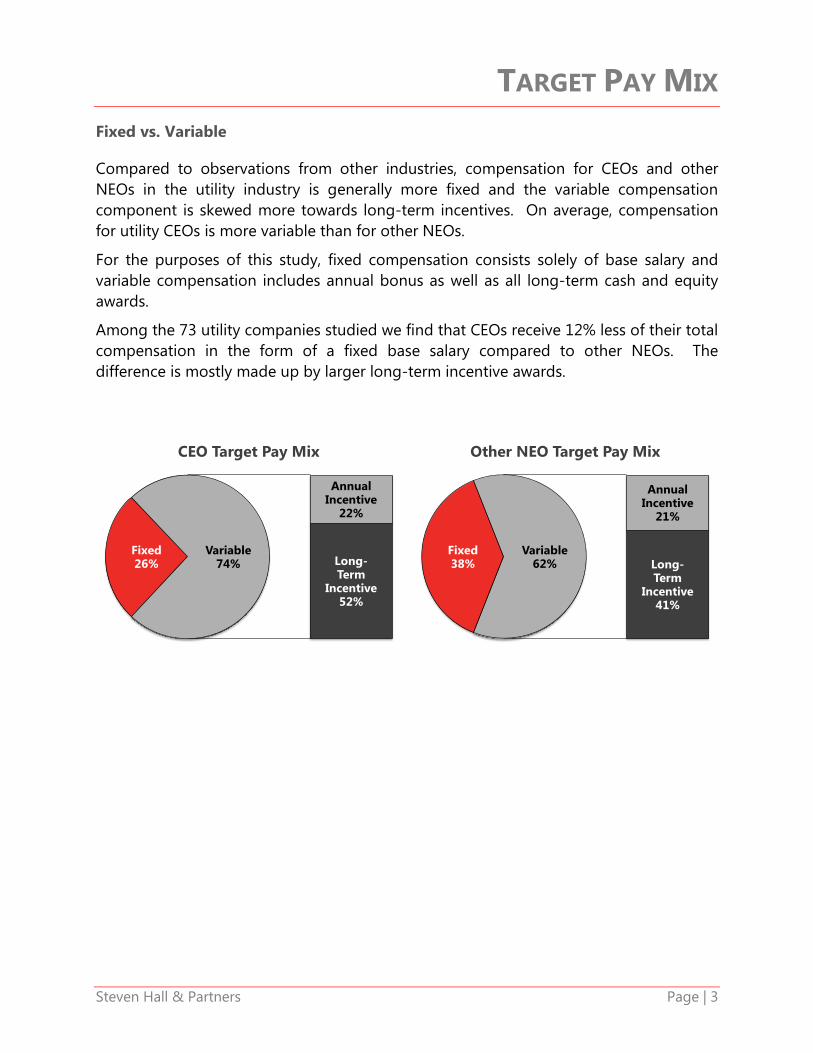
Compared to observations from other industries, compensation for CEOs and other NEOs in the utility industry is generally more fixed and the variable compensation component is skewed more towards long-term incentives. On average, compensation for utility CEOs is more variable than for other NEOs.
For the purposes of this study, fixed compensation consists solely of base salary and variable compensation includes annual bonus as well as all long-term cash and equity awards.
Among the 73 utility companies studied we find that CEOs receive 12% less of their total compensation in the form of a fixed base salary compared to other NEOs. The difference is mostly made up by larger long-term incentive awards.
Fixed26%
Annual Incentive
22%
Long-Term
Incentive52%
Variable74%
CEO Target Pay Mix
Fixed38%
Annual Incentive
21%
Long-Term
Incentive41%
Variable62%
Other NEO Target Pay Mix
TARGET PAY MIX
Steven Hall & Partners Page | 4
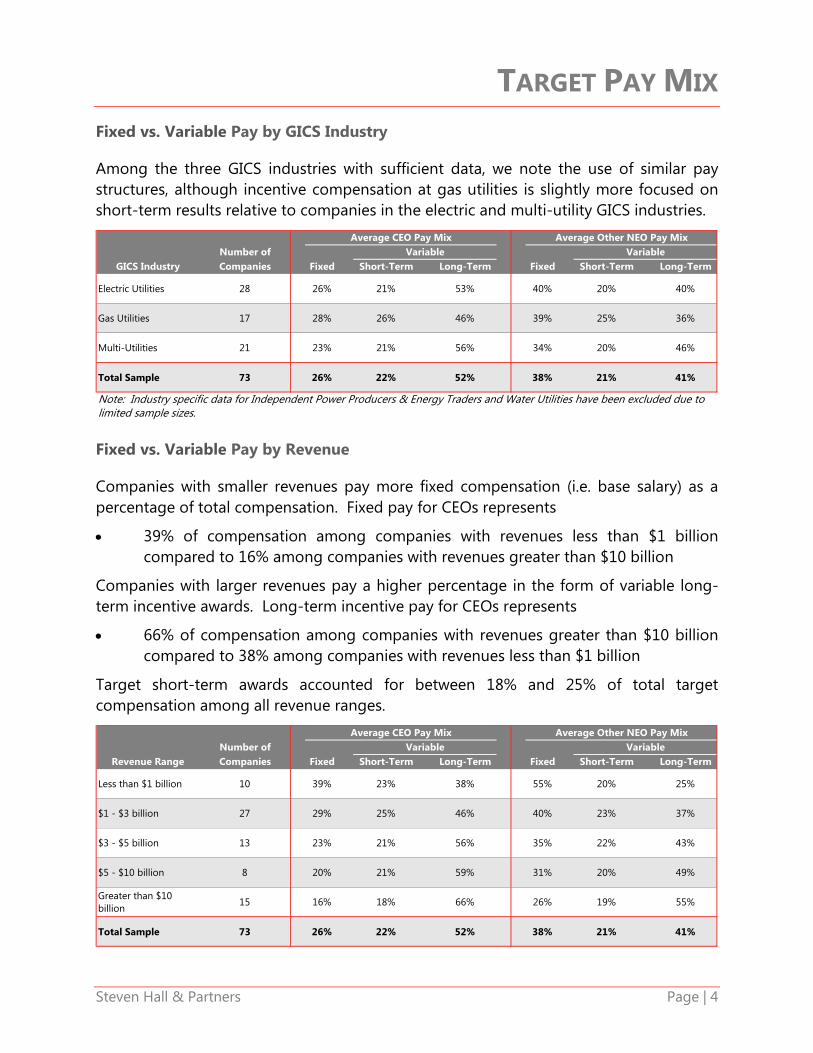
Fixed vs. Variable Pay by GICS Industry
Among the three GICS industries with sufficient data, we note the use of similar pay structures, although incentive compensation at gas utilities is slightly more focused on short-term results relative to companies in the electric and multi-utility GICS industries.
Fixed vs. Variable Pay by Revenue
Companies with smaller revenues pay more fixed compensation (i.e. base salary) as a percentage of total compensation. Fixed pay for CEOs represents
• 39% of compensation among companies with revenues less than $1 billion compared to 16% among companies with revenues greater than $10 billion
Companies with larger revenues pay a higher percentage in the form of variable long-term incentive awards. Long-term incentive pay for CEOs represents
• 66% of compensation among companies with revenues greater than $10 billion compared to 38% among companies with revenues less than $1 billion
Target short-term awards accounted for between 18% and 25% of total target compensation among all revenue ranges.
Average CEO Pay Mix Average Other NEO Pay MixNumber of Variable Variable
GICS Industry Companies Fixed Short-Term Long-Term Fixed Short-Term Long-Term
Electric Utilities 28 26% 21% 53% 40% 20% 40%
Gas Utilities 17 28% 26% 46% 39% 25% 36%
Multi-Utilities 21 23% 21% 56% 34% 20% 46%
Total Sample 73 26% 22% 52% 38% 21% 41%
Note: Industry specific data for Independent Power Producers & Energy Traders and Water Utilities have been excluded due to limited sample sizes.
Average CEO Pay Mix Average Other NEO Pay MixNumber of Variable Variable
Revenue Range Companies Fixed Short-Term Long-Term Fixed Short-Term Long-Term
Less than $1 billion 10 39% 23% 38% 55% 20% 25%
$1 - $3 billion 27 29% 25% 46% 40% 23% 37%
$3 - $5 billion 13 23% 21% 56% 35% 22% 43%
$5 - $10 billion 8 20% 21% 59% 31% 20% 49%
Greater than $10 billion
15 16% 18% 66% 26% 19% 55%
Total Sample 73 26% 22% 52% 38% 21% 41%

TARGET PAY MIX
Steven Hall & Partners Page | 5
Target Pay Mix by Compensation Vehicle
The largest component of target CEO compensation is long-term performance-based awards (36%), followed by base salary (26%). For the other NEOs the results are reversed with base salary comprising the largest portion (38%) of target total compensation, followed by long-term performance-based awards (28%).
Target Pay Mix by GICS Industry
Target Pay Mix by Revenue
26%
38%
22%
21%
36%
28%
11%
9%
5%
4%
CEO
OtherNEOs
BaseSalary
AnnualIncentive
Performance-Based Awards
Time-VestedRestrictedStock
StockOptions
CEO Other NEOs
Base Target Performance Time-Vested Stock Base Target Performance Time-Vested Stock
GICS Industry Salary Bonus Awards R/S Options Salary Bonus Awards R/S Options
Electric Utilities 26% 21% 34% 14% 5% 40% 20% 28% 8% 4%
Gas Utilities 28% 26% 33% 5% 8% 39% 25% 25% 5% 6%
Multi-Utilities 23% 21% 46% 9% 1% 34% 20% 37% 8% 1%
Total Sample 26% 22% 36% 11% 5% 38% 21% 28% 9% 4%
Note: Industry specific data for Independent Power Producers & Energy Traders and Water Utilities have been excluded due to limited sample sizes.
CEO Other NEOs
Base Target Performance Time-Vested Stock Base Target Performance Time-Vested Stock
Revenue Range Salary Bonus Awards R/S Options Salary Bonus Awards R/S Options
Less than $1 billion 39% 23% 22% 14% 2% 55% 20% 13% 9% 3%
$1 - $3 billion 29% 25% 36% 6% 4% 40% 23% 27% 7% 3%
$3 - $5 billion 23% 21% 40% 13% 3% 35% 22% 31% 10% 2%
$5 - $10 billion 20% 21% 41% 12% 6% 31% 20% 34% 10% 5%
Greater than $10 billion
16% 18% 42% 14% 10% 26% 19% 38% 9% 8%
Total Sample 26% 22% 36% 11% 5% 38% 21% 28% 9% 4%
SHORT-TERM INCENTIVES
Steven Hall & Partners Page | 6
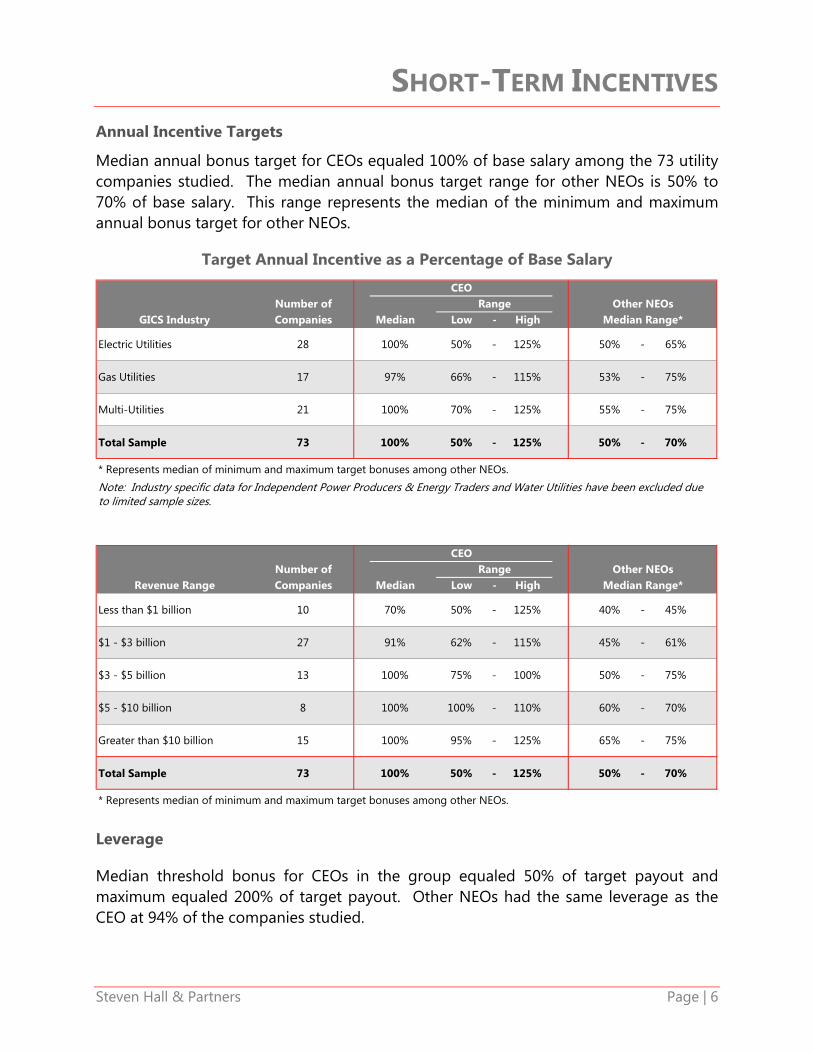
Annual Incentive Targets
Median annual bonus target for CEOs equaled 100% of base salary among the 73 utility companies studied. The median annual bonus target range for other NEOs is 50% to 70% of base salary. This range represents the median of the minimum and maximum annual bonus target for other NEOs.
Target Annual Incentive as a Percentage of Base Salary
Leverage
Median threshold bonus for CEOs in the group equaled 50% of target payout and maximum equaled 200% of target payout. Other NEOs had the same leverage as the CEO at 94% of the companies studied.
CEONumber of Range Other NEOs
GICS Industry Companies Median Low - High Median Range*
Electric Utilities 28 100% 50% - 125% 50% - 65%
Gas Utilities 17 97% 66% - 115% 53% - 75%
Multi-Utilities 21 100% 70% - 125% 55% - 75%
Total Sample 73 100% 50% - 125% 50% - 70%
* Represents median of minimum and maximum target bonuses among other NEOs.
CEONumber of Range Other NEOs
Revenue Range Companies Median Low - High Median Range*
Less than $1 billion 10 70% 50% - 125% 40% - 45%
$1 - $3 billion 27 91% 62% - 115% 45% - 61%
$3 - $5 billion 13 100% 75% - 100% 50% - 75%
$5 - $10 billion 8 100% 100% - 110% 60% - 70%
Greater than $10 billion 15 100% 95% - 125% 65% - 75%
Total Sample 73 100% 50% - 125% 50% - 70%
* Represents median of minimum and maximum target bonuses among other NEOs.
Note: Industry specific data for Independent Power Producers & Energy Traders and Water Utilities have been excluded due to limited sample sizes.

SHORT-TERM INCENTIVES
Steven Hall & Partners Page | 7
CEO Performance Metrics
CEO bonuses are typically based on more than one performance metric, with the most common number of metrics being four.
Earnings were by far the most popular and highest weighted among all performance metrics observed in CEO annual incentive plans.
However, unlike many other public companies, the next three prevalent metrics were non-financial in nature, focused on metrics unique to the utility industry. They are safety, other utility related metrics and customer satisfaction.
Among the companies studied: • 97% of the companies studied used at least one earnings metric
− 69% of these companies disclosed they weighted earnings 50% or greater for CEO short-term performance
− Median weight of earnings metric equaled 60% • Non-financial performance metrics were also prevalent for CEOs
− Safety – 42% of companies − Other Utility Related – 35% of companies
.. Includes metrics such as system-wide performance, regulatory & legislative advocacy, operational excellence, power supply availability & reliability, etc.
− Customer Satisfaction – 34% of companies • A list of performance metrics comprising the Other Utility, Other Financial and
Other Non-Financial categories be found in Appendix B
17% 17% 15%
21%
14%
7% 6%3%
1 2 3 4 5 6 7 8
# of Performance Metrics in CEO Annual Incentive Plan

SHORT-TERM INCENTIVES
Steven Hall & Partners Page | 8
* Other Utility Related includes metrics such as system-wide performance, regulatory & legislative advocacy, operational excellence, power supply availability & reliability, etc.
97%
42%35% 34%
20% 17% 17% 17% 14% 13% 11% 10% 8%
CEO Performance Metric Prevalence
60%
10%20%
15%
25%20%
30%
8%
25%
10%
35%
20% 20%
Median CEO Performance Metric Weightings

LONG-TERM INCENTIVES
Steven Hall & Partners Page | 9
Over the last several years the structure of long-term compensation for all public companies, including utilities, has evolved. Granting only stock options and time-based restricted stock awards have given way to granting a majority of equity in the form of performance awards. The utility industry has exemplified this change. Nearly all the companies studied grant performance-based awards, which account for 69% of target long-term incentive compensation, on average.
We also note the changing role time-vested restricted stock is playing in long-term compensation. While over one-half of companies we analyzed granted time-vested restricted stock to the CEO and other NEOs, the value of these awards accounted for less than one-quarter of long-term vehicles awarded, on average.
Vehicle Prevalence
Of the 73 utility companies studied, 71 granted long-term incentive awards to their CEO and 72 granted awards to at least one other NEO. Among those granting long-term awards:
• 93% of companies granted performance-based awards to the CEO and other NEOs
• 56% of companies granted time-vested restricted stock to the CEO
− 57% for other NEOs
• 25% of companies granted option awards to the CEO
− 26% for other NEOs
93%
56%
25%
93%
57%
26%
Performance Based Awards Time-Vested RestrictedStock
Stock Options
Prevalence of Annual Long-Term Incentive Vehicles
CEO Other NEOs
LONG-TERM INCENTIVES
Steven Hall & Partners Page | 10
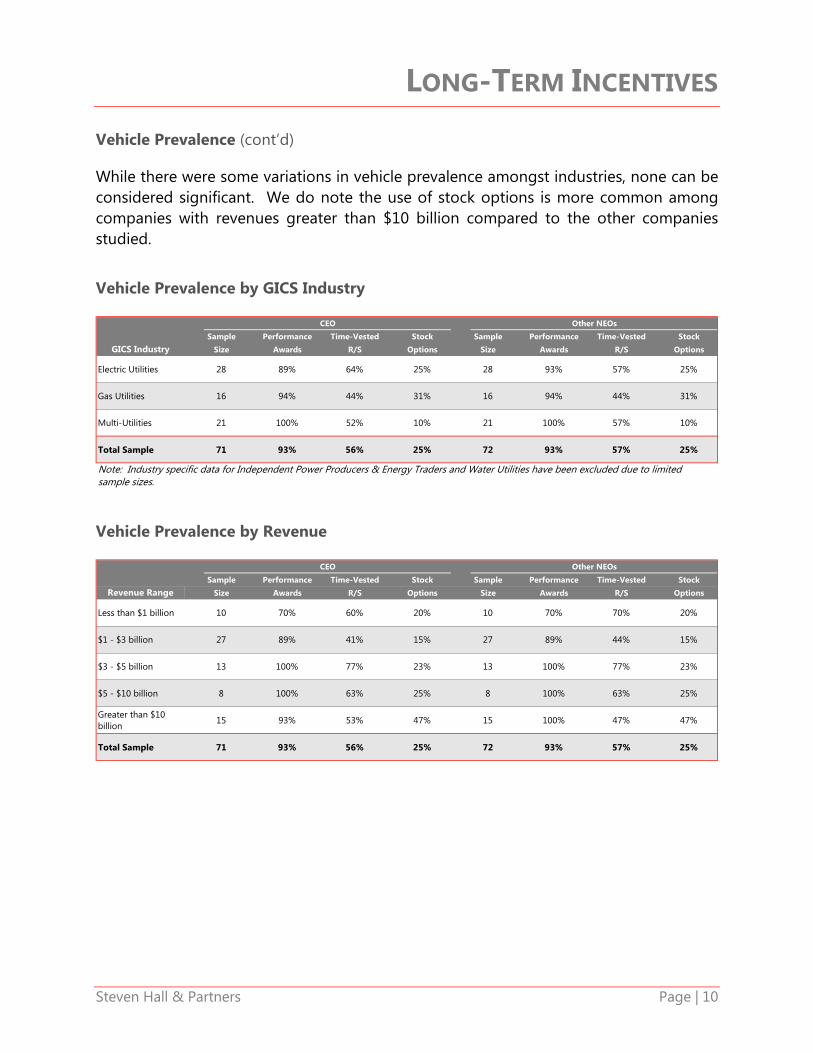
Vehicle Prevalence (cont’d)
While there were some variations in vehicle prevalence amongst industries, none can be considered significant. We do note the use of stock options is more common among companies with revenues greater than $10 billion compared to the other companies studied.
Vehicle Prevalence by GICS Industry
Vehicle Prevalence by Revenue
CEO Other NEOs
Sample Performance Time-Vested Stock Sample Performance Time-Vested Stock
GICS Industry Size Awards R/S Options Size Awards R/S Options
Electric Utilities 28 89% 64% 25% 28 93% 57% 25%
Gas Utilities 16 94% 44% 31% 16 94% 44% 31%
Multi-Utilities 21 100% 52% 10% 21 100% 57% 10%
Total Sample 71 93% 56% 25% 72 93% 57% 25%
Note: Industry specific data for Independent Power Producers & Energy Traders and Water Utilities have been excluded due to limited sample sizes.
CEO Other NEOs
Sample Performance Time-Vested Stock Sample Performance Time-Vested Stock
Revenue Range Size Awards R/S Options Size Awards R/S Options
Less than $1 billion 10 70% 60% 20% 10 70% 70% 20%
$1 - $3 billion 27 89% 41% 15% 27 89% 44% 15%
$3 - $5 billion 13 100% 77% 23% 13 100% 77% 23%
$5 - $10 billion 8 100% 63% 25% 8 100% 63% 25%
Greater than $10 billion
15 93% 53% 47% 15 100% 47% 47%
Total Sample 71 93% 56% 25% 72 93% 57% 25%

LONG-TERM INCENTIVES
Steven Hall & Partners Page | 11
Vehicle Mix
Among the companies studied, performance-based awards represented the largest portion of long term compensation, comprising 69% of long-term compensation for both the CEO and other NEOs. The remainder of long-term compensation was delivered through time-vested restricted stock (21% of long-term compensation) and stock options (10%). We found consistency across most utility industries, with multi-utilities exhibiting a slightly heavier weighting in performance awards. We also found consistency across revenue ranges except for the smallest companies (less than $1 billion) where the prevalence of time-vested restricted stock was notably higher. Vehicle Mix by GICS Industry
Vehicle Mix by Revenue
CEO Avg Other NEOs
Sample Performance Time-Vested Stock Sample Performance Time-Vested Stock
GICS Industry Size Awards R/S Options Size Awards R/S Options
Electric Utilities 25 64% 27% 9% 26 69% 21% 10%
Gas Utilities 13 71% 12% 17% 13 71% 12% 17%
Multi-Utilities 21 82% 17% 1% 21 80% 19% 1%
Total Sample 65 69% 21% 10% 67 69% 21% 10%
Note: Industry specific data for Independent Power Producers & Energy Traders and Water Utilities have been excluded due to limited sample sizes.
CEO Avg Other NEOs
Sample Performance Time-Vested Stock Sample Performance Time-Vested Stock
Revenue Range Size Awards R/S Options Size Awards R/S Options
Less than $1 billion 10 58% 37% 5% 10 53% 37% 10%
$1 - $3 billion 20 77% 13% 10% 22 74% 18% 8%
$3 - $5 billion 12 72% 23% 5% 12 72% 23% 5%
$5 - $10 billion 8 70% 20% 10% 8 70% 20% 10%
Greater than $10 billion
15 64% 21% 15% 15 70% 15% 15%
Total Sample 65 69% 21% 10% 67 69% 21% 10%
NEO LTI Mix
Performance-BasedAwards
69%
Time-VestedRestricted Stock
21%
StockOptions
10%

LONG-TERM INCENTIVES
Steven Hall & Partners Page | 12
Performance-Based Awards
Performance-based awards are the largest single component of target compensation for the majority of utility CEOs. An overwhelming majority of utility companies base the payout of these awards on performance over a three-year period. Performance awards are settled in shares of company stock at a large majority of companies.
When compared to short-term incentive plans, long-term performance plans tend to have fewer performance metrics. By far the most common metric utilized is total shareholder return relative to other utilities.
Among the companies granting performance-based awards to CEOs and other NEOs:
• 91% use a three-year performance period to calculate the final amount paid out
• 79% payout performance awards in stock
− 9% in cash
− 12% in a combination of both cash and stock
Stock79%
Cash9%
Both12%
Payout Type
3%
91%
1%
5%
4
3
2
1
Year
s
Performance Period
LONG-TERM INCENTIVES
Steven Hall & Partners Page | 13
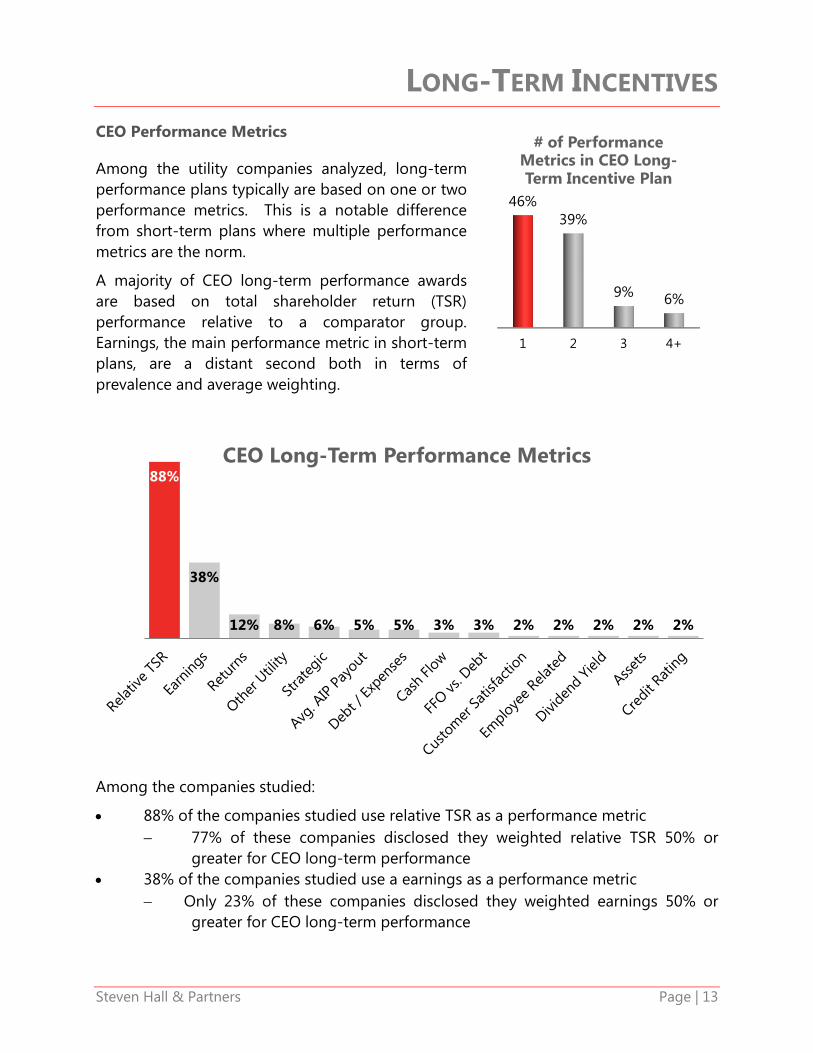
CEO Performance Metrics
Among the utility companies analyzed, long-term performance plans typically are based on one or two performance metrics. This is a notable difference from short-term plans where multiple performance metrics are the norm.
A majority of CEO long-term performance awards are based on total shareholder return (TSR) performance relative to a comparator group. Earnings, the main performance metric in short-term plans, are a distant second both in terms of prevalence and average weighting.
Among the companies studied:
• 88% of the companies studied use relative TSR as a performance metric − 77% of these companies disclosed they weighted relative TSR 50% or
greater for CEO long-term performance • 38% of the companies studied use a earnings as a performance metric
− Only 23% of these companies disclosed they weighted earnings 50% or greater for CEO long-term performance
88%
38%
12% 8% 6% 5% 5% 3% 3% 2% 2% 2% 2% 2%
CEO Long-Term Performance Metrics
1 2 3 4+
46%39%
9% 6%
# of Performance Metrics in CEO Long-Term Incentive Plan

LONG-TERM INCENTIVES
Steven Hall & Partners Page | 14
Time-Vested Restricted Stock Awards
Full value time-vested awards granted to executives had a median vesting period of three years with the majority of awards vesting in increments, or having “step” vesting.
• 56% of awards granted with step vesting schedules • 44% awards granted with cliff vesting schedules
Stock Options
Stock options granted to executives in the study had: • A median vesting period of three years • Majority of awards granted with step vesting
− 90% of options were granted with step vesting schedules − 10% of options were granted with cliff vesting schedules
• A median term of ten years
Step56%
Cliff44%
Vesting Type
7%
15%
78%
5
4
3
Year
s
Time Until Fully Vested
Step90%
Cliff10%
Vesting Type
5%
24%
66%
5%
5
4
3
0
Year
s
Time Until Fully Vested

APPENDIX A
Steven Hall & Partners Page | 15
Companies Studied
AES Corporation New Jersey Resources CorporationAGL Resources Inc. NextEra Energy, Inc.ALLETE, Inc. NiSource Inc.Alliant Energy Corporation Northeast UtilitiesAmeren Corporation Northwest Natural Gas CompanyAmerican Water Works Co. NorthWestern CorporationAmeriGas Partners, L.P. NRG Energy, Inc.Aqua America Inc. NV Energy, Inc.Atmos Energy Corporation OGE Energy Corp.Avista Corporation ONEOK, Inc.Black Hills Corporation Otter Tail CorporationCalifornia Water Service Group Pepco Holdings, Inc.CenterPoint Energy, Inc. PG&E CorporationCH Energy Group, Inc. Piedmont Natural Gas Company, Inc.Cleco Corporation Pinnacle West Capital CorporationCMS Energy Corporation PNM Resources Inc.Consolidated Edison, Inc. Portland General Electric CompanyDominion Resources, Inc. PPL CorporationDTE Energy Company Public Service Enterprise Group Inc.Dynegy Inc. Questar CorporationEdison International SCANA CorporationEl Paso Electric Company Sempra EnergyEmpire District Electric Company South Jersey Industries, Inc.Entergy Corporation Southern Company, TheExelon Corporation Southwest Gas CorporationFerrellgas Partners, L.P. Star Gas Partners, L.P.FirstEnergy Corp. Suburban Propane Partners, L.P.GenOn Energy, Inc. TECO Energy, Inc.Great Plains Energy Incorporated UGI CorporationHawaiian Electric Industries, Inc. UIL Holdings CorporationIDACORP, Inc. UNS Energy Corp.Integrys Energy Group, Inc. Vectren CorporationITC Holdings Corporation Westar Energy, Inc.Laclede Group, Inc. WGL Holdings Inc.MDU Resources Group, Inc. Wisconsin Energy CorporationMGE Energy, Inc. Xcel Energy, Inc.National Fuel Gas Company

APPENDIX B
Steven Hall & Partners Page | 16
Other Utility Metrics
Customer growth Reduction in thirdparty claims Customer loyalty Regulatory & legislative advocacy Customer value ReliabilityGas leaks response time Response timeOperational excellence SafetyOSHA incident rate SAIDI Power supply availability SAIFI Production volume Service qualityProductivity System performanceProcess improvements
Other Financial Metrics
Capital expenditures Merger synergiesCapital projects earned value Restructure balance sheetDividend rate Total debt
Other Non-Financial Metrics
Balanced scorecard summary objectives Quality performance factorCommitment to stakeholders Subjective assesmentCommunity involvement
Other Annual Incentive Performance Metrics

About Steven Hall & Partners
Steven Hall & Partners is an independent compensation consulting firm, specializing exclusively in the areas of executive compensation, board compensation, non-profit compensation and related governance issues. By focusing solely on this critical and complex segment of the human resources arena, we are able to provide our clients with the highest quality expertise and best counsel available on a practical basis. For more information, please visit www.shallpartners.com and follow us on Twitter @SHallPartners.
Contacting Steven Hall & Partners
This publication is provided by Steven Hall & Partners as a service to clients and colleagues. The information contained in this publication should not be construed as legal, tax or accounting advice. If you have not received this publication directly from us, you may obtain a copy of any past or future related publications from Kathie Mulroe (212-488-5400; [email protected]).