Embed Size (px)
Citation preview

Powerful Women: Does Exposure Reduce Bias?
Lori Beaman, Raghabendra Chattopadhyay, Esther Duflo,
Rohini Pande and Petia Topalova∗
Abstract
We exploit random assignment of gender quotas across Indian village councils to investi-
gate whether having a female chief councillor affects public opinion towards female leaders.
Villagers who have never been required to have a female leader prefer male leaders and per-
ceive hypothetical female leaders as less effective than their male counterparts, when stated
performance is identical. Exposure to a female leader does not alter villagers’ taste pref-
erence for male leaders. However, it weakens stereotypes about gender roles in the public
and domestic spheres and eliminates the negative bias in how female leaders’ effectiveness
is perceived among male villagers. Female villagers exhibit less prior bias, but are also less
likely to know about or participate in local politics; as a result, their attitudes are largely
unaffected. Consistent with our experimental findings, villagers rate their women leaders as
less effective when exposed to them for the first, but not second, time. These changes in
attitude are electorally meaningful: after 10 years of the quota policy, women are more likely
to stand for and win free seats in villages that have been continuously required to have a
female chief councillor.
∗The authors are from RWJ Berkeley and Northwestern, IIM Calcutta, MIT, Harvard and IMF respectively.The views expressed in this paper are those of the authors and do not implicate the International MonetaryFund, its management, or Executive Board. We thank Ash Center Harvard, Nike Foundation, MIT, YCIAS Yale,and UNICEF for funding, Alexandra Cirone, Catherine Lee and Kudzai Takavarasha for research assistance, andPrasid Chakraborty and the SRG team for outstanding fieldwork. We also thank Abhijit Banerjee, Tim Besley,Shawn Cole, Dominic Leggett and numerous seminar participants for comments.
1

1 Introduction
In July 2006, women accounted for 17 percent of parliamentarians world-wide, and a woman
headed the government in only seven countries (UNICEF, 2007). These gender disparities do
not reflect legal restrictions – women can vote, support candidates and run for office in almost
every country. Rather, many suggest that in both rich and poor countries, women’s access to
public office is restricted by voter and party bias in favor of male politicians.
At the same time, such bias, even if present, may be malleable. For this reason, policy-makers
often emphasize the importance of an initial cohort of female politicians and argue that once
voters learn that women are no less effective than male politicians, gender bias in politics will
diminish. This has led to more than a hundred countries introducing affirmative action policies
for women in public office, either by law or through voluntary actions of political parties, over
the last two decades (Krook, 2005; Dahlerup, 2006).1 While these policies have significantly
increased female representation in politics (Jones, 2004) and often altered subsequent policy-
making (Chattopadhyay and Duflo, 2004; Powley, 2007), little is known about their impact
on voter attitudes towards female leaders, despite the obvious importance of this question for
evaluating the overall effectiveness of quotas.
A large literature on public opinion formation suggests that low voter awareness on specific
issues can cause group stereotypes to play an important role in shaping voter preferences (Za-
ller, 1992; Huddy and Terkildsen, 1993). A widely discussed reason that explains why group
stereotypes may hinder the entry of women into politics is social norms which prescribe behavior
associating leadership activities with men (Akerlof and Kranton, 2000; Eagly and Karau, 2002).
Holding leader effectiveness across genders constant, such norms can cause voters to favor, and
elect, male candidates. Limited exposure to female leaders may, in turn, fuel biased perceptions
of female leader effectiveness.
While in many settings, exposure to members of another group creates “empathy,”2 the
extent to which mandated exposure to women leaders can alter social norms or perceptions1Details of quotas by country are available at http://www.quotaproject.org. Another rationale for affirmative
action is gender-specific policy preferences – if male and female leaders have different policy preferences, andfemale turnout is relatively low, then affirmative action can help ensure equal political voice for men and women.
2For example Boisjoly et al. (2006) show that students who were randomly assigned to an African-Americanroommate in college are more likely to sympathize with African-Americans and affirmative action.
1

of women’s ability is debated among academics and policymakers. Using international survey
data, Ingelhart and Norris (2003) document sex-biased attitudes towards roles in public life
across countries. They argue that these attitudes are difficult to change in the short run and
quotas, by violating voters’ sense of identity, may precipitate a backlash (Rudman and Fairchild,
2004). For instance, a quota-induced increase in female politicians may be perceived as reducing
the value of a traditionally male activity (Goldin, 1990) and /or as restricting voters’ choice
(Thernstrom and Thernstrom, 1997).
However, independent of their impact on voter tastes, quotas, by exposing voters to a female
leader, can improve the precision of voters’ information about the expected effectiveness of future
female leaders. Quotas could, therefore, reduce statistical discrimination. Unless women make
incompetent leaders (causing voters to update negatively), mandated exposure can improve the
perception of women leaders’ effectiveness simply by reducing the risk associated with electing
a woman.3
This paper provides direct evidence on these issues. To motivate our empirical analysis we
first use a simple voting model to show how, in an electoral setting, future male candidates
may systematically benefit from an initial voter preference for male leaders. Specifically, greater
exposure to male leaders improves voter ability to screen male candidates and as a result, causes
the expected effectiveness of male candidates to exceed that of their female counterparts if
voters are risk averse. Statistical discrimination against female leaders will reinforce the initial
taste bias and cause the stereotype that women make ineffective leaders to persist. In such a
setting, political reservation, by increasing voter exposure to female leaders, can reduce statistical
discrimination even when voter taste is unaffected.
In general, measuring how exposure changes voters’ attitudes vis-a-vis women leaders is dif-
ficult. Less biased voters are presumably also more likely to elect, and be exposed to, female
leaders.4 To address this concern, our empirical strategy exploits random variation in mandated
exposure to female leaders across village councils in the Indian state of West Bengal. Since
1998, one third of village council leader positions in this state have been randomly “reserved”3One reason why quotas could lead to less competent female leaders is if, as in Coate and Loury (1993), they
work less in anticipation of voter perceptions that quotas lead to less competent politicians being elected.4This is true even with affirmative action, since in most countries even when a law requires mandated repre-
sentation of women, parties can still decide where to field women candidates (Frechette, Maniquet, and Morelli).
2

for women in each election; in reserved councils only women can run for the position of leader.
This, combined with the passage of a significant period of time since the introduction of political
reservation (two electoral cycles, or ten years) makes West Bengal villages an ideal setting for
our empirical analysis. We compare villager attitudes towards hypothetical, and actual, women
leaders across councils which have been reserved for women once, twice, or never. Random allo-
cation of reservation implies that a difference in voter attitudes across reserved and unreserved
villages captures the causal effect of mandated exposure.
An important innovation of our study is the collection and use of detailed survey and ex-
perimental data on voters’ taste for female leaders and their perceptions of gender roles and
female leaders’ effectiveness. We examine explicit and implicit measures of voters’ tastes.5 Ex-
plicit tastes are captured by voters’ stated feelings towards the general idea of male and female
leaders, and implicit tastes by taste Implicit Association Tests (IATs) (Nosek et al., 2007). The
IAT is an experimental method now widely used in social psychology, which relies on the idea
that respondents who more easily pair two concepts in a rapid categorization task more strongly
associate those concepts. Our taste IAT is a computer-based double-categorization task which
examines the strength of respondents’ association between images of (anonymous) male and
female leaders and normative categories of good and bad. To measure gender-occupation stereo-
types we use an IAT which examines the strength of association between male and female names
and leadership and domestic tasks. Finally, to examine voter perceptions of leader effectiveness
we asked villagers to evaluate the effectiveness of hypothetical female and male leaders described
through vignettes and recorded speeches in which leader gender is experimentally manipulated.
Clearly, our measures of “taste” and “perception of effectiveness” remain imperfect: a vil-
lager’s perceptions of a potential leader’s effectiveness may influence his feelings towards the
idea of male and female leaders; conversely, the performance rating of a leader may be colored
by a villager’s general distaste for female leaders. That said, our maintained hypothesis is that
the general “feeling” variables remain more closely correlated with deep-seated tastes while the
specific “effectiveness” questions reflect voter perceptions of leader performance.
In villages that have never experienced political reservation, villagers, particularly men,
dislike the idea of female leaders. On a scale of 1 to 10, the average man rates his feeling towards5On the use of such measures, see Charles and Guryan (2007); Bertrand et al. (2005); Rooth (2007).
3

female leaders in general one whole point below those for male leaders in general. IAT measures
show that men are significantly more likely to associate male leaders with notions of “good”
relative to female leaders. They also perceive female leaders as less effective than male leaders.
The average male villager ranked the same speech and vignette describing a leader’s decision
0.05 standard deviations lower when the leader’s gender was experimentally manipulated to be
female (relative to male). Female villagers’ evaluation of hypothetical female leaders, while less
negative, is not statistically different from male villagers’.
Mandated exposure to a female leader does not affect villagers’ stated taste for male leaders.
Neither the “feeling” rating of leaders nor the taste IAT show increased approval of female
leaders in villages reserved for a female leader. However, among male villagers it weakens
the stereotype (as measured by the occupation IAT) that men are associated with leadership
activities and women with domestic activities. It also radically alters perceptions of female
leader effectiveness among male villagers. In the speech and vignette experiments, we find that
male villagers who have been required to have a female leader consider hypothetical female and
male leaders equally effective. This reduction in bias is absent among female villagers. We
provide evidence suggesting that a likely reason for this difference is the lower levels of political
knowledge, and exposure to local politics, among women.
Consistent with the experimental data, we find that prior exposure improves villagers’ evalua-
tion of their actual leader along multiple dimensions. Specifically, in villages where the leadership
position is reserved for the first time and only time in 2003, leader ratings by male villagers are
significantly lower relative to villages where the leader position has never been reserved. Despite
their poor evaluation, we show that first time female leaders deliver more public goods and take
less bribes than their male counterparts. The difference in ratings between men and women
leaders is absent in villages where the leader position is reserved for women for the second time
in 2003. We do not find prima facie evidence that female leaders in first time reserved villages
are differentially selected, or undertake different policies, than leaders elected in the second
round of reservation.6
Our results suggest that while deep preferences and social norms are difficult to erode,6The number of public goods provided by first time female leaders and women leaders in councils reserved for
the second time does not significantly differ. First and second time female leaders also have similar characteristicson average, and all women leaders are equally biased in favor of women in their policy actions.
4

affirmative action programs can significantly improve perceptions of female leader effectiveness
and reduce statistical discrimination against women in leadership positions. Finally, we find
striking evidence that political reservation leads to significant electoral gains for women in the
medium-run. In the recently concluded village council elections in May 2008, almost twice as
many women stood for election and won unreserved councillor positions in councils where the
chief councillor position had been reserved for women in the previous two elections, compared
to villages which had either never been reserved or reserved only once.
The rest of this paper is structured as follows. Section 2 provides a conceptual framework,
and Section 3 describes the data. Section 4 lays out the institutional context and our empirical
strategy. Section 5 reports the results, and Section 6 concludes.
2 Conceptual Framework
In most elections, voters make their choice while uncertain about the relative competence of the
available candidates. We use a simple model of statistical discrimination (which follows Aigner
and Cain, 1977) to illustrate that voter uncertainty may interact with an underlying voter
distaste for female leaders. The result is that female candidates are, on average, not elected and
negatively biased beliefs about their effectiveness as leaders persist. Political reservation can
play an important role in reducing the bias in beliefs.
Consider a single village council leadership election with the outcome determined by plurality
rule. Candidates differ in competence, e.g. ability to extract state resources for the village and
resolve disputes. Candidate i’s competence is given by ηi, where ηi = η + εi and εi ∼ N(0, σ2η).
We assume voters are risk averse and value candidate i’s effectiveness as f(ηi), where f ′(.) > 0
and f ′′(.) < 0. Risk aversion is a standard assumption in many political economy models.7 In
the context of village council elections, risk aversion is very plausible if we equate competence
with the resources a leader raises for the village and a villager’s utility is concave in the total
public resources he or she gets. An important implication of risk aversion is that voters penalize
politicians for whom they lack information.7The typical spatial voting model, which uses a quadratic utility function, implies risk aversion in voting. Risk
aversion is also commonly invoked to explain electoral outcomes such as split-ticket voting and the punishmentof ambiguous candidates.
5

Voter j’s utility from candidate i is defined as:
uij = f(ηi) + αmi + ωij , (1)
where mi is a male dummy which equals one if the candidate is male. We assume α > 0. This
can be interpreted as reflecting taste discrimination against women or a dislike for the policies
women implement. ωij ∼ N(0, σ2ω) is an i.i.d random voter and politician specific taste shock.
Let xi ∈ M,F represent candidate i’s gender. Before casting their vote, citizens observe
each candidate’s gender x, and a noisy signal of his/her competence: η̃ix = ηi + νix, where
νix ∼ N(0, σ2νx). In general, a difference in signal mean across genders is sufficient to cause
statistical discrimination (e.g. if voters have prior beliefs that women are less competent than
men, and these beliefs are self-fulfilling). However, to focus on the possibility that risk aversion
can cause women to suffer a “double penalty” (of statistical discrimination reinforcing taste
discrimination), we only allow the variance of the signal to differ across genders.
Voters select the candidate who maximizes their expected utility. The expectation of ηi given
x and η̃ix is given by
E(ηi|η̃ix, x) = η(1− γ) + η̃ixγ
where γ = σ2νx
σ2η+σ
2νx
. The error term in this equation is:
e = E(ηi|η̃ix, xi)− ηi =νiσ
2νx − εiσ2
η
σ2νx + σ2
η
,
which has variance
V (e) =σ2ησ
2νx
σ2η + σ2
νx
The variance is increasing in σ2νx. Since f(.) is concave, E[f(ηi)|η̃ix, xi], the expected leader
effectiveness, is declining in the variance of the signal on ability.
Consider the case where the signal on candidate of gender x is the prediction of a model
relating observed characteristics and actions Xi for previously observed leaders of gender x
to their competence: η̃ix = β̂xXi, where the coefficients are gender specific.8 If the model8This is a natural assumption, since men and women may differ in both their actions and characteristics.
While an assertive man may be an effective leader, being assertive may be a liability for a woman.
6

is estimated using Nx past leaders’ observed actions, then the standard errors of β̂x and the
standard deviation of the resulting prediction error will decrease with√Nx. Hence the variance
of the signal for a gender will decrease in the number of elected candidates (of that gender).
Taste discrimination, or a preference for the policies selected by men, will imply, for equal
expected competence, higher voter utility with a male leader (since α > 0). Female candidates
will be elected only in the few cases where the idiosyncratic taste shock is sufficiently favorable
for her among a majority of the population. Therefore, voters will see very few women lead
and have little basis to form a prediction of female politician effectiveness. In other words,
relative to the male candidate, the ability to extract information from a signal about the female
candidate will be weak and σ2νF will be very high, compared to σ2
νM .9 This causes statistical
discrimination: aside from any distaste for women leaders, risk averse voters will prefer male
candidates as the variance of their ability signal is lower (and so their expected effectiveness
is higher). This creates a vicious circle – a female candidate is less likely to be elected both
because voters have a distaste for women leaders, and because they are perceived as too risky.10
Political reservation increases Nf . This, in turn, improves the precision of voters’ estimate
of βF and reduces the variance of expected competence of future female leaders. Hence, for
similar levels of competence across genders, reservation will improve the relative evaluation of
the effectiveness of women leaders.
To summarize, if the pool of female candidates (and their investment in job-specific skills)
is unchanged by political reservation, then:
Political Reservation and Taste Discrimination: Taste discrimination, as captured by a
greater preference for male leaders (relative to female leaders), will be unchanged with political
reservation.
Political Reservation and Statistical Discrimination: Holding competence constant across9With a positive cost of running, presumably very few women will choose to run which will accentuate the
signal-extraction problem for female candidates.10The voter’s decision problem resembles the classic two-armed bandit problem (Bergemann and Valmiki, 2008).
The two arms are the male and female candidate pools, with unknown variance with respect to competence. Votersget new information on the distribution of competence within a gender only if they select a candidate from thatgender. Since the observations the voter uses to gain information and reduce the variance of the signal are also hisreward (in terms of selecting a leader), he must strike a balance between gaining rewards and gaining information.The median voter will combine information on the mean with beliefs about the variance of payoffs to maximizethe present discounted value of his payoff. He will favor exploiting information (i.e. choose the male candidatearm) if he is sufficiently risk averse, faces a finite time horizon or has a sufficiently high discount rate.
7

genders, political reservation will reduce statistical discrimination as measured by the difference
in the evaluation of female and male leader effectiveness.
The literature on affirmative action has identified two additional forces, which lie outside
our model. First, if political reservation worsens voters’ prior about the competence of women
leaders, then competent female candidates may respond either by under-investing in skills (Coate
and Loury, 1993), or by simply choosing not to stand. This effect, if present, would reduce the
predicted decline in statistical discrimination. Second, if voters react negatively to having their
voting choices constrained then political reservation may cause a backlash and lead to an increase
in taste discrimination against women (Thernstrom and Thernstrom, 1997).
The purpose of our model is to illustrate that statistical discrimination is a natural by-
product of taste discrimination when voters are risk averse. As mentioned earlier, we obtain very
similar predictions regarding the efficacy of political reservation if we assumed that the source
of statistical discrimination is biased voter priors about average female leader effectiveness.11
Our empirical analysis will not try to disentangle different forms of statistical discrimination.
The remainder of this paper uses detailed data on voter attitudes to test these two predictions
about the implications of political reservation. Below, we start by describing our data.
3 Data
Our data comes from West Bengal, a middle-income Indian state, where elected village councils
(Gram Panchayats, from now on, GP) have been an effective body of governance since 1978.
Between June 2006 and November 2007 we surveyed 495 villages spread across the 165 GPs in
Birbhum district in West Bengal (we randomly selected three villages per GP). In each surveyed
village we collected data on the quantity and quality of public good provision, and administered
household and individual surveys to a random sample of 15 households. These surveys, together
with Implicit Association Tests (IATs), form the main sources of our voter attitude measures.11Initial biased beliefs about average competence can exist, for example, if voters conclude that the lower levels
of education and wealth among female leaders (relative to male leaders) reflect lower effectiveness.
8
3.1 Measures of Voter Taste
We measure voters’ taste by their explicit and implicit feelings towards male and female leaders
as expressed in survey responses and in IATs. We collected these data for a random sample of
5 households per village.12
To ascertain respondents’ explicit taste for male and female leaders, we asked “on a ladder
which has steps from 1 to 10, how do you feel about a [X]” where X was (separately) a female
leader, a male leader, a female villager and a male villager. This question is adapted from the
“Feeling Thermometer” which has been widely used in the political science literature to produce
rank-orderings of parties and candidates (Keller and Mirer, 1974) and to measure partisan
affiliation (Alvarez, 1990; Weisberg, 1980).
We complement the explicit taste measures with taste IATs (Greenwald et al., 1998). An
IAT is a computerized test which aims to measure attitudes of which respondents may not be
explicitly cognizant. Over the last ten years IATs have been widely used (Nosek et al., 2007) in
various subfields in psychology, neuroscience, market research and, recently, economics.13
To measure implicit bias, an IAT uses a double-categorization task to measure the strength
of the association between two concepts. Words from two different series appear on the screen.
Consider the case where the two series are a series of male and female first names and a series
of good or bad adjectives. The respondent completes two test blocks. In the “stereotypical”
block male names and good attributes are clubbed together on one side of the computer screen
(say, left side) and female names and bad attributes on the other side (right side). On hearing
or seeing a prompt, the respondent has to assign it to the correct side of the screen. In the
example given, a male name should be assigned to the left (and a female name to the right) and
a bad attribute to the right (and a good one to the left). The “non-stereotypical” block reverses
this association (i.e. males names and bad attributes on the right, and female names and good
attributes on the left). The assumption is that a stronger association between two concepts
makes the sorting task easier. An automatic association can be detected by comparing the12In each household we conducted IATs with adults aged between 15 and 45. We targeted at least one respondent
per gender in a household, and have 4,378 IAT respondents from 1,968 households. We do not use IATs from theone pilot village in each of seventy-seven GPs. As our feeling questions were not affected by piloting, we includethese villages for feelings data giving us 7,182 survey responses across 2,926 households.
13Rooth (2007) shows that the D-measure for racial bias of Swedish employers correlates positively with therate at which they call back applicants of different races. Also see Bertrand et al. (2005).
9

response time across the stereotypical and non-stereotypical block. IAT bias is given by the D-
measure: the normalized difference in mean response time between the “non-stereotypical” and
“stereotypical” test blocks (Greenwald et al., 2003). A higher value of the D-measure indicates
a stronger implicit stereotype.
To the best of our knowledge, we are the first to implement IATs in a field setting in a
low income country. Our IATs used either audio or pictorial prompts and, therefore, did not
assume literacy or familiarity with computers (Appendix Figure 1 shows an IAT screen and
a picture of a participant playing the game. The Appendix lists the set of prompts).14 Our
second innovation is to exploit variation in respondent exposure to female leaders to examine
the malleability of IAT bias. We are only aware of one other field study which investigates this
question (see Section 3.2).
We administered two taste IATs; such IATs have been widely used to measure group prejudice
(Banaji, 2001). The first assesses the associational strength between male and female names and
good (e.g nice and delicious) and bad (e.g. nasty and horrible) attributes. The second measures
the association between these attributes and images of male and female politicians (e.g pictures
of either men or women giving speeches or leading crowds). In both cases the stereotypical block
places male names or leader pictures and good attributes on one side of the screen, and female
names or leader pictures and bad attributes on the other side.
3.2 Measure of Leadership Stereotype
Our model suggests that political reservation is unlikely to reduce taste discrimination. Instead,
we hypothesize that the main channel by which reservation influences voter beliefs is enhanced
information on prospective women leaders. A natural consequence of the increase in information
would be a greater association of women with leadership activities.
To examine changes in the gender stereotyping of occupations we administered an activity-
based IAT. The IAT assesses whether villagers exposed to reservation are less likely to associate
women with domestic activities and men with leadership activities. Specifically, it examines14Similar IATs have been used for children (Baron and Banaji, 2006). We excluded respondents with an average
response time of over 6 seconds in the first test block or less than 65% average correct responses. We droppedall responses for which the respondent took more than 10 seconds to categorize any prompt. We randomized theordering of stereotypical and non-stereotypical blocks across respondents.
10

the association between male and female names and domestic (e.g. sleeping and eating puffed
rice) and leadership (e.g.governing and public speaking) activities. To avoid loading the results
towards associating women with domestic activity, we chose gender neutral domestic activities
which were equally likely to be performed by men and women.
Unlike the taste IATs, this IAT does not capture a value judgement. Rather, it is informative
of whether the respondent considers both men and women as potential leaders. Rudman and
Kilianski (2000) use such an IAT to show that respondents in the U.S. associate female names
more strongly with family than with career. There is also some evidence that responses to occu-
pation IATs are influenced by the environment. Dasgupta and Asgari (2004) administered this
IAT to American college students and found that students in colleges with a higher proportion
of female professors were more likely to associate women with professional activities. However,
endogenous selection into college makes a causal interpretation of these results difficult.
3.3 Measures of Leader Effectiveness
To measure bias in voter perception of leader effectiveness, we administered speech and vignette
experiments of the “Goldberg paradigm” type (Goldberg, 1968). Such experiments, which ran-
domly vary the gender of the protagonist, have been widely used to assess bias in the perception
of the effectiveness of women as leaders (Matland, 1994; Huddy and Terkildsen, 1993; Eagly
and Karau, 2002)). Our experiments were administered as part of a longer survey given to a
prime-aged male and female respondent in 15 randomly selected households per village. Overall,
we conducted 6,717 male and 6,780 female adult surveys.
In the speech experiment the respondent heard a short tape-recorded leader speech which
was adapted from an actual village meeting speech. Respondents were randomly assigned one
of six speech recordings (three male and three female) and told that this was a speech by a
village council leader in a village meeting in another district. In the speech, the leader responds
to a villager complaint about a broken tube-well by requesting villagers to contribute money
and effort for local public goods.15 After hearing the speech the respondent was asked seven
questions on different aspects of the leader’s perceived performance and overall effectiveness,
such as ”How would you rank the effectiveness of the Pradhan on a scale of 1 to 10?” and ”Do15A literal translation is included in the Appendix.
11

you think the Pradhan will be successful in getting resources to the village by lobbying?”. We
did not include any questions on whether the villager sympathized with the leader; rather, all
questions were about evaluating the leader’s action and his or her effectiveness.
Each respondent also heard a randomly selected “vignette ”in which a situation of resource
scarcity was described and the leader decided whether to invest in a drinking water or an
irrigation project. Vignettes varied along two dimensions: the leader’s choice and the leader’s
gender. At the conclusion of the vignette, respondents were asked to evaluate the leader using
four questions, similar to those asked after the speech.
The leader’s gender was randomly varied across respondents such that a respondent was
exposed to the same leader gender in the speech and vignette. This allows us to combine vil-
lagers’ responses across the speech and vignette and ask whether, holding actual action constant,
villagers, on average, rank female leaders below male leaders.
Finally, we asked villagers to evaluate their actual leader’s effectiveness on multiple dimen-
sions (using a ladder-based scale of 1 to 10). Questions included “Do you think the Pradhan
has done a good job looking after the needs of your village?” and “How would you rank the
effectiveness of the current Pradhan?”
3.4 Discussion
Clearly, neither our “taste” nor “perception of effectiveness” measure is a perfect empirical
counterpart to the corresponding parameter in the model. Voters may be more likely to associate
female leaders with bad adjectives in general because they consider them incompetent. Equally,
villagers may deem a woman leader giving the speech ineffective because they want to punish
her for violating norms of prescribed behavior. In other words, akin to the utility function we
posit, our measures may capture both voter taste and perception of effectiveness. However, as
long as the relative weights of taste and statistical discrimination vary across these measures we
expect our taste measures to be, on average, less affected by reservation than our perception of
effectiveness measures.
12

4 Institutional Context and Empirical Strategy
As a background for the empirical analysis, we describe political reservation in West Bengal and
our empirical strategy.
4.1 The Panchayat System and Political Reservation
India has had universal franchise since Independence, as well as many prominent female leaders,
including a prime-minister and now its first female President. However, the share of women in
national and state legislatures averages only 10 percent. An important policy response was the
1993 constitutional amendment which, while mandating a three-tier elected local self-government
institution in every Indian state, the Panchayat, required reservations, or quotas, for women in
all three tiers. This policy has led to a dramatic rise in local female leadership across Indian
villages, and the number of village-level female elected leaders is now close to 40 percent.
In each Indian state, the Panchayat consists of a system of village (Gram Panchayat), block
(Panchayat Samiti), and district (Zilla Parishad) councils. Our study focuses on the village
council, Gram Panchayat, which is responsible for the provision of village infrastructure (public
buildings, water, roads, etc.) and for identifying targeted welfare recipients within the villages.
The main source of financing for its activities is the State government.
Unlike many Indian states which introduced Panchayats only after the 1993 constitutional
amendment, West Bengal has had an active elected Panchayat since 1978. In fact, the 1993
amendment was, in part, based on the West Bengal Panchayat model. The typical Gram
Panchayat (GP) in this state has an electorate of roughly 10,000 spread across multiple villages.
The GP is divided into electoral wards, and a ward councillor is directly elected from each ward
by plurality rule every five years. These councillors elect (from among the set of councillors) a
chief village councillor, Pradhan, and a vice-chief councillor, Upa-Pradhan.16
GP council decision-making is by majority voting. While the Pradhan does not have formal
veto power, he or she is the only full-time member of the council and exercises significant
control over the final council decisions (Besley et al., 2007). In our analysis we, therefore, focus
on Pradhans.16In some other Indian states, Pradhan elections are direct.
13

The constitutional amendment in 1993 required that one third of ward councillor positions
in each council be reserved for women. And in each district, one third of the Pradhan positions
be reserved for women. In other words, at each election a third of GPs in every district are
identified as “reserved” for women: only women can be elected as Pradhan in these GPs.17
Each Indian state separately decided the rules for implementing political reservation. In
West Bengal the Panchayat Constitution Rule was modified in 1998 to introduce reservation for
the positions of ward councillors and Pradhans for women and for two disadvantaged minorities,
Scheduled Castes (SC) and Scheduled Tribes (ST)(Government of West Bengal, 1998). At the
time our data was collected, two elections had been conducted with reservation: in 1998 and
2003. In Section 6 we discuss the results of the third election, held in May 2008.
In the case of Pradhans, the West Bengal electoral rules state that, prior to an election, GPs
in a district should be randomly assigned to three lists (on the basis of their serial number rank
and tables provided in the electoral law): Reserved for SC, Reserved for ST, and Unreserved.18
These lists are redone at every election to ensure that no GP features on the SC or ST list for
two consecutive elections. In each list GPs are ordered by their serial numbers. In 1998, every
third GP starting with number 1 on each list was reserved for a woman, and in 2003 every third
GP starting with number 2 on each list was reserved. We reconstructed the 2003 reservation list
using GP serial numbers and electoral law tables and found that the rule held, with no exception
(the same was true in 1998, see Chattopadhyay and Duflo, 2004).
This assignment rule has three consequences. First, there is random assignment to being
reserved for women. Second, there is implicit stratification of women randomization by SC/ST
and administrative block (since GP serial numbers start with a block identifier).19 Third, a GP
may be reserved twice in a row – for instance, if it was first on a list in 1998 but second on a
list in 2003.
Figure 1 shows the patterns in GP reservation in our study district of Birbhum. Of the 5617Electoral gender quotas usually require that women constitute a certain percentage of either party candidate
lists or the elected body, such as the legislature. These quotas are typically constitutionally mandated (as inBurkina Faso, Nepal, Philippines and Uganda), mandated by electoral law (as in many parts of Latin America,Belgium, Bosnia and Herzegovina, Serbia and Sudan) or imposed by political parties (as in Argentina, Bolivia,Ecuador, Germany, Italy, Norway and Sweden). A growing concern that requirements on candidate lists maynot increase actual female representation in politics has led a number of countries (such as Jordan, Uganda andRwanda) to introduce gender quotas using political reservation, similar to the Indian system.
18The extent of reservation for SC and ST in a district is proportional to their population share.19A block is the administrative unit below the district.
14

GPs reserved in 1998, 20 were also reserved in the 2003 election. Thirty five were reserved for
the first time in 2003 and 74 GPs had never been reserved at the time of the survey. All the
Pradhans in GPs reserved for women are female, and the overall fraction of female Pradhans in
Birbhum is 43 percent (due to political disturbances one reserved GP did not have a Pradhan
at the time of our survey).
In non-reserved GPs few women are elected, but this number has increased over time. Prima
facie the increase appears to be unrelated to the reservation policy. The fraction of women
elected in 2003 from GPs that were only reserved in 1998 (14%) is comparable to the fraction
of women Pradhans elected from never reserved GPs in 2003 (16%).
In Table 1 we use 1991 census data to check for systematic differences between villages in
our sample, based on the reservation status of the GP they belong to: Never Reserved, Only
Reserved in 1998, First Reserved 2003 and Reserved in 1998 and 2003. As expected given
the randomization, the village characteristics as of 1991 do not jointly predict the reservation
assignment of GPs in the local elections. There are statistically significant (at the 10 percent
level or less) differences according to reservation status in only three variables (sex ratio under
6, having a hand pump and having a permanent approach road, see p-values in columns (5) and
(6)). Our regressions include controls for these three variables (the regression results are not
sensitive to their inclusion).
4.2 Empirical Strategy
As explained above, the sample has four types of GPs: First Reserved 2003, Reserved 1998
and 2003, Only Reserved 1998, and Never Reserved. Randomization of reservation assignment
allows us to study its reduced form effect by comparing the means of outcomes of interest across
GPs with different reservation status. Since all reserved GPs, but relatively few unreserved and
previously reserved GPs, have a female Pradhan (Figure 1), this reduced form effect is close to
what would be obtained by instrumenting for Pradhan’s gender by the reservation status of the
GP. We, therefore, focus on the reduced form results.
The unit of observation in our regressions is villager i in GP g situated in block b. Through-
out, we report separate results for male and female villagers. We have two sets of outcomes, and
the regression specification differs across these. The first set of outcomes are common across
15

respondents, and include the difference in a villager’s feelings towards male versus female lead-
ers, the IAT D-measures, and evaluations of the Pradhans. For these outcomes we report two
specifications. The first simply compares outcomes of interest across ever reserved GPs and
never reserved GPs,
yig = βRg +Xigγ + αb + εig (2)
where Rg is an indicator variable for the GP being currently or previously reserved (now on,
ever reserved). The second separates reserved and unreserved GPs further:
yig = β2Rg2 + β2and1Rg2and1 + β1Rg1 +Xigγ + αb + εig (3)
Rg1 is an indicator for the GP only being reserved in 1998 and Rg2 for the GP being reserved
for the first time in 2003 (during the second round of reservation). Rg2and1 is an indicator for
the GP being reserved in both 1998 and 2003. Standard errors are always clustered by GP.
All regressions include block fixed effects (αb) and demographic controls (Xig): age, ed-
ucation, caste, religion, household size and proxies for household wealth constructed using a
principal component analysis. We also include investigator gender fixed effects, a survey period
indicator and three village controls (under 6 sex ratio, presence of hand-pumps and presence of
approach road).
Our second set of outcomes consists of the vignette and speech responses. As described in
Section 3.3, each respondent received a vignette about a Pradhan and heard a Pradhan speech
in a male or female voice. The gender of the Pradhan was randomized across respondents. We
are interested in whether male and female Pradhans are judged differently, and whether the
difference varies with reservation status of the GP. Let Fig indicate whether respondent i was
presented with a “female” stimulus (i.e. heard the speech in a female voice, or was given the
vignette with a female leader). We estimate:
yig = δFig + λ(Rg ∗ Fig) + µRg +Xigγ + αb + εig (4)
16

and
yig = δFig+λ2(Rg2∗Fig)+λ2and1(Rg2and1∗Fig)+λ1(Rg1∗Fig)+∑k
Rkµk+Xigγ+αb+εig, (5)
the indicator variables Rk control for the main effect of different reservation categories.
In equation (4) the coefficients of interest are δ which captures bias towards female leaders
in unreserved GPs, and λ which indicates whether current or past exposure to a female leader
changes the level of bias. In equation (5), we are interested in λ2, λ2and1 and λ1, and how they
differ from each other.
On many issues of interest we ask respondents multiple questions. Within a “ family” of
outcomes we expect the coefficients on the variables of interest to go in the same direction. To
avoid drawing inferences based on selected outcomes, we report effects which average across
outcomes within a ”family” (Kling et al., 2007). Specifically, for each outcome we construct a
normalized transformation by subtracting the mean for never reserved GPs and dividing by the
standard deviation in the never reserved sample. We obtain an average effect for the “family”
of outcomes by estimating the effect on the average across these normalized outcomes.20
To summarize, our tables report two sets of regressions. Panel A reports the coefficients on
the reservation dummy from estimating either equation (2) or equation (4), and Panel B from
estimating equation (3) or equation (5). The second to last row in each table reports the baseline
level of bias for the relevant attitude measure (usually the mean for the unreserved sample).
5 Results
5.1 Do Villagers Know Their Leader?
Our model of voter behavior is based on the premise that villagers are aware of local politics
and are able to gather information about leader actions. We start our empirical analysis by
providing evidence on this in Table 2.
Male villagers exhibit relatively high levels of knowledge and involvement in local politics.20As in Kling et al. (2007), we obtain very similar results if we estimate the standardized effects using a
seemingly unrelated regression (SUR) system, where we account for correlation across outcomes and averageacross outcomes to obtain an average effect for the “family” of outcomes.
17

However, we observe a significant gender gap in every measure, with women showing much more
limited exposure. The second to last row in Table 2 provides the means of variables measuring
political awareness and activism in the sample of never reserved GPs. In these GPs, 67% of
male, but only 33% of female, villagers know their current Pradhan’s name. A similar-sized
gender gap exists for previous Pradhans (columns (1)-(4)). Further, 53% of the male, but only
13% of female, villagers state having ever approached the Pradhan about their needs or village
issues (columns (5) and (6)). A large majority of men have heard of the village meeting, even
though a minority has actually attended one (76% and 34%, respectively, see columns (7) and
(9)). In contrast, only 56% of the women have heard of the meetings and only 7% have attended.
Panel A in Table 2 shows the coefficient on the “ever reserved” variable in equation (2), and
Panel B the coefficients on the reservation variables in equation (3). In columns (1) through (6)
we see that both genders are less likely to have interacted with female Pradhans and to know
their name. For example, men are 11-12.5% less likely to know the name of their Pradhan if
the GP is currently reserved, and between 10-14% less likely to know the name of the previous
Pradhan if the GP was previously reserved.
This negative effect of reservation on villagers’ interactions with the village leaders has sev-
eral possible interpretations: it may reflect discrimination (villagers do not take female leaders
seriously), or female Pradhans may be less proactive, or less likely to be a trusted village au-
thority. That said, an important point from Table 2 is that even in reserved GPs a majority of
male villagers know who their Pradhan is, and have, at some point, seen him or her.
5.2 Preference for Male Leaders
In Table 3 we examine differences in villagers’ general feelings towards male and female leaders.
As a reminder, we measure an explicit preference for male leaders by the difference between a
villager’s general rating of male and female Pradhans (on a 1-10 scale). We measure an implicit
preference for male leaders by the D-measure in the taste IAT. To benchmark respondents’
ranking of leaders, we also report the rating and IAT results for respondent preferences for male
versus female villagers.
The second to last row of Table 3 presents summary statistics for never reserved GPs.
Villagers in Birbhum are not shy about admitting explicit preferences for males. In columns (1)
18

and (2) we see that men rank male villagers 0.69 points higher than female villagers. Women
exhibit a much smaller, but significant, bias in favor of male villagers. For both genders, this
bias is magnified in the case of leaders (columns (3) and (4)). Male villagers rate male leaders
1.44 points higher than female leaders. For female villagers the difference, while smaller (0.56),
remains significant.
This distaste for female leaders is not ameliorated by exposure. Rather, the coefficient of
“ever reserved” (Panel A, column (3)) is positive (0.22) and significant for male villagers, suggest-
ing that their relative preference for male leaders (compared to female leaders) is strengthened
in GPs which have experienced a gender quota.
Columns (5)-(8) report findings for the villager and leader taste IATs. Both demonstrate
a strong same gender preference among male and female villagers. Men are significantly more
likely to associate good with male names while women associate female names with positive
attributes.21 Neither is affected by reservation.
These results are discouraging of the view that affirmative action can, in the short to medium
run, alter voter preferences. Our evidence differs from that of rich countries where explicit bias
tends to be muted even when respondents exhibit strong implicit bias (Bertrand et al., 2005). A
possible explanation is that social norms that women should not be leaders are deep-rooted in
rural India. The finding that men are more biased in once reserved GPs, but only as measured
by explicit attitudes, supports the “backlash” hypothesis. That is, men protest against the
quota system which forces them to elect women by stating a dislike for female leaders, even
though their implicit preferences are unaffected. The fact that this effect is strongest in GPs
that were only reserved once (Panel B, see coefficient on reservation in 1998 or in 2003) leaves
open the possibility that villagers get used to quotas over time. This possibility is discussed in
Section 5.5.
Social norms which militate against female leadership, combined with same-gender prefer-
ences, could also explain consistent results across explicit and implicit attitudes for male, but
not female, villagers. Specifically, women’s explicit attitudes may reflect the fact that they rec-
ognize that ranking female leaders below male leaders is prescribed behavior, even though they21Our finding of same sex preference on the part of men differs from what is typically found in developed
countries, where these tests exhibit a “women are wonderful” effect – and everyone associates women with goodattributes (Eagly and Mladinic, 1989).
19

like female leaders (and this is captured by their implicit beliefs).
Finally, the very similar results across the two taste IATs for both genders suggests that
villagers may have, in both cases, mostly perceived the gender of the character and did not
associate pictures of female leaders with leadership. In that sense, we recognize that the second
IAT may have failed to sufficiently capture a “leadership” dimension.
5.3 Gender-Occupation Stereotypes
Our results suggest that reservation has not significantly altered voters’ taste for female leaders.
In Table 4 we examine whether it has made them more aware of the possibility that women can
lead. We use an occupation-based IAT which tests whether villagers are more likely to associate
leadership activities with men and domestic activities with women.
In contrast to the same-sex preference observed in taste IATs, the occupation IAT suggests
that both genders exhibit significant bias against women in leadership activities in never reserved
GPs. Specifically, respondents are faster at associating women with domestic activities than with
leadership actions (on average, men are 0.1 standard deviation faster, and women 0.15 standard
deviation faster). Exposure to a female leader significantly reduces this association for men.
This suggests that reservation-induced exposure lowered the strength of the stereotype linking
men with leadership activities, at least among male villagers who may have learned that women
can lead. To the best of our knowledge, this is the first study that identifies a causal effect of a
policy on implicit beliefs, as measured by an IAT.
Overall exposure does not reduce stereotyping among women. If anything, Panel B shows
a strengthening of the stereotype associating women and domestic activities among women
exposed to a female Pradhan for the first time in 2003. Section 5.6 provides a somewhat
speculative explanation for this result.
These results suggest a more nuanced view of how political reservation affects attitudes.
While reservation does not make male villagers more sympathetic to the idea of female leaders,
it makes them recognize that women can lead. This opens up the possibility that they may have
updated their perception of the competence of women leaders, which is what we turn to now.
20

5.4 Perceptions of Effectiveness
5.4.1 Hypothetical Leaders
Table 5 examines villagers’ evaluation of the actions performed by hypothetical Pradhans as
described in the tape-recorded Pradhan speech or in a vignette. A respondent was exposed to
a Pradhan of the same gender in the speech and the vignette and asked multiple questions on
the perceived effectiveness of the Pradhan.
In columns (1) and (2) we report the coefficients from regressions in which the dependent
variable is the average of the normalized outcomes across all questions in the speech and the
vignette. In Panel A we see that men in never reserved villages rate the effectiveness of a
hypothetical female Pradhan 0.055 standard deviation below that of a male Pradhan (with a
standard error of 0.027). While lower and insignificant for women (0.035, with a standard error
of 0.031), we cannot reject the hypothesis that both genders are equally biased.
Reservation alters male evaluations: the coefficient on the interaction between female Prad-
han and ever reserved is 0.096 and is strongly significant. Adding the coefficients on female
Pradhan and its interaction with reservation suggests that political reservation completely erases,
indeed reverses, this bias (though the resulting pro-female bias is not strongly significant). In
Panel B, we see a similar impact of reservation across all reservation categories: all coefficients
are positive, with similar-sized, and statistically indistinguishable, point estimates. The results
are striking in that they suggest that for male villagers exposure, at some point, to a female
leader is sufficient to erase statistical discrimination against female leaders. Moreover, this effect
persists even after the woman has left office. In contrast, reservation has no impact on leadership
evaluation of female villagers.
Columns (3)-(10) consider different subsets of the effectiveness questions that enter the over-
all assessment.22 The results are remarkably consistent across outcomes. On each outcome men
in never reserved GPs evaluate the hypothetical female Pradhan more negatively than her male
counterparts. This bias is absent in GPs which have been reserved at some point in time. In
the case of women villagers, reservation has no impact.
Why are women’s evaluations of the effectiveness of female leaders unaffected by reservation?22They are still averaged across the speech and vignette questions. Appendix Table A1 reports results separately
for all speech and vignette questions.
21

One possibility is the much lower exposure of female villagers to local politics (see Table 2).
For the presence of female leaders to alter an individual’s perception of their competence, she
needs to have observed them in action. If women are largely unaware of local politics then
it is unsurprising that reservation does not affect their evaluations. Table 6 provides evidence
which supports this hypothesis. We use the average of the responses to the speech and vignette
questions as the relevant outcome variable. We expand our set of explanatory variables to include
the interaction of the reservation effect with whether the villager knows the current or previous
Pradhan’s name. Columns (1)-(3) present the OLS results. The estimates, while noisy, suggest
that even among men the effect is driven by those who know the Pradhan. To address the
concern of reverse causality columns (4)-(6) report IV regressions. We instrument for whether
a villager knows the Pradhan’s name with a set of variables indicating geographic and social
proximity to the Pradhan (lives in the same village, has the same caste) and political knowledge
(reads the newspaper, knows the name of legislator and has heard of village meetings). The IV
estimates are significantly larger for both genders (though still noisily estimated).
The speech and vignette results are consistent with the predictions of a model of statistical
discrimination in which villagers update their initial prior that women leaders are less effective
after they have seen a woman leader in action. Our results suggest a relatively rapid updating
of voter beliefs about women’s effectiveness as leaders, at least among men. This suggests that
political reservation can, even if it does not change voter preferences, alter the future electoral
fortunes of women if voters place enough weight on leader competence (we provide evidence
on this is Section 6). And even if electoral outcomes are unchanged, political reservation can
enhance voter welfare by improving the information available to villagers.
The speech and vignette experiments allow us to measure bias but may not perfectly predict
how reservation influences leader evaluation in situations where the information available about
leaders may differ with their gender. We now directly examine this.
5.4.2 Actual Leaders
Our survey asked each respondent to evaluate their actual Pradhan’s performance on four dif-
ferent dimensions using the same 1 to 10 ladder which was used for the vignette and speech
experiments. The questions were purposefully chosen to be similar to those asked about the
22

hypothetical Pradhan in the speech and vignette.
In Table 7 we report both the average outcome for the four questions and separately for each
question. In all cases villagers evaluate their Pradhan as significantly less effective in GPs first
reserved in 2003. Column (1) examines the average outcome for male respondents. The first
row shows that Pradhans in GPs that are first reserved for a woman in 2003 score 0.2 standard
deviations less than Pradhans in unreserved GPs; this coefficient is strongly significant. Column
(2) shows a negative, but smaller and insignificant, effect for female villagers (-0.07 standard
deviation with a standard error of 0.06).23 This is analogous to the speech and vignette results,
where (male) respondents in never reserved GPs considered hypothetical female Pradhans less
effective than their male counterparts.
The coefficients of interest are very similar across individual outcomes (columns (3)-(10)).
Female Pradhans in GPs first reserved in 2003 are ranked lower on general effectiveness, ability
to look after village or respondent needs, and in preparing the list of “below the poverty line”
(BPL) program beneficiaries.
However, consistent with the experimental data, the second row in Table 7 shows that
villagers’ evaluation of female Pradhans in twice reserved GPs is statistically indistinguishable
from that of Pradhans in unreserved GPs, for both men and women. For men, we can reject the
equality between the coefficient of the “first reserved” and “reserved in 1998 and 2003” at the
1 percent level. For women, the coefficients do not differ; this, in part, reflects the fact that we
cannot reject that women did not rate their female leaders lower than male leaders. Finally, row
3 shows that the current (mostly male) leaders in GPs that were previously reserved in 1998 are
evaluated at par with leaders from never reserved GPs.
These results are consistent with the view that exposure to a female leader causes villagers
to update their prior on average female effectiveness. The first cohort of women leaders fails to
benefit from this updating, potentially because voters “stick” with their assessment of a specific
leader (Mullainathan and Washington, 2009). In contrast, the second cohort of female leaders
does not appear to suffer from statistical discrimination. Needless to say, an important caveat
is that, unlike the hypothetical leaders in the speech and vignette, male Pradhans and second23These results echo Duflo and Topalova (2004) who, using nation-wide data for India, showed that villagers
are more dissatisfied with female leaders in general (also see Duflo, 2005)
23

time female Pradhans may be better leaders than first-time female Pradhans.
Are First-time Women Leaders Less Effective?
In Table 8 we present evidence that, prima facie, male Pradhans do not outperform female
Pradhans. Across all public goods, the average number of repairs or constructions since the last
election is 0.19 standard deviations higher in villages in reserved GPs (column (1)). If anything,
Pradhans in GPs first reserved in 2003 are more effective than Pradhans in never reserved GPs.24
While statistically indistinguishable from the effect in GPs first reserved in 2003, the effect in
twice reserved GPs is smaller and insignificant (0.04, with standard error of 0.06).
A second possibility is that women Pradhans invest in more, but lower quality, public goods.
However, in column (2) we do not see any significant differences in the quality of public good
provision across currently reserved, previously reserved or twice reserved GPs. Once again, the
performance of women elected in first-time reserved GPs is indistinguishable from women elected
from GPs reserved for the second time.
Since public goods are mainly financed by State Government funds, the contrast between
villagers’ (especially male) negative evaluation of female Pradhans and the fact that female
Pradhans seem to invest more, with no discernible reduction in quality, is unlikely to be explained
by men resenting a “big government” approach. There are, however, (at least) two other ways
in which villagers may have to pay for these goods: voluntary contributions and bribes. In our
household survey we can identify whether the household paid a bribe to receive a BPL card
and whether the household paid bribes and made voluntary contributions for drinking water
provision. In column (3) we see that on average, individuals in currently reserved GPs are less
likely to have paid a bribe.25 Further, in columns (4) and (5) we observe very similar levels of
self-reported villager satisfaction with public goods (we average across all public goods) across
GPs in different reservation categories.26
24This result is broadly consistent with Munshi and Rosenzweig (2008)’s finding that in non-caste dominantGPs, women leaders demonstrate higher competence as measured by public good provision using nationallyrepresentative data.
25This effect is driven by BPL card; there is no difference in payments for water maintenance.26The results are very similar for individual satisfaction measures, except the BPL list. Men, in particular, are
unsatisfied with the way female leaders allocate them. However, the existence of a BPL quota implies that thereis no way to allocate BPL cards to please everyone (our satisfaction results differ from Duflo and Topalova (2004):in an Indian-wide data set they found that, on average, villagers were less likely to be satisfied with public goodprovision when women were in charge.
24

The evidence suggests that women leaders provide more public goods, of equal quality, at
a lower effective price. While we may have failed to measure some critical aspect of Pradhan
performance, the weight of the evidence is consistent with our experimental findings. That is,
villagers rate female leaders in villages reserved for the first time more negatively even though
they perform at least as well as the average male Pradhan. This bias disappears for the second
cohort of women.
Finally, we examine whether female leaders’ decisions are biased towards women’s prefer-
ences. This is motivated by the fact that women leaders invest in different types of goods than
men (see Appendix Table A2). We follow Chattopadhyay and Duflo (2004) and use the differ-
ence in male and female villagers’ complaints in public meetings to construct a measure of female
preferences. Column (6) shows that female leaders invest more in women-preferred goods. At
first pass, this suggests an alternative explanation for both the apparent taste discrimination
against female leaders and the observed backlash in male preferences for female leaders in Table
3. However, this explanation is difficult to square with the fact that the policy choices of female
Pradhans in first and second reserved GPs are equally pro-woman,27 while the “backlash” effect
was particularly strong for GPs reserved only once (Table 3).
To further investigate possible differences in Pradhan selection across first time and second
time reserved GPs, we compare salient leader characteristics by reservation status in Table
9. Male and female leaders differ: women are younger, less educated, and are more likely to
come from landless and less wealthy households. However, we see little systematic differences
in demographics between women leaders in first and second time reserved GPs. Women in first
time reserved GPs are more likely to be Pradhan for the first time in 2003 than women in twice
reserved GPs (23 percentage points, significant at the 8 percent level). That said, this difference
in experience in serving as Pradhan, as seen in Table 8, does not translate into differential
public goods provision. Moreover, their average political experience, which includes experience
in political positions other than council president, does not differ significantly.
In summary, the evaluation of the actual Pradhan closely mirrors that of the hypothetical
ones. The first time men are exposed to a female Pradhan (either real or hypothetical), they27This is somewhat surprising since one may expect parties to field different candidates (or voters to select
different types of women) once they realize that female leader’s decisions reflect the policy preferences of women.Surprisingly, this is also true for previously (but not currently) reserved GPs.
25

consider her ineffective. This difference disappears the second time around. The effects for
women, while similar, are attenuated and insignificant. While we can not fully rule out the
possibility that performance differences underlie men’s dislike for Pradhans in GPs reserved for
the first time and their favorable evaluation of Pradhans elected in GPs reserved for the second
time, the consistency between these two sets of results strongly points to the possibility that
exposure to female leaders reduced bias.
5.5 Robustness Checks and Alternative Explanations
In Table 10 we conduct a number of robustness checks to examine possible alternative explana-
tions for our results.
A first possibility is that female leaders get worse evaluations than male leaders, not because
of their gender, but because they are new and inexperienced (roughly 60% of male Pradhans
have previous experience while the experience of women leaders is significantly lower, see Table
9). In the vignette and speech experiments, respondents who have never had a female leader may
assume that female Pradhans are new and inexperienced, and therefore likely to be worse. In
Panel I of Table 10 we restrict the sample to never reserved GPs and show that a respondent’s
evaluation of a Pradhan is uncorrelated with whether the Pradhan is new (i.e. has not been
elected to any GP position prior to 2003).
Another possibility, which we alluded to earlier, is that voters give women leaders worse
evaluations simply because they are elected on a reserved seat. This, however, cannot explain
the absence of bias for women elected from twice-reserved GPs, unless voters get used to the
idea of reservation. If correct, this explanation suggests that voters will rank other reserved
Pradhans below unreserved Pradhans, but their ranking of reserved Pradhan would improve in
GPs which were previously reserved for women. In Panel II we show that while voters rank SC
Pradhans lower than non SC Pradhans (potentially because they are also discriminated against),
previous reservation for women does not affect this. Similarly the negative evaluation of first
time female leaders is unaffected by whether the GP was previously reserved for SC (Panel III).
Finally, in Panel IV, we show that previous reservation for SC does not reduce voter bias
in the speech and vignette. It is exposure to women that makes a difference, not exposure to
reservation in general.
26
5.6 Are Women Leaders Hindered by Voter Bias?
Reservations ensure that women get elected. But discrimination may make their job more
difficult. In Table 11, we report results based on surveying Pradhans which suggest that their
experience on the job is affected by how well they are received by voters.
We first consider Pradhans’ stated satisfaction with life (on a scale from 1 to 5, using the
standard phrasing for this question on self reported happiness).28 In column (1) of Table 11 we
see that Pradhans in GPs first reserved for women in 2003 are significantly less satisfied with
their lives than Pradhans elected from unreserved seats (the coefficient is -0.47, and the mean
for men is 3.7). This difference is absent for Pradhans elected in GPs reserved for the second
time; moreover, the difference in stated satisfaction levels of female Pradhans in first and second
time reserved GPs is strongly significant.
In column (2) we restrict the sample to women who were elected Pradhan from reserved GPs
in either 1998 or 2003 (for Pradhans elected in 1998 we use survey data from Chattopadhyay and
Duflo, 2004). We see that, relative to women elected from second-time reserved GPs, women
leaders elected from first time reserved GPs (in either 1998 or 2003) report their gender as
creating more on-the-job difficulties. Thirty-four percent of the first time female Pradhans state
that their gender created problems. While not shown in the table, only 10 percent of the second
time Pradhans did.
Finally, in column (3) we expand the sample to all Pradhans elected in either 1998 or 2003,
and examine whether the Pradhan plans to run for re–election. Incumbents in GPs reserved for
the first time in either 1998 or 2003 are 12% more likely to plan to not rerun than incumbents
in unreserved GPs. This difference is absent for Pradhans in twice reserved GPs.
We interpret these findings as suggesting that bias lowers life and job satisfaction for first
time female leaders. Both the bias and lower level of satisfaction are absent for second time
leaders. Although somewhat speculative (especially since we do not see any other effects for
women), this may also explain why, in Table 4, after one round of reservation, women were
significantly less likely to associate women with leadership activities, except in GPs that had
been reserved twice.28The question asked, ”Which picture best describes how satisfied you are with your life right now if the smiling
face is very satisfied and the frowning-crying face is very dissatisfied? (Show picture with 5 faces).”
27

6 Conclusion and Epilogue: Electoral Outcomes
Indian villagers prefer male leaders and have negatively biased priors on the effectiveness of
female leaders. Male villagers rate their feeling towards female leaders more than one point below
that towards male leaders; moreover, in never reserved villages hypothetical leaders performing
the same action are evaluated as less effective if they are female.
We have argued that, in large part, the overall “feeling” for male leaders reflects taste-
based discrimination, or a deeply rooted social norm that it is inappropriate for women to fulfill
leadership positions. Such social norms appear hard to alter, even after ten years of political
reservation. In contrast, the effectiveness rating of a leader in a speech or a vignette, which we
suggest reflects statistical discrimination, appears to be easier to change.
We do not find any evidence that negative feelings towards the idea of female leaders re-
flects worse performance by female Pradhans. If anything, female Pradhans outperform male
Pradhans on many dimensions of performance: for instance, they provide more public goods
at a lower price. Moreover, villagers’ rating of the performance of their actual female Pradhan
closely tracks their ranking of hypothetical leaders: the first cohort of female leaders is rated
below men (possibly reflecting statistical discrimination), but the second cohort is rated at par
with men. Another alternative, and potentially complimentary, explanation is that men dislike
female Pradhans because they implement pro-woman policies. This explanation is, however,
inconsistent with the fact that first-time and second-time female Pradhans are equally as likely
to implement pro-woman policies but only first-time Pradhans receive negative evaluations.
Taken together, the weight of the evidence suggests that exposure matters, and that political
reservations, or more generally quota systems, may play an important role in reducing bias in
perceptions of female leader effectiveness. However, villagers’ continued preference for male
leaders makes it difficult to predict priori whether a temporary program of reservation can
translate into a permanent improvement in the electoral fortunes of women.
Our results do suggest that if reservation improves electoral outcomes for women, the effect
should be stronger after two cycles of reservations than after one cycle. The recently concluded
May 2008 Panchayat elections provide a unique opportunity to test this prediction. This election
was marked by a strong anti-incumbent voting – after 30 years of uninterrupted electoral success,
28

the Communist Party lost in a majority of GPs. Given the highly contested nature of this
election, it is very likely that political parties would not field a female candidate in an unreserved
seat unless they expected her to win the position.
As we mentioned in Section 4.1, Pradhan election is indirect: directly elected ward councillors
elect the Pradhan. The Pradhan elections following the May 2008 election have not yet occurred.
However, ward councillor election results, which reflect villager preferences, are available.
In Table 11 we analyze the electoral results for the 1185 wards (spread across the 165 Birbhum
GPs) that were not reserved for women in 2008. There were, on average, three candidates per
ward. Columns (4) and (5) show the impact of previous GP reservation on the fraction of
women who ran for, and won, ward councillor positions. In non-reserved wards belonging to
GPs that had never been reserved for a female Pradhan before 5.2% of the candidates, and 4.8%
of the elected ward councillors were women (33% of the wards are reserved, so roughly 38% of
all ward councillors are women). These numbers are unchanged for wards in GPs that were
reserved only once. However, we see a striking difference for wards in GPs where the position
of Pradhan was reserved both in 1998 and 2003. Specifically, relative to wards in never reserved
GPs, the proportion of female candidates in unreserved wards in double reserved GPs increased
by 3.3 percentage points and the proportion of women elected more than doubled (10.1% versus
4.8%).29
The increased entry of women into politics may reflect either a change in parties’ willingness
to field women in response to altered citizens’ attitudes, or a greater willingness of women to
stand for election, after they see that the second cohort of female Pradhans is well liked.30
Regardless of the mechanism at work, these results provide striking evidence that while ten
years of exposure to women leaders may not have changed voters’ stated preference for male
leaders, by giving voters a chance to learn about the effectiveness of women leaders, they have
improved women’s access to political office.
Beyond their implications for the possible role of quotas in inducing durable changes in
women representation in politics, these results provide some of the first evidence on the potential29Bhavnani (2008) reports similar findings for urban wards of Mumbai, where previous reservation for women
improved future representation of women on unreserved seats.30Even though we do not see impact of reservations on the attitude of the average woman, we have argued that
the most likely explanation is that many of them are not exposed to politics. Women who are capable of standingfor election must, however, be the most politically aware.
29

role for public policy in mitigating voter discrimination. While the political under-representation
of women is widely documented, there is almost no credible evidence on whether public policy
can influence voters’ belief systems and prejudice. Much of the evidence from outside the political
sphere suggests that policies which limit awareness of a candidate’s gender may be an optimal
short run response to discrimination (Goldin and Rouse, 2000). Our results suggest that, in
political settings where such strategies are infeasible, political affirmative action may play an
important medium-run role. While the first generation of women who are powerful political
figures may encounter significant prejudice, their experience can pave the way for others to go
further.
References
Aigner, D. and G. Cain (1977). Statistical Theories of Discrimination in Labor Markets. Indus-trial and Labor Relations Review 30, 175–187.
Akerlof, G. and R. Kranton (2000). Identity and Economics. The Quarterly Journal of Eco-nomics 115 (3), 715–154.
Alvarez, M. (1990). The Puzzle of Party Identification - Dimensionality of an Important Concept.American Politics Quarterly 18, 476–91.
Banaji, M. (2001). Implicit Attitudes can be Measured. In H. Roediger and J. Nairne (Eds.), TheNature of Remembering: Essays in Honor of Robert G. Crowder. Washington, DC: AmericanPsychological Association.
Baron, A. and M. Banaji (2006). The Development of Implicit Attitudes: Evidence of RaceEvaluations from Ages 6 and 10 and Adulthood. Psychological Science 17 (1), 53–58.
Bergemann, D. and J. Valmiki (2008). Bandit Problems. In S. Durlauf and L. Blume (Eds.),The New Palgrave Dictionary of Economics.
Bertrand, M., D. Chugh, and S. Mullainathan (2005). Implicit Discrimination. AmericanEconomic Review 95 (2), 94–98.
Besley, T., R. Pande, and V. Rao (2007). Just Rewards? Local Politics and Public ResourceAllocation in South India. mimeo, Harvard.
Bhavnani, R. (2008). Can Governments Remedy Political Inequality? Evidence from Random-ized Quotas in India. mimeo, Stanford .
Boisjoly, J., G. Duncan, M. Kremer, D. Levy, and J. Eccles (2006). Empathy or Antipathy? TheConsequences of Racially and Socially Diverse Peers on Attitudes and Behaviors. AmericanEconomic Review 96, 1890–1906.
Charles, K. and J. Guryan (2007). Prejudice and the Economics of Discrimination. NBERWorking Paper 13661.
Chattopadhyay, R. and E. Duflo (2004). Women as Policy Makers: Evidence from a RandomizedPolicy Experiment in India. Econometrica 72 (5), 1409–1443.
30
Coate, S. and G. Loury (1993). Will Affirmative-Action Policies Eliminate Negative Stereotypes?American Economic Review 83 (5), 1220–1240.
Dahlerup, D. (2006). Women, Quotas and Politics. New York: Routledge.
Dasgupta, N. and S. Asgari (2004). Seeing is believing: Exposure to counterstereotypic womenleaders and its effect on the malleability of automatic gender stereotyping. Journal of Exper-imental Social Psychology 40, 642–658.
Duflo, E. (2005). Why Political Reservations. Journal of the European Economic Associa-tion 3 (2-3), 668–678.
Duflo, E. and P. Topalova (2004). Unappreciated Service: Performance, Perceptions, and WomenLeaders in india. Mimeo.
Eagly, A. and S. Karau (2002). Role Congruity Theory of Prejudice toward Female Leaders.Psychological Review 109, 573–598.
Eagly, A. and A. Mladinic (1989). Gender Stereotypes and attitudes toward women and men.Personality and Social Psychology Bulletin 15 (4), 543–558.
Frechette, G., F. Maniquet, and M. Morelli. Incumbents Interests, Voters Bias and GenderQuotas. American Journal of Political Science forthcoming.
Goldberg, P. (1968). Are Women Prejudiced Against Women? Transaction 5, 28–30.
Goldin, C. (1990). A Pollution Theory of Discrimination. Mimeo, Harvard.
Goldin, C. and C. Rouse (2000). Orchestrating Impartiality: the Impact of “Blind” Auditionson Female Musicians. American Economic Review 90 (4), 715–741.
Government of West Bengal (1998). The West Bengal Panchayat (Constitution) Rules, 1975.Department of Panchayats & Rural Devlelopment.
Greenwald, A., M. Banaji, and B. Nosek (2003). Understanding and Using the Implicit Asso-ciation Test: I. An Improved Scoring Algorithm. Journal of Personality and Social Psychol-ogy 85 (2), 197–216.
Greenwald, A., D. McGhee, and J. Schwartz (1998). Measuring Individual Differences in ImplicitCognition: The Implicit Association Test. Journal of Personality and Social Psychology 75 (6),1464–1480.
Huddy, L. and N. Terkildsen (1993). Gender Stereotypes and the Perception of Male and FemaleCandidates. American Journal of Political Science 37 (1), 119–147.
Ingelhart, R. and P. Norris (2003). Rising Tide: Gender Equality and Cultural Change Aroundthe World. Cambridge: Cambridge University.
Jones, M. (2004). Quota Legislation and the Election of Women: Learning from the Costa RicanExperience. Journal of Politics 66 (4), 1203–1223.
Keller, S. and T. Mirer (1974). The Simple Act of Voting. American Political Science Review 68,572–91.
Kling, J., J. Liebman, and L. Katz (2007). Experimental Analysis of Neighborhood Effects.Econometrica.
31

Krook, M. (2005). Politicizing Representation: Campaigns for Candidate Gender Quotas World-wide. New York: Ph.D. diss Columbia University.
Matland, R. E. (1994). Putting Scandinavian Equality to the Test: An Experimental Evaluationof Gender Stereotyping of Political Candidates in a Sample of Norwegian Voters. BritishJournal of Political Science 24, 273–292.
Mullainathan, S. and E. Washington (2009). Sticking With your Vote: Cognitive Dissonanceand Political Attitudes. American Economic Journal: Applied Economics.
Munshi, K. and M. Rosenzweig (2008). The Efficacy of Parochial Politics: Caste, Commitment,and Competence in Indian Local Governments. Mimeo.
Nosek, B., A. Greenwald, and M. Banaji (2007). The Implicit Association Test at Age 7: AMethodological and Conceptual review. In J. A. Bargh (Ed.), Automatic Processes in SocialThinking and Behavior.
Powley, E. (2007). Rwanda: The Impact of Women Legislators on Policy Outcomes AffectingChildren and Families. Background Paper, State of the World’s Children.
Rooth, D. O. (2007). Implicit Discrimination in Hiring: Real World Evidence. IZA DiscussionPaper 2764.
Rudman, L. and K. Fairchild (2004). Reactions to Counterstereotypic Behavior: The Role ofBacklash in Cultural Stereotype Maintenance. Journal of Personality and Social Psychol-ogy 87 (2), 157–176.
Rudman, L. and S. Kilianski (2000). Implicit and Explicit Attitudes Toward Female Authority.Personality and Social Psychology Bulletin 26 (11), 1315–1328.
Thernstrom, S. and A. Thernstrom (1997). America In Black And White: One Nation, Indivis-ible. New York, NY: Simon and Schuster.
UNICEF (2007). The State of The World’s Children: Women and Children: The Double Divi-dend of Gender Equality. New York: UN.
Weisberg, H. (1980). A Multidimensional Conceptualization of Party Identification. PoliticalBehavior 2, 33–96.
Zaller, J. (1992). The Nature and Origins of Mass Opinion. Cambridge: Cambridge UniversityPress.
32

A Appendix
A.1 IAT
We administered three IATs. The prompts used in each IAT are listed below.
Taste IAT 1: Villagers Male names: Badal, Shyamol, Saurabh, Gopal, Anup, Ashok, Tapan, Raju
Female names: Geeta, Minoti, Anjali, Rekha, Jharna, Minu, Rupa, Basanti
Good attributes: good, nice, fun, happiness, love, clean, sweet, heaven
Bad attributes: bad, mad, sorrow, inauspicious, sad, dirty, spoiled, hell
Taste IAT 2: Leaders Male and Female Leaders: Pictures (available from authors)
Good and Bad Attributes: Same as Taste IAT 1.
Gender Occupation Stereotype IAT: Domestic activities: Eating puffed rice, Listening to the radio,
Sleeping, Taking rest, Clay modelling, Harvesting, Caring for animals, Threshing rice
Leadership words: Gram Pradhan, Public speaking, Govern, Chairperson, Lobbying, Leader, Campaign-
ing, Taking bribes Male and female names: same as in Taste IAT: Villagers
A.2 Vignette and Speech
Note Respondents were given one of four vignettes, where we randomly varied the gender of the Prad-
han (Male (Tapan Das) or Female (Sandhya Das)) and the investment decision (Irrigation or Water).
Respondents received one of six speech versions - three male voice recordings and three female voice
recordings. We randomized the gender of Pradhan at the respondent level
Vignette READ OUT: We will read a short description of the Pradhan of village CHANDI in district
South 24 Parganas. We will ask you some questions about what you think the Pradhan should have done.
There are no right or wrong answers. Please answer each in terms of your own reactions.
Pradhan Tapan Das [Pradhan Sandhya Das] has been serving his [her ] Panchayat for ten months. As
the end of the year approaches, there is only a limited amount of money remaining in the budget. Yet,
villagers have been pressing him [her ] to make improvements in two major areas: irrigation and drinking
water. There was enough money to make investments in only one area. Prior to making a decision,
Pradhan Tapan Das [Pradhan Sandhya Das] consulted with villagers at the Gram Sabha. Many people
expressed frustration that there was still no safe drinking water available in the village. Many people,
33

especially children, were getting sick. Others were upset about the quality of the irrigation system. Poor
irrigation system meant that, in dry years, many people lost their crops. Shri Tapan Das [Shrimati
Sandhya Das] considered the demands carefully, and wondered what to do. On the one hand, Shri Tapan
Das [Shrimati Sandhya Das] knew the health cost of bad water quality. Yet, wouldn’t everyone be better
off with better irrigation. After careful reflection Pradhan Tapan Das [Pradhan Sandhya Das] decided to
invest in irrigation improvement [drinking water].
Speech READ OUT: You will hear a tape-recorded speech from the village meeting of Gram Panchayat
Labhpur in district West Dinajpur. We will ask you some questions on the effectiveness of the leader.
There are no right or wrong answers. Please answer each in terms of your own reactions.
VILLAGER: The tube well of our Kumarpara is not functioning. The repairing job of the tubewell in
your locality has been done partially, but the same work at Nutangram has been completed.
PRADHAN: For repairing of tubewells maximum amount of funds of the Panchayat is being drained out.
As a result of which, other works can’t be done. From the next stage you, the people, should take mental
preparations that the minor repairing jobs of the tubewells won’t be done by the Panchayat. I mean that
if the work involves a large amount of money, e.g. if a pipe is needed then it involves the money above
Rs.250, Rs.300, this type of works will be done by the Panchayat. But for the minor repairing jobs the
people have to take initiative to collect subscriptions to do this. In the future, the plan of the Panchayat
will be ”plans with equal sharings” (”Samobhagi Parikalpana”). The Government won’t provide all the
money. The Government will provide some amount of money and the rest have to be borne by the
people either by giving labor or helping financially. In this way the work of the Panchayat have to be
done. Suppose a village road has to be constructed, then the people of the village will do the earthen
work and the Panchayat will supply the morram. Therefore the people will now share the jobs, which
the Panchayat did mostly. Then the total work can be made with a success. So in the next stage that
preparation have to be taken. I would now like all villagers to approve the village budget.
A.3 Public Good Variables
Quantity and Quality Variables: Water and sanitation quantity variable: a dummy for whether a
tubewell was built, a tubewell was repaired, a sanitation pit was built, a sanitation pit repaired. Water
and Sanitation quality variable: handpumps are perennial, provide clean water, no stagnant water, have
drainage and sanitation – no stagnant water, drainage facility. Irrigation quantity variable: dummy for
34

whether an irrigation pump was built or repaired. Roads quantity variable: a dummy for whether a metal
road was built or repaired since 2003. Roads quality variable: condition of road (1-5) and number of
potholes in 100m. Transport quantity variable: number of transportation related infrastructure (bus stop,
bus service, taxi). Transport quality variable: dummy for presence of a bus stand and if bus stand has
shelter. Schools and other education facilities quantity variable: a dummy for whether any educational
facility was built, a dummy for whether such facility was repaired, a dummy for whether there is a creche
and an indicator for a CE Center/CE Library. Educational facility quantity variable: SSK, Anganwadi,
primary schools, middle schools, libraries and secondary schools. Schools and other education facilities
quality variable: whether all primary schools have drinking water, latrines, blackboards and reading and
math test scores. Health Quantity variable: the number of health facilities, a dummy for whether a health
facility was built, a dummy for whether a health facility was repaired (0 if no health facility existed), and
number of doctors. Health Quality variable: facility having tap or hand-pump water and an indicator
for having a labor room. Fair Price Shop Quality measure includes: whether prices displayed, no bad
behavior of shop keeper, and no complaint against shop.
Satisfaction Variables: Average satisfaction is the satisfaction across five different kinds of public
goods: water provision, public transport, schools, health care and fair price shops. Each of the individual
public good satisfaction measure is computed as the average of the responses of a set of questions. All
variables take the value of one if the question was answered in the affirmative. Satisfaction with water
provision: satisfied with the quantity of the water supply and the quality of the water supply respectively.
Satisfaction with public transport: satisfied with the frequency, reliability, cost of public bus system, the
quality of the buses and the behavior of the driver/conductor. Satisfaction with schools: satisfied with
(if available) the school’s building, playground, recreational facilities, classrooms, toilets, drinking water,
meals, quality of the teaching, quality of study material and behavior of teacher. Satisfaction with fair
price shops: satisfied with the quality of items, the quantity of items, the fairness of shopkeeper and
the availability of items in the shop. Satisfaction with health care: satisfied with treatment, behavior
of doctors, behavior or paramedical staff quality of medicine, cleanliness inside the facility in outpatient
health facilities and satisfied with treatment, behavior of doctors, behavior or paramedical staff quality
of medicine, quality of food, cleanliness inside the wards, cleanliness inside the bathrooms in inpatient
health facilities.
35

Figure 1: Political Reservation and Female Leadership
0
0.1
0.2
0.3
0.4
0.5
0.6
0.7
0.8
0.9
1
Total GP First reserved 2003 Reserved 1998 and 2003 Only reserved 1998 Never Reserved
Note: There are 165 GPs; 35 were reserved for the first time in 2003 (First Reserved 2003) and 20 for second time (Reserved 1998 and 2003). All reserved GPs have women Pradhans except 1 second reserved GP which had no election due to political unrest.
Frac
tion
Fem
ale
Prad
hans
2003 1998

First Reserved
2003
Reserved 1998 and
2003
Only Reserved
1998Never
ReservedDiff: (1) and (2)
Diff: (3) and (4)
Census Variable (1) (2) (3) (4) (5) (6)
Total Population 1,318 1,197 1,267 1,362 -102.279 -78.373(1318) (1295) (1418) (1555) (178.537) (189.410)
Fraction SC / ST Population 0.432 0.502 0.450 0.471 0.004 -0.001(0.281) (0.256) (0.235) (0.265) (0.056) (0.033)
Average Household Size 5.436 5.222 5.362 5.497 0.137 -0.059(0.612) (0.449) (0.571) (2.454) (0.093) (0.135)
Sex Ratio Under 6 1.093 1.034 1.046 1.036 0.206 0.015(0.590) (0.276) (0.218) (0.226) (0.113) (0.025)
Literacy 0.387 0.351 0.391 0.373 0.014 0.021(0.119) (0.129) (0.121) (0.137) (0.032) (0.017)
Fraction Women Literate 0.287 0.265 0.296 0.275 -0.003 0.023(0.125) (0.123) (0.113) (0.134) (0.033) (0.016)
Fraction Irrigated Land 0.599 0.485 0.607 0.500 -0.038 0.054(0.321) (0.349) (0.323) (0.352) (0.054) (0.049)
Village has a Bus or Train Stop 0.280 0.433 0.290 0.259 -0.130 0.061(0.451) (0.500) (0.456) (0.439) (0.097) (0.054)
Village has Permanent Approach Road 0.110 0.300 0.176 0.194 -0.225 -0.006(0.314) (0.462) (0.383) (0.397) (0.082) (0.052)
Village has Tube Well 0.910 0.933 0.912 0.977 -0.022 -0.018(0.288) (0.252) (0.285) (0.151) (0.020) (0.031)
Village has Hand Pump 0.124 0.000 0.100 0.057 0.000 0.013(0.331) (0.000) (0.302) (0.233) (0.000) (0.012)
Village has Well 0.440 0.533 0.402 0.528 0.043 -0.066(0.499) (0.503) (0.493) (0.500) (0.082) (0.074)
Village has Community Tap 0.065 0.050 0.042 0.010 0.022 -0.018(0.248) (0.220) (0.202) (0.098) (0.020) (0.017)
Number of Schools 1.190 1.233 1.265 1.160 -0.167 0.149(0.895) (0.810) (0.889) (0.910) (0.160) (0.111)
Number of Health Facilities 0.170 0.217 0.118 0.218 -0.036 -0.015(0.403) (0.490) (0.324) (0.809) (0.090) (0.069)
Overall Effect: F stat 0.300 0.600Overall Effect: p value 0.586 0.438N 105 60 108 222
Notes:1
2
3
Table 1. Village-level Randomization Check
The census variables are from the 1991 Census of India. N refers to the maximum number of observations. Infrastructure variables have between 454 and 478 total observations across GPs.
"First Reserved 2003," "Reserved 1998 and 2003," "Only Reserved 1998," and "Never Reserved" are indicator variables for GPs reserved for a female Pradhan for the first time in 2003, in both 1998 and 2003, only in 1998, and not reserved in either election, respectively. Columns (1)-(4) report means with standard deviations in parenthesis. Columns (5)-(6) report tests of differences of means across columns (1) and (2) and columns (3) and (4), respectively. Standard errors are in parentheses. Tests are based on regressions with block fixed effects and standard errors are clustered by GP.
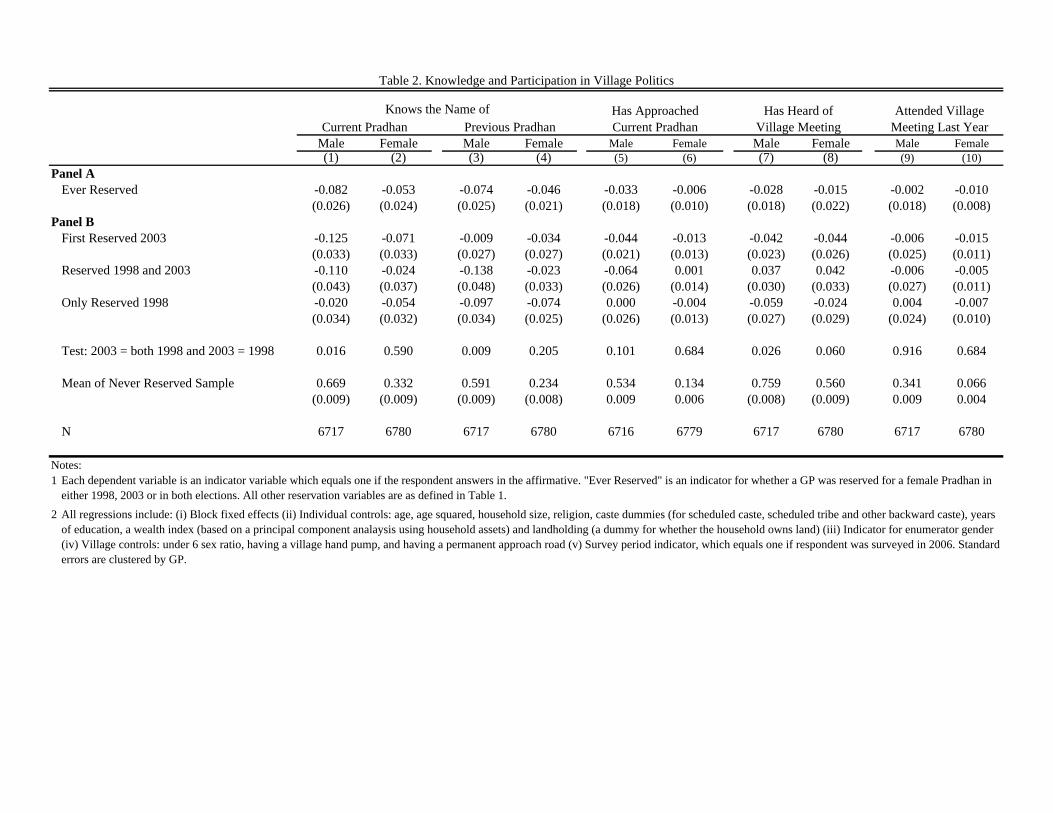
Male Female Male Female Male Female Male Female Male Female(1) (2) (3) (4) (5) (6) (7) (8) (9) (10)
Panel AEver Reserved -0.082 -0.053 -0.074 -0.046 -0.033 -0.006 -0.028 -0.015 -0.002 -0.010
(0.026) (0.024) (0.025) (0.021) (0.018) (0.010) (0.018) (0.022) (0.018) (0.008)Panel B
First Reserved 2003 -0.125 -0.071 -0.009 -0.034 -0.044 -0.013 -0.042 -0.044 -0.006 -0.015(0.033) (0.033) (0.027) (0.027) (0.021) (0.013) (0.023) (0.026) (0.025) (0.011)
Reserved 1998 and 2003 -0.110 -0.024 -0.138 -0.023 -0.064 0.001 0.037 0.042 -0.006 -0.005(0.043) (0.037) (0.048) (0.033) (0.026) (0.014) (0.030) (0.033) (0.027) (0.011)
Only Reserved 1998 -0.020 -0.054 -0.097 -0.074 0.000 -0.004 -0.059 -0.024 0.004 -0.007(0.034) (0.032) (0.034) (0.025) (0.026) (0.013) (0.027) (0.029) (0.024) (0.010)
Test: 2003 = both 1998 and 2003 = 1998 0.016 0.590 0.009 0.205 0.101 0.684 0.026 0.060 0.916 0.684
Mean of Never Reserved Sample 0.669 0.332 0.591 0.234 0.534 0.134 0.759 0.560 0.341 0.066(0.009) (0.009) (0.009) (0.008) 0.009 0.006 (0.008) (0.009) 0.009 0.004
N 6717 6780 6717 6780 6716 6779 6717 6780 6717 6780
Notes:1
2
Each dependent variable is an indicator variable which equals one if the respondent answers in the affirmative. "Ever Reserved" is an indicator for whether a GP was reserved for a female Pradhan in either 1998, 2003 or in both elections. All other reservation variables are as defined in Table 1.All regressions include: (i) Block fixed effects (ii) Individual controls: age, age squared, household size, religion, caste dummies (for scheduled caste, scheduled tribe and other backward caste), years of education, a wealth index (based on a principal component analaysis using household assets) and landholding (a dummy for whether the household owns land) (iii) Indicator for enumerator gender (iv) Village controls: under 6 sex ratio, having a village hand pump, and having a permanent approach road (v) Survey period indicator, which equals one if respondent was surveyed in 2006. Standard errors are clustered by GP.
Table 2. Knowledge and Participation in Village Politics
Current Pradhan Previous PradhanKnows the Name of Has Approached
Current PradhanHas Heard of
Village MeetingAttended Village
Meeting Last Year

Male Female Male Female Male Female Male Female(1) (2) (3) (4) (5) (6) (7) (8)
Panel AEver Reserved 0.098 -0.025 0.216 0.046 -0.006 0.0003 -0.010 -0.0084
(0.077) (0.075) (0.110) (0.107) (0.032) (0.043) (0.034) (0.037)Panel B
First Reserved 2003 0.142 0.014 0.237 0.054 -0.047 0.013 -0.007 0.016(0.100) (0.100) (0.156) (0.144) (0.043) (0.051) (0.050) (0.049)
Reserved 1998 and 2003 -0.105 -0.136 0.092 -0.009 0.034 0.045 0.008 -0.001(0.125) (0.107) (0.157) (0.145) (0.042) (0.070) (0.052) (0.054)
Only Reserved 1998 0.187 0.007 0.275 0.071 0.011 -0.059 -0.027 -0.040(0.105) (0.098) (0.150) (0.143) (0.046) (0.051) (0.045) (0.051)
Test: 2003 = both 1998 and 2003 = 1998 0.136 0.439 0.622 0.898 0.274 0.230 0.830 0.624
Mean of Never Reserved Sample 0.691 0.181 1.446 0.560 0.134 -0.157 0.093 -0.079(0.052) (0.047) (0.067) (0.064) (0.025) (0.026) (0.027) (0.025)
N 3511 3672 3511 3671 510 408 554 510
Notes:12
34
The p-value from a Wald test of the equality of the coefficients on First Reserved in 2003, Reserved 1998 and 2003, and Only Reserved 1998 is reported.
The dependent variables in Columns (1)-(4) are the differences in the responses to the question on a scale of 1-10 "How do you feel towards a male y" and "How do you feel
Variation in sample size reflects the fact that the IAT and ladder questionnaire were administered to all available adults in 5 households per village. Each respondent was administered one of the three IATs. The IAT sample excludes data from pilot villages.
Reservation indicators are defined in Table 1 and 2 notes. All columns include block fixed effects and the controls listed in Table 2 notes. Standard errors are clustered by GP.
Table 3. Explicit and Implicit Preferences for Female Leaders
Male versus Female Villager
Male versus Female Pradhan
Male/Female Names and Good/Bad
Male/Female Politician and Good/Bad
Feeling Ladder IAT (D-measure of bias against females)

Male Female(1) (2)
Panel AEver Reserved -0.077 0.021
(0.030) (0.040)Panel B
First Reserved 2003 -0.086 0.122(0.040) (0.053)
Reserved 1998 and 2003 -0.036 -0.106(0.047) (0.072)
Only Reserved 1998 -0.094 -0.027(0.040) (0.049)
Test: 2003 = both 1998 and 2003 = 1998 0.507 0.010
Mean of Never Reserved Sample 0.110 0.150(0.021) (0.027)
N 477 357
Notes:1
2
3
The regressions include the controls defined in notes to Table 2, and standard errors are clustered by GP. The sample size reflects the sampling strategy (see Table 3 notes).
Table 4. Gender and Leadership: Implicit Associations
Dependent variables are the IAT D-measure, defined in notes to Table 3. A positive D-measure indicates a stereotype associating women with domestic activities and men with leadership activities. Reservation variables are as defined in Tables 1 and 2 notes.
The p-value from a Wald test of the equality of the coefficients on First Reserved in 2003, Reserved 1998 and 2003 and Only Reserved 1998 is reported.
IAT (D-measure of bias against females)
Leadership/Domestic and Male/Female

Male Female Male Female Male Female Male Female Male Female(1) (2) (3) (4) (5) (6) (7) (8) (9) (10)
Panel AFemale Pradhan -0.055 -0.035 -0.076 -0.043 -0.047 -0.029 -0.055 -0.003 -0.031 -0.055
(0.027) (0.031) (0.036) (0.042) (0.032) (0.034) (0.033) (0.032) (0.029) (0.027)Female Pradhan * Ever Reserved 0.096 0.020 0.121 0.026 0.084 0.022 0.102 0.008 0.066 0.026
(0.037) (0.039) (0.049) (0.051) (0.042) (0.043) (0.043) (0.041) (0.040) (0.039)
Test: Female Pradhan + Female Pradhan * Ever Reserved 0.041 -0.014 0.045 -0.018 0.037 -0.006 0.047 0.005 0.035 -0.029
(0.024) (0.023) (0.032) (0.029) (0.027) (0.026) (0.027) (0.025) (0.026) (0.027)Panel B
Female Pradhan * First Reserved 2003 0.118 -0.003 0.173 -0.026 0.101 -0.011 0.128 -0.025 0.042 0.048(0.047) (0.048) (0.063) (0.064) (0.052) (0.052) (0.056) (0.050) (0.051) (0.049)
Female Pradhan * Reserved 1998 & 0.097 0.050 0.096 0.055 0.108 0.045 0.111 0.056 0.087 0.065(0.061) (0.060) (0.083) (0.073) (0.064) (0.070) (0.069) (0.069) (0.058) (0.065)
Female Pradhan * Only Reserved 1998 0.077 0.030 0.090 0.065 0.054 0.046 0.073 0.015 0.076 -0.015(0.048) (0.046) (0.062) (0.058) (0.056) (0.053) (0.054) (0.050) (0.054) (0.051)
Test: FP* 2003 = FP* (both 1998 and 2003) = FP* 1998 0.757 0.671 0.486 0.348 0.666 0.556 0.663 0.491 0.751 0.446
Notes:1
2
3
Table 5. Perception of Female Effectiveness as Leaders: Experimental Evidence (Speech and Vignettes)
Is EffectiveCares about
Villagers' Welfare
Average Coefficients
Perform Duties Well
PradhanApprove/Agree of
PradhanAverage Effect
Test: FP* 2003 = FP* (both 1998 and 2003) = FP* 1998 reports the p-value from a Wald test of the equality of the coefficients on Female Pradhan interactions with First Reserved in 2003, Reserved 1998 and 2003, and Only Reserved 1998 respectively.
The outcome variables are averages of questions in speech and vignettes (listed in Appendix Table 1). Responses to each question are separately standardized by subtracting the mean for the never reserved sample and dividing by the standard deviation. In Columns (1) and (2) the outcome of interest is the average across all the questions. In Columns (3)-(10) we report four separate averages, where we average across subsets of the outcomes. "Performs duties well" averages across the questions "Pradhan addressed villagers satisfactorily," "Pradhan will allocate BPL cards well," "Pradhan will get resources by lobbying," and "Pradhan will collect villagers' share well" in the speech. "Approve/Agree of Pradhan" averages across "Village approves Pradhan's budget" in the speech and "Agree with Pradhan" question in the vignettes.
Female Pradhan is an indicator for when the leader delivering the speech was female or the Pradhan depicted in the vignettes was female. All regressions include thecontrols defined in Table 2, and standard errors are clustered by GP. The regressions also include: in Panel A, Ever Reserved and in Panel B, First Reserved 2003,Reserved 1998 or 2003, and Only Reserved 1998 (see Tables 1 and 2 notes for definitions).

All Male Female All Male Female(1) (2) (3) (4) (5) (6)
Female Pradhan -0.042 -0.032 -0.045 0.025 0.038 0.026(0.031) (0.051) (0.037) (0.047) (0.104) (0.054)
Female Pradhan * Ever Reserved 0.039 0.059 0.032 -0.042 -0.039 -0.020(0.038) (0.066) (0.047) (0.056) (0.127) (0.068)
Female Pradhan * Ever Reserved * Knows Pradhan's na 0.042 0.050 -0.025 0.188 0.182 0.108 (0.044) (0.076) (0.073) (0.087) (0.165) (0.160)Ever Reserved 0.017 -0.036 0.035 0.064 0.000 0.049
(0.040) (0.057) (0.043) (0.055) (0.105) (0.061)Ever Reserved * Knows Pradhan's name -0.023 0.000 0.037 -0.100 -0.039 0.006
(0.041) (0.055) (0.057) (0.082) (0.139) (0.120)Female Pradhan * Knows Pradhan's name -0.003 -0.029 0.027 -0.122 -0.121 -0.160
(0.036) (0.058) (0.055) (0.069) (0.132) (0.113)Knows Pradhan's name 0.076 0.057 0.061 0.183 0.168 0.150
(0.032) (0.042) (0.043) (0.074) (0.121) (0.095)
Notes:1
2
3
Table 6. Female Leadership: Experimental Evidence by Exposure Level
OLS
The excluded instruments for "Knows Pradhan's name" are the indicator variables: knows MLA, reads newspaper, has heard of Gram Sabha, lives in the same village as Pradhan, and is the same caste as Pradhan.
IV
The dependent variable is the average of speech and vignette variables listed in Appendix Table 1. We estimate the effect on the average of all the dependent variables in the speech and vignettes as explained in Table 5. "Knows Pradhan's name" is an indicator variable equal to one if the respondent knows the name of the current or previous Pradhan. Female Pradhan is an indicator for when the leader delivering the speech was female or the Pradhan depicted in the vignettes was female. Columns (1)-(3) report OLS regressions and Columns (4)-(6) IV regressions. All regressions include the controls defined in Table 2, and standard errors are clustered by GP.
Average Effect (speech and vignette)

Male Female Male Female Male Female Male Female Male Female(1) (2) (3) (4) (5) (6) (7) (8) (9) (10)
First Reserved 2003 -0.202 -0.072 -0.205 -0.090 -0.206 -0.109 -0.214 -0.045 -0.206 -0.087(0.057) (0.059) (0.064) (0.070) (0.062) (0.063) (0.060) (0.064) (0.067) (0.061)
Reserved 1998 and 2003 0.014 -0.009 -0.029 -0.027 -0.033 -0.042 0.003 0.024 0.129 0.017(0.071) (0.049) (0.078) (0.059) (0.079) (0.059) (0.067) (0.047) (0.083) (0.053)
Only Reserved 1998 (currently unreserved) -0.009 0.029 0.006 -0.003 0.001 -0.011 -0.007 0.079 -0.070 0.048(0.059) (0.054) (0.068) (0.066) (0.068) (0.062) (0.060) (0.054) (0.063) (0.054)
Test: 2003 = both 1998 and 2003 = 1998 0.008 0.270 0.025 0.511 0.022 0.372 0.005 0.187 0.003 0.086Test: 2003 = both 1998 and 2003 0.009 0.329 0.052 0.419 0.053 0.377 0.007 0.300 0.001 0.140
N 6642 6568 6530 6315 6590 6363 6471 6323 6246 5893
Notes:1
23
Pradhan is effectiveAverage Effect
The p-values from Wald tests of the equality of the coefficients on First Reserved in 2003, Reserved 1998 and 2003, and Only Reserved 1998; and First Reserved in 2003 and Reserved in 1998 and 2003 are reported.
Table 7. Actual Pradhan Evaluation
All regressions include controls as defined in Table 2, and standard errors are clustered by GP.
The outcome variables in Columns (1)-(2) are averages of the questions listed in Columns (3)-(10). Responses to each question are separately standardized by subtracting the mean for the never reserved sample and dividing by the standard deviation.
Looking after village needs Making BPL lists
Looking after your needs
Pradhan did a good job

Average Bribes
Alignment with Female Preferences
Quantity Quality Male Female(1) (2) (3) (4) (5) (6)
First Reserved 2003 0.192 -0.043 -0.077 0.038 -0.004 0.521(0.070) (0.046) (0.032) (0.040) (0.043) (0.279)
Reserved 1998 and 2003 0.039 -0.030 -0.058 -0.072 -0.040 0.659(0.061) (0.052) (0.030) (0.052) (0.045) (0.358)
Only Reserved 1998 (currently unreserved) 0.097 -0.069 -0.033 -0.012 0.029 0.563(0.082) (0.037) (0.037) (0.047) (0.043) (0.243)
Test: 2003 = both 1998 and 2003 = 1998 0.127 0.763 0.482 0.174 0.375 0.942Test: 2003 = both 1998 and 2003 0.343 0.847 0.596 0.065 0.494 0.730
Notes:1
2
3
4
Table 8. Pradhan Performance: Public Goods, Bribes and Satisfaction
Column (6) tests whether there is more investment in reserved GPs in goods mentioned more frequently by women, as measured by formal complaints to the GP during 6 months in 2000. We report the coefficients from the interaction of reservation status and the average difference between fraction of requests for goods in category i from women and from men. Categories analyzed are: drinking water, road improvement, education, irrigation, and other.
Average Public Good Provision Average Satisfaction
In Column (1) the outcome variable is the average quantity across public goods (see Appendix Table 2 for full list), and in Columns (2)-(5) the outcome variables are the average across quality measures for different public goods, average across indicators for paying bribes, and average across satisfaction with various public goods respectively (see Data Appendix). In all cases, the individual outcome variables are normalized by the mean and standard deviation of the never reserved sample.
The sample in columns (1), (2) and (6) regressions are 495 villages, while columns (3)-(5) regressions use household surveys. Household survey regressions include the set of controls defined in Table 2.The p-values from Wald tests of the equality of the coefficients on First Reserved in 2003, Reserved 1998 and 2003, and Only Reserved 1998; and First Reserved in 2003 and Reserved in 1998 and 2003 are reported.

AgeYears of
Education Married SC/ST
Wealth Index:
Quartile 1
Wealth Index:
Quartile 4
Not First Time as
Pradhan in 2003 Term
Average Political
Experience
Affiliated with
CPI(M)
Spouse Ever
Elected to Panchayat
(1) (2) (3) (4) (5) (6) (7) (8) (9) (10)First Reserved 2003 -5.780 -2.329 -0.184 0.047 0.170 -0.113 -0.266 -0.422 -0.029 0.006
(1.890) (0.719) (0.089) (0.107) (0.100) (0.073) (0.083) (0.146) (0.087) (0.009)Reserved 1998 and 2003 -6.692 -1.209 0.018 -0.023 0.089 0.019 -0.036 -0.136 0.198 0.047
(2.305) (0.792) (0.084) (0.138) (0.121) (0.118) (0.128) (0.194) (0.091) (0.054)Only Reserved 1998 0.718 0.550 -0.026 0.025 -0.073 0.032 -0.008 -0.043 -0.061 0.032(currently unreserved) (2.112) (0.641) (0.064) (0.109) (0.086) (0.090) (0.108) (0.208) (0.092) (0.029)
Mean of Never Reserved Sample 41.194 10.278 0.889 0.514 0.208 0.208 0.389 0.681 0(1.146) (0.377) (0.037) (0.059) (0.048) (0.048) (0.058) (0.055) (0)
Test: 2003 = both 1998 and 2003 0.721 0.229 0.085 0.659 0.574 0.278 0.084 0.183 0.049 0.438Notes:
1
2
Table 9. Pradhan Characteristics
Wealth Index is based on a principal componens analysis using the number of household assets. Average Political Experience is the average of the normalized number of times Pradhan was elected to the GP council and normalized indicator for whether the Pradhan has or holds other political office, including: ward member, member of higher panchayat, MP, MLA, youth party president, district/block level posts of party, Mahila Samiti. CPI(M) refers to the Communist Party of India (Marxist). All regressions include block fixed effects and standard errors are clustered at the GP level.Reservation types are defined in the notes of Table 1.

Male Female(1) (2)
I. Evaluation of New PradhansFirst Time as Pradhan in 2003 Term 0.016 0.007
(0.072) (0.073)II. Evaluation of SC Pradhans
Reserved for SC in 2003 -0.100 -0.030(0.067) (0.064)
Reserved for SC in 1998 -0.082 -0.052(0.058) (0.053)
Reserved for SC in 2003 * Reserved for Woman in 1998 0.125 0.006(0.132) (0.119)
III. Evaluation of Female Pradhans and SC ReservationFirst Reserved 2003 (for Woman) -0.212 -0.070
(0.074) (0.075)Reserved 1998 and 2003 (for Woman) 0.042 0.003
(0.087) (0.063)Only Reserved 1998 (for Woman) 0.007 -0.028
(0.086) (0.076)First Reserved 2003 * Previously Reserved for SC 0.040 -0.007
(0.132) (0.131)IV. SC Reservation on Female Leadership: Speech and Vignettes ResultsPanel A
Female Pradhan -0.046 -0.040(0.035) (0.034)
Female Pradhan * Ever Reserved SC -0.014 0.020(0.039) (0.039)
Panel BFemale Pradhan * Reserved for SC in 2003 0.004 0.017
(0.042) (0.045)Female Pradhan * Reserved for SC in 1998 -0.028 0.030
(0.047) (0.048)
Notes:1
2
3
4
5
6
The regressions in Panel I-III use the average evaluation coefficient for Pradhan (explained in notes to Table 7) as the dependent variable.
In Panel II the explanatory variables of interest are whether the GP was reserved for SC in the 2003 and 1998 elections and the interaction of being reserved for a woman Pradhan in 1998 and being reserved for an SC Pradhan in 2003.
In Panel III, the explanatory variables of interest are the women reservation status indicators and the interaction of "Previously Reserved for SC" indicator with the "First Reserved 2003" indicator. The regressions also include the interaction of "Only Reserved 1998" and "Reserved 1998 and 2003" with "Previously Reserved for SC" indicator.
All regressions include the controls defined in Table 2, and standard errors are clustered by GP. Reservation types are defined in the notes of Table 1.
The regressions in Panel IV use the average perception of Pradhan effectiveness in the speech and vignettes (explained in notes to Table 5) as the dependent variable. The explanatory variables of interest are the indicators for female Pradhan in the speech/vignette and the interaction of this indicator with the reservation for SC status of the GP. In addition, the regressions include the indicator variables for ever reserved for SC in Panel A, and reserved for SC in 2003 and 1998 in Panel B.
In Panel I the explanatory variable of interest is whether the Pradhan was elected for the first time in 2003 and the sample is restricted to the set of never reserved Pradhans.
Table 10. RobustnessAverage effect

Satisfied with Current Life
Gender Negatively Affected Ability to do
DutiesDo not plan to re-run for
PradhanContestants in
2008 GP ElectionsWinners in 2008
GP Elections(1) (2) (3) (4) (5)
Reserved for the first time (either 1998 or 2003) 0.341 0.124(0.138) (0.056)
First Reserved 2003 -0.470 -0.008 0.000(0.217) (0.011) (0.018)
Reserved 1998 and 2003 0.379 -0.033 0.033 0.052(0.262) (0.102) (0.016) (0.031)
Only Reserved 1998 -0.148 -0.006 0.006(0.216) (0.011) (0.018)
Test: 2003 = both 1998 and 2003 0.006 0.016 0.113
Mean of Never Reserved Sample 3.708 0.215 0.052 0.048(0.113) (0.028) (0.221) (0.215)
N 161 108 327 3438 1185
Year of survey 2006-07Notes:1
2
3
4
56 All regressions include block fixed effects, and standard errors are clustered by GP in Columns (4) and (5).
In Columns (1), (4) and (5) the p-value is from a Wald test of the equality of the coefficients on First Reserved in 2003 and Reserved 1998 and 2003.
Columns (4) and (5) use the election results from the May 2008 elections in Birbhum district for council member seats not reserved for women. In Column (4), the dependent variable is an indicator equal to one if the contestant for a seat is female, while in Column (5), the dependent variable is an indicator equal to one if the winner of a seat is female. All other reservation variables are as defined in Table 1.
2008 GP Election Results for Council wards Not Reserved for Women
"Satisfied with Current Life" is on a scale of 1 to 5. "Gender Negatively Affected Ability to do Duties" and "Does not plan to re-run for Pradhan" are indicator variables which equal one if the respondent answers in the affirmative.Columns (2) and (3) use surveys conducted in 2000 and 2006-07 which collected data on Pradhans elected in 1998 and 2003 respectively. Regressions include an indicator for survey round. "Reserved for the first time" is a dummy equal to one if the GP was reserved for the first time in either 1998 and Pradhan was interviewed in 2000 or the GP was reserved for the first time in 2003 and the Pradhan was interviewed in 2006-07. All other reservation variables are as defined in Table 1.Column (1) regression includes the sample of Pradhans elected in 2003, the regression in Column (2) includes the sample of Pradhans elected from women reserved GPs in 1998 and 2003 and Column (3) includes all Pradhans elected in either 1998 and 2003.
2000 (for Pradhans elected 1998), 2006-07 (for Pradhans elected 2003)
Pradhan's PerceptionTable 11. Pradhan Perceptions and 2008 GP Elections Electoral Outcomes
Fraction Women Among

Pradhan is
effective
Address-ed villager
satisfact-orily
Cares about
villagers' welfare
Will allocate
BPL cards well
Villager approves Pradhan's
budget
Pradhan will get
resources by
lobbying
Pradhan will
collect villagers' share well
Pradhan is effective
Cares about
villagers' welfare
Agree with
Pradhan
Would vote for Pradhan
Pradhan is
effective
Cares about villagers' welfare
Agree with Pradhan
Would vote for Pradhan
(1) (2) (3) (4) (5) (6) (7) (8) (9) (10) (11) (12) (13) (14) (15)I. MalesPanel A
Female Pradhan -0.066 -0.111 -0.082 -0.041 -0.034 -0.070 -0.082 -0.061 -0.059 -0.145 -0.077 0.037 0.029 0.045 0.062(0.040) (0.041) (0.042) (0.042) (0.042) (0.038) (0.042) (0.054) (0.055) (0.054) (0.060) (0.064) (0.065) (0.053) (0.053)
Female Pradhan * Ever Reserved 0.098 0.114 0.129 0.099 0.054 0.144 0.129 0.155 0.170 0.124 0.096 -0.015 -0.015 0.019 0.037(0.053) (0.055) (0.055) (0.056) (0.056) (0.052) (0.053) (0.072) (0.075) (0.072) (0.077) (0.080) (0.082) (0.071) (0.076)
Panel BFemale Pradhan * First Reserved 2003 0.156 0.139 0.199 0.191 0.053 0.181 0.180 0.140 0.169 0.074 0.035 -0.027 -0.032 0.035 0.046
(0.068) (0.067) (0.068) (0.071) (0.067) (0.070) (0.071) (0.095) (0.096) (0.085) (0.092) (0.101) (0.109) (0.100) (0.108)
Female Pradhan * Reserved 1998 & 2003 0.096 0.064 0.092 0.064 0.060 0.122 0.135 0.173 0.219 0.168 0.142 0.052 0.032 -0.029 0.031(0.081) (0.093) (0.088) (0.095) (0.100) (0.092) (0.084) (0.093) (0.112) (0.107) (0.106) (0.118) (0.120) (0.115) (0.123)
Female Pradhan * Only Reserved 1998 0.043 0.117 0.083 0.035 0.054 0.125 0.084 0.165 0.149 0.153 0.130 -0.043 -0.027 0.022 0.025(0.070) (0.073) (0.071) (0.075) (0.075) (0.066) (0.064) (0.100) (0.104) (0.103) (0.107) (0.097) (0.093) (0.081) (0.095)
Test: FP* 2003 = FP* (both 1998 and 2003) = FP* 1998 0.349 0.747 0.281 0.167 0.998 0.756 0.429 0.953 0.870 0.637 0.549 0.724 0.863 0.884 0.985
N 6715 6716 6715 6714 6551 6715 6716 3173 3173 3172 3116 3544 3544 3543 3503II. FemalesPanel A
Female Pradhan -0.051 -0.029 -0.055 0.008 -0.089 -0.081 -0.072 -0.058 -0.010 -0.098 -0.082 0.031 0.090 0.006 0.032(0.045) (0.046) (0.046) (0.045) (0.045) (0.045) (0.045) (0.058) (0.056) (0.055) (0.057) (0.047) (0.047) (0.041) (0.047)
Female Pradhan * Ever Reserved 0.010 0.030 0.019 -0.026 0.075 0.057 0.042 0.018 -0.049 -0.049 -0.036 0.016 0.002 0.003 0.008(0.055) (0.057) (0.057) (0.056) (0.058) (0.057) (0.056) (0.072) (0.071) (0.075) (0.076) (0.060) (0.061) (0.061) (0.062)
Panel BFemale Pradhan * First Reserved 2003 -0.034 -0.026 -0.033 -0.084 0.071 0.004 -0.001 0.002 -0.070 -0.003 -0.020 0.012 0.016 0.064 0.090
(0.068) (0.074) (0.069) (0.066) (0.078) (0.071) (0.075) (0.083) (0.082) (0.093) (0.088) (0.076) (0.086) (0.078) (0.086)Female Pradhan * Reserved 1998 & 2003 0.025 0.079 0.065 0.004 0.075 0.083 0.060 0.051 -0.001 -0.029 0.093 0.035 0.044 0.035 -0.115
(0.075) (0.079) (0.086) (0.091) (0.078) (0.093) (0.072) (0.095) (0.102) (0.094) (0.105) (0.093) (0.090) (0.114) (0.103)Female Pradhan * Only Reserved 1998 0.049 0.062 0.050 0.019 0.087 0.099 0.079 -0.006 -0.084 -0.133 -0.149 0.013 -0.032 -0.079 -0.001
(0.066) (0.066) (0.069) (0.067) (0.068) (0.066) (0.066) (0.104) (0.098) (0.108) (0.110) (0.079) (0.075) (0.084) (0.071)
Test: FP* 2003 = FP* (both 1998 and 2003) = FP* 1998 0.496 0.392 0.410 0.314 0.977 0.422 0.570 0.846 0.741 0.522 0.183 0.970 0.721 0.341 0.202
N 6771 6772 6771 6770 6372 6770 6770 2869 2869 2869 2740 3908 3908 3902 3797Notes:1
2
3
Table A1. Female Leadership and Prejudice -- Speech and Vignette Results
All regressions include individual controls as defined in Table 2, and standard errors are clustered by GP. The regressions also include: in Panel A, Ever Reserved and in Panel B, First Reserved 2003, Reserved 1998 or 2003, and Only Reserved 1998 (see Tables 1 and 2 notes for definitions). Female Pradhan is an indicator for when the leader delivering the speech was female or the Pradhan depicted in the vignettes was female.
Speech Irrigation Vignette Water Vignette
Dependent variables in Columns (1)-(4) and (6)-(7) are originally on a scale of 1 to 10, while dependent variables in Column (5) are indicator variables, then normalized by the mean and standard deviation of the never reserved sample. In the vignette experiments, "Effectiveness of leader" and "Cares about villager welfare" are originally on a scale of 1 to 10, while "Agree with Pradhan" and "Would vote for Pradhan" are indicator variables which equal one if the respondent answers in the affirmative, then normalized by the mean and standard deviation of the never reserved sample.

N
GP Reserved only in 2003
GP Previously Reserved in
1998
GP Reserved in
2003 and 1998
Mean of Never
ReservedAt Least One New Tubewell was Built 495 0.152 0.073 0.160 0.365
(0.066) (0.063) (0.088) (0.482)At Least One Tubewell was Repaired 482 0.208 0.130 0.080 0.628
(0.067) (0.064) (0.089) (0.484)At Least One Drainage/Sanitation Facility was Built 495 0.053 -0.113 0.052 0.428
(0.067) (0.059) (0.091) (0.496)At Least One Drainage/Sanitation Facility was Repaired 396 0.150 -0.017 0.032 0.178
(0.067) (0.062) (0.071) (0.384)At Least One Irrigation Pump was Built 495 0.137 0.005 -0.013 0.180
(0.053) (0.051) (0.050) (0.385)At Least One Irrigation Pump was Repaired 319 0.110 -0.078 -0.005 0.417
(0.092) (0.086) (0.123) (0.495)Number of Metal Roads Built or Repaired Since 2003 495 0.274 0.046 0.079 0.118
(0.117) (0.070) (0.065) (0.448)Number of transportation related infrastructure 495 0.074 0.250 0.303 1.302
(bus stop, bus service, taxi) (0.175) (0.160) (0.225) (1.201)At Least One Educational Facility was Built 495 0.053 -0.030 0.026 0.117
(0.042) (0.036) (0.055) (0.322)At Least One Educational Facility was Repaired 465 0.165 0.039 0.001 0.296
(0.072) (0.069) (0.097) (0.458)At Least One Community Education Center 495 -0.007 0.030 -0.001 0.009
(0.010) (0.023) (0.009) (0.095)There is a NGO Child Center/Creche 495 -0.045 -0.039 -0.027 0.045
(0.016) (0.021) (0.023) (0.208)Number of Health Facilities (PHC, Health Sub Center) 495 -0.025 0.027 -0.005 0.257
(0.049) (0.052) (0.084) (0.468)At Least One Health Facility was Built 495 0.011 -0.004 -0.018 0.014
(0.015) (0.014) (0.009) (0.116)At Least One Health Facility was Repaired (0 if no fac) 495 0.061 0.016 0.047 0.009
(0.023) (0.016) (0.024) (0.095)Number of Trained Dais, Untrained Dais and 495 -0.069 -0.158 0.384 1.014
Private Doctors (0.232) (0.226) (0.423) (2.012)
Average Effect 0.192 0.039 0.097(0.070) (0.061) (0.082)
Notes:123
Table A2. Effect of Female Leadership on Public Goods Quantity
Average effect coefficients are from a regression on the average of all the dependent variables listed in the rows above normalized by the mean and standard deviation of the never reserved sample.
Coefficients on:
All regressions include block fixed effects, and standard errors are clustered by GP. Reservation status defined in Table 1.

Figure A1: Female/Male Politician Good/Bad Stereotypic Block Example
Figure A2: Participant Performing IAT