Embed Size (px)
Citation preview
Powerful Presentations
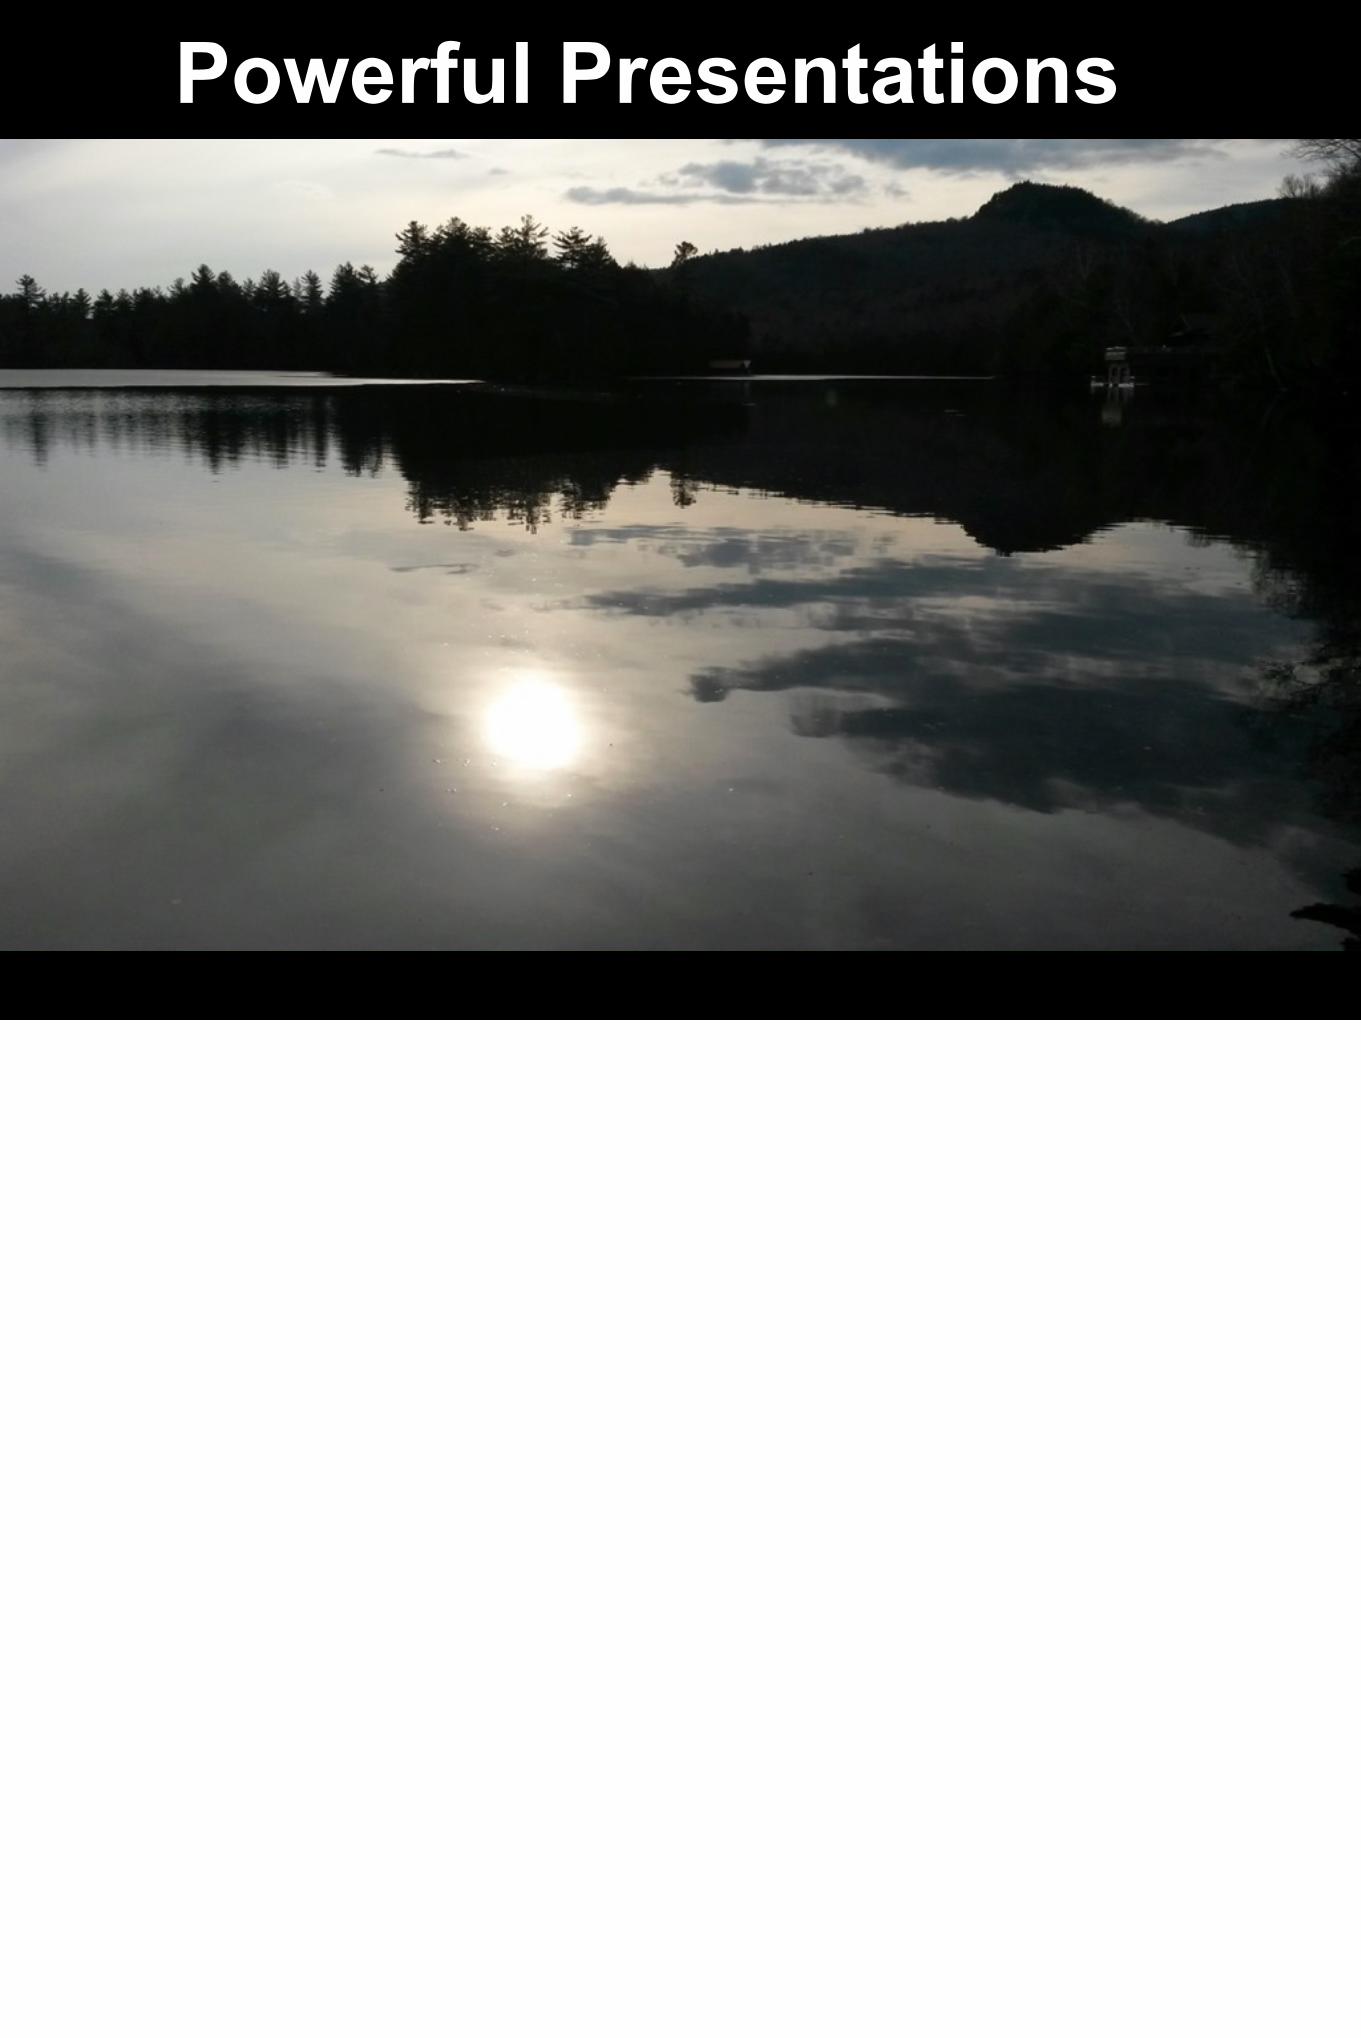
Ques%on: Ever experienced a terrible presenta%on? 100‘s of slides? Death by Powerpoint
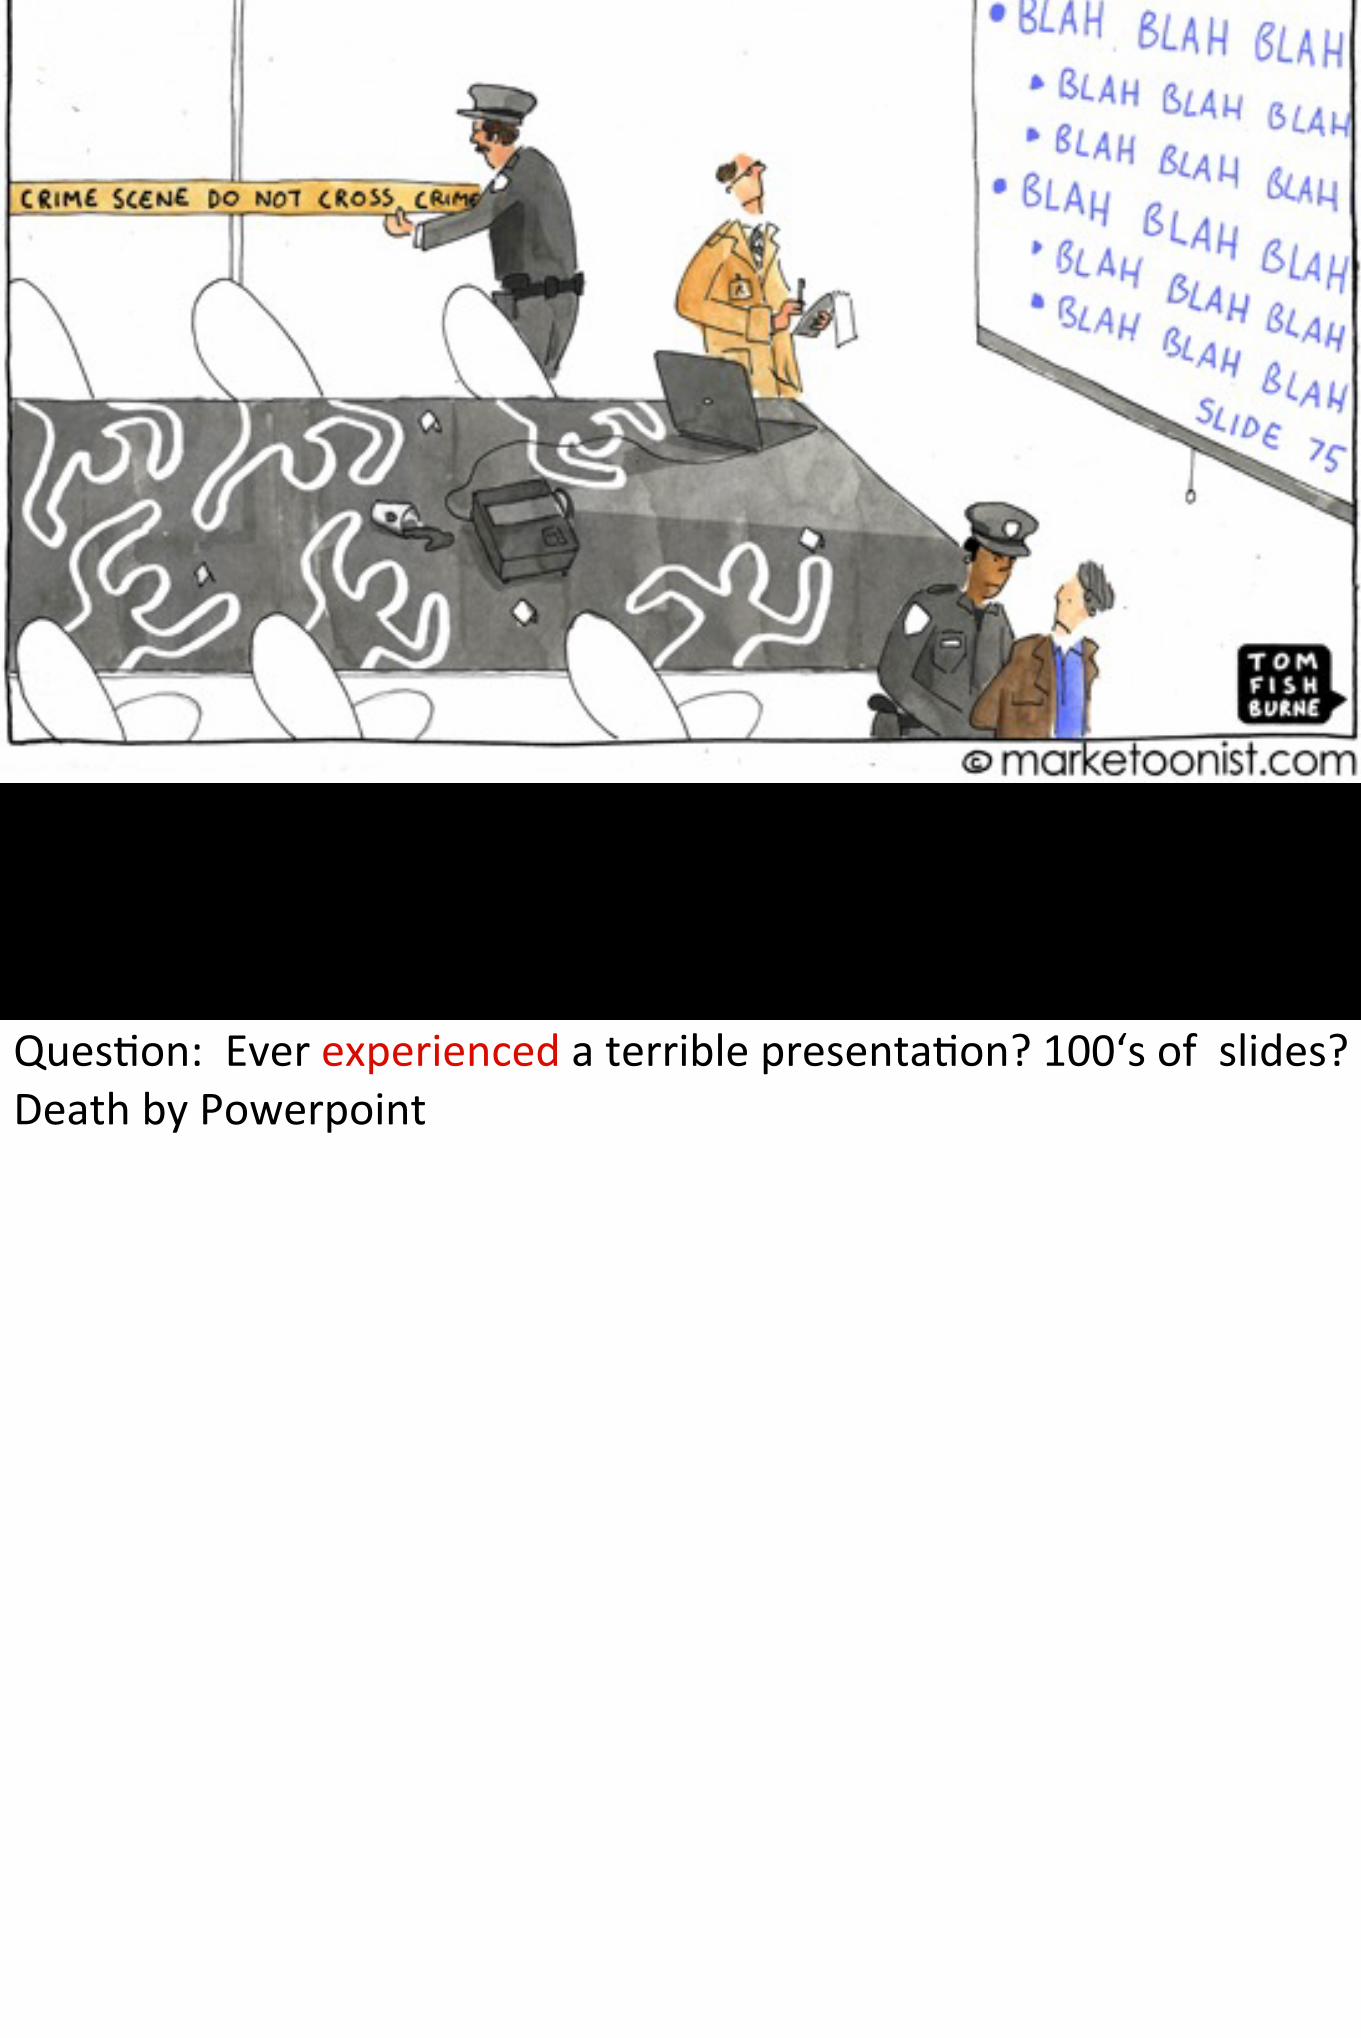
Make a list In chronological order
List (4 - 5) things you think about when starting to prepare a presentation
Take 2 minutes and make a list ..... (Ask what people put first) It does make a difference. ) See next slide
Make a List
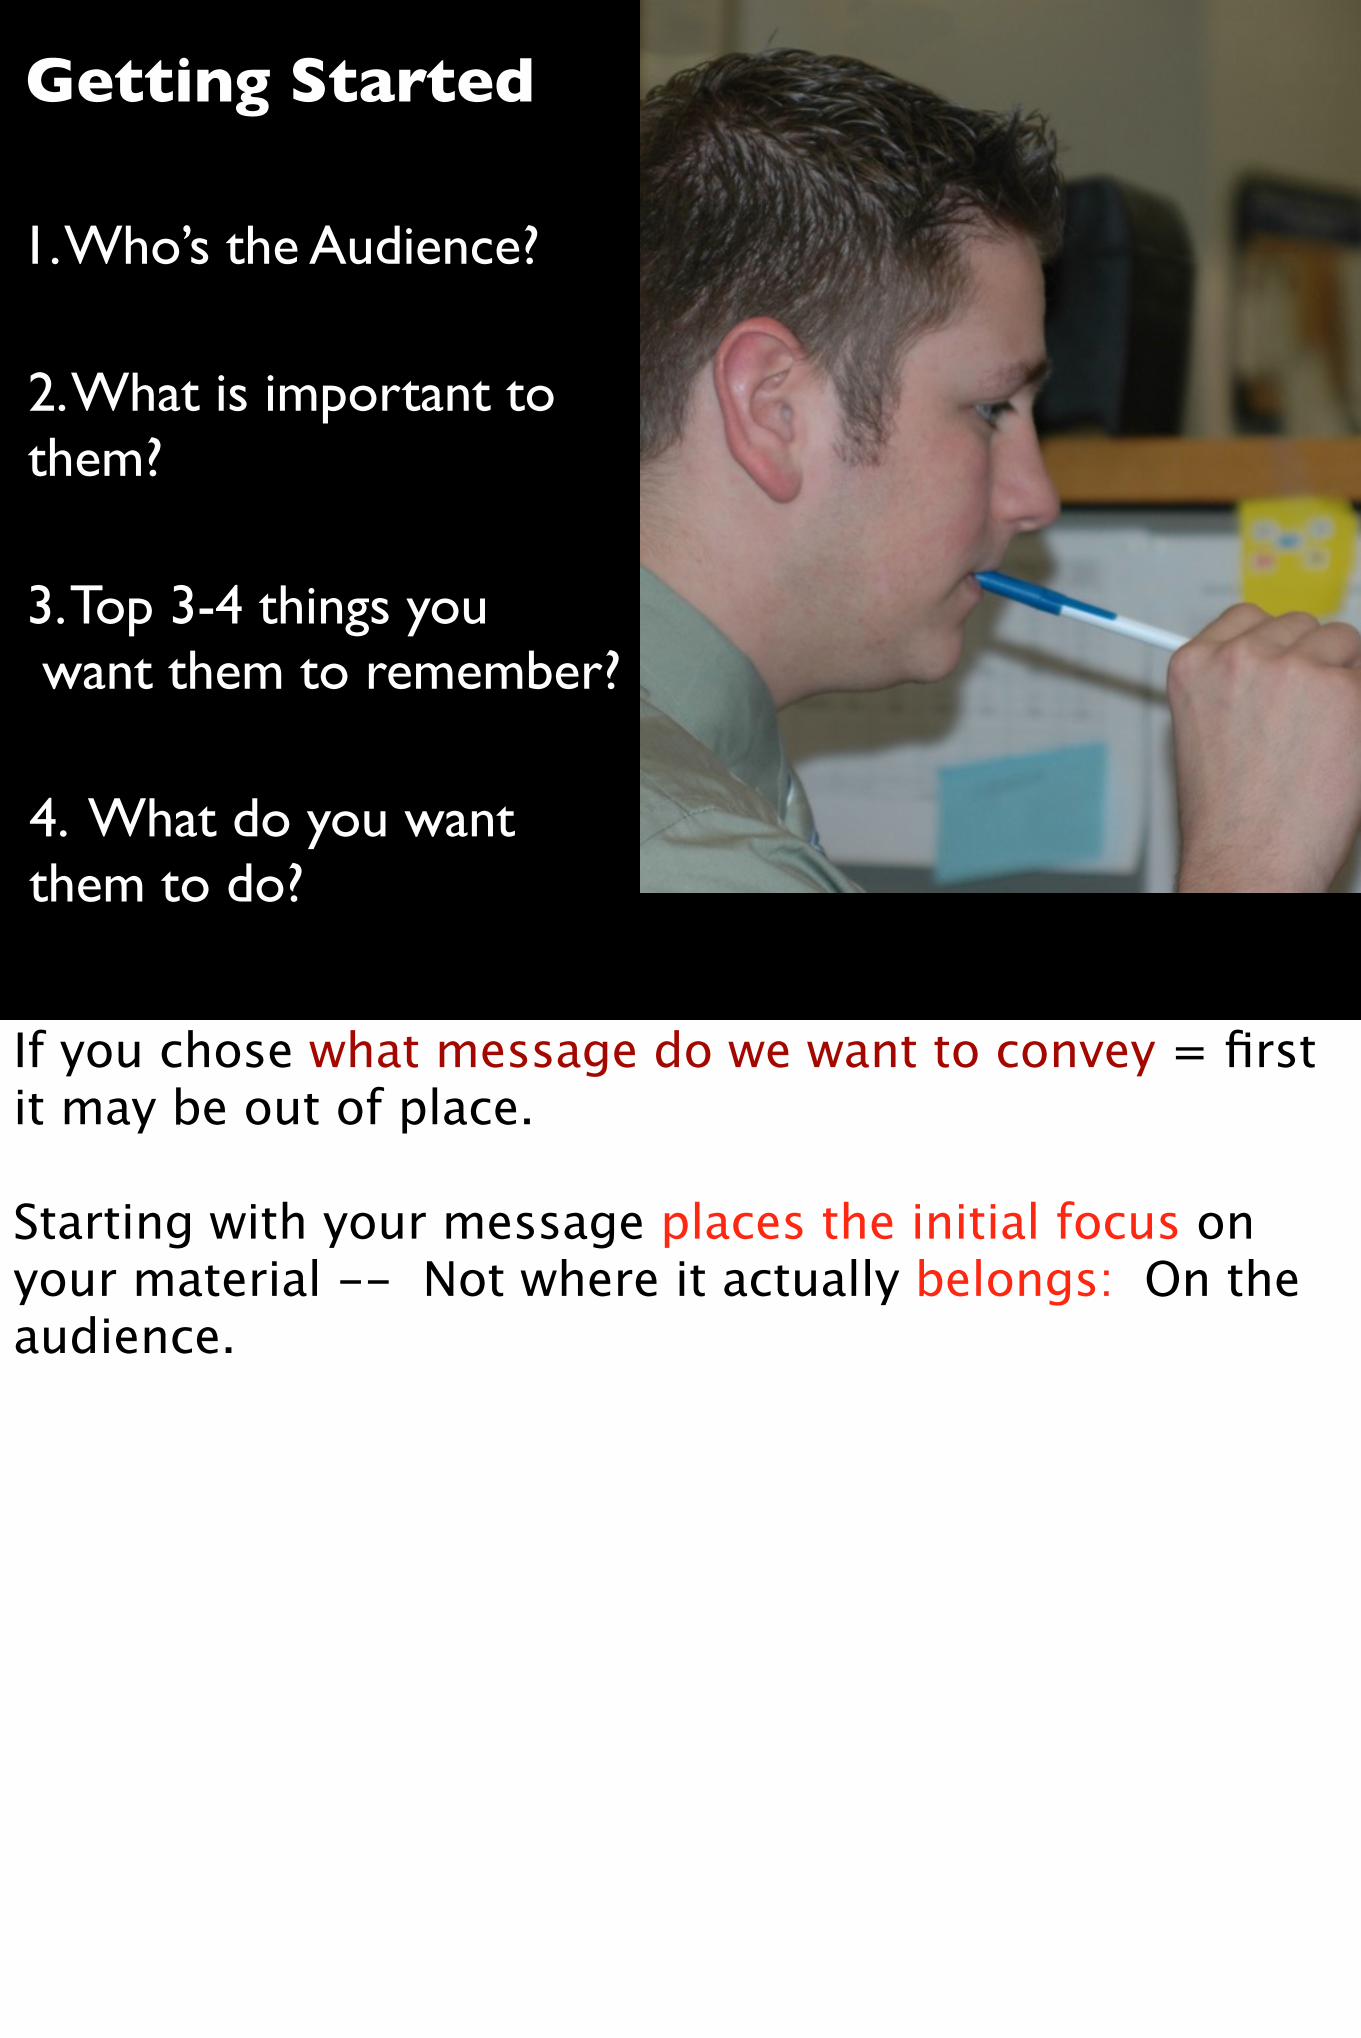
2. What is important to them?
3. Top 3-4 things you want them to remember?
4. What do you want them to do?
1. Who’s the Audience?
Getting Started
If you chose what message do we want to convey = first it may be out of place.
Starting with your message places the initial focus on your material -- Not where it actually belongs: On the audience.
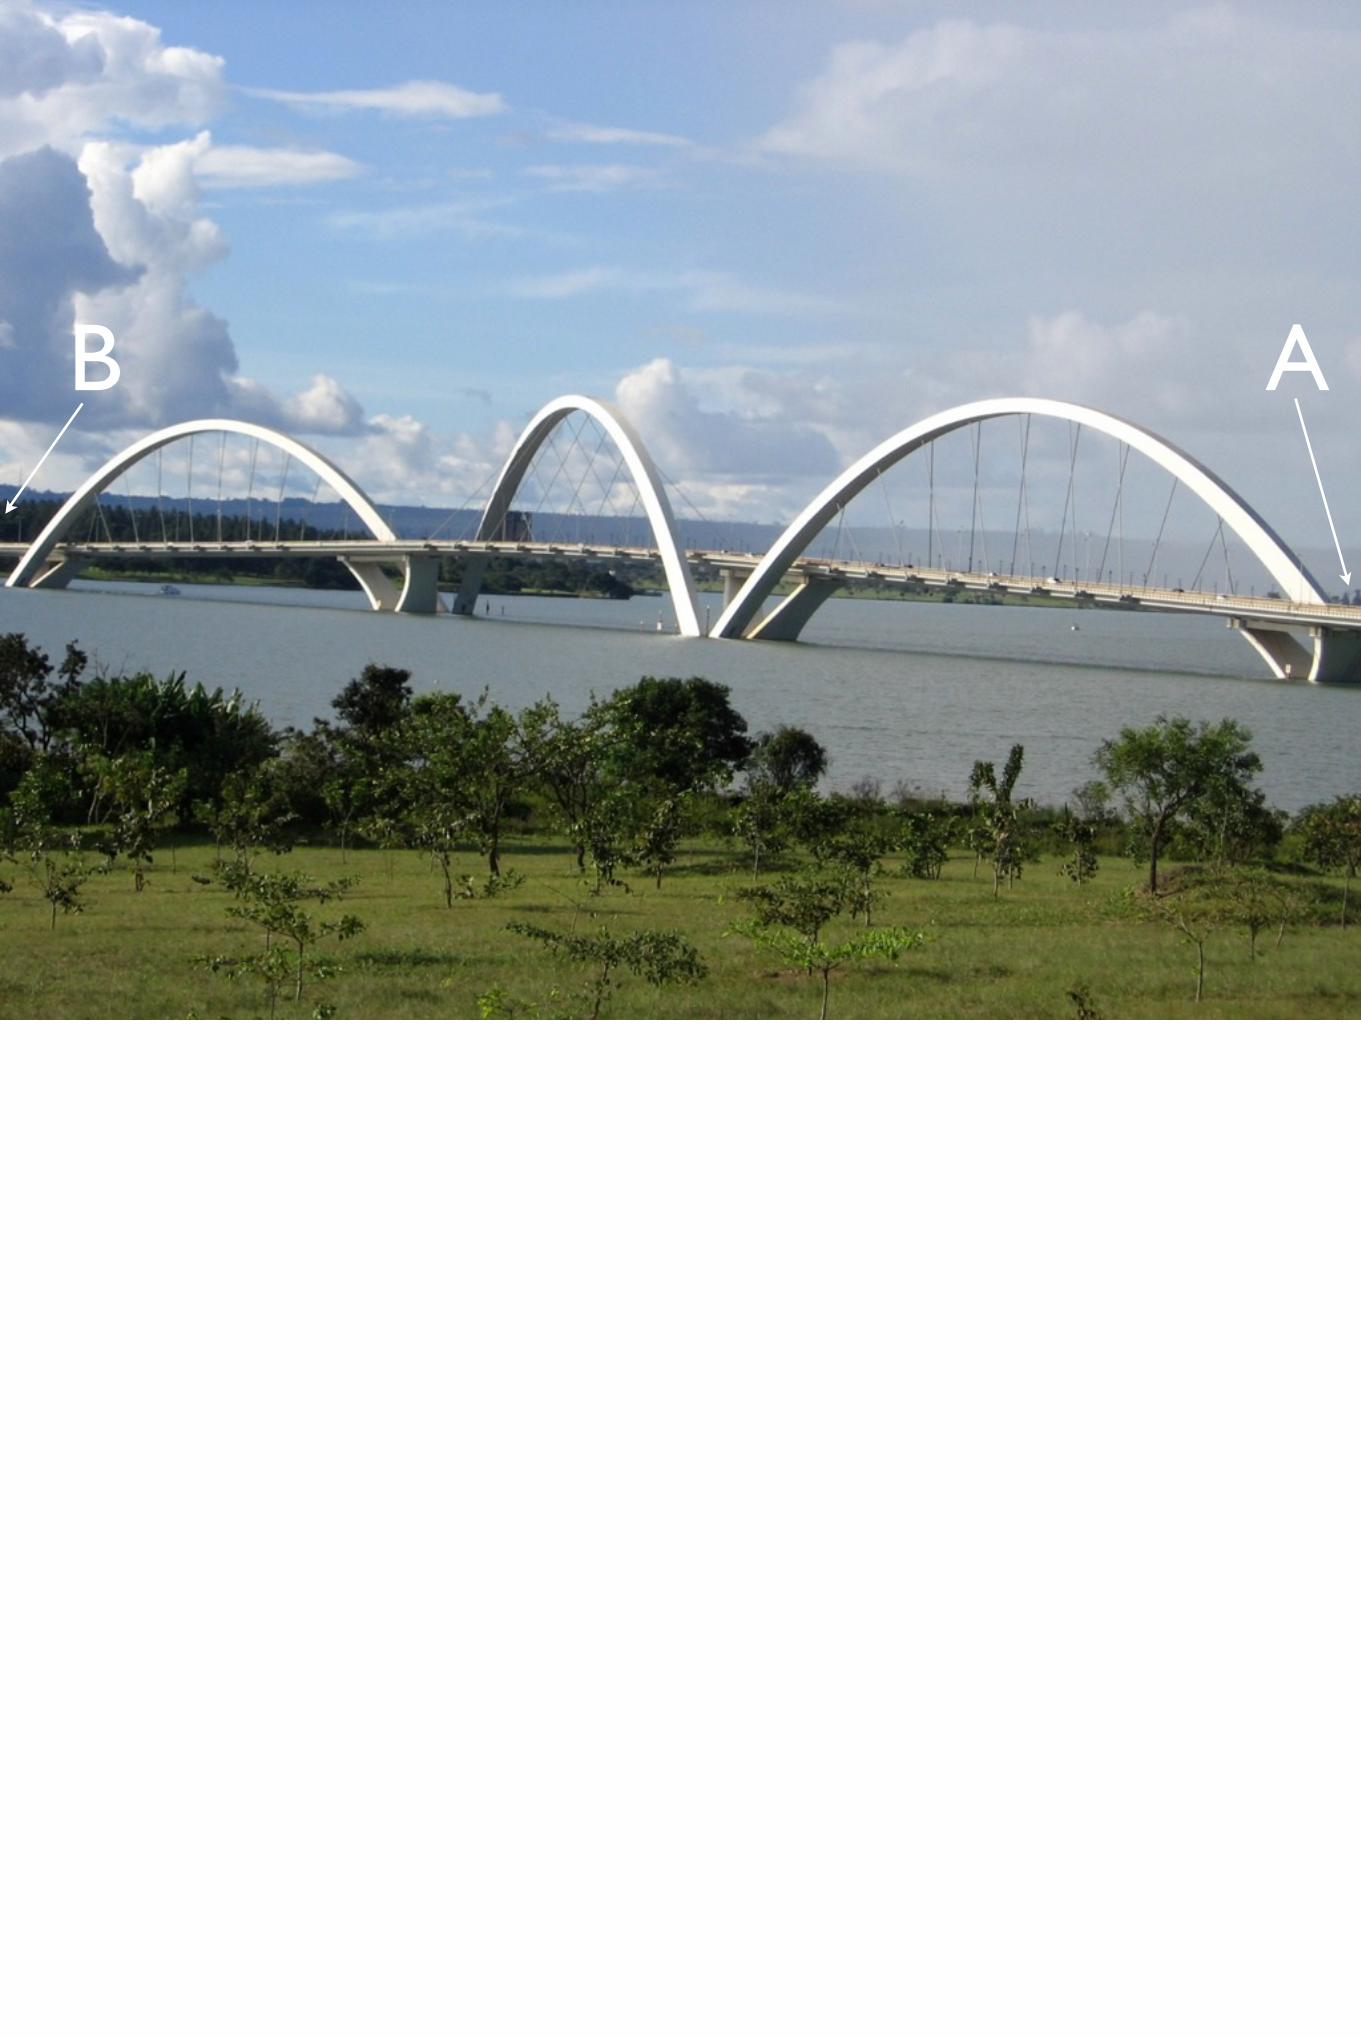
AB


Text
Change people’s minds by figuring out what’s important to them
Present your case on their terms
Stored Ideas Hmmm

Build on what they know and
believe
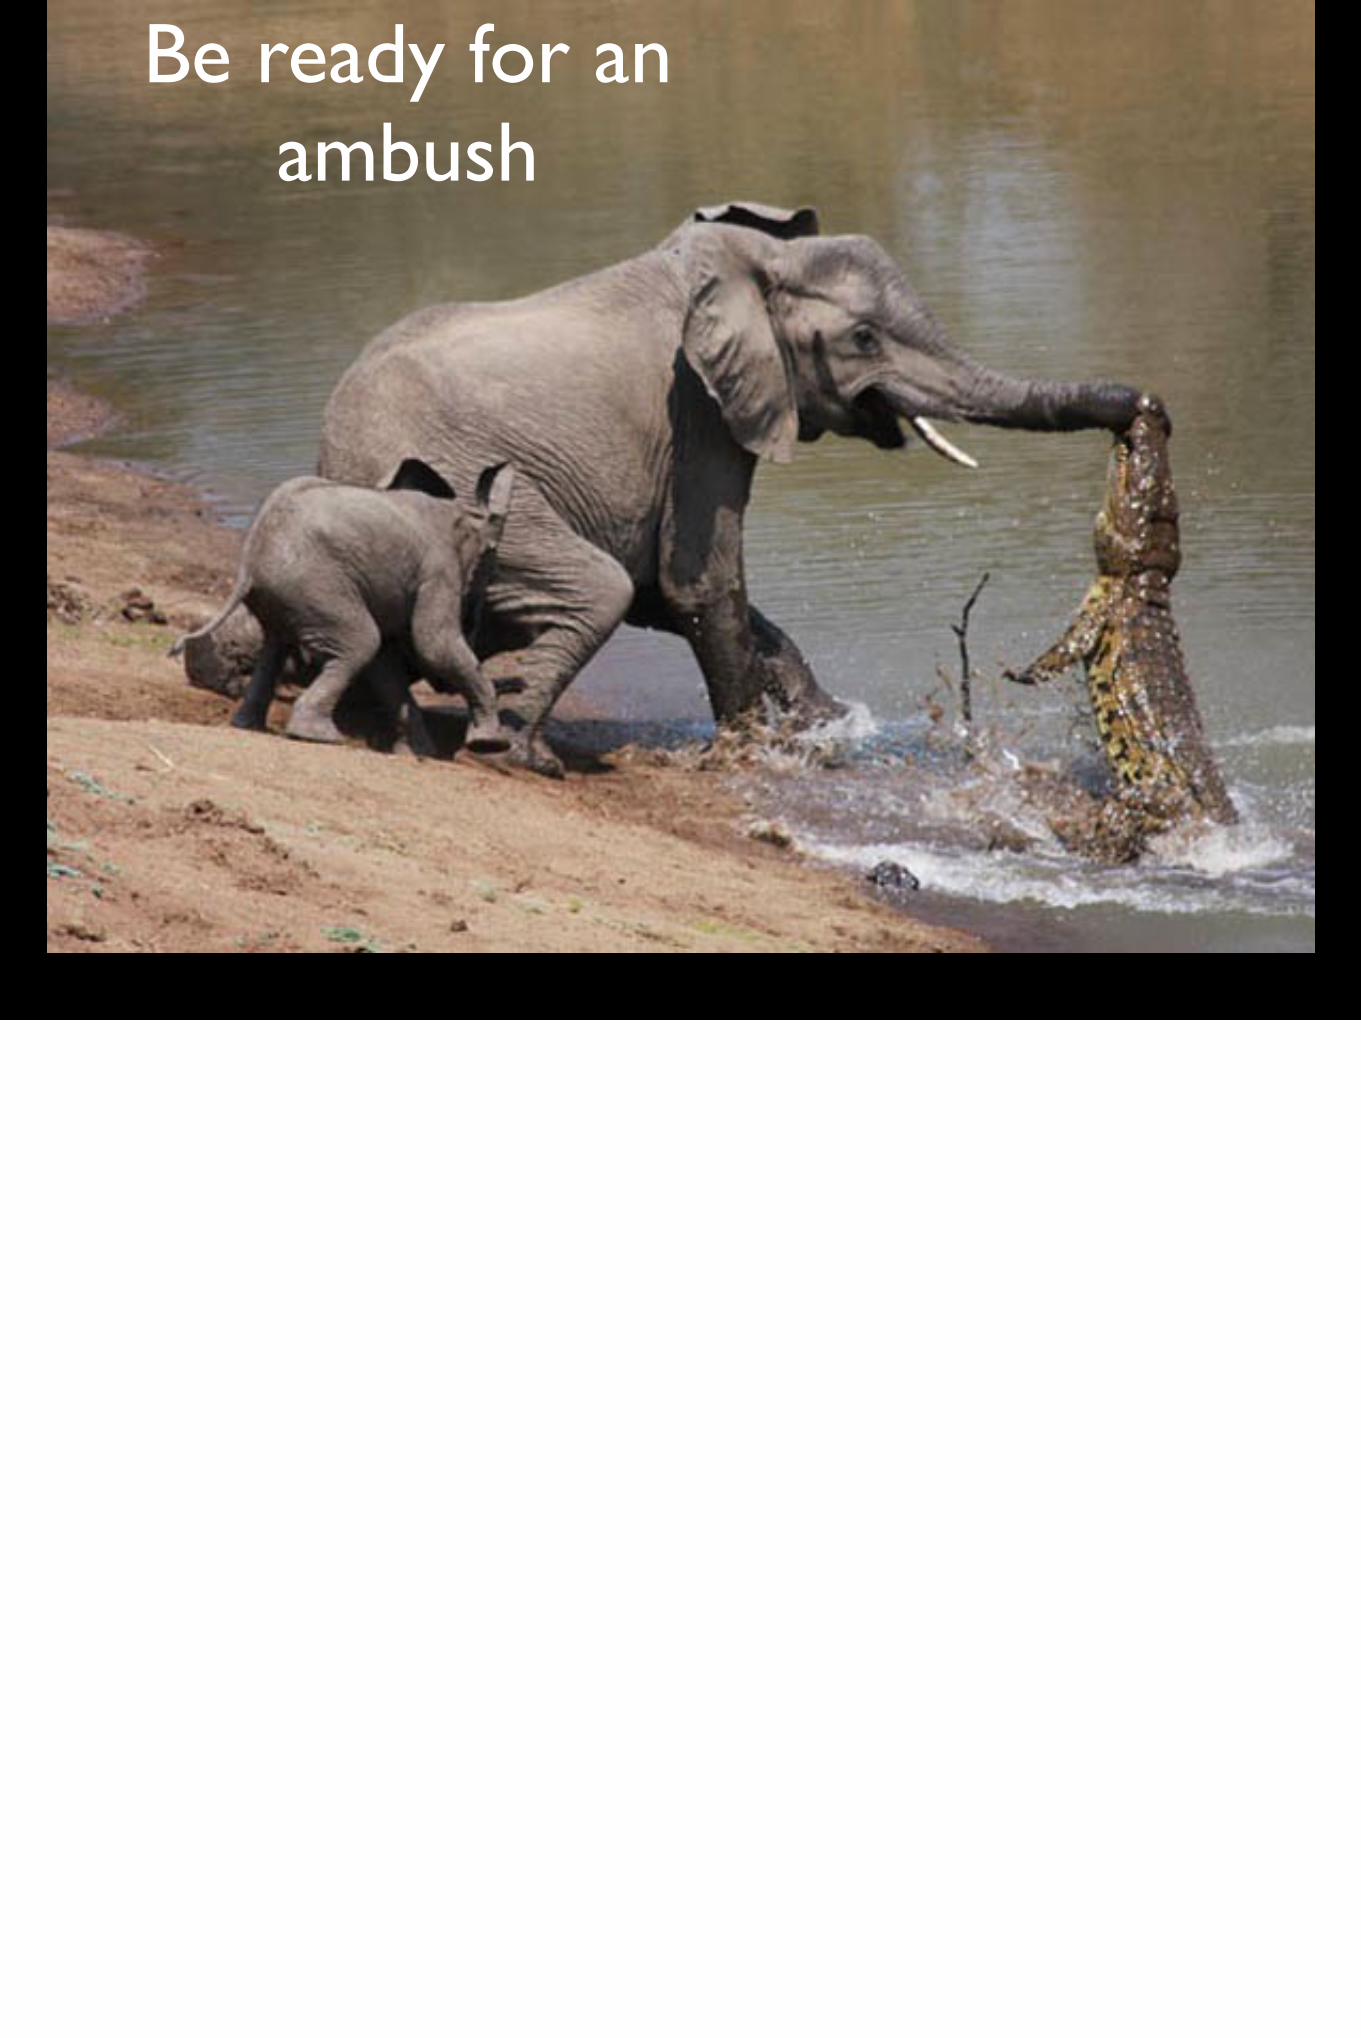
Be ready for an ambush

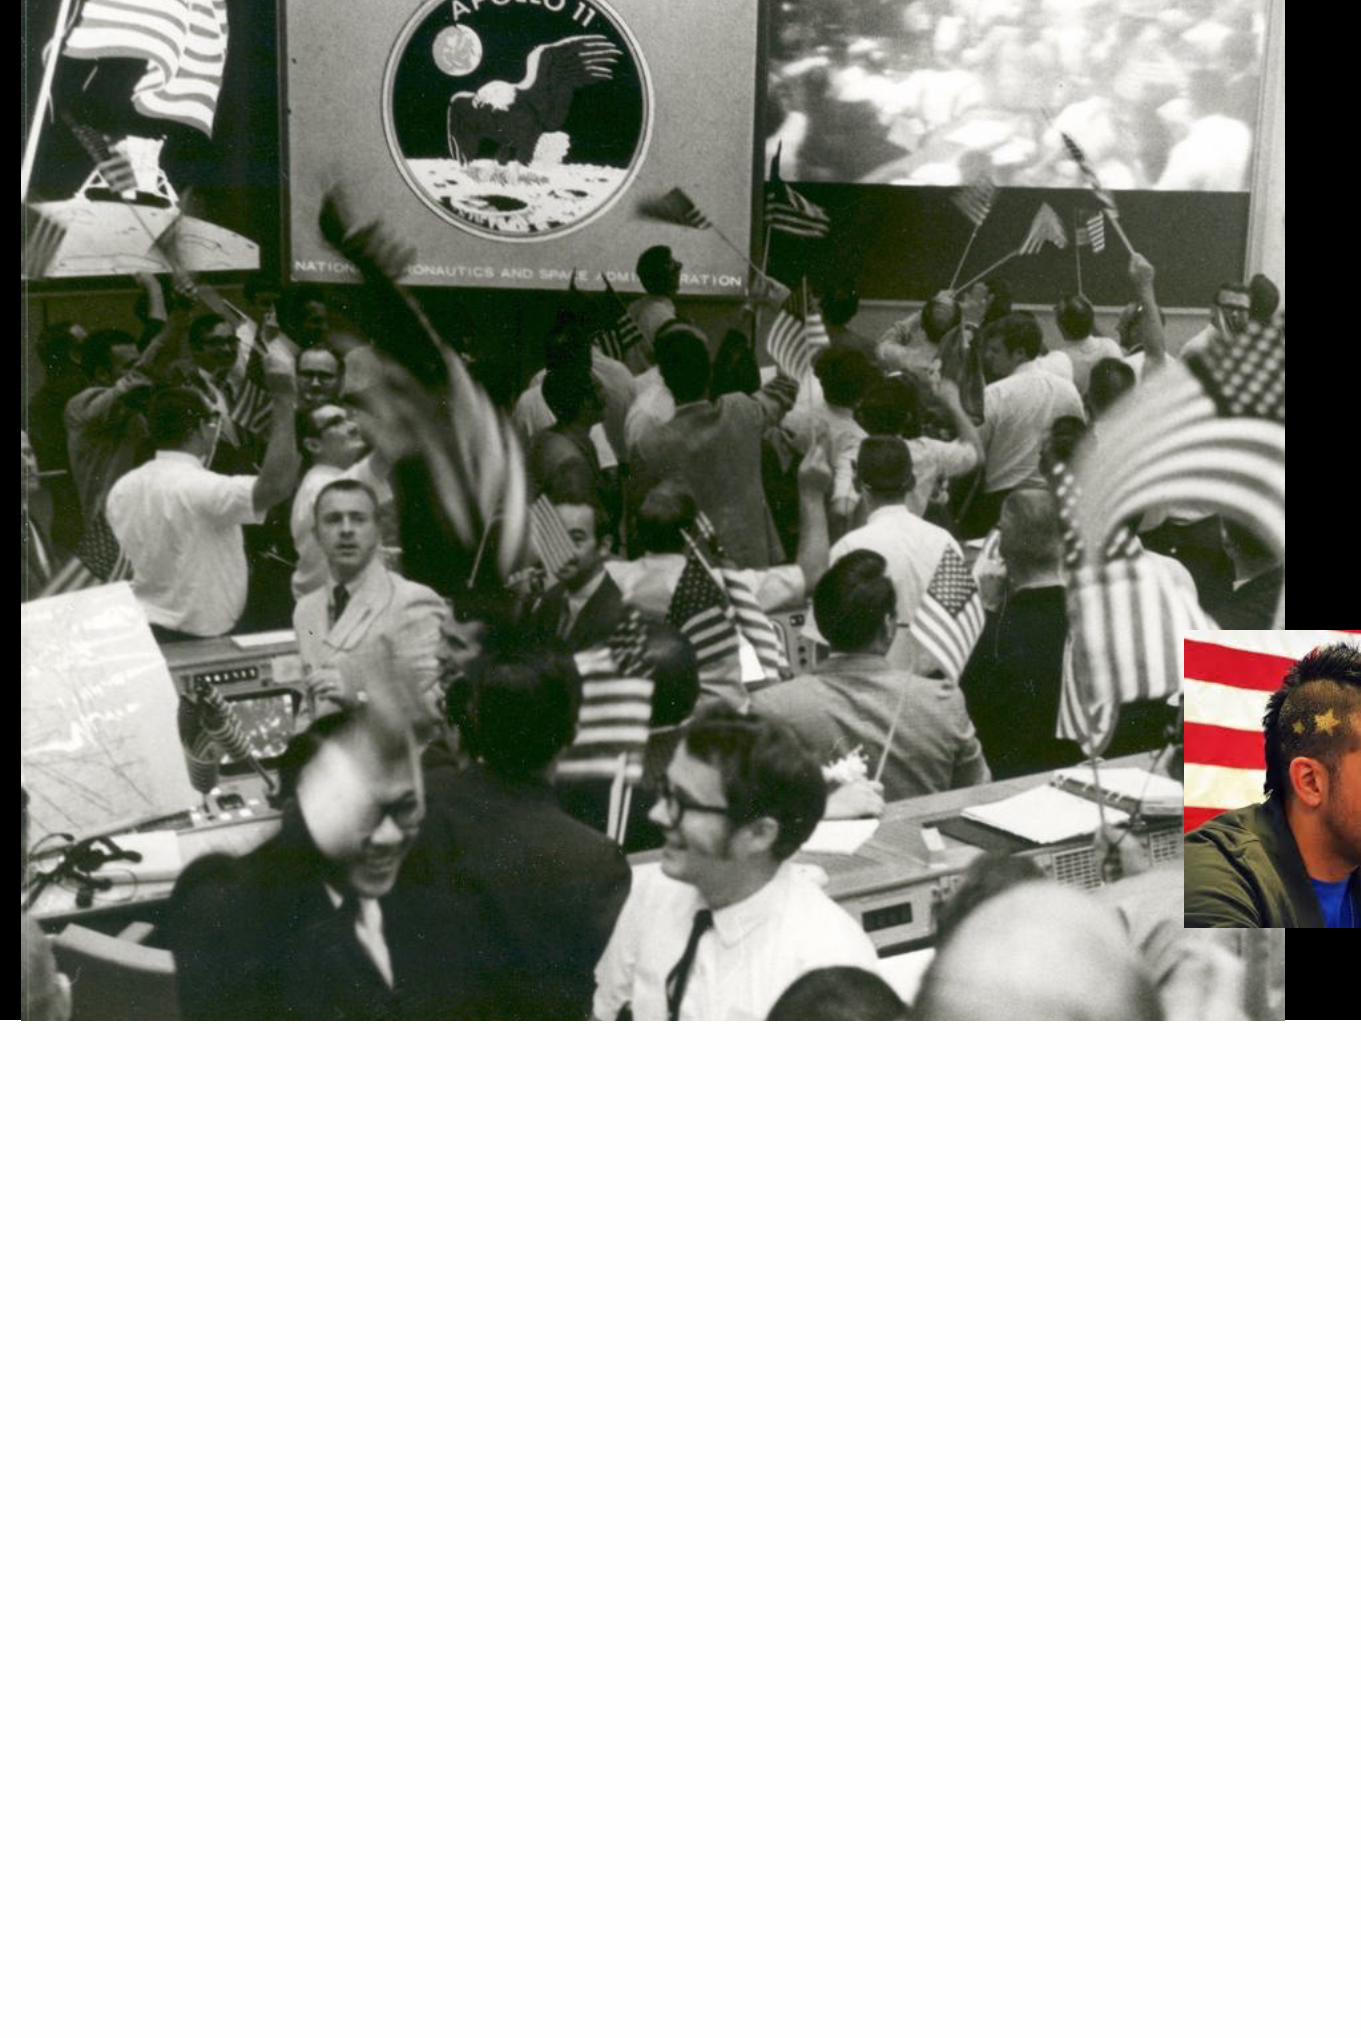
What do you want them to feel or do?
Courtesy Tom Rielly/Ted.com
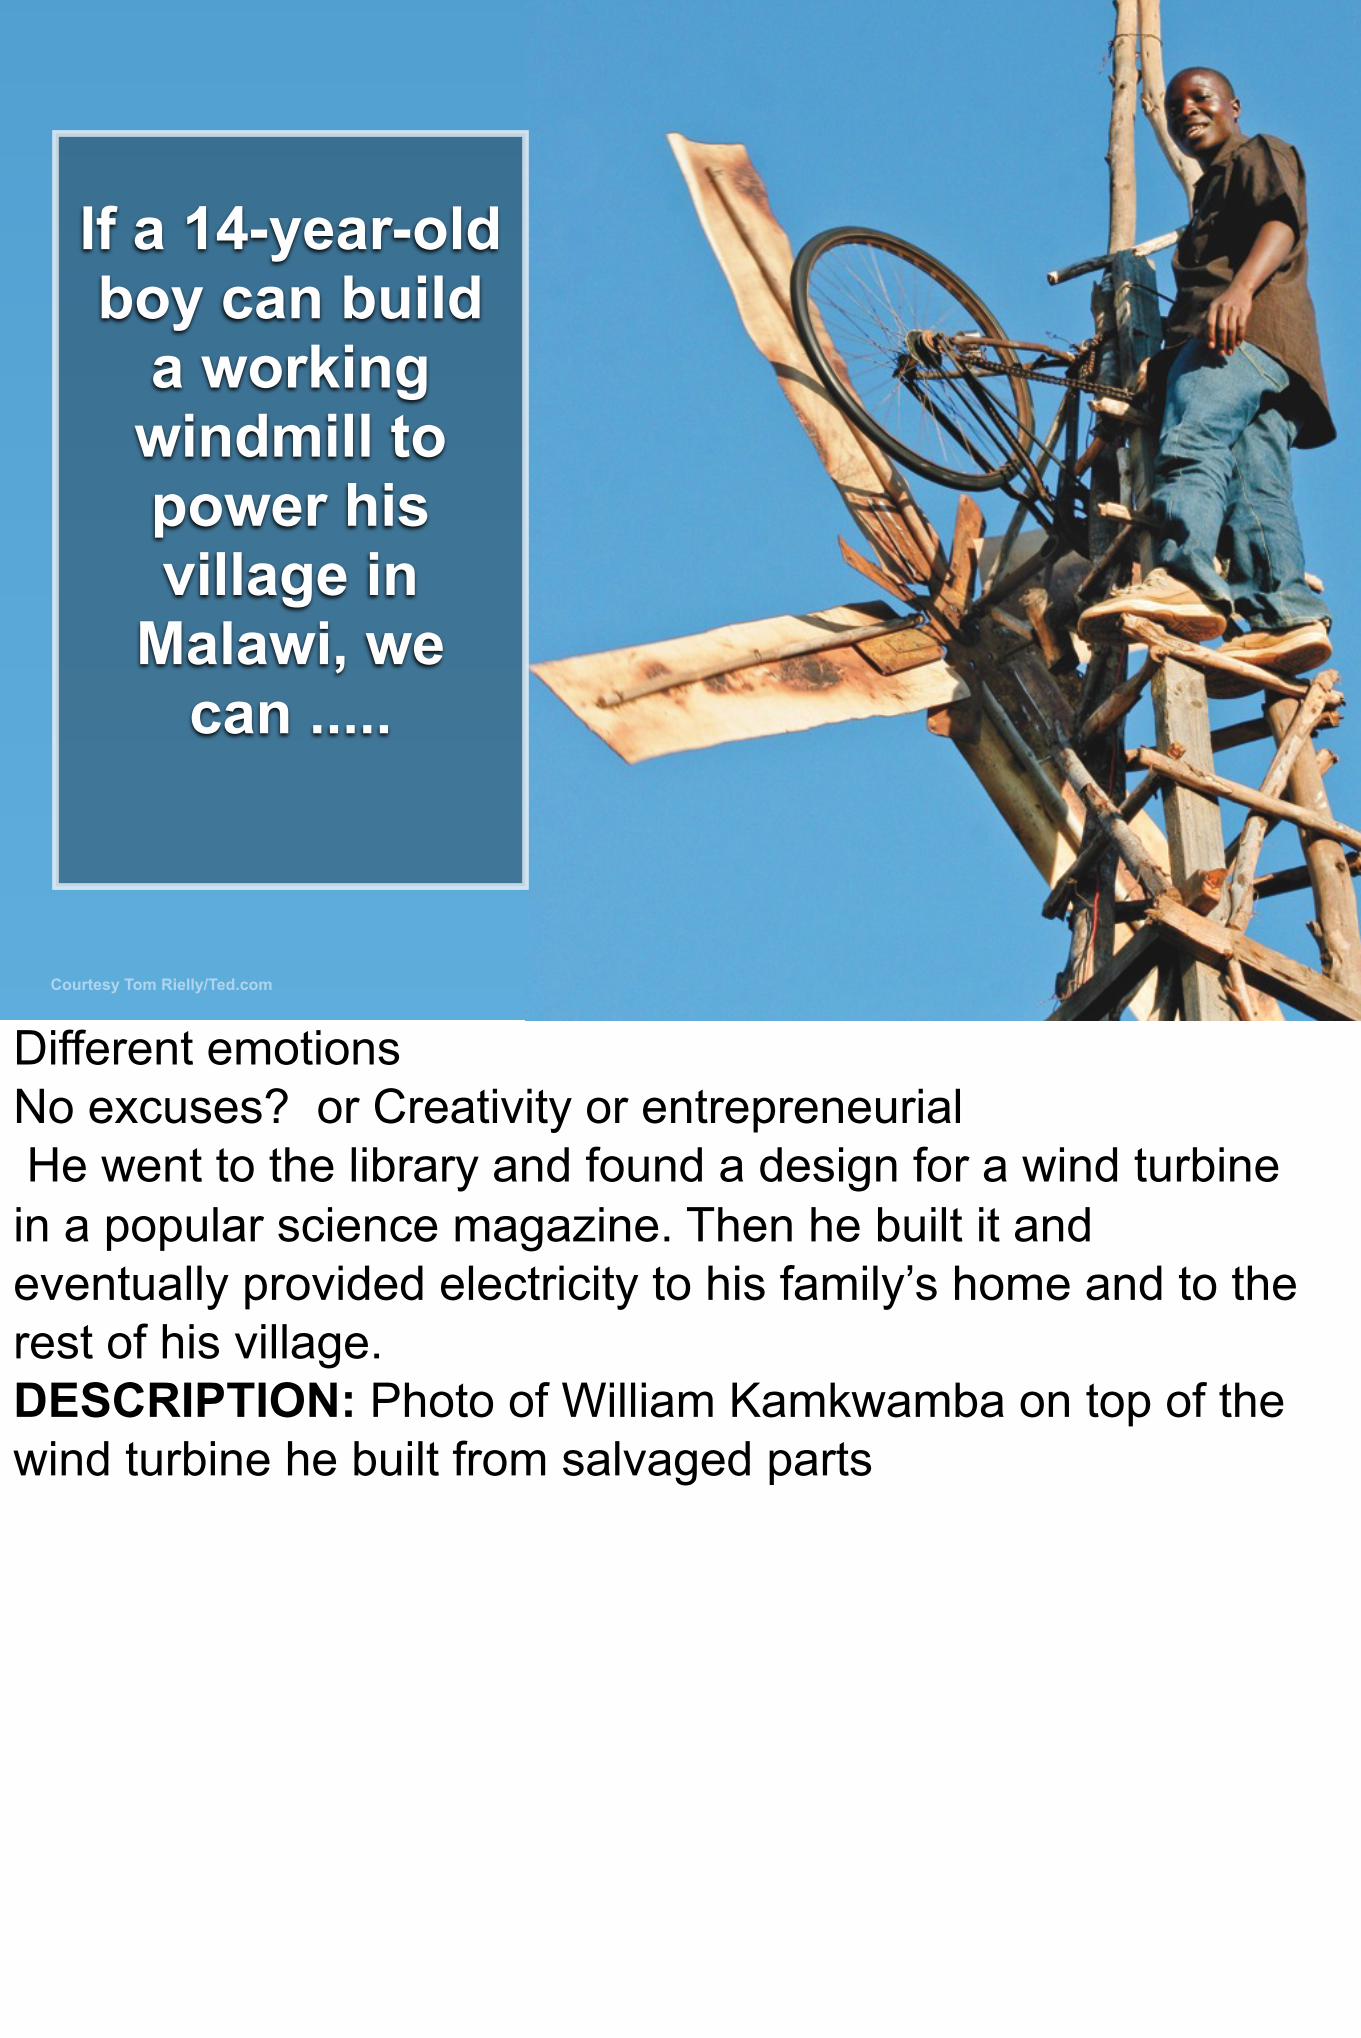
If a 14-year-old boy can build
a working windmill to power his village in
Malawi, we can .....
Different emotionsNo excuses? or Creativity or entrepreneurial He went to the library and found a design for a wind turbine in a popular science magazine. Then he built it and eventually provided electricity to his family’s home and to the rest of his village.DESCRIPTION: Photo of William Kamkwamba on top of the wind turbine he built from salvaged parts

Beyond the Box
Beyond the Box
With a black background you can get more “real estate” for bigger text and larger pictures
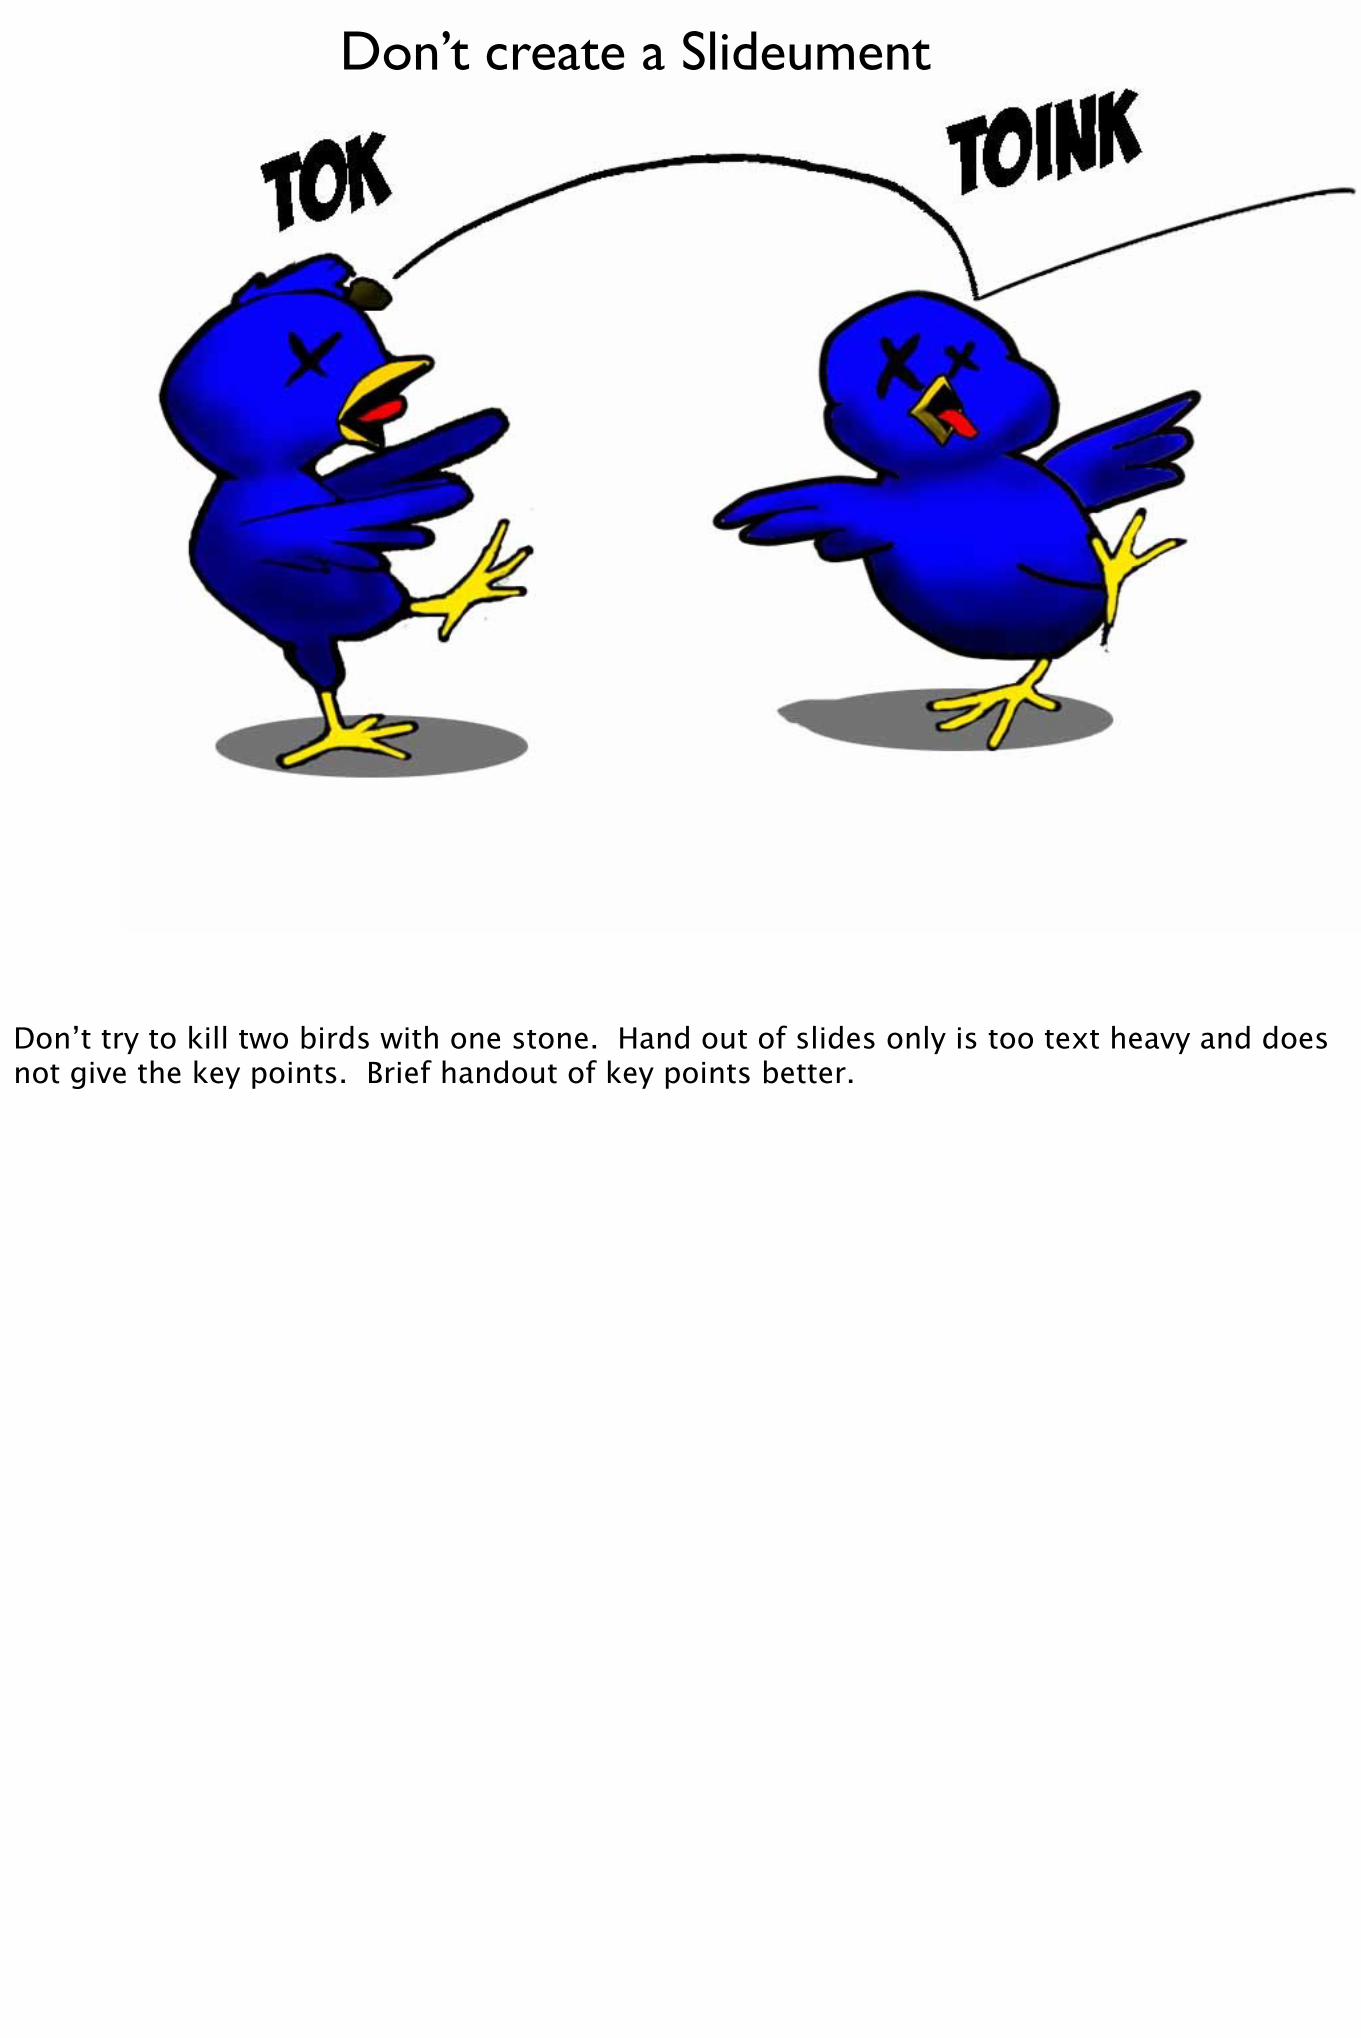
Don’t create a Slideument
Don’t try to kill two birds with one stone. Hand out of slides only is too text heavy and does not give the key points. Brief handout of key points better.
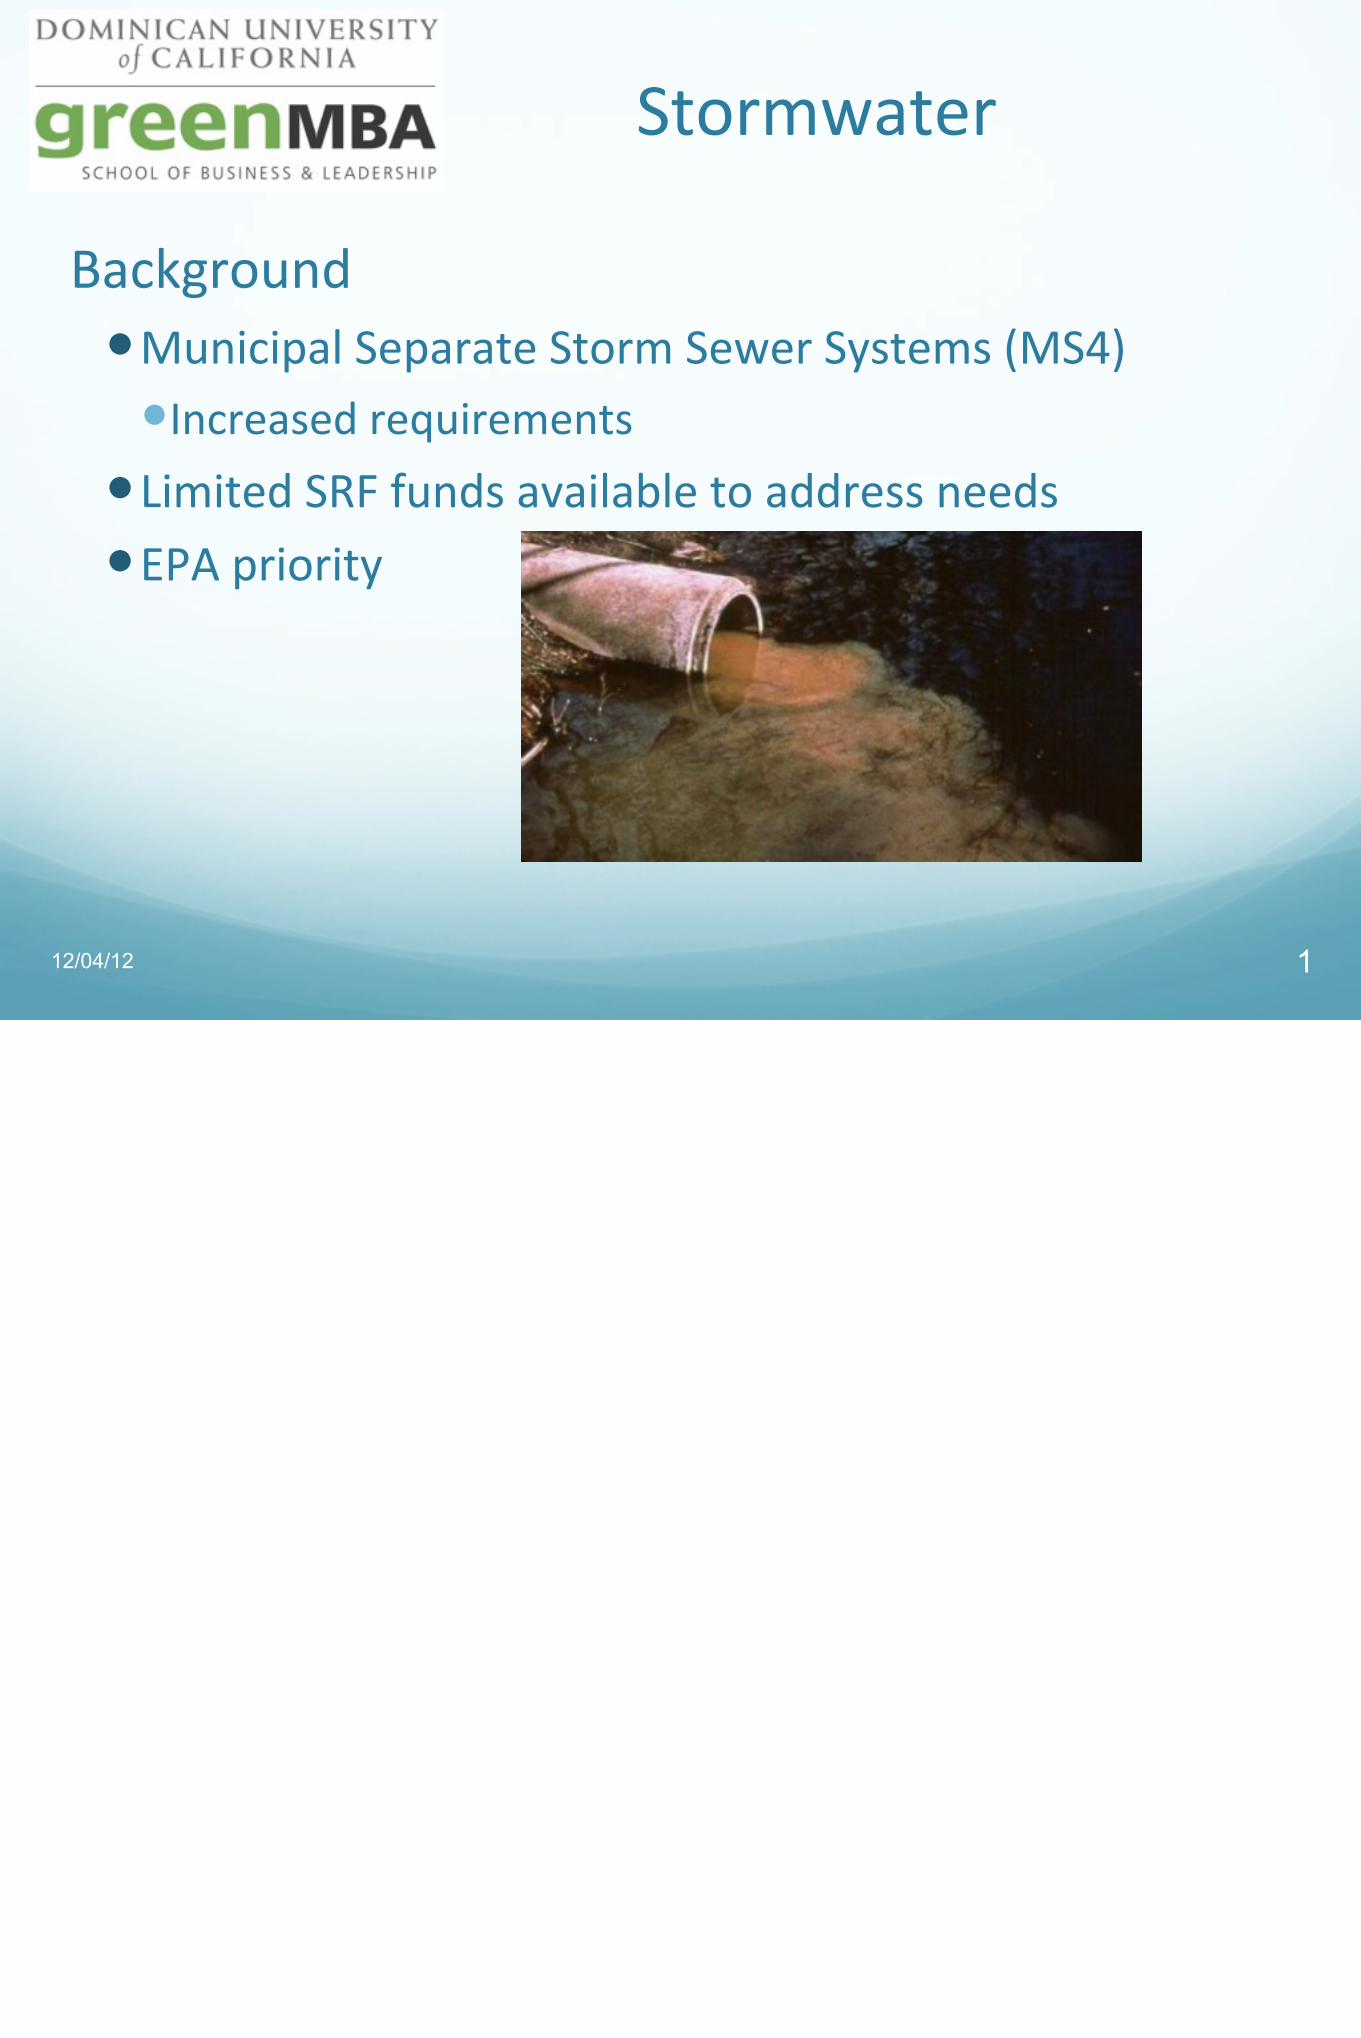
Stormwater
Background�Municipal Separate Storm Sewer Systems (MS4)�Increased requirements
�Limited SRF funds available to address needs �EPA priority
12/04/12 1
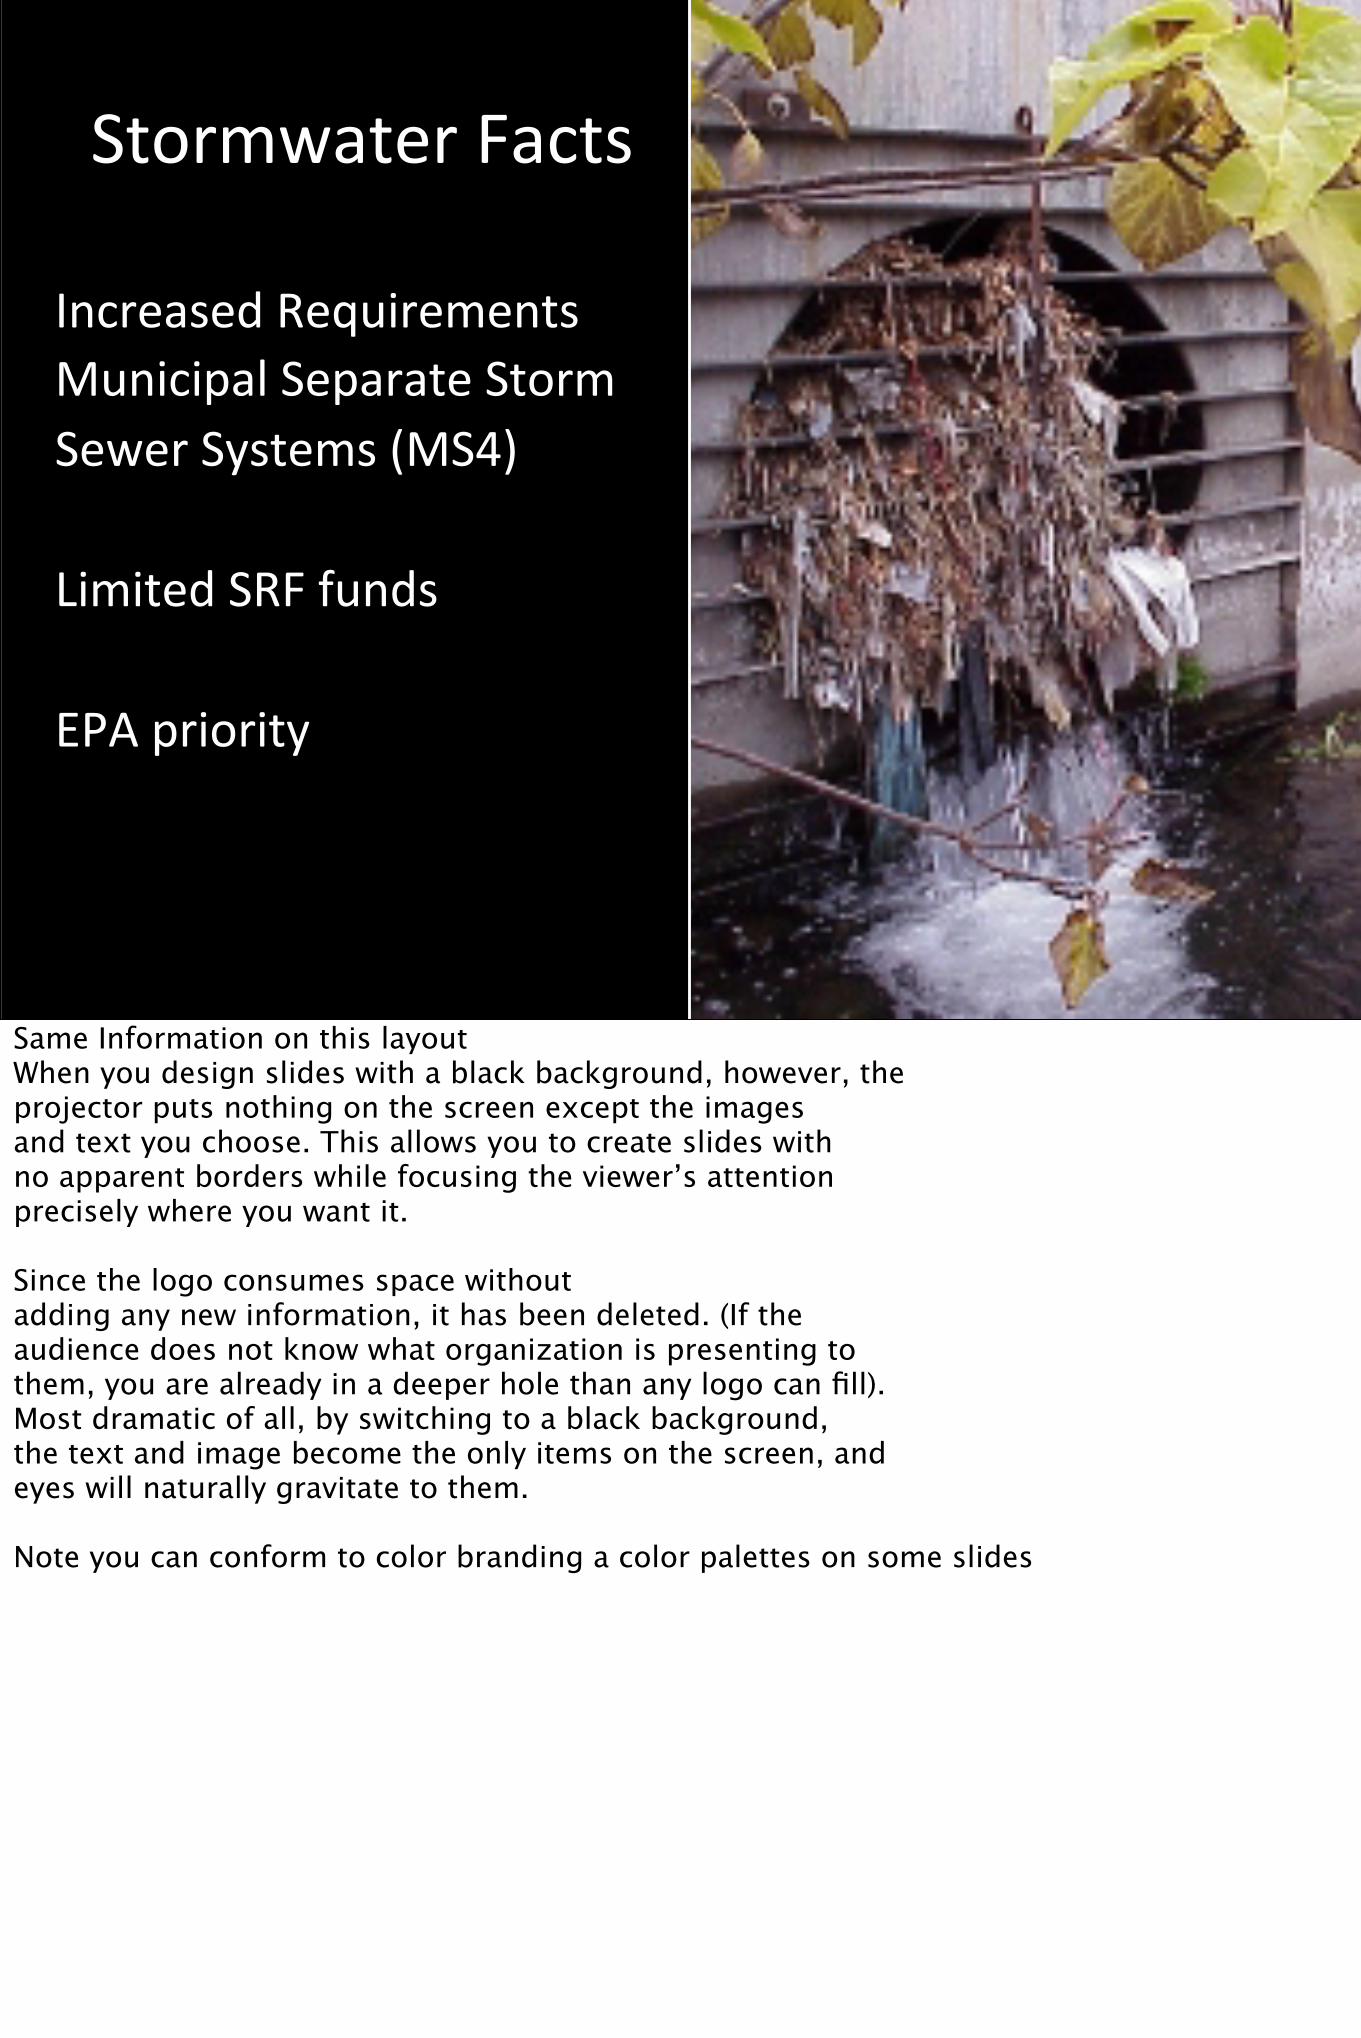
Stormwater)Facts
Increased)Requirements)Municipal)Separate)Storm)Sewer)Systems)(MS4))))Limited)SRF)funds))))EPA)priority)
24
Same Information on this layoutWhen you design slides with a black background, however, the projector puts nothing on the screen except the images and text you choose. This allows you to create slides with no apparent borders while focusing the viewer’s attention precisely where you want it.
Since the logo consumes space without adding any new information, it has been deleted. (If the audience does not know what organization is presenting to them, you are already in a deeper hole than any logo can fill). Most dramatic of all, by switching to a black background, the text and image become the only items on the screen, and eyes will naturally gravitate to them.
Note you can conform to color branding a color palettes on some slides

Best Retention and Understanding

Human Process Images 60,000 x FASTER
than Words

We recall information presented as images 6x MORE
easily than text

Don’t tell them
Show them
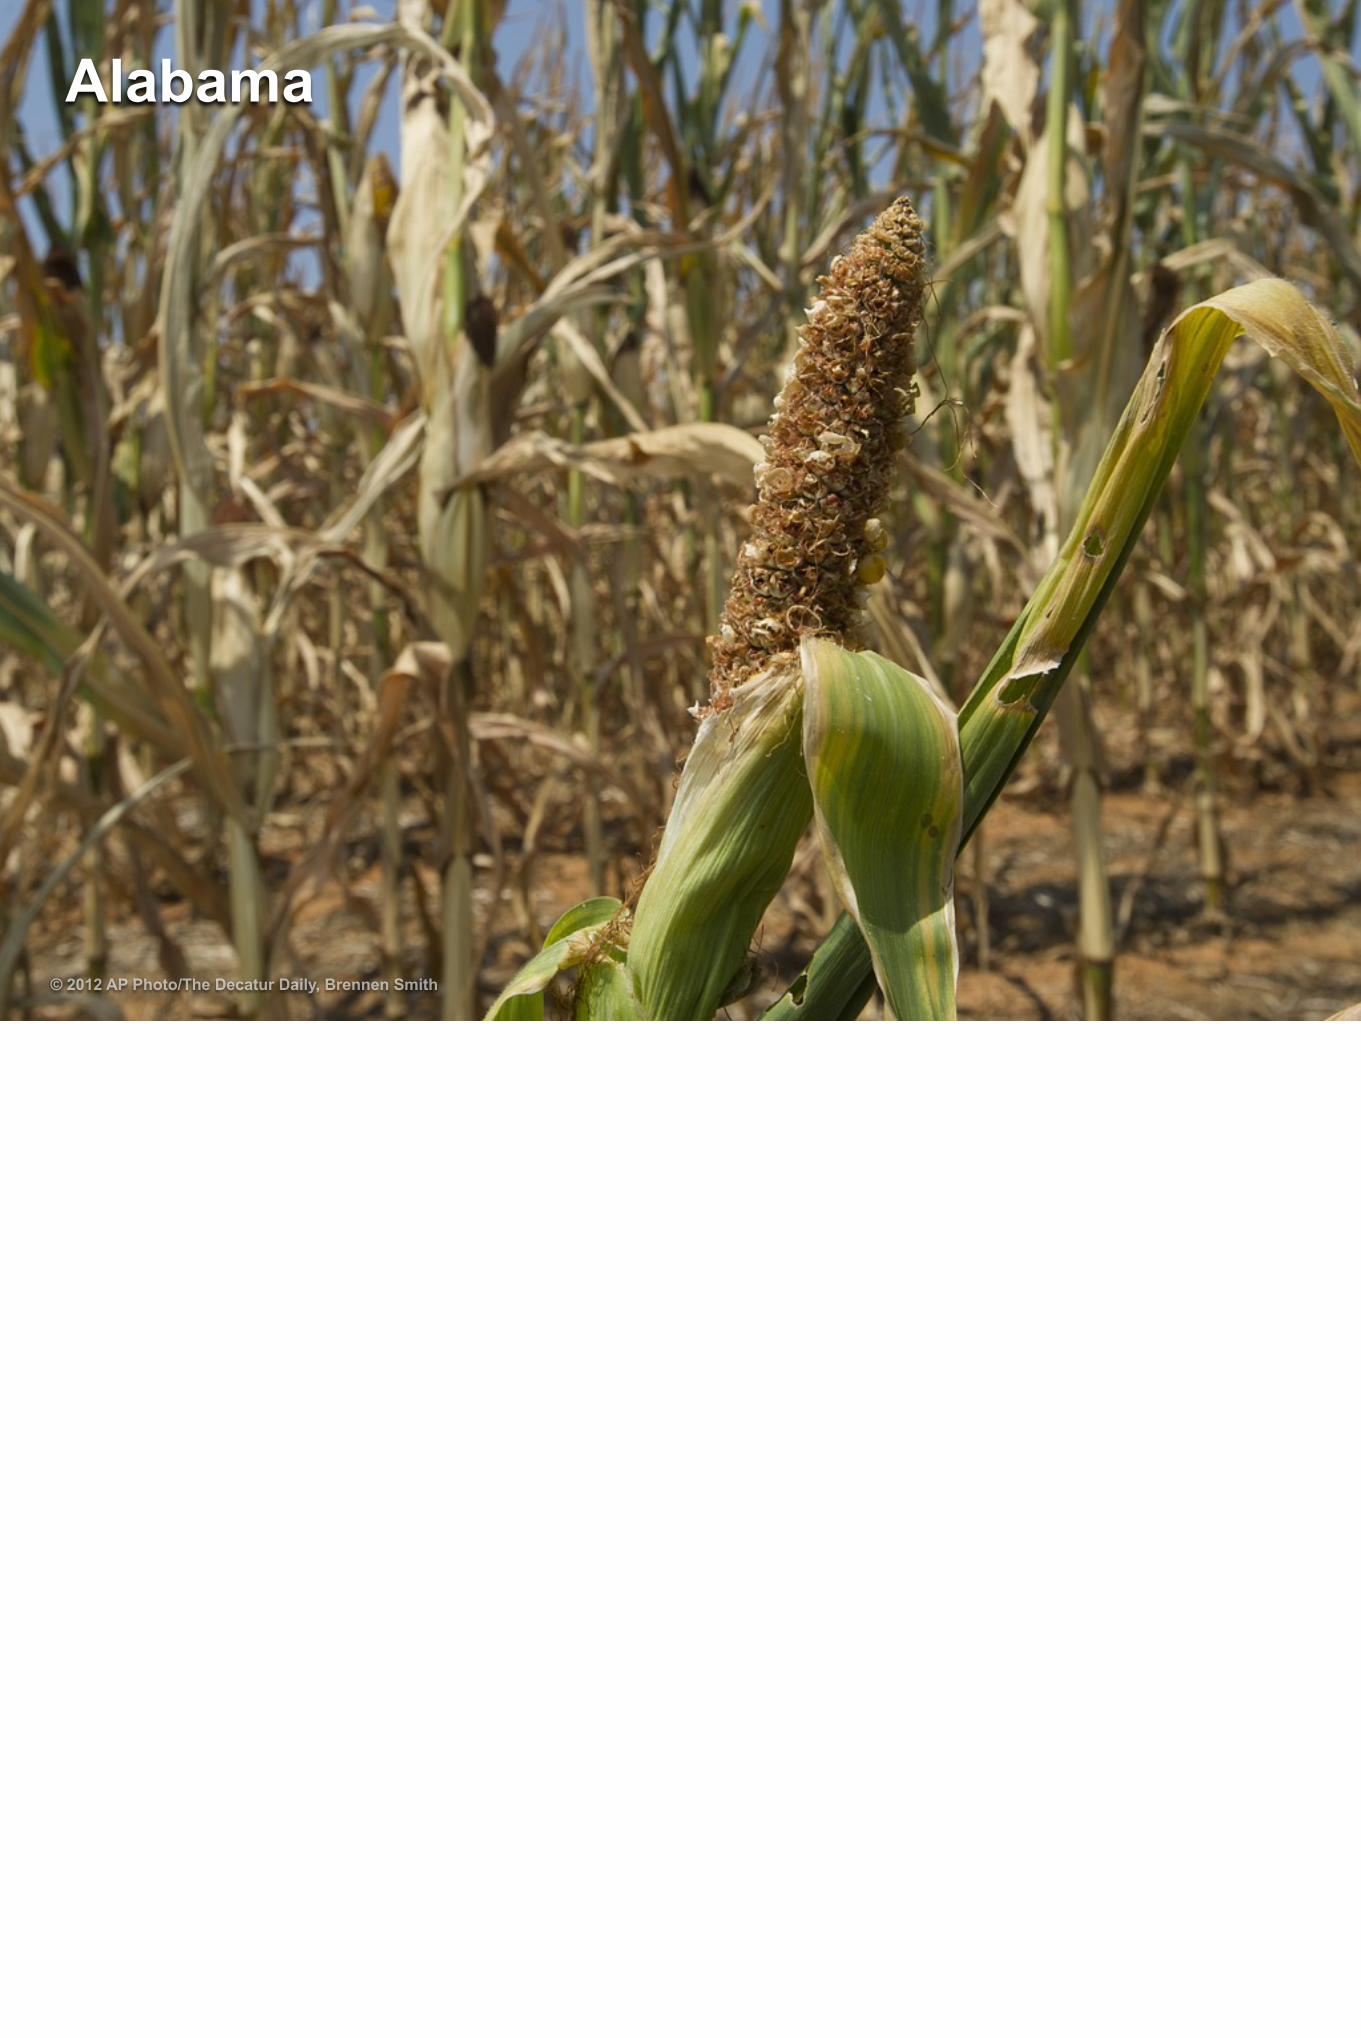
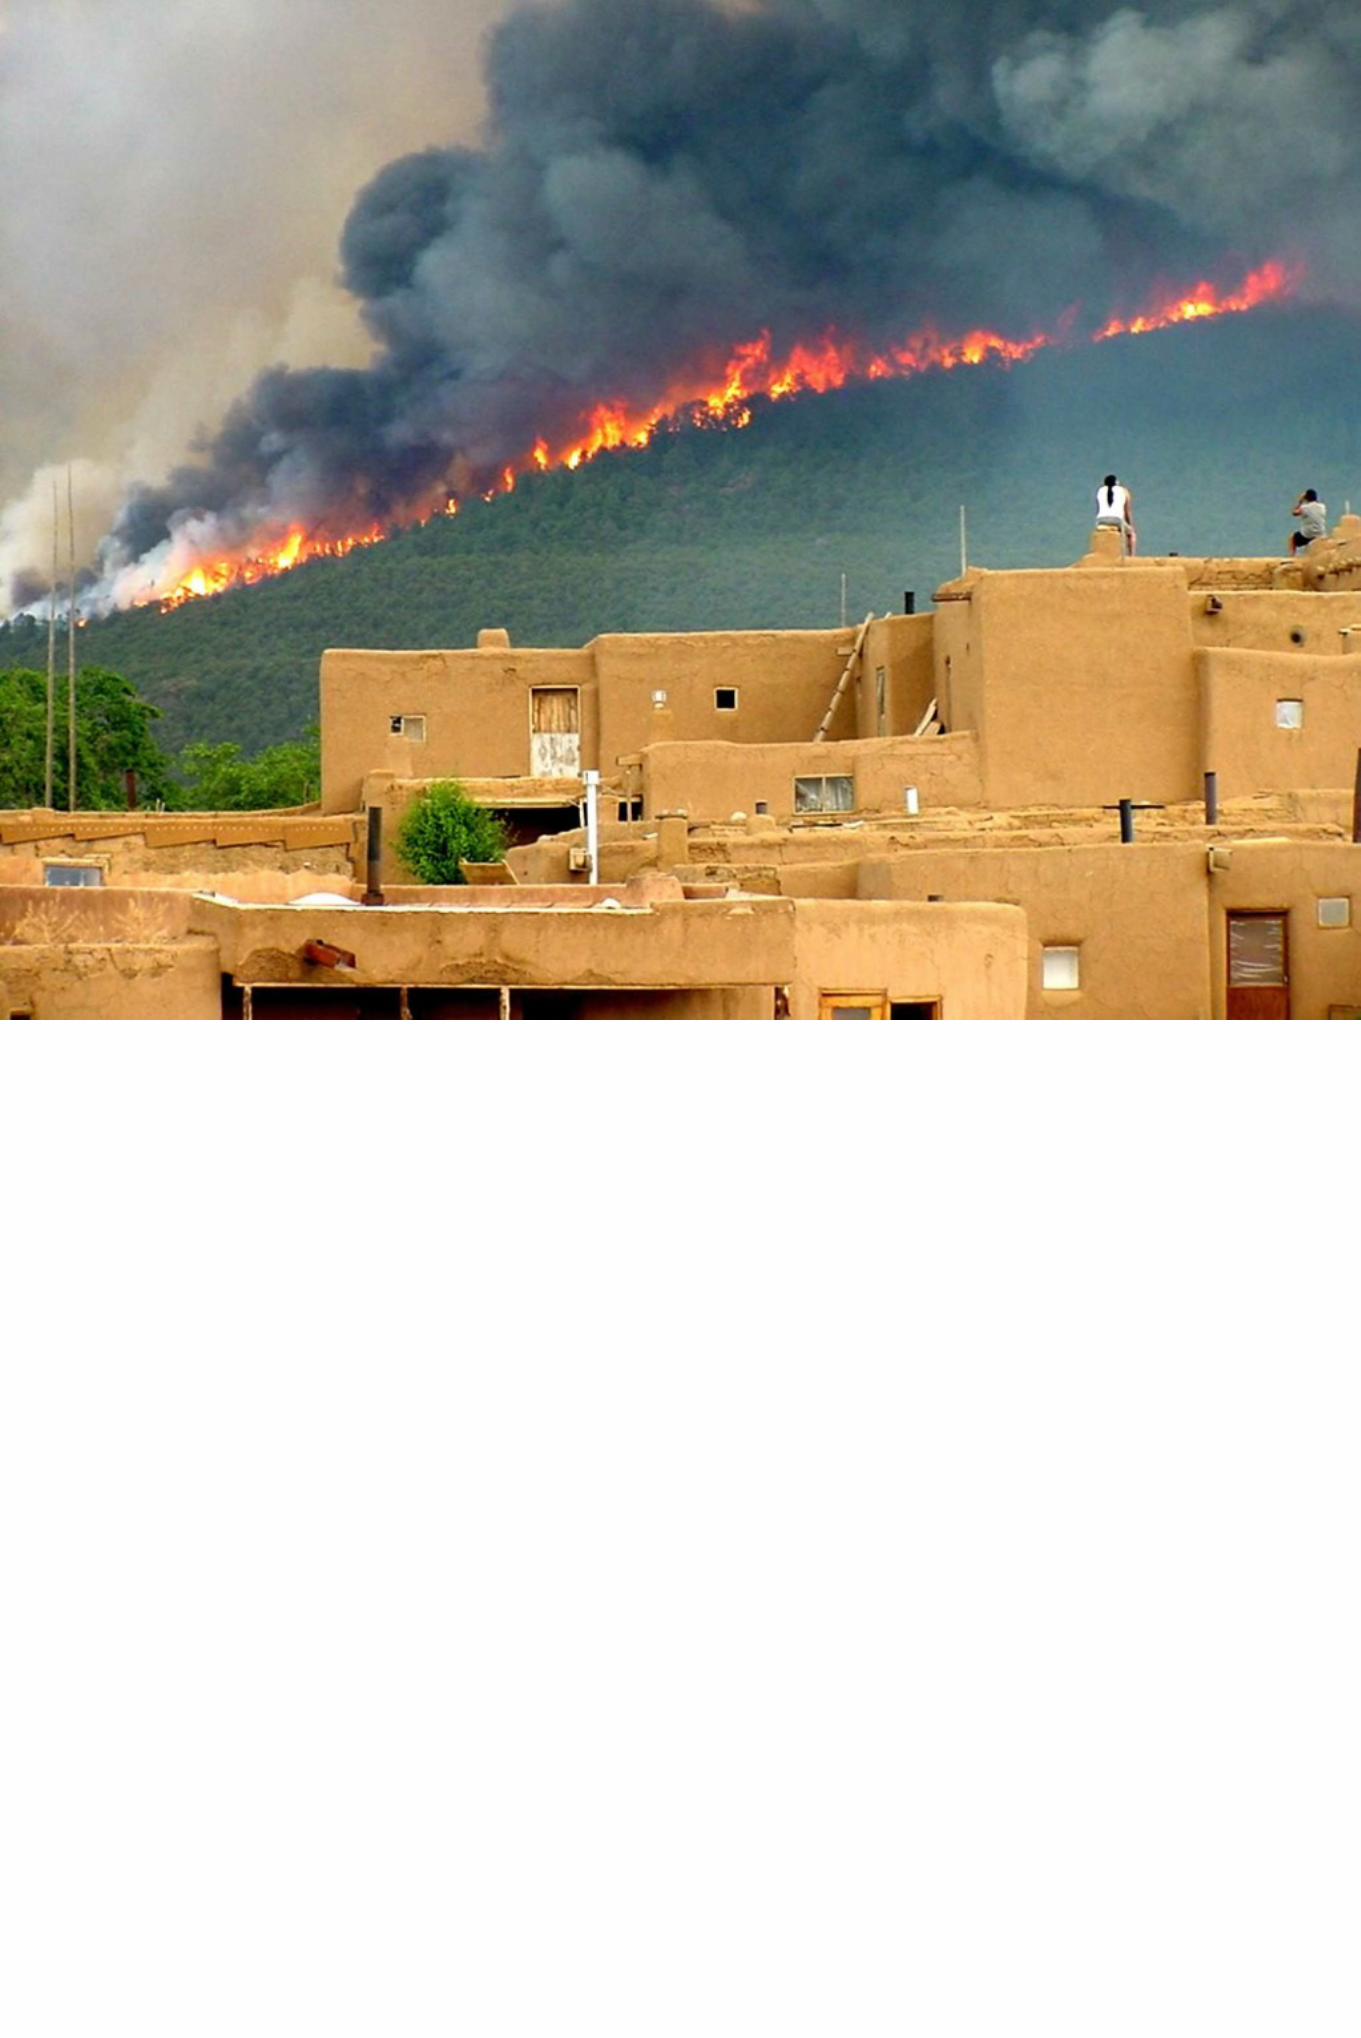
Alabama
© 2012 AP Photo/The Decatur Daily, Brennen Smith
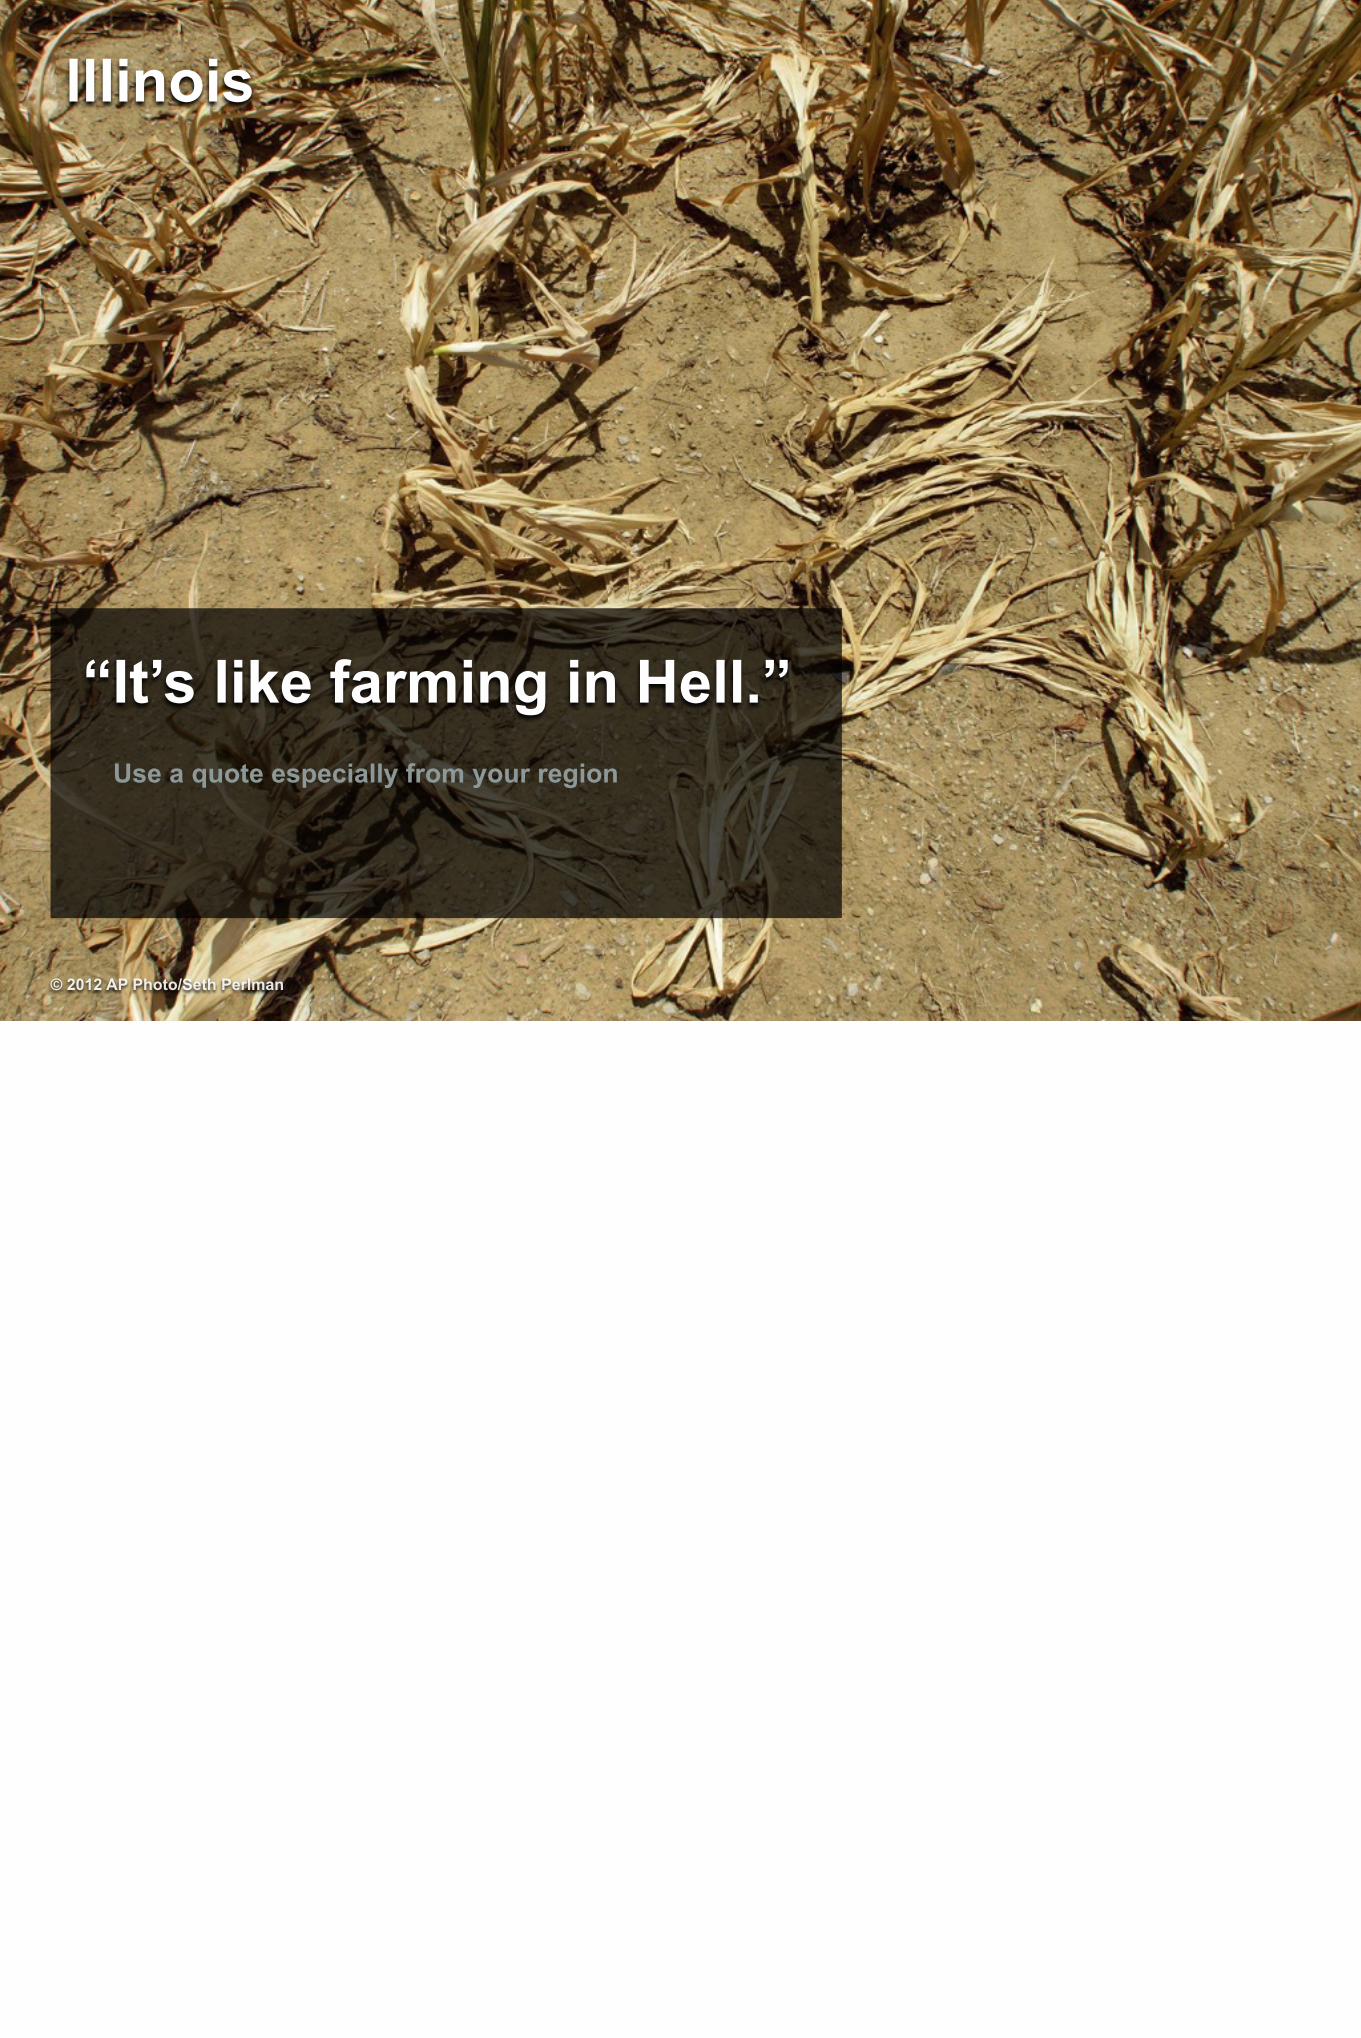
© 2012 AP Photo/Seth Perlman
“It’s like farming in Hell.”Use a quote especially from your region
lllinois
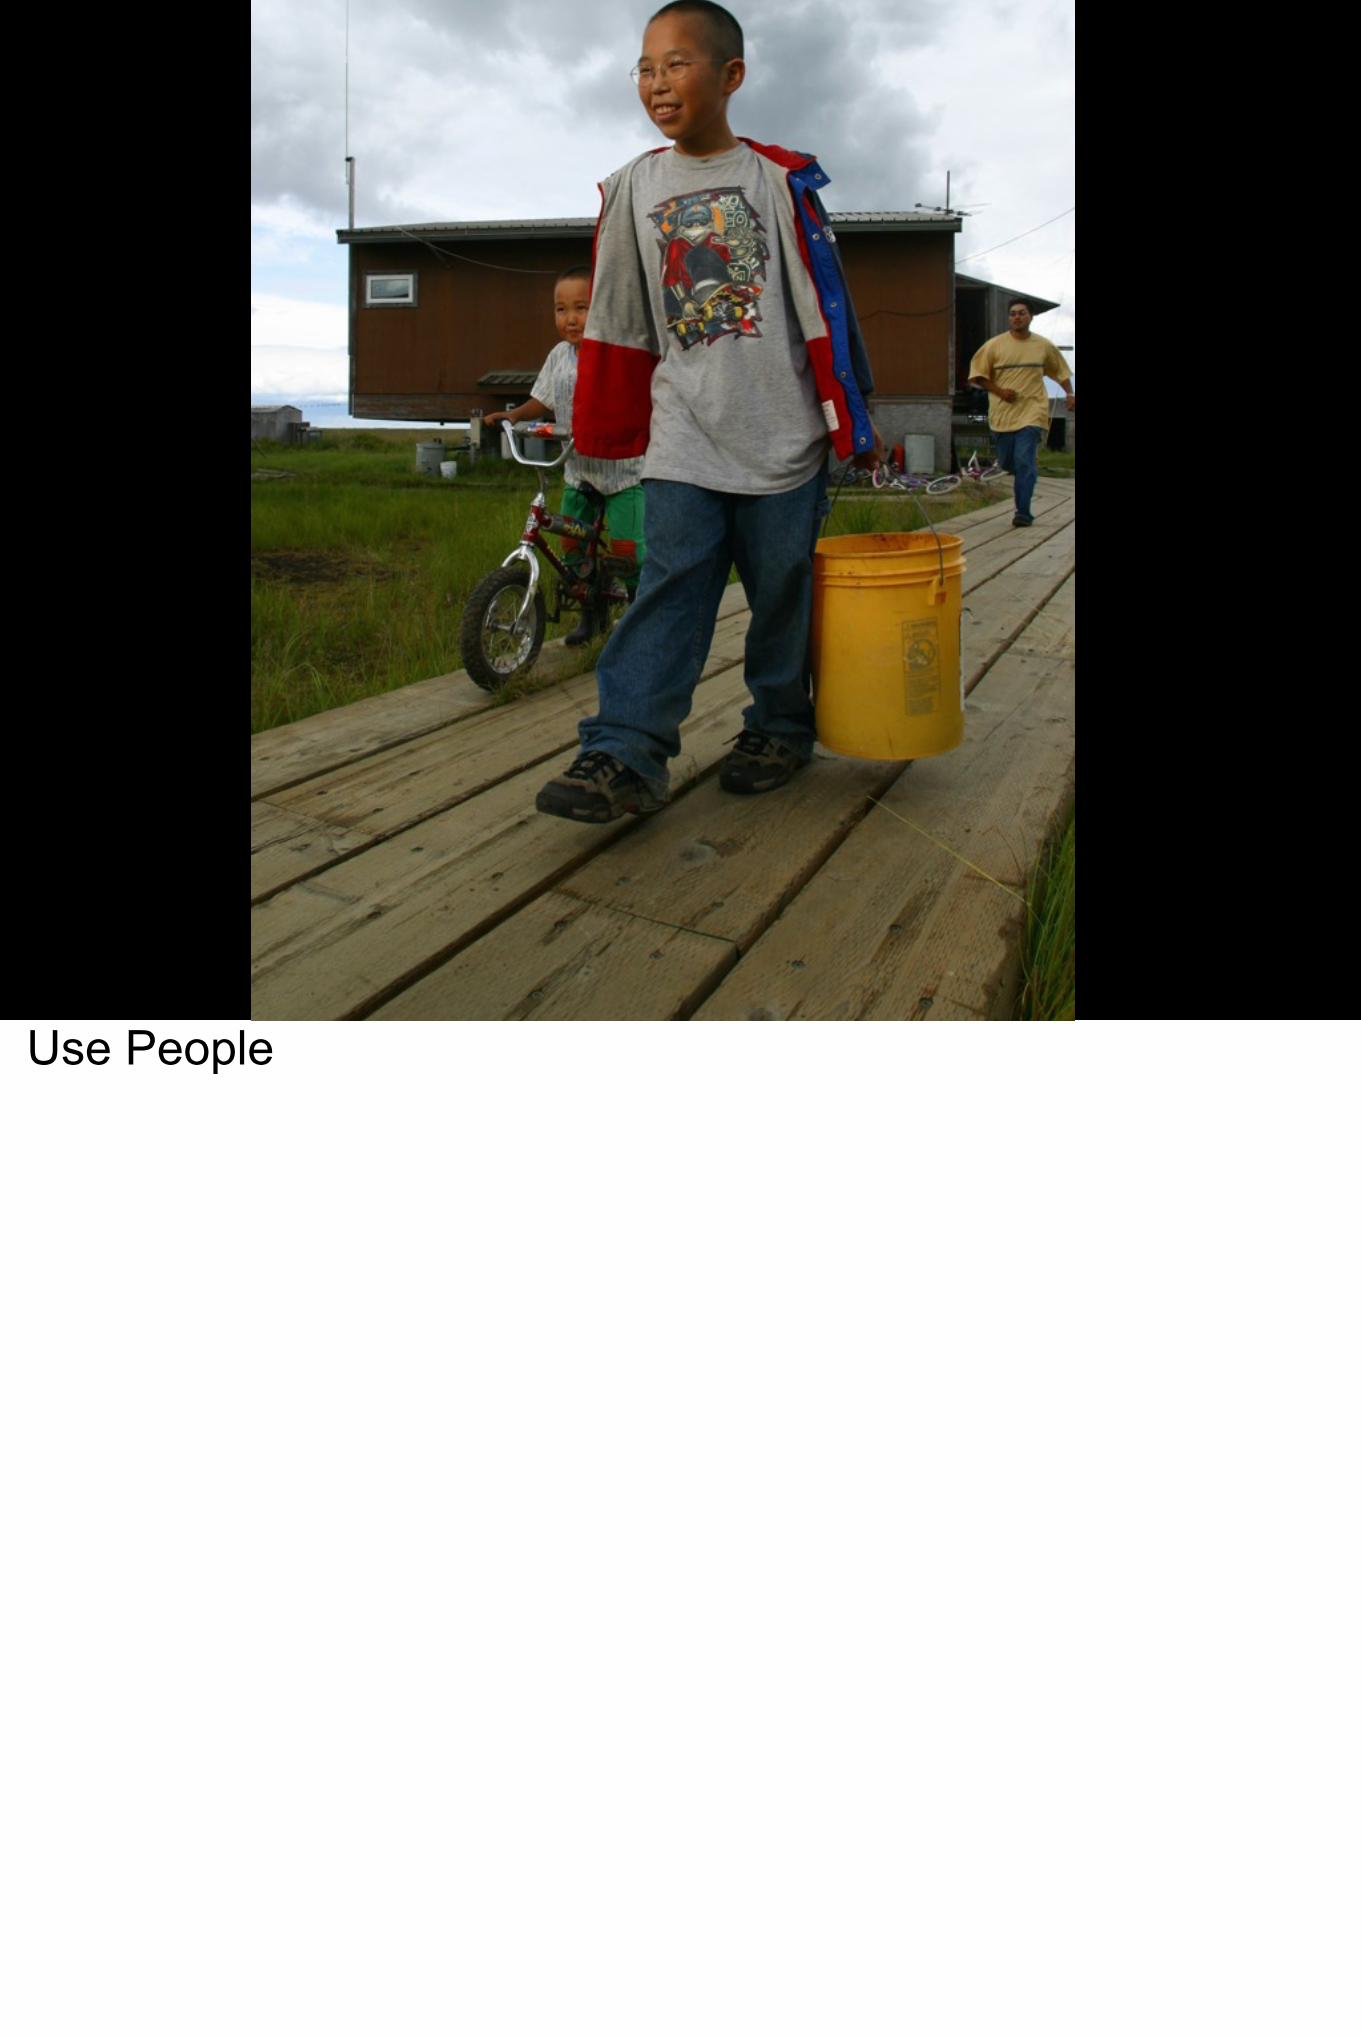
Use People
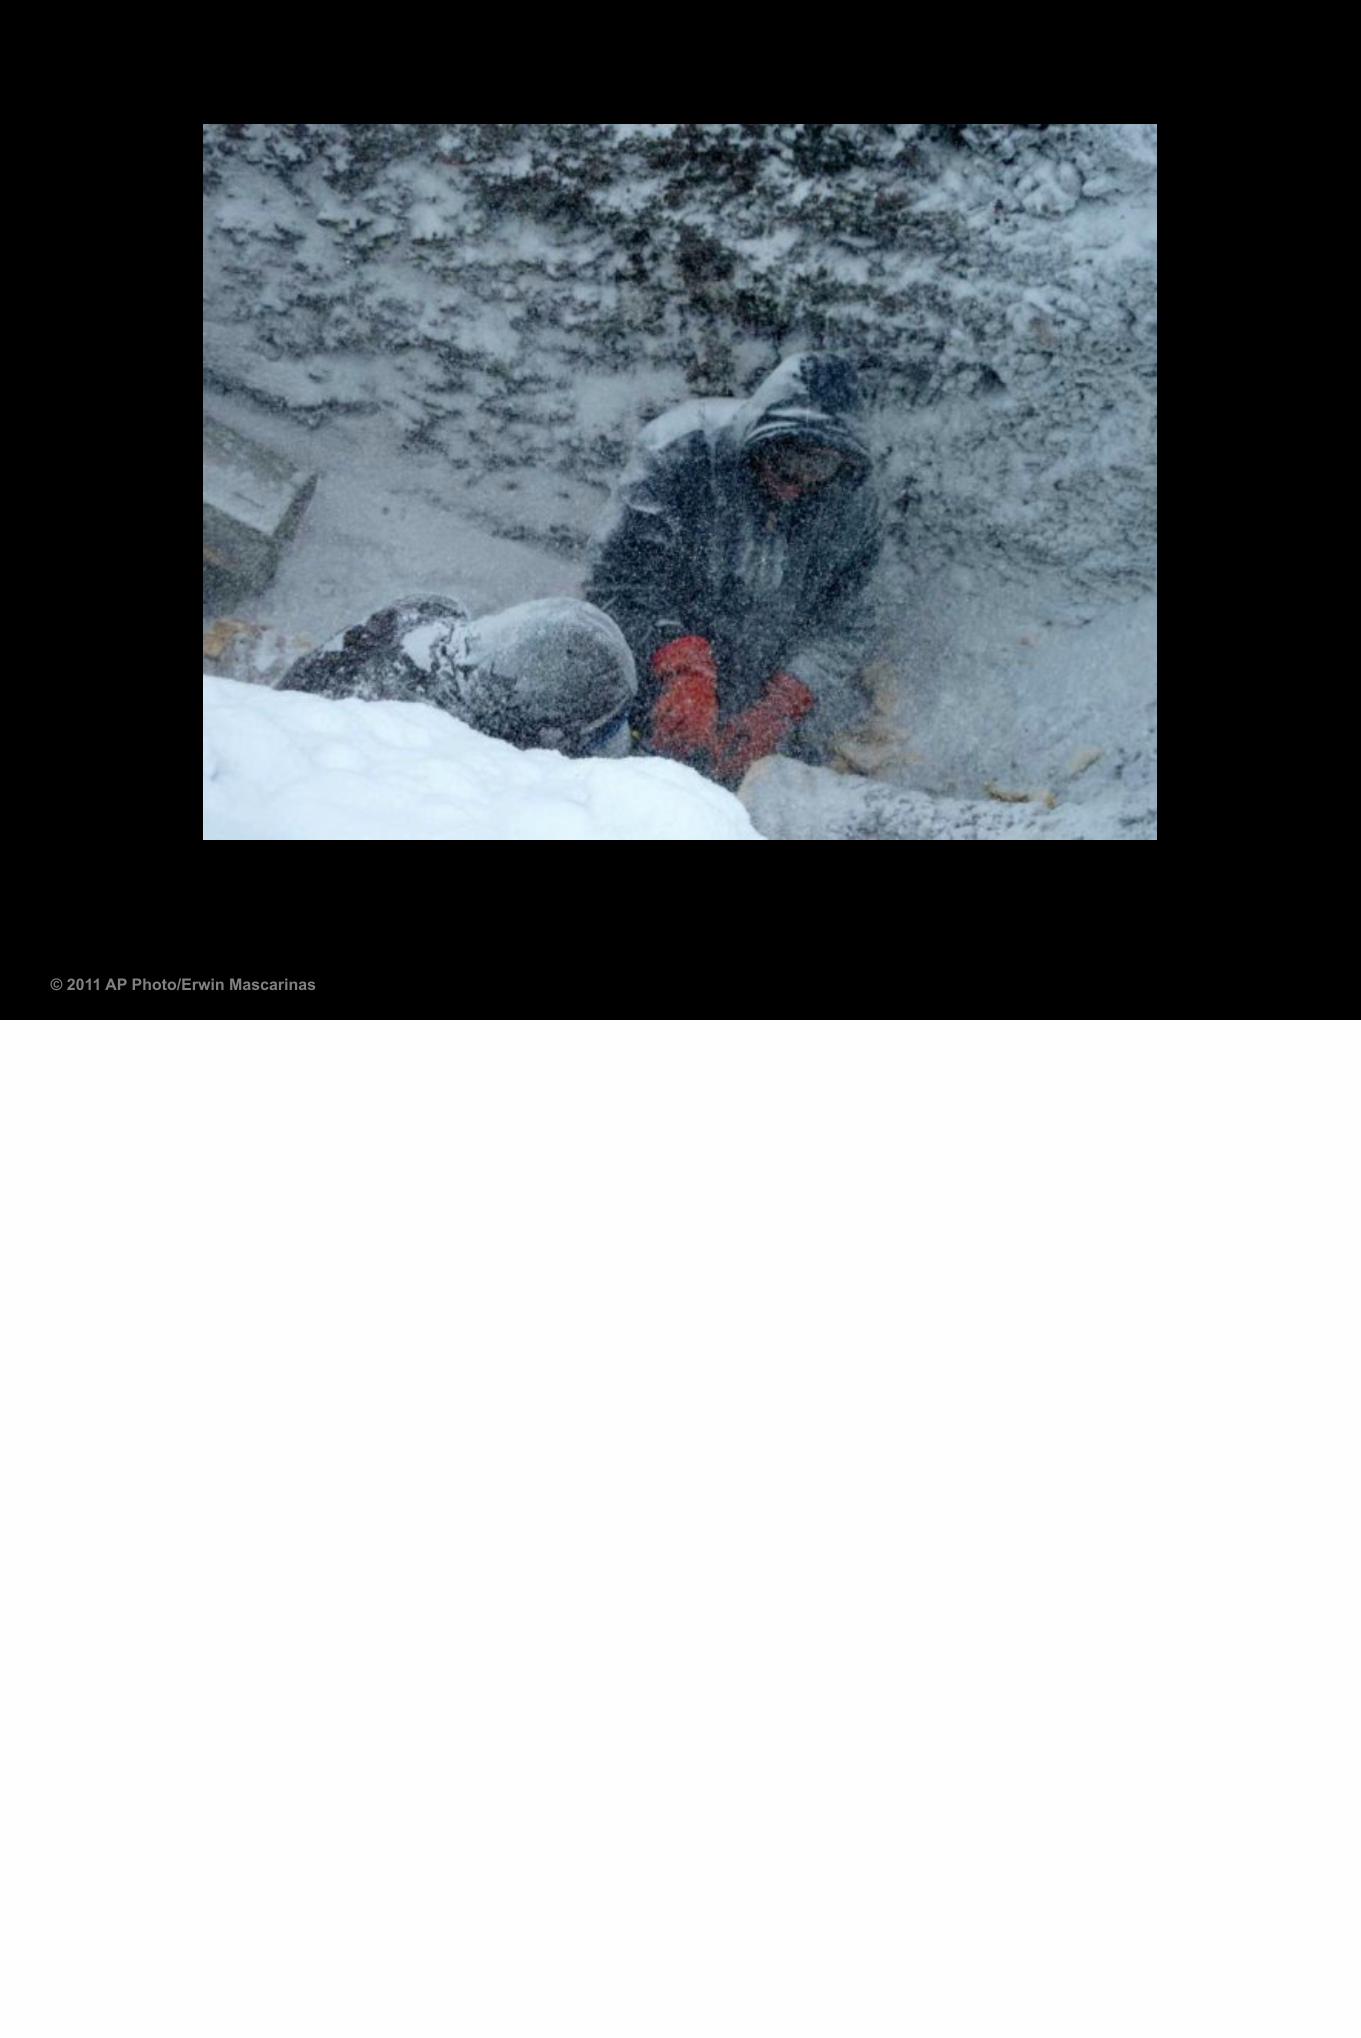
© 2011 AP Photo/Erwin Mascarinas
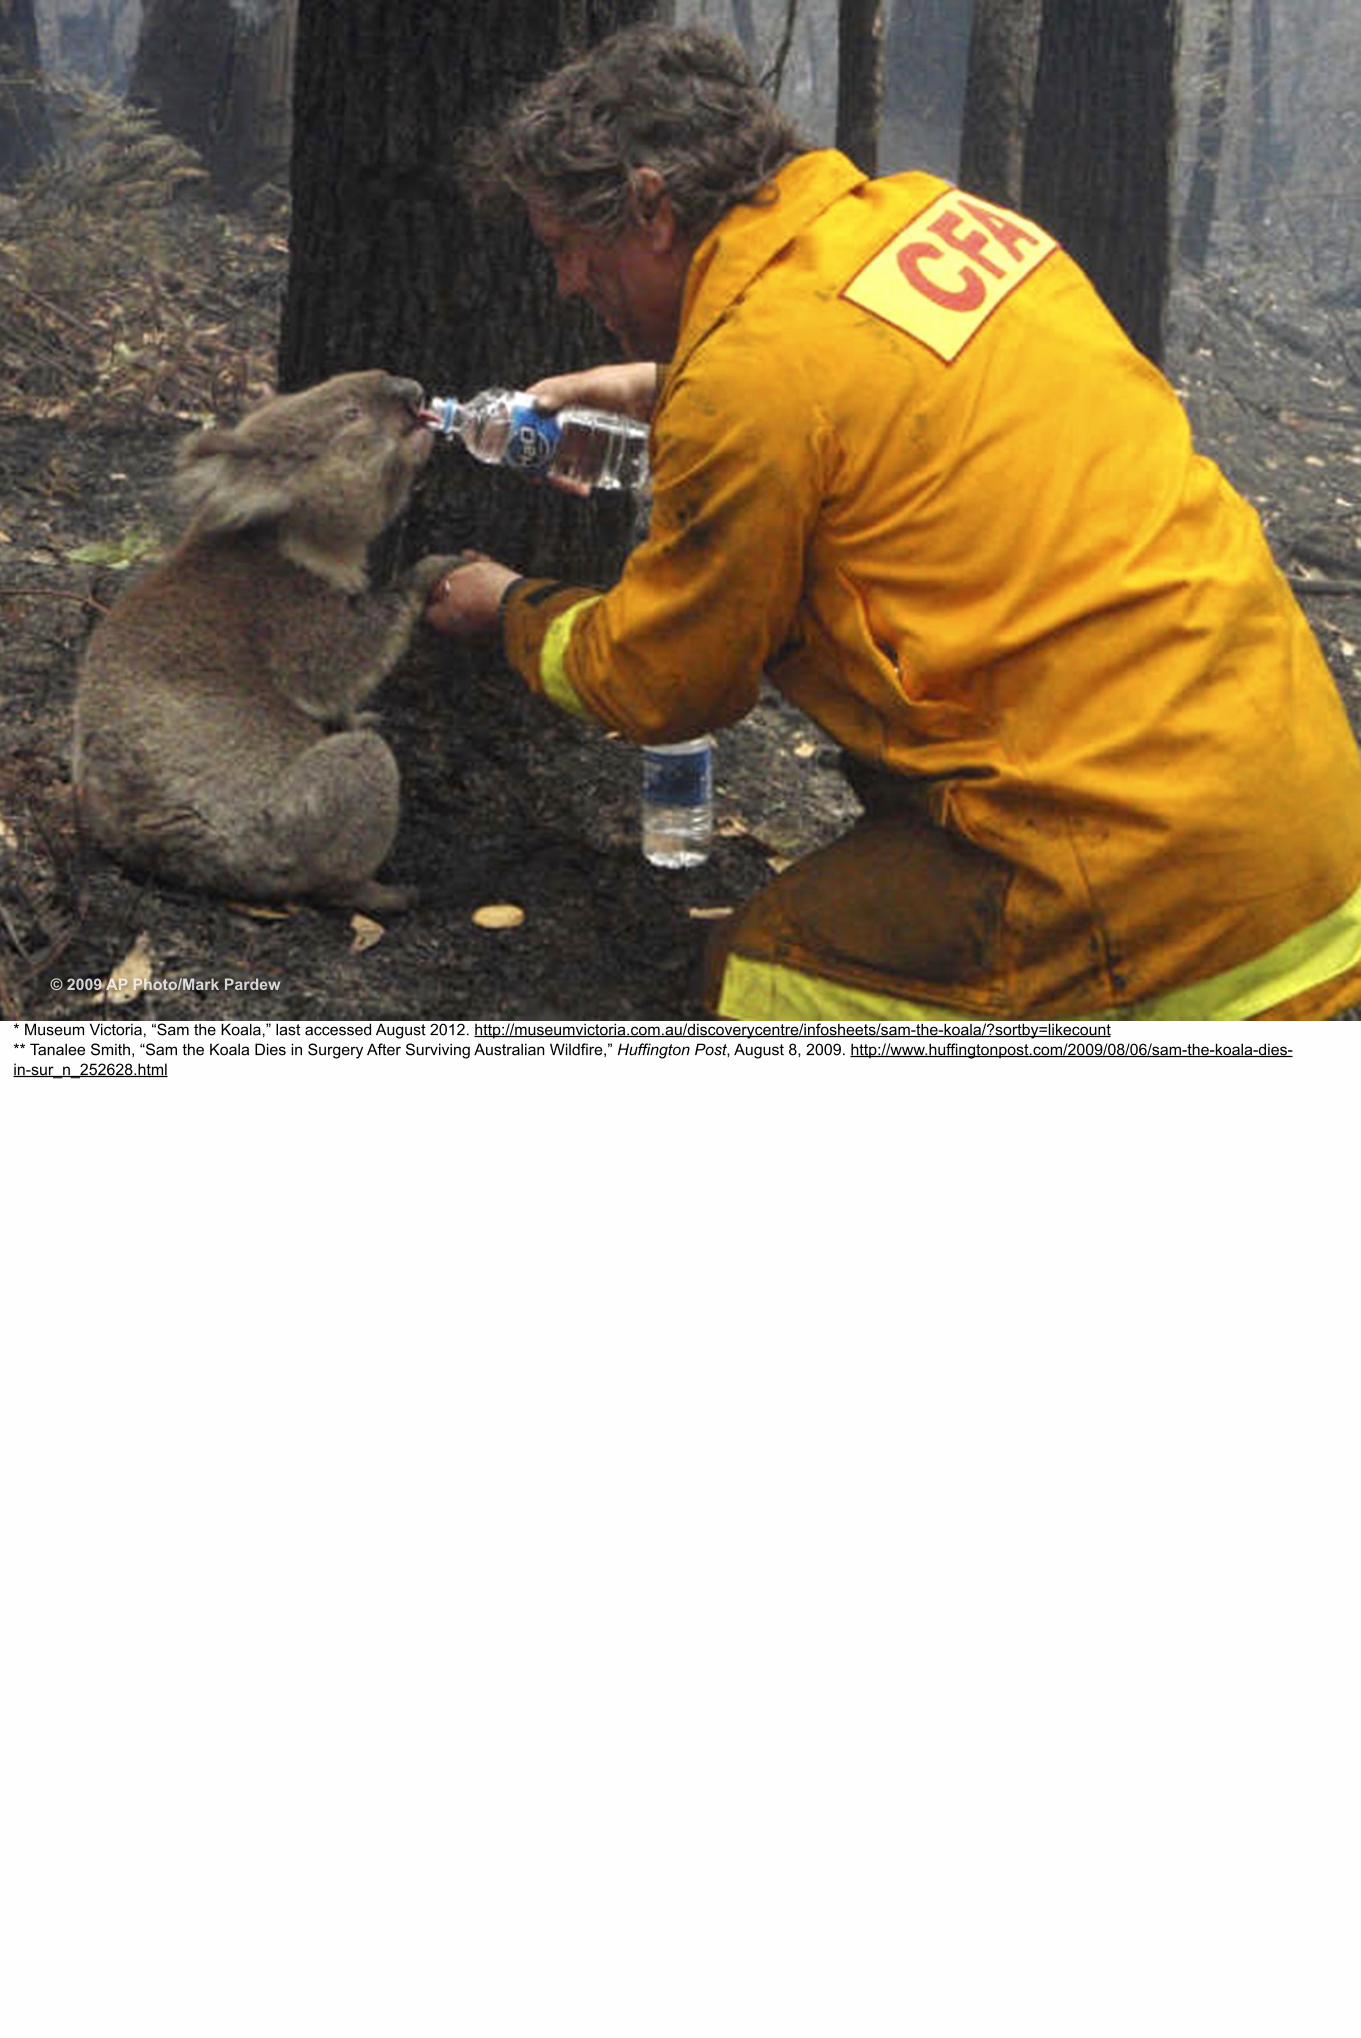
© 2009 AP Photo/Mark Pardew
* Museum Victoria, “Sam the Koala,” last accessed August 2012. http://museumvictoria.com.au/discoverycentre/infosheets/sam-the-koala/?sortby=likecount ** Tanalee Smith, “Sam the Koala Dies in Surgery After Surviving Australian Wildfire,” Huffington Post, August 8, 2009. http://www.huffingtonpost.com/2009/08/06/sam-the-koala-dies-in-sur_n_252628.html
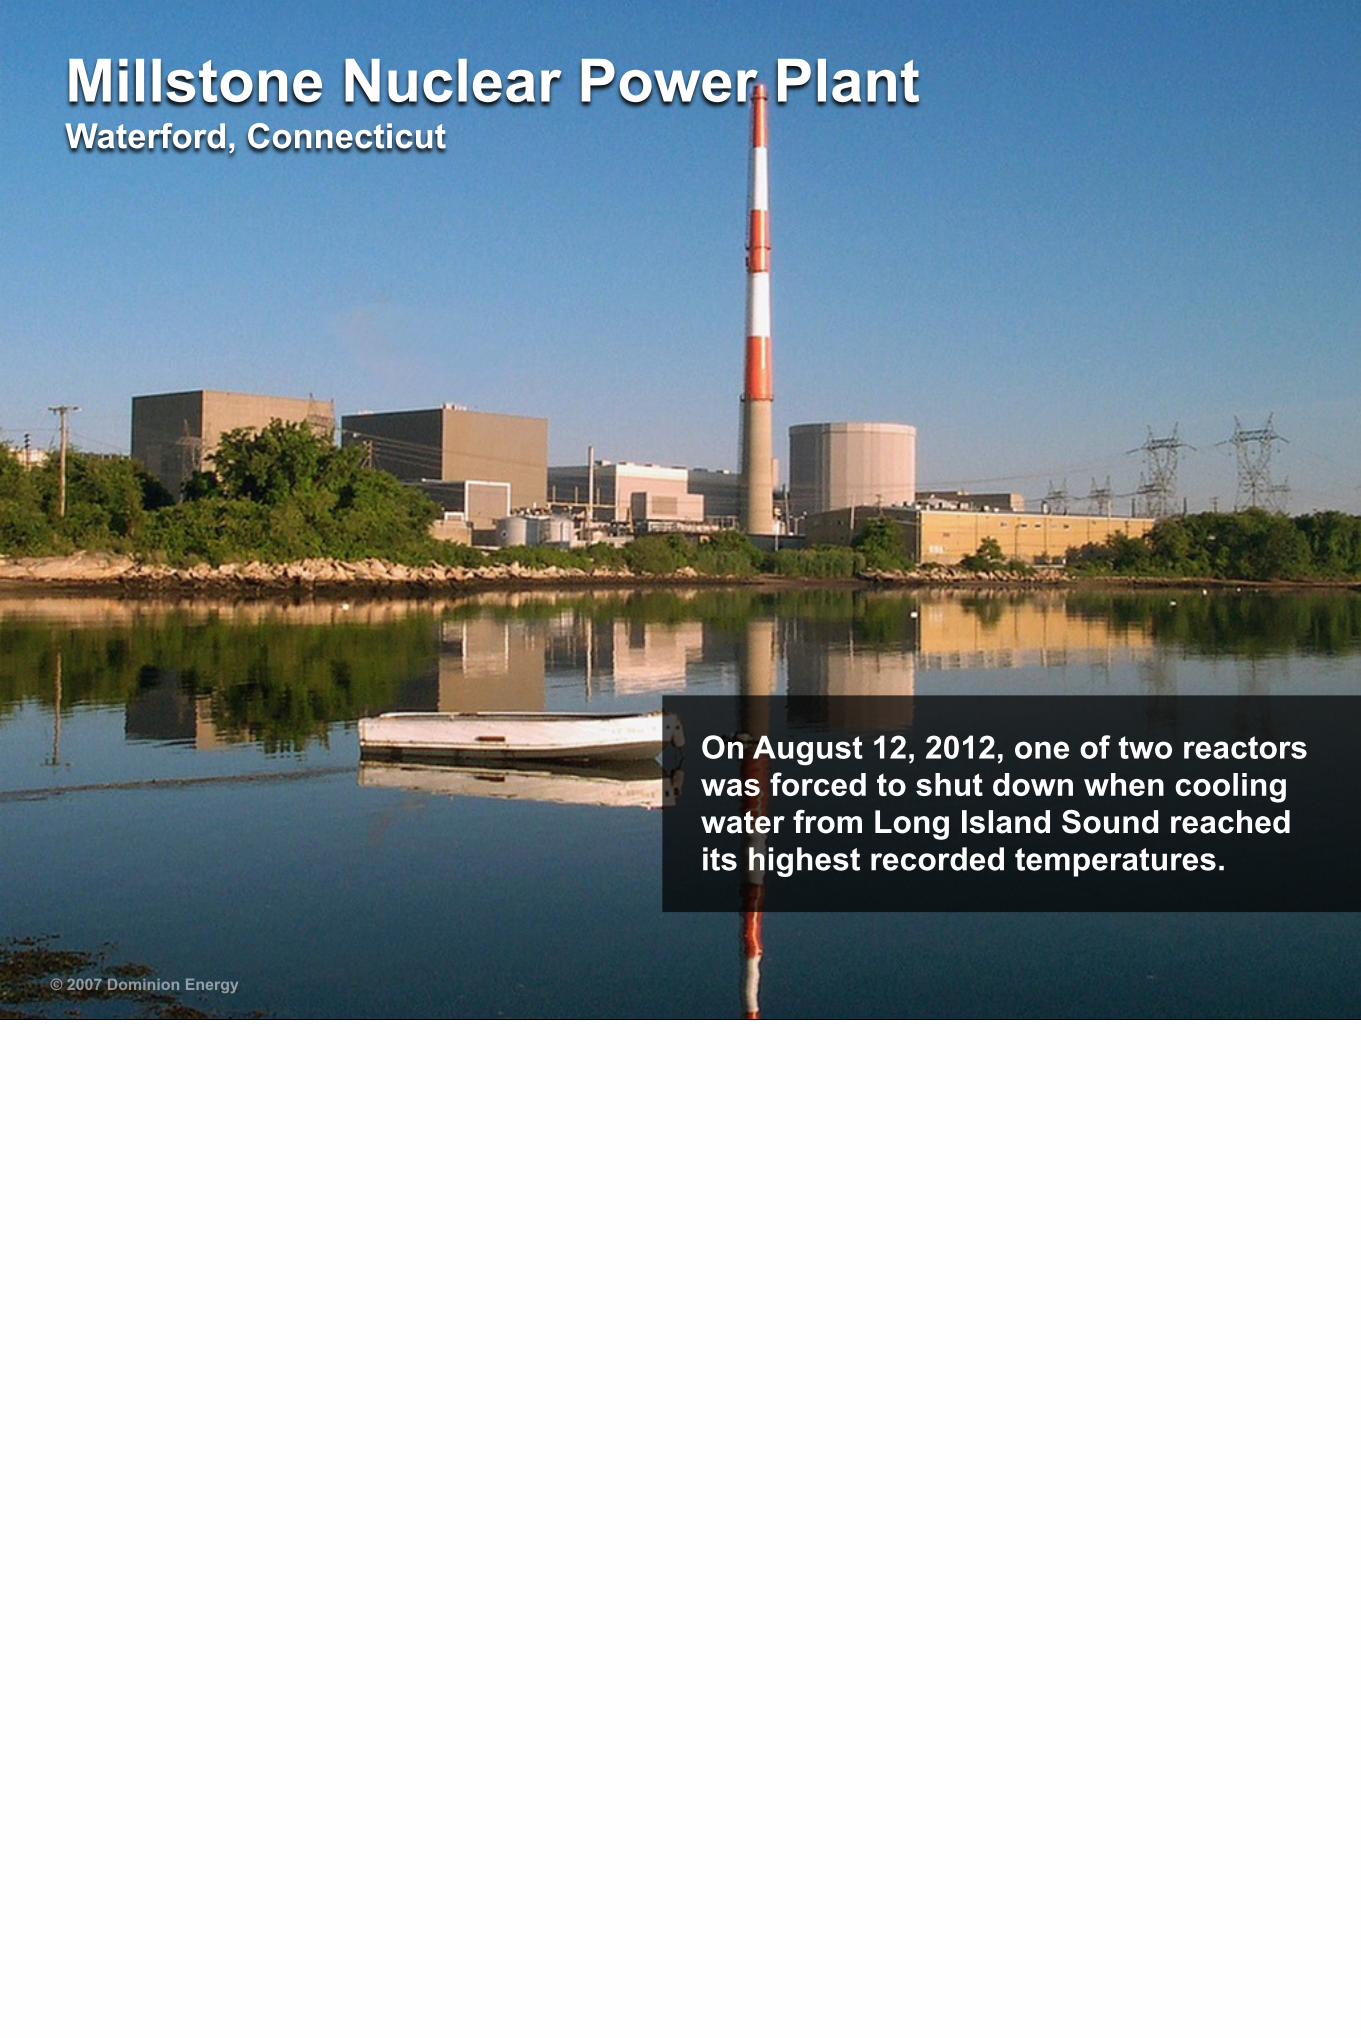
Millstone Nuclear Power PlantWaterford, Connecticut
On August 12, 2012, one of two reactors was forced to shut down when cooling water from Long Island Sound reached its highest recorded temperatures.
© 2007 Dominion Energy
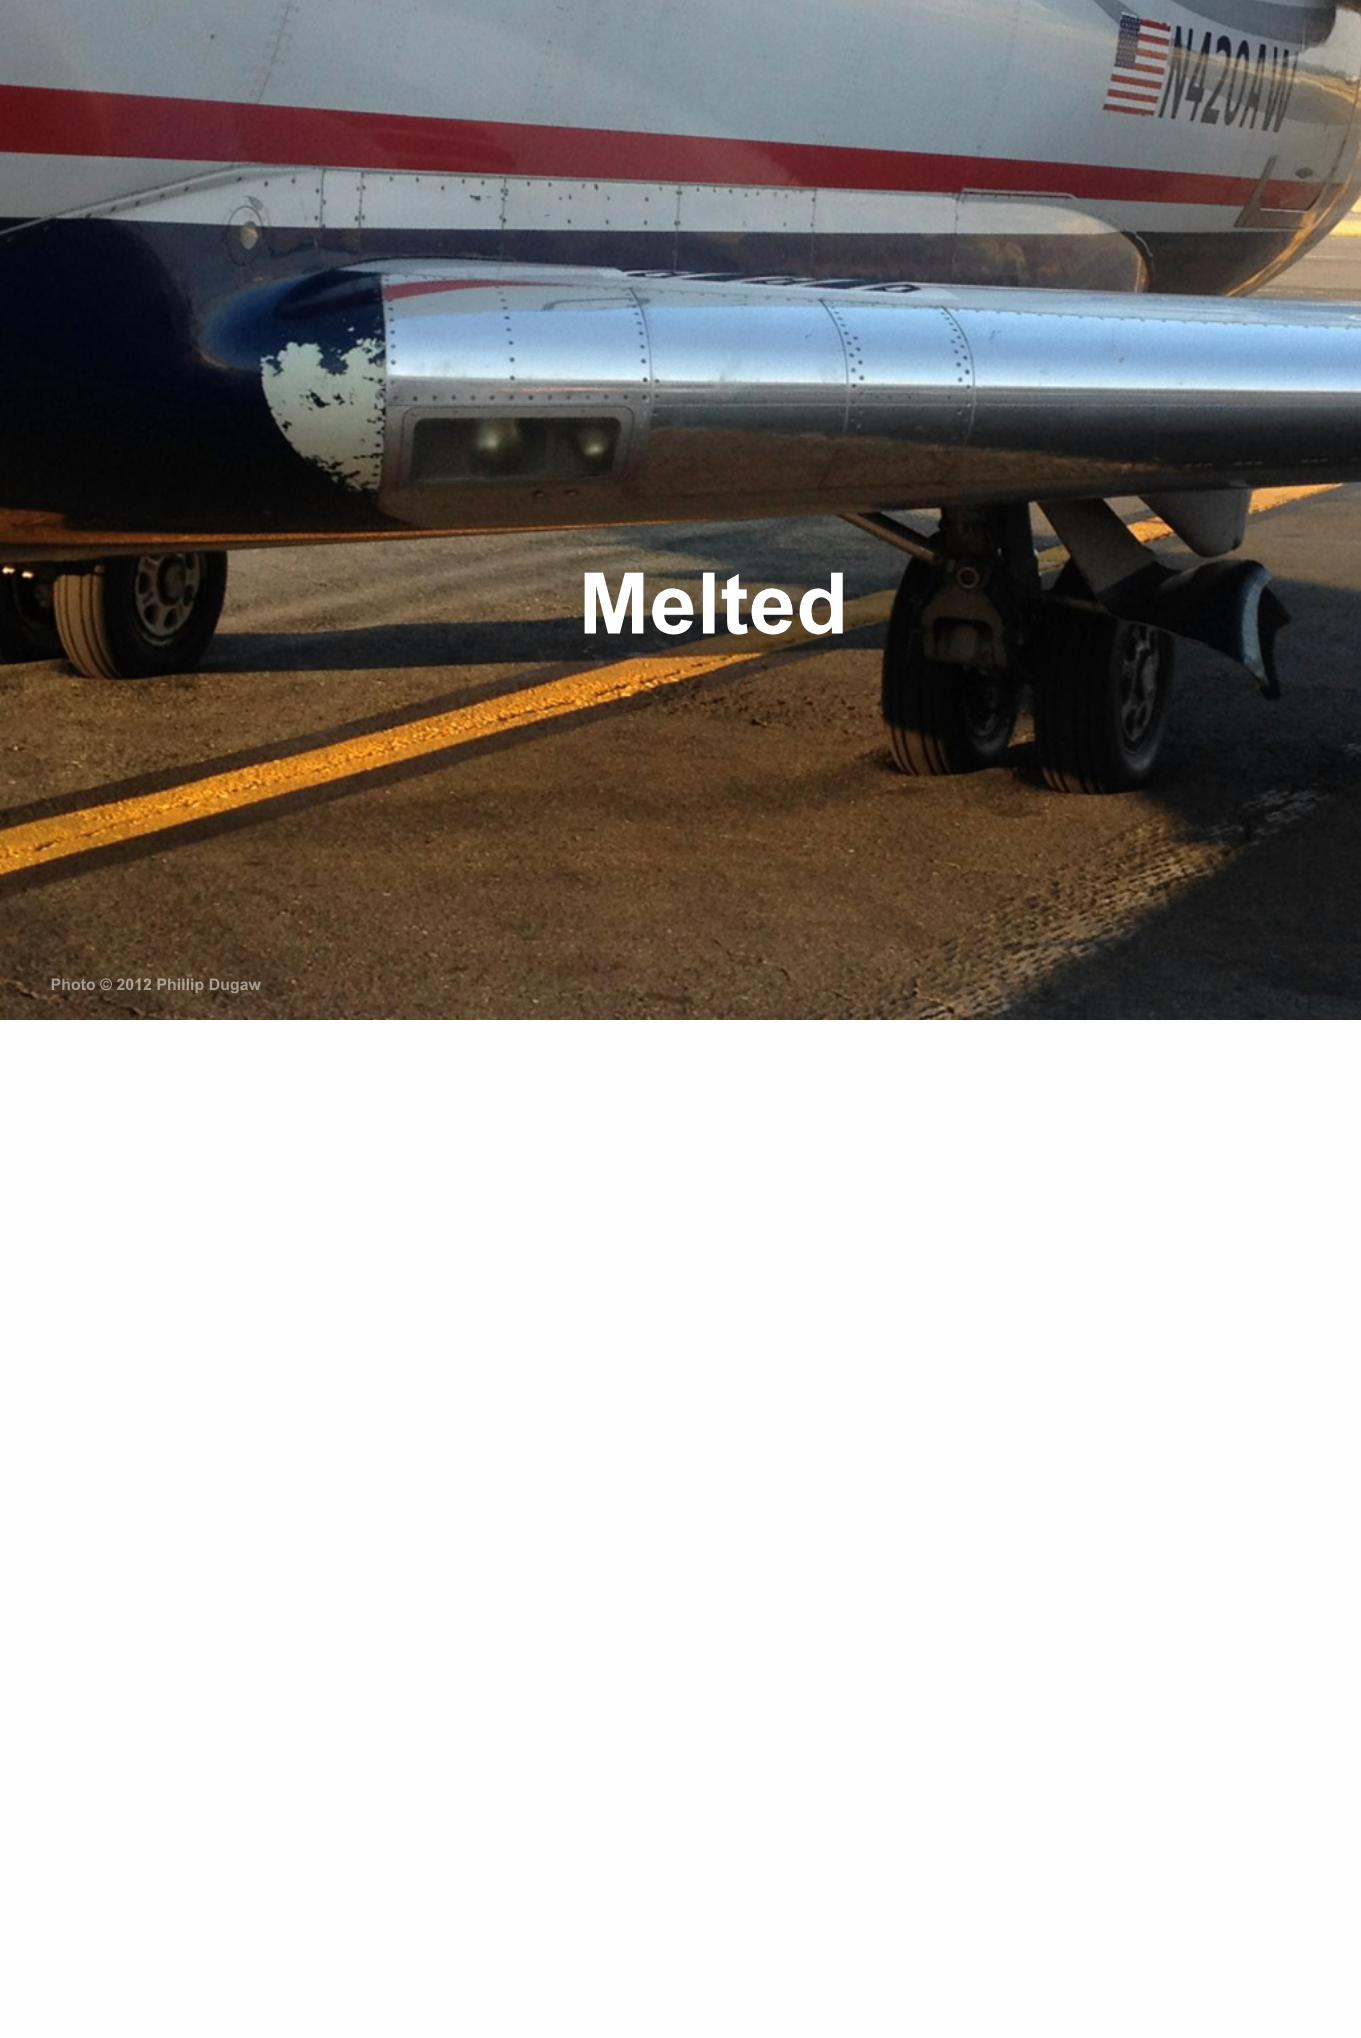
Photo © 2012 Phillip Dugaw
Melted
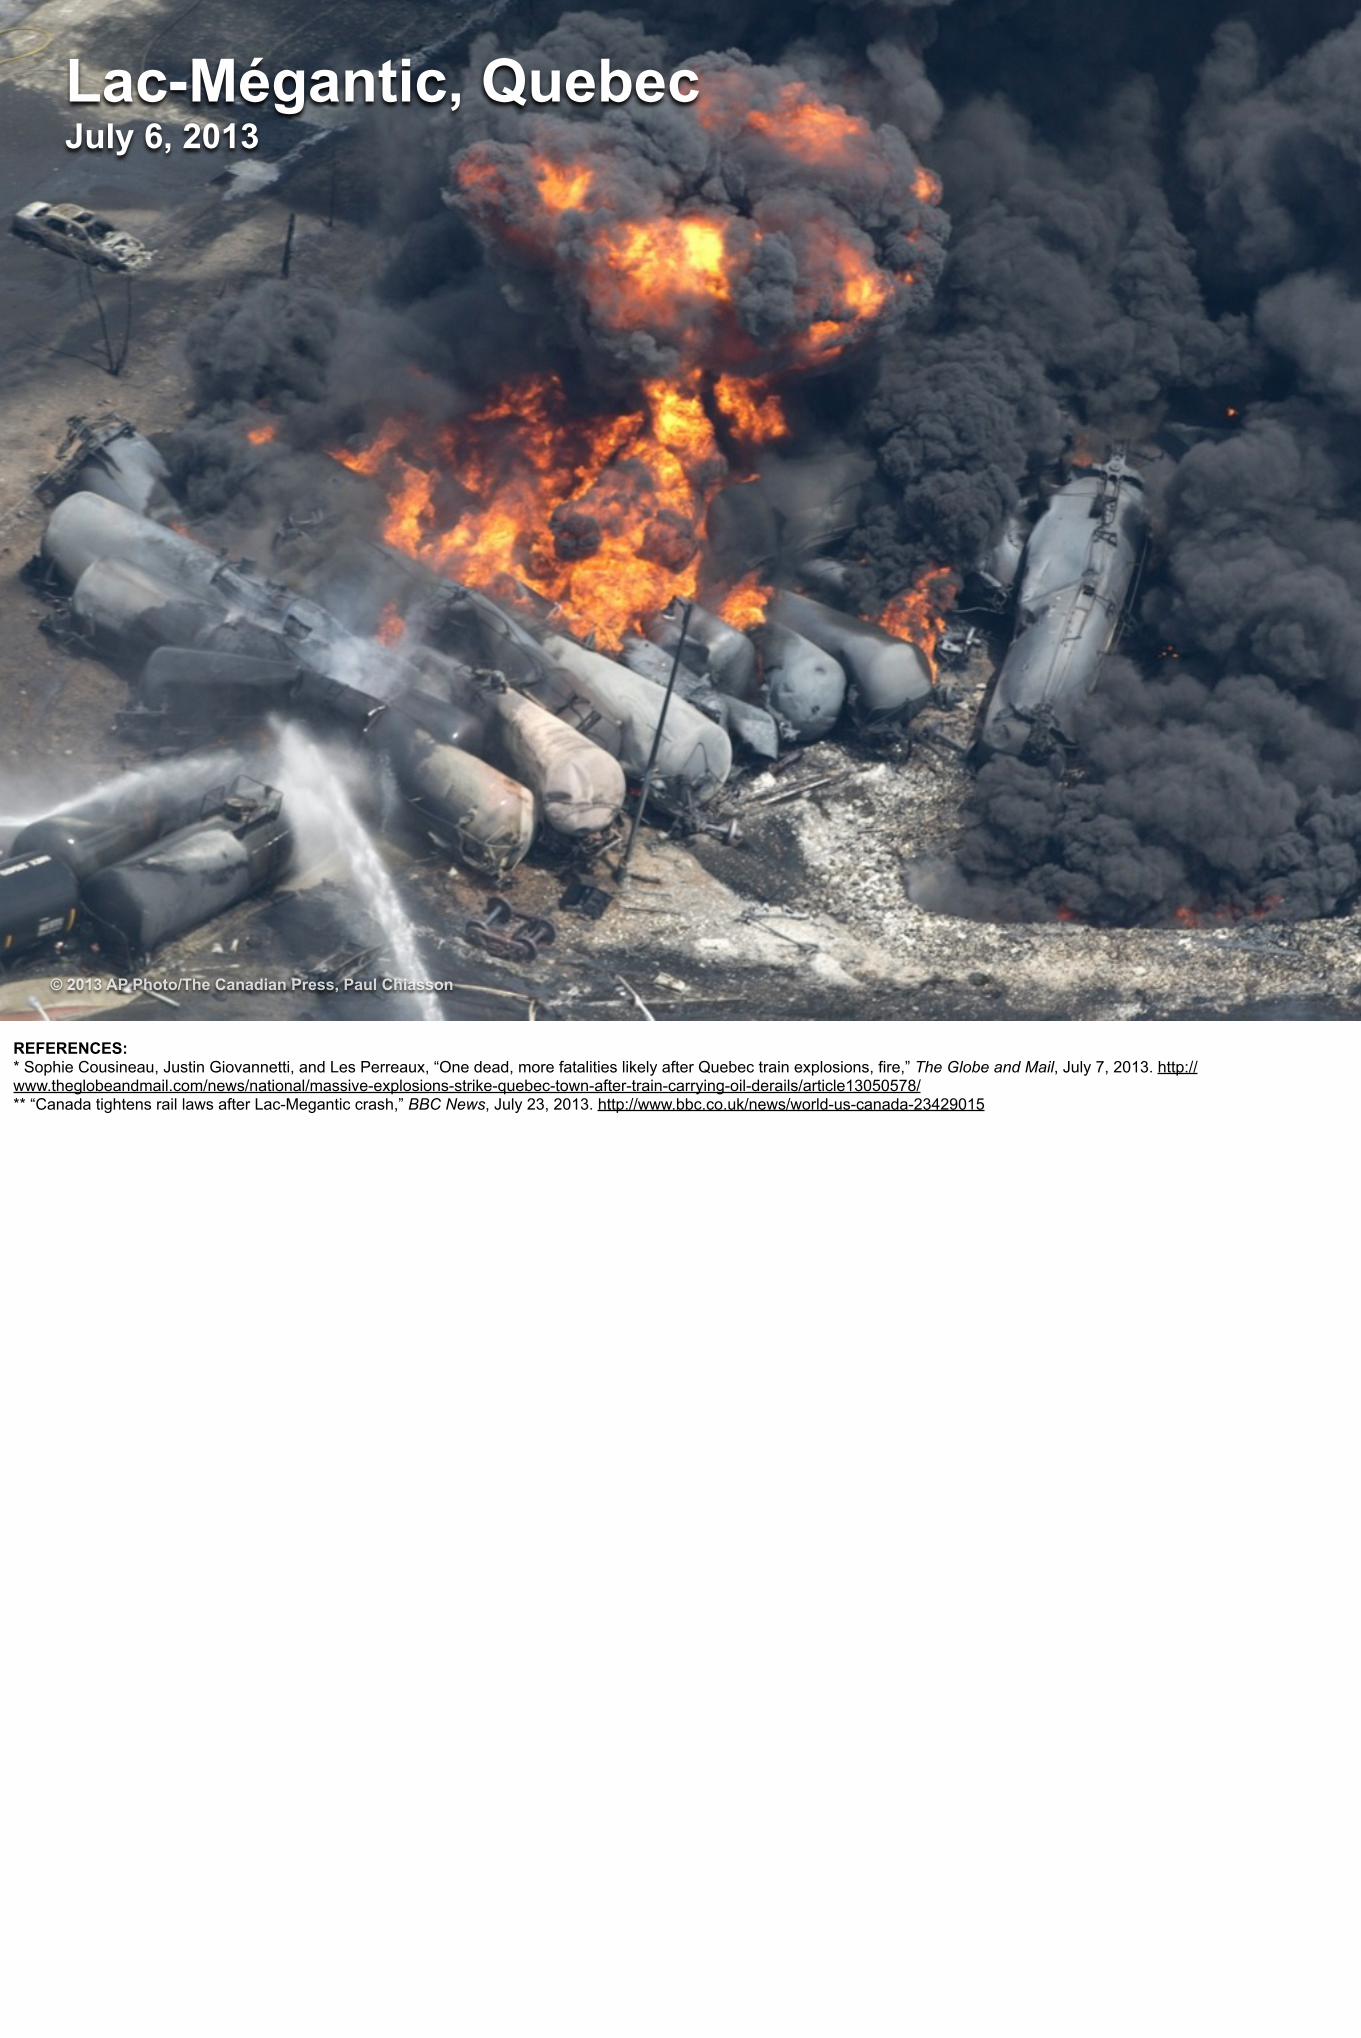
Lac-Mégantic, QuebecJuly 6, 2013
© 2013 AP Photo/The Canadian Press, Paul Chiasson
REFERENCES:* Sophie Cousineau, Justin Giovannetti, and Les Perreaux, “One dead, more fatalities likely after Quebec train explosions, fire,” The Globe and Mail, July 7, 2013. http://www.theglobeandmail.com/news/national/massive-explosions-strike-quebec-town-after-train-carrying-oil-derails/article13050578/** “Canada tightens rail laws after Lac-Megantic crash,” BBC News, July 23, 2013. http://www.bbc.co.uk/news/world-us-canada-23429015
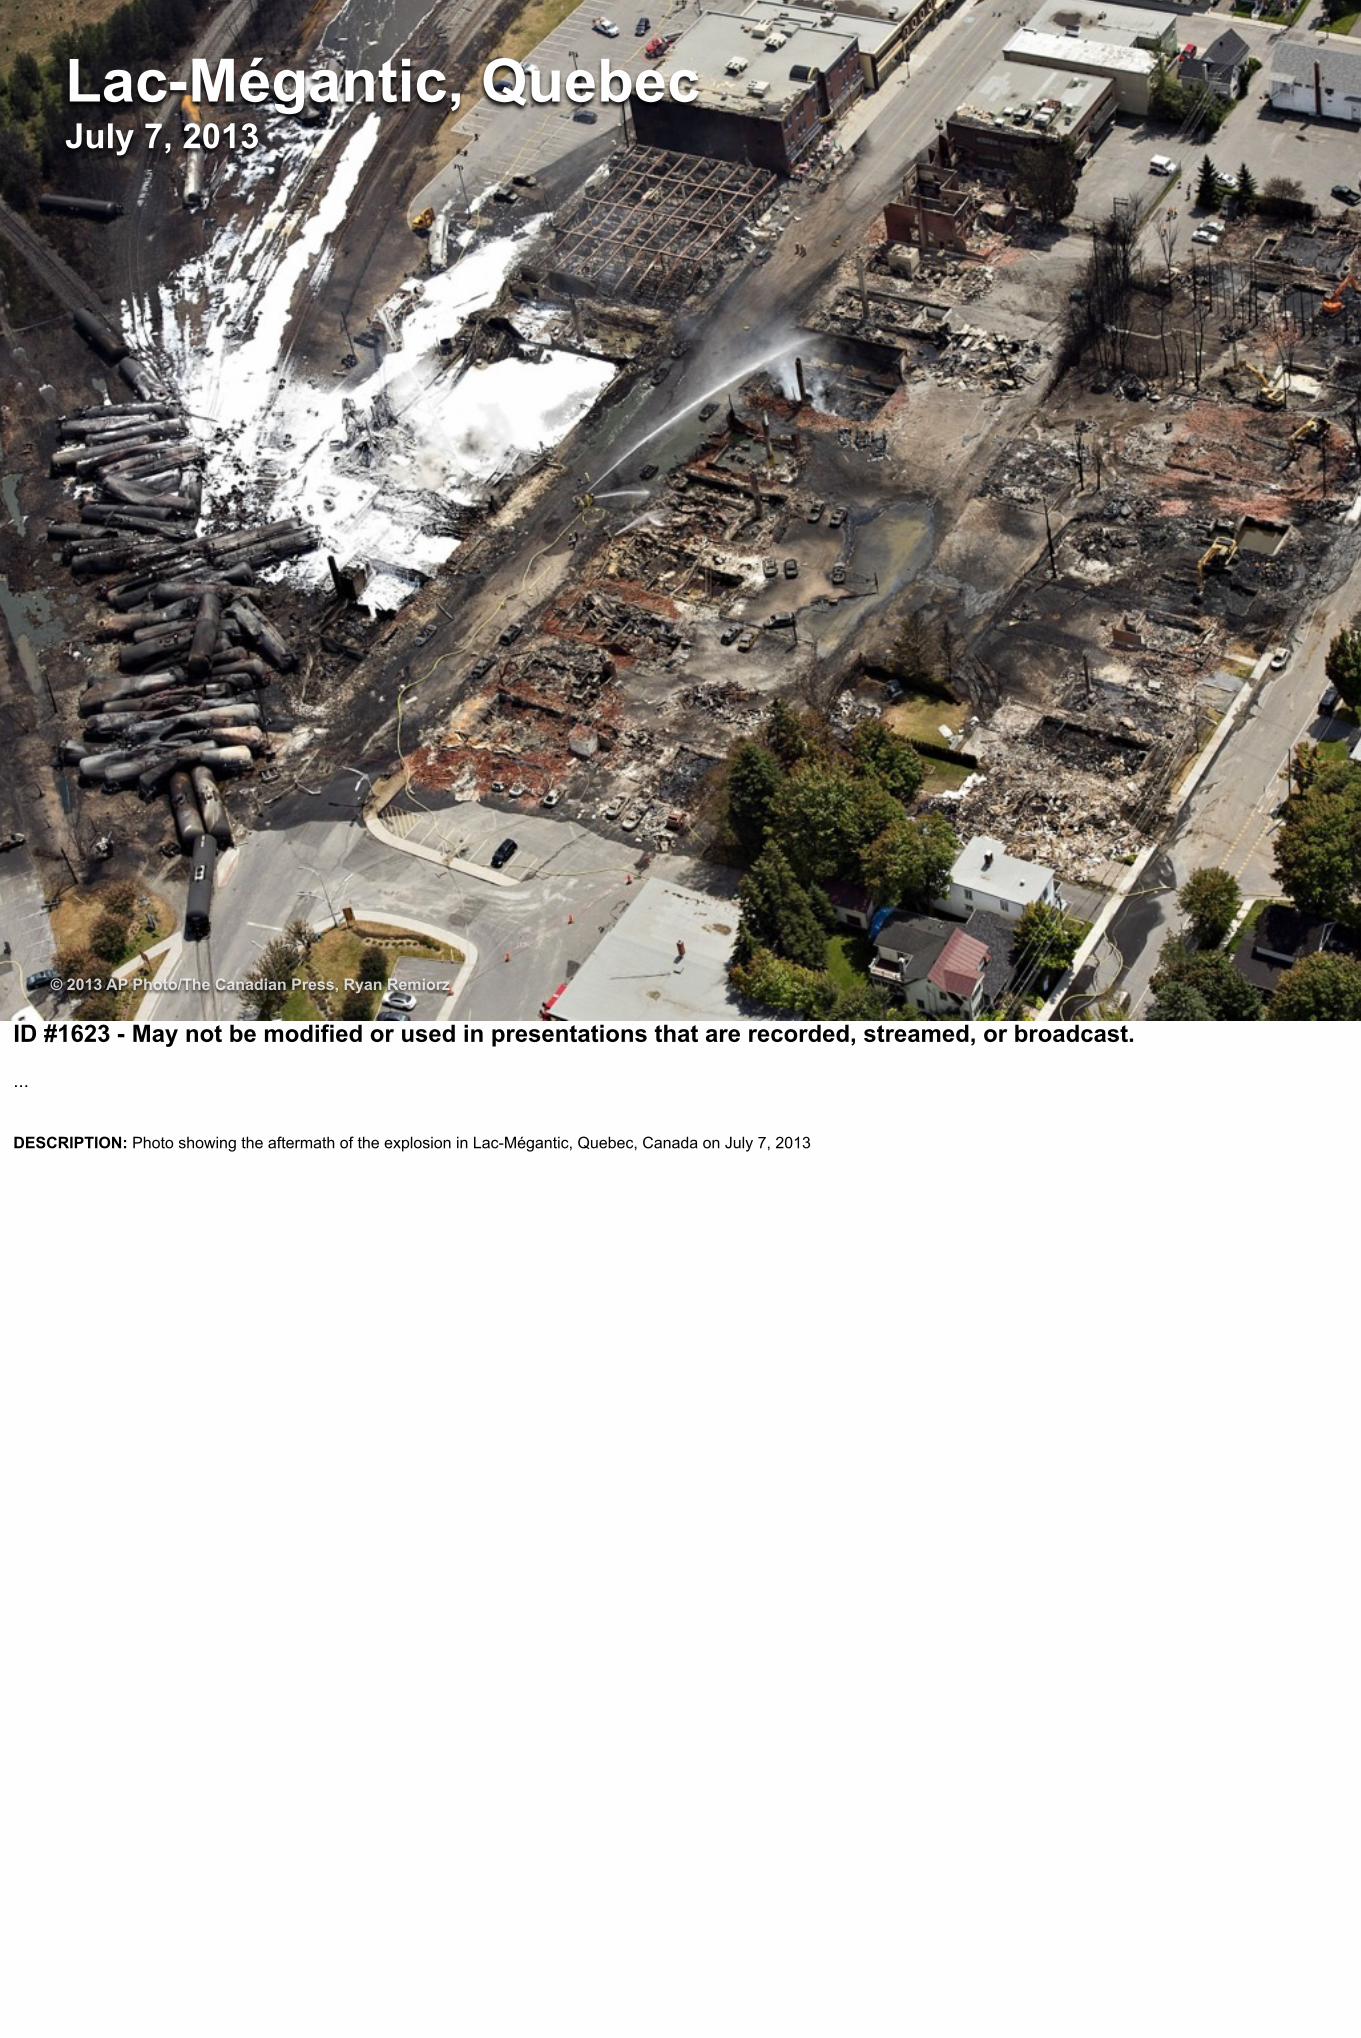
Lac-Mégantic, QuebecJuly 7, 2013
© 2013 AP Photo/The Canadian Press, Ryan Remiorz
ID #1623 - May not be modified or used in presentations that are recorded, streamed, or broadcast.
...
DESCRIPTION: Photo showing the aftermath of the explosion in Lac-Mégantic, Quebec, Canada on July 7, 2013
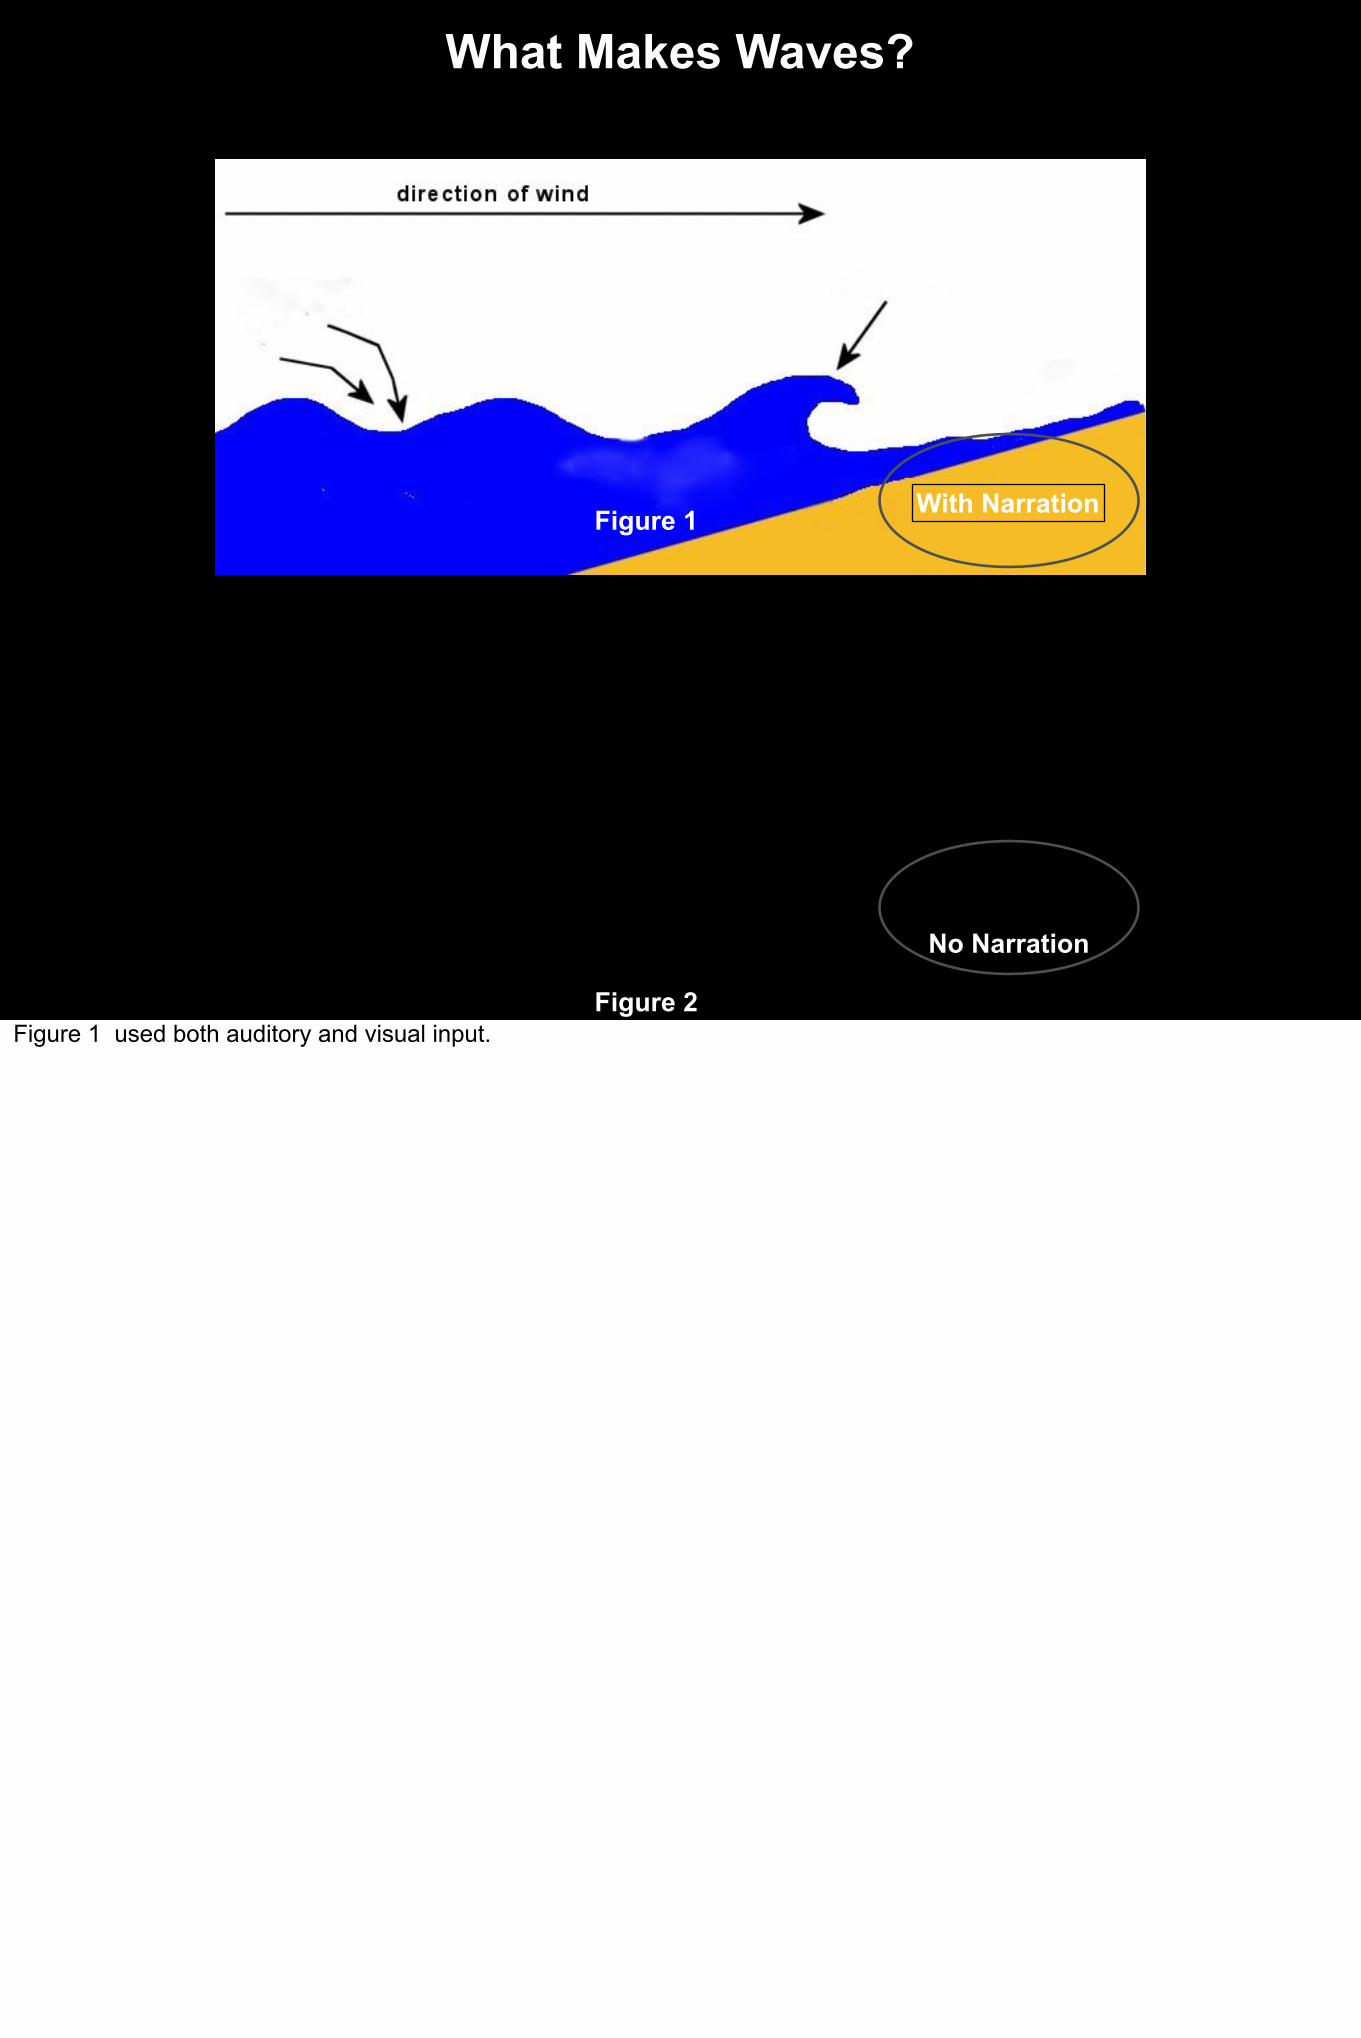
Figure 2
Figure 1 With Narration
No Narration
What Makes Waves?
Figure 1 used both auditory and visual input.
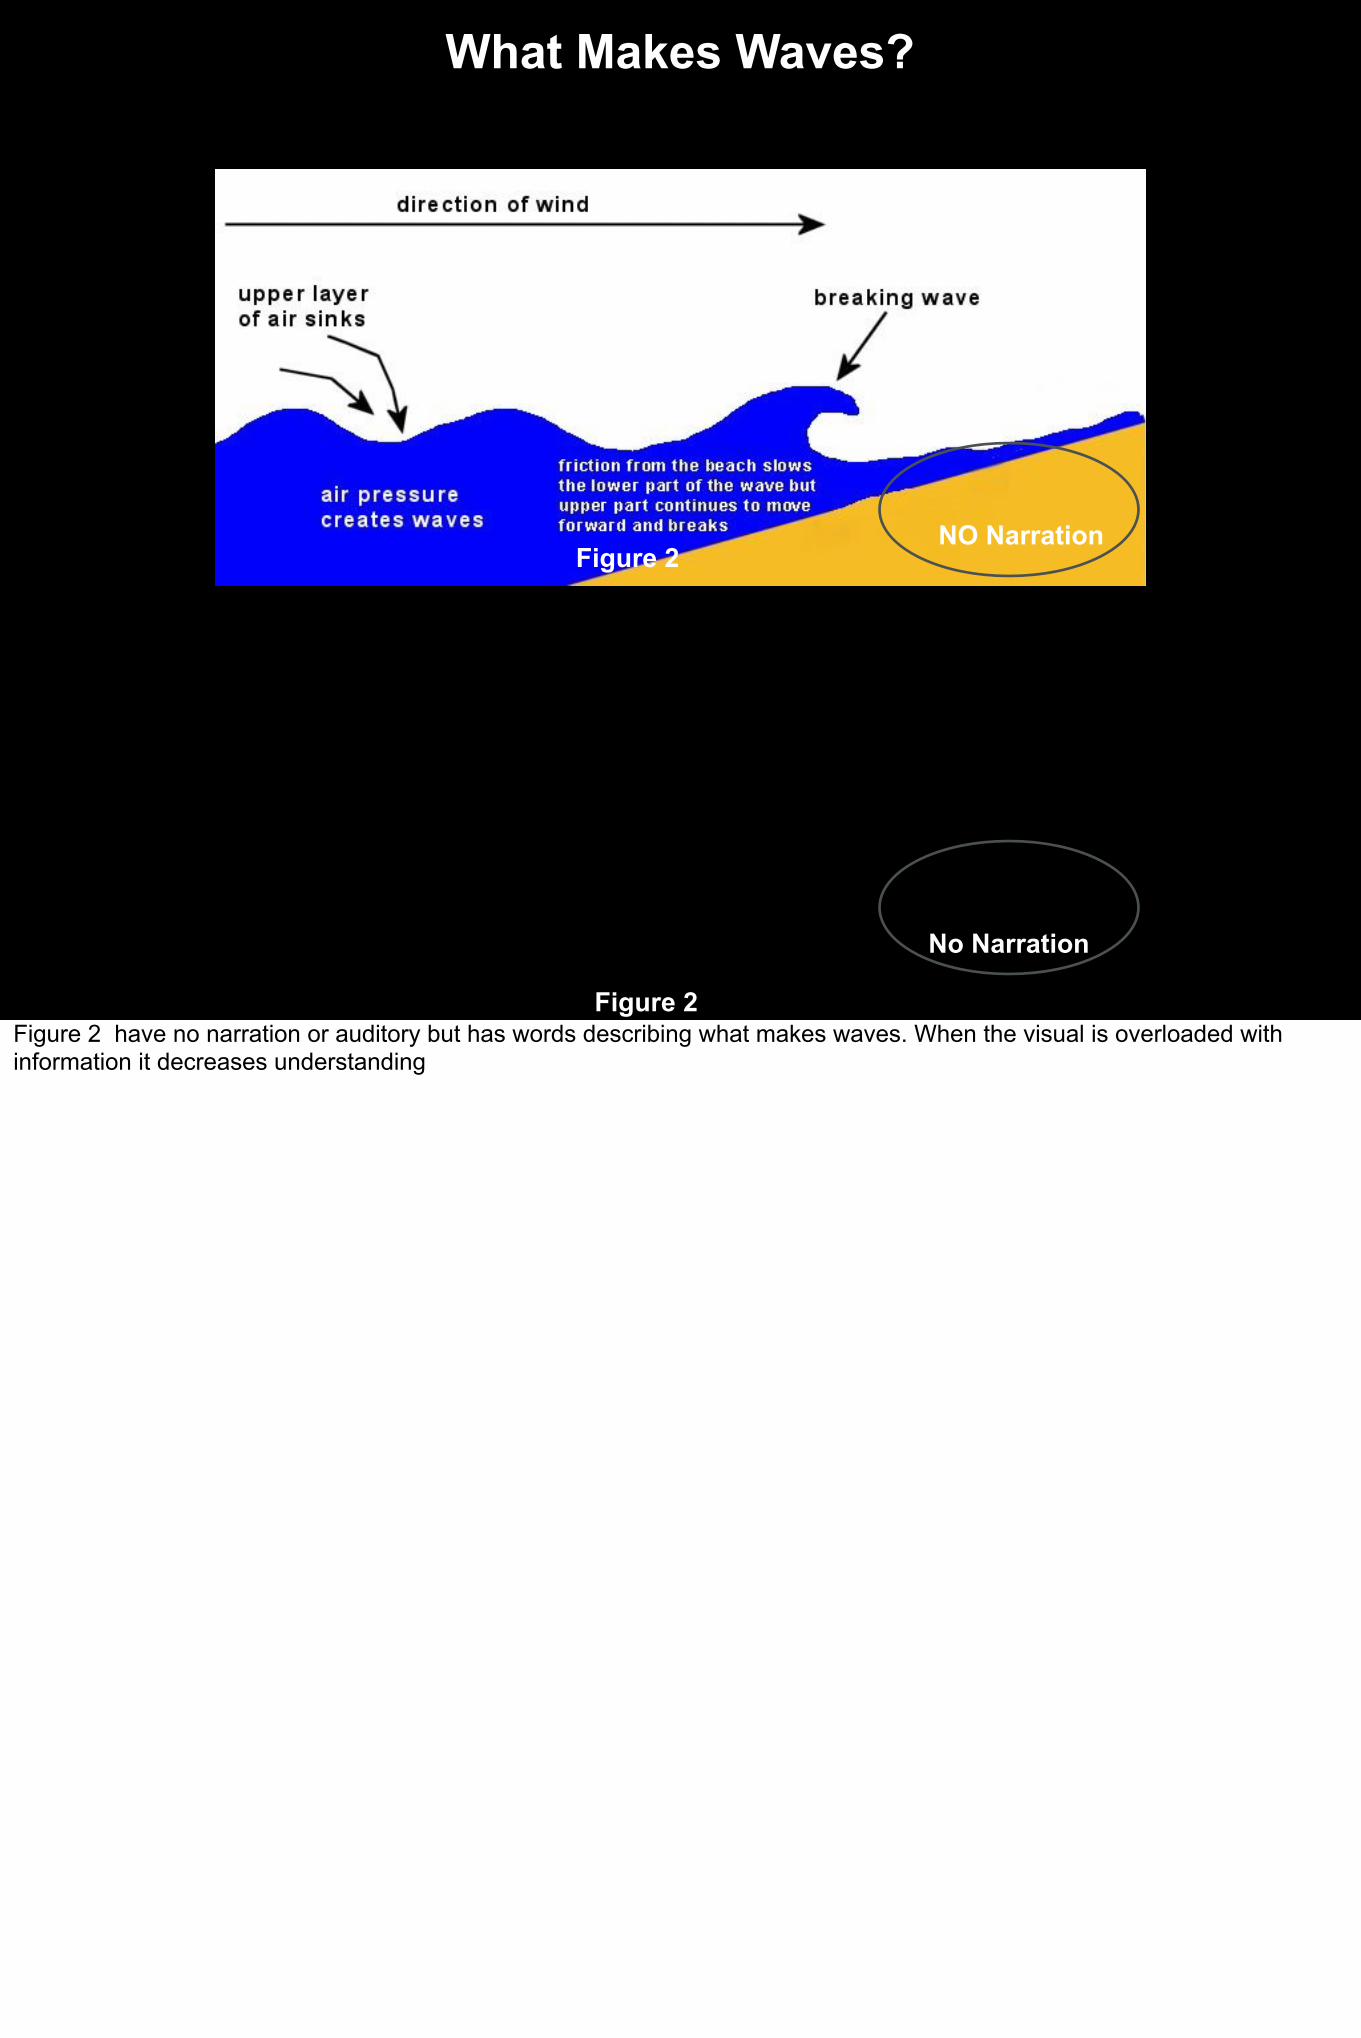
Figure 2
Figure 2
No Narration
What Makes Waves?
NO Narration
Figure 2 have no narration or auditory but has words describing what makes waves. When the visual is overloaded with information it decreases understanding
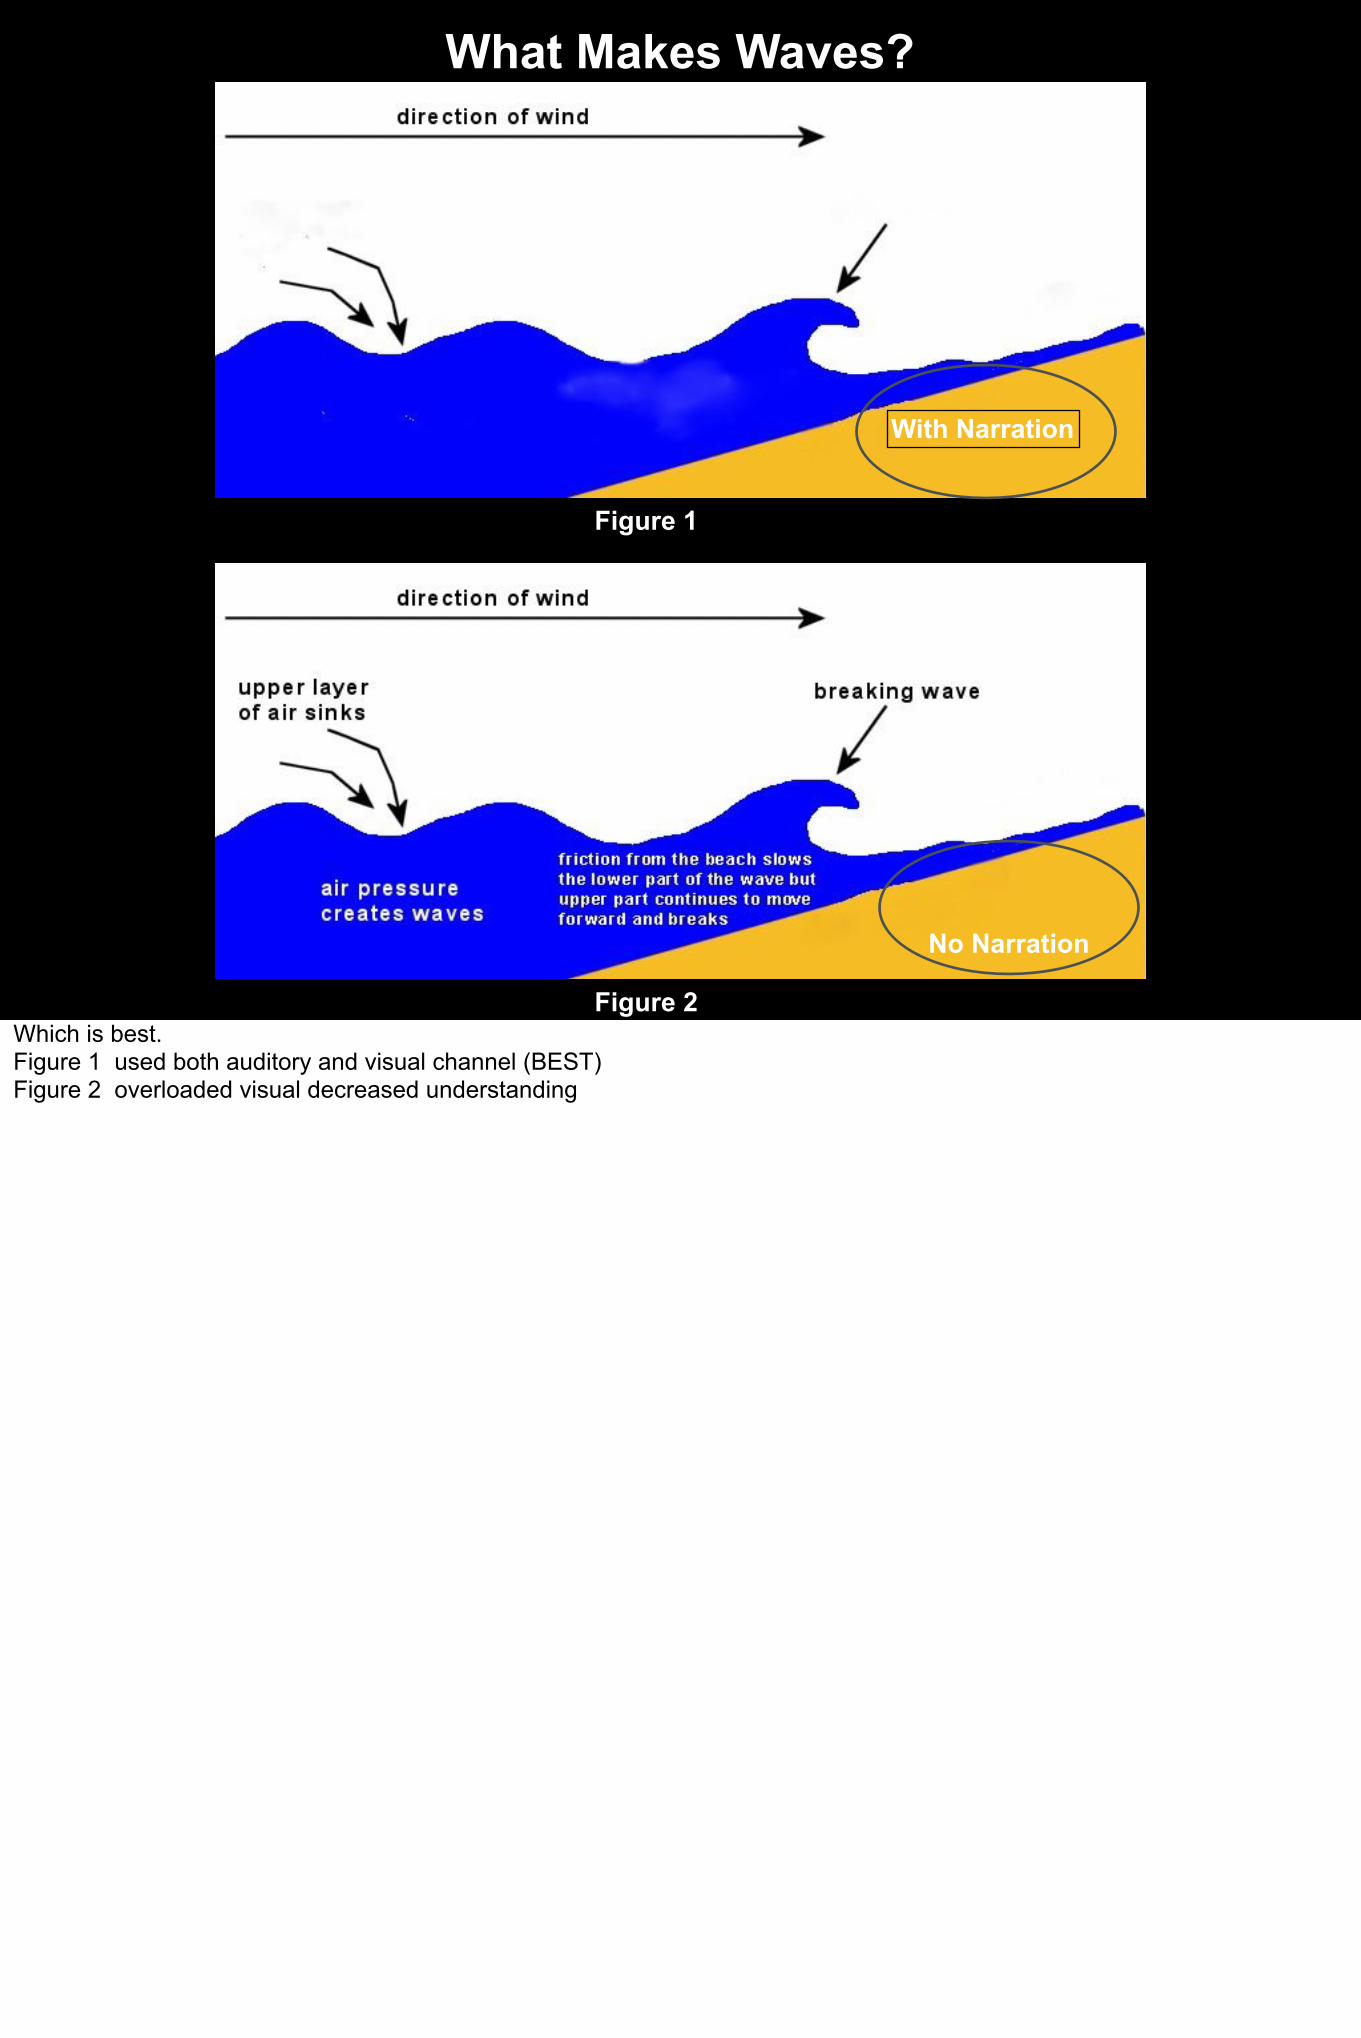
Figure 2
Figure 1
With Narration
No Narration
What Makes Waves?
Which is best. Figure 1 used both auditory and visual channel (BEST)Figure 2 overloaded visual decreased understanding

Figure 3
Figure 1
With Narration
With Narration
What Makes Waves?
Figure 3 Already overloaded visual made even worse by adding auditory.
When you say or repeat what words that are on the screen, the mind reads and compares what it sees vs what you are saying instead of learning the content

Videos
v
© 2011 MikeOlbinski.com
Dust storm video
© TV Globo
Water Rescue Video
She survived. We can only hope her dog did too. *References Doctors Without Borders, “Brazil Floods: MSF Responds to Mud Slides,” January 17, 2011. http://www.msf.org.uk/Brazilian_floods_20110117.news
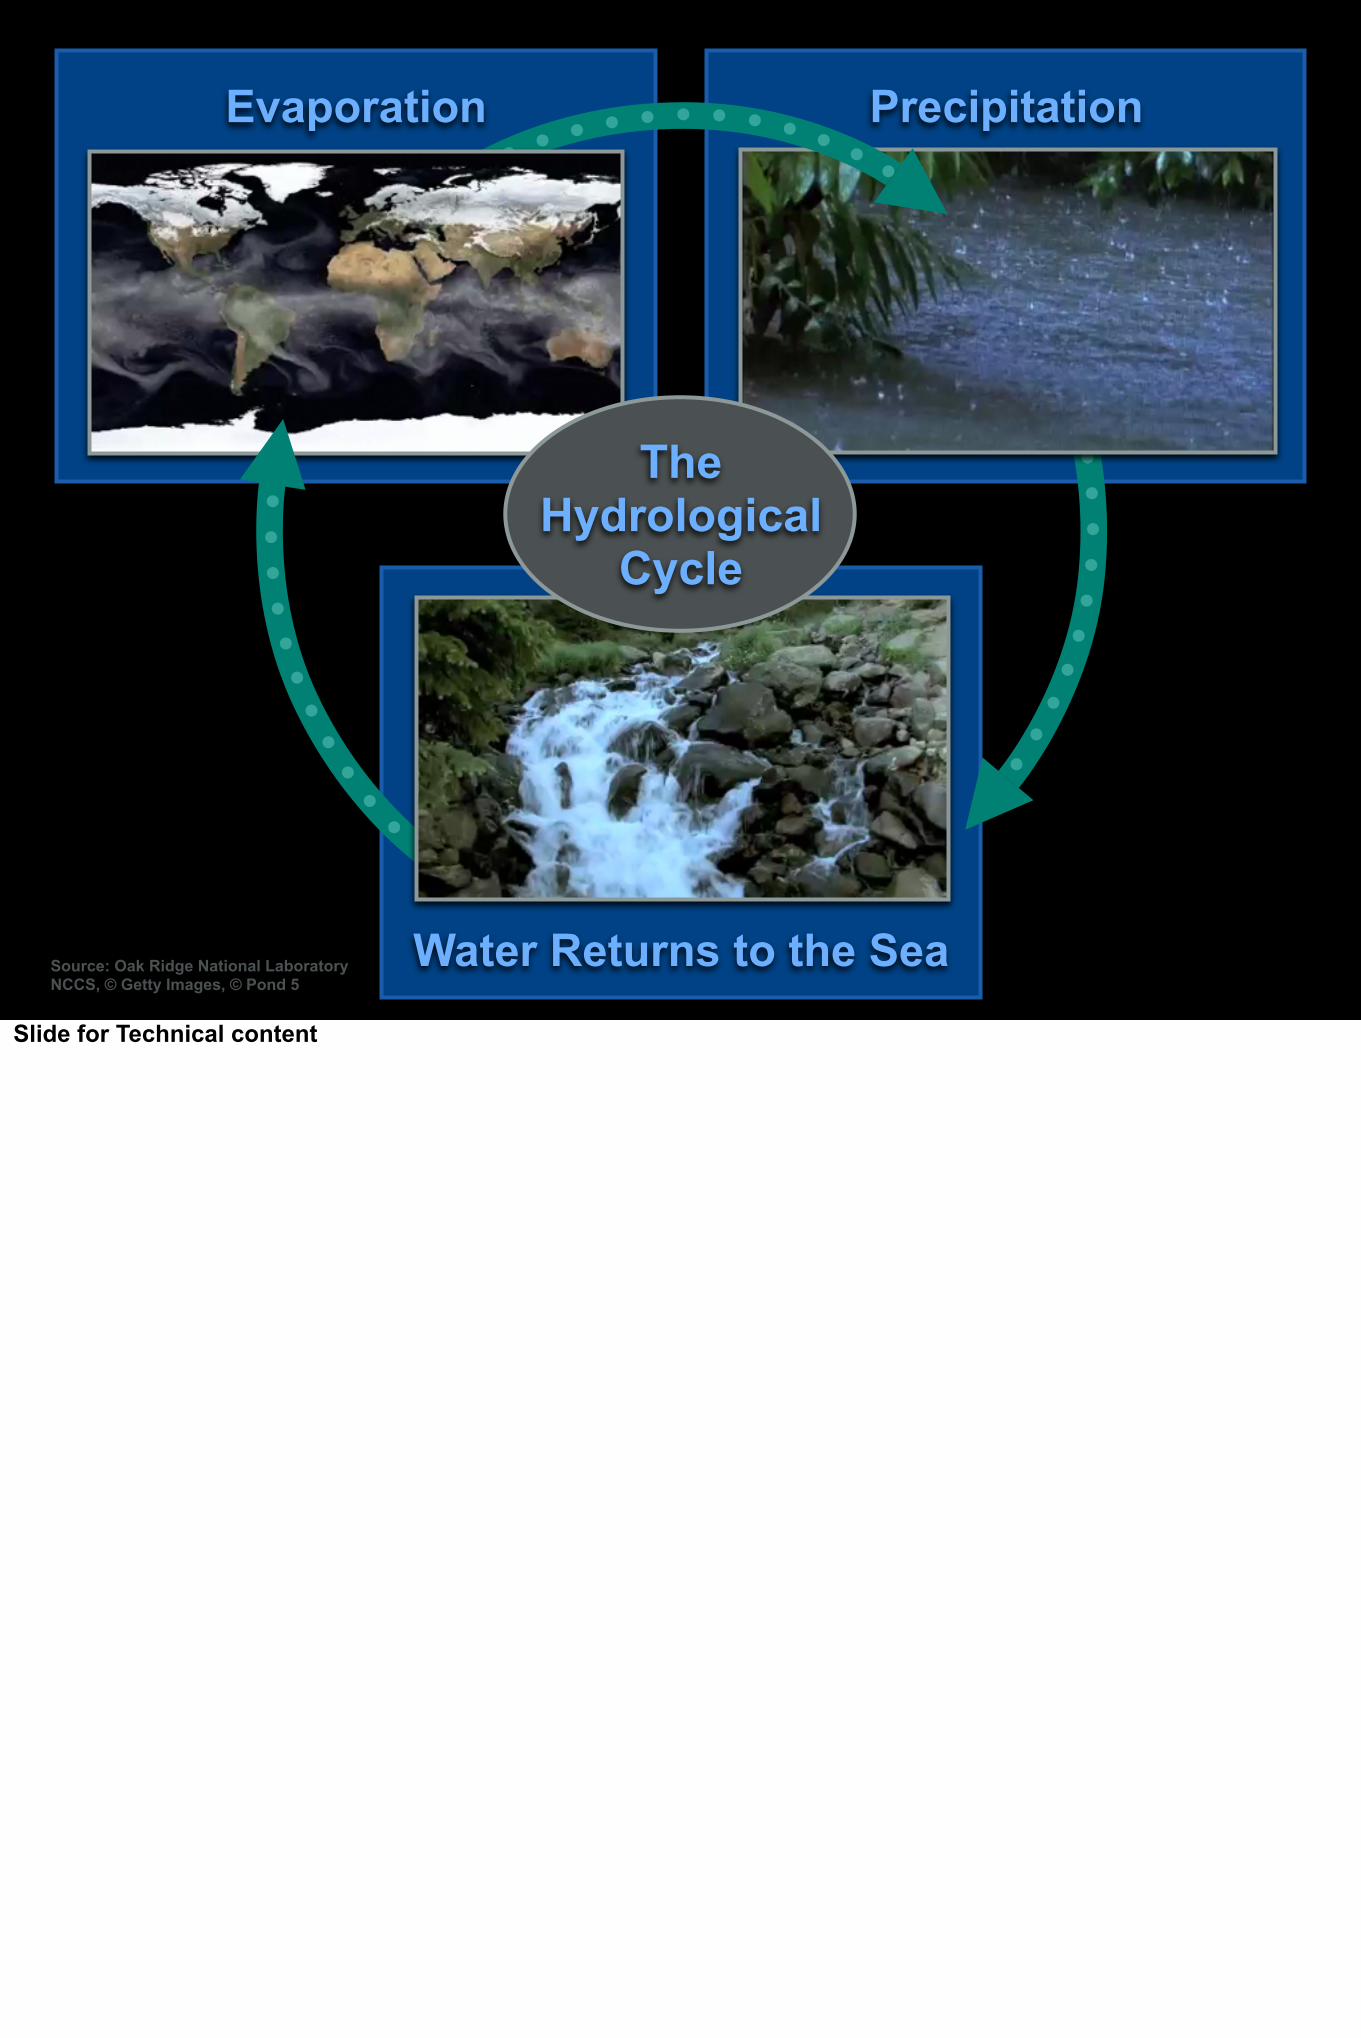
Evaporation Precipitation
Water Returns to the Sea
TheHydrological
Cycle
Source: Oak Ridge National Laboratory NCCS, © Getty Images, © Pond 5
Slide for Technical content
Statistics and Graphs
Many ways to get statistics across
July was the hottest Month on record in the U.S.
Ever
OR
CAUT
NV
AZ
MT
WY
CO
NM
ND
KS
SD
NE
OK
TX
MN
WI
IL
TN
MI
KY
LA
AR
AL
MO
MS
SC
FL
GA
NC
VAWV
OH
NY
NJ
ME
MA
IA
MDIN
PA
CT RI
DE
VTNH
WA
ID
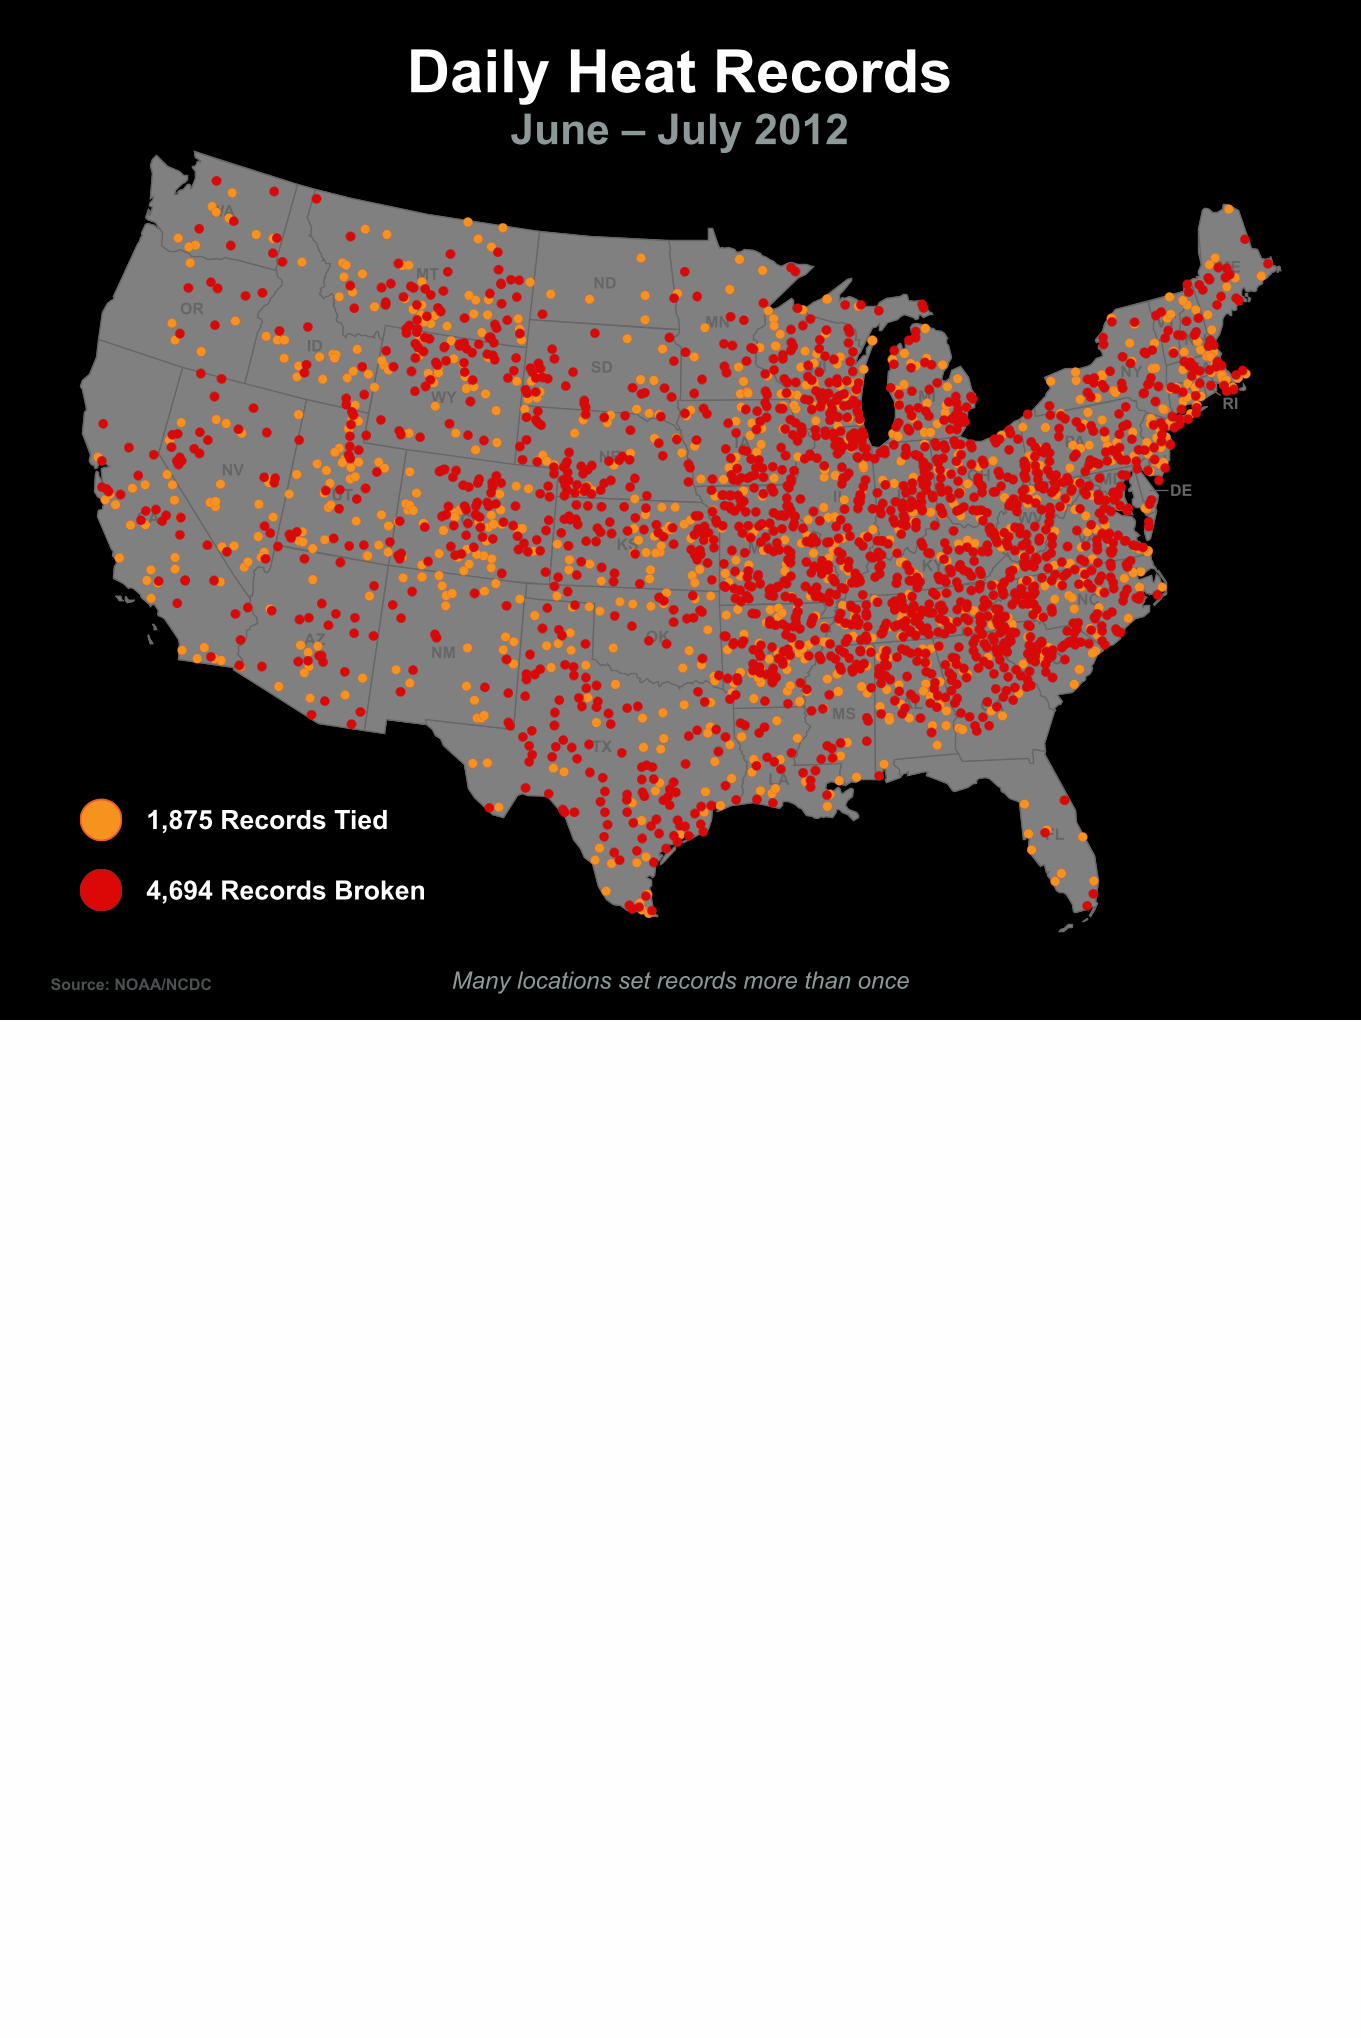
Daily Heat RecordsJune – July 2012
Source: NOAA/NCDC
1,875 Records Tied
4,694 Records Broken
Many locations set records more than once
© 2011 AP Photo/Erwin Mascarinas
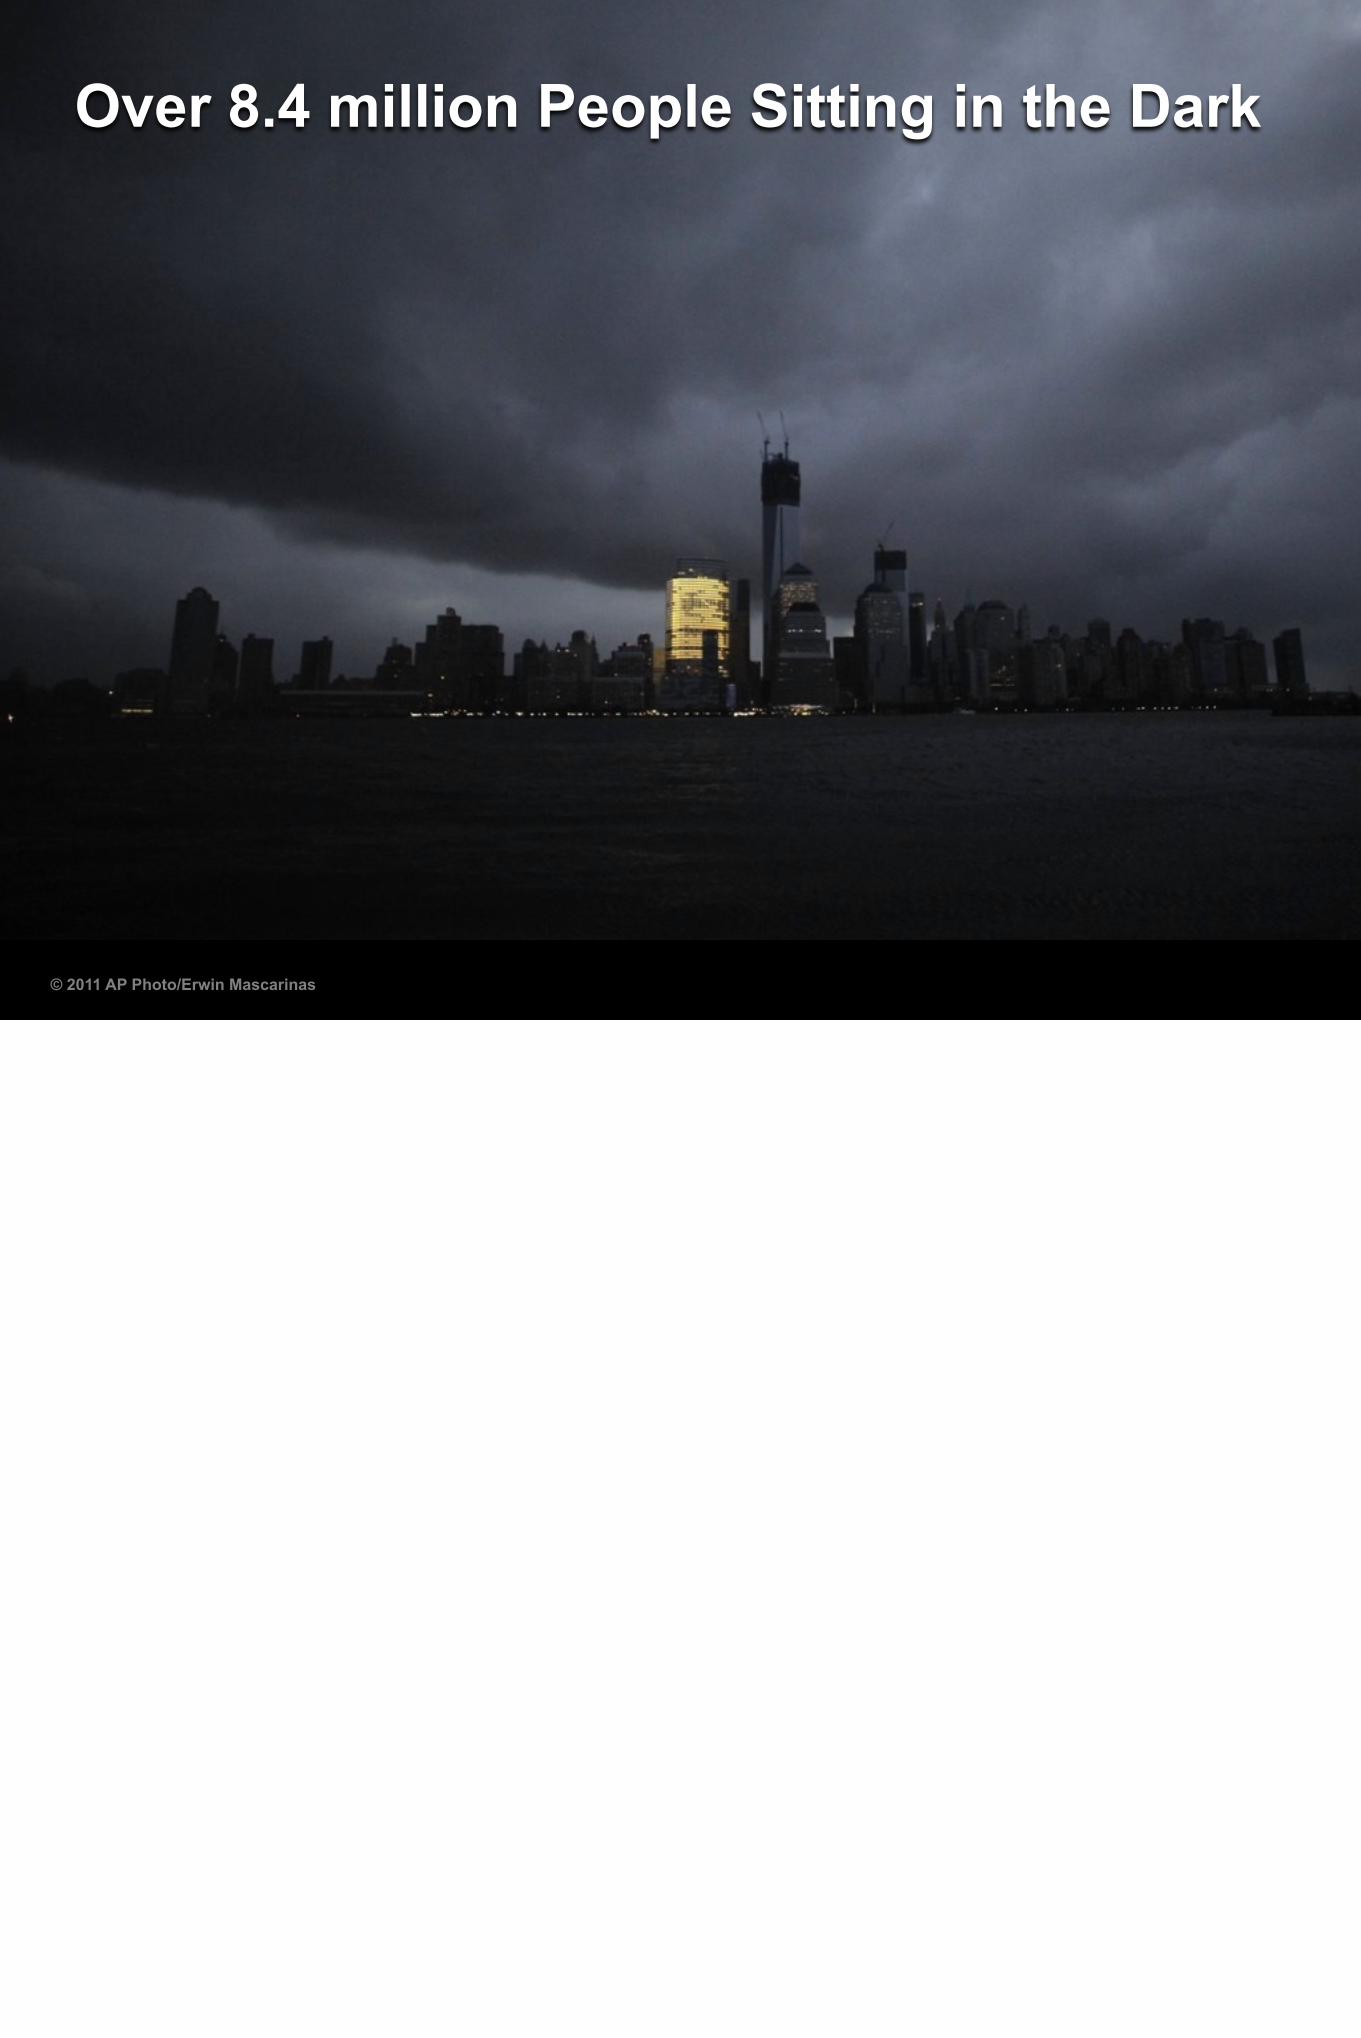
Over 8.4 million People Sitting in the Dark
© 2011 AP Photo/Erwin Mascarinas
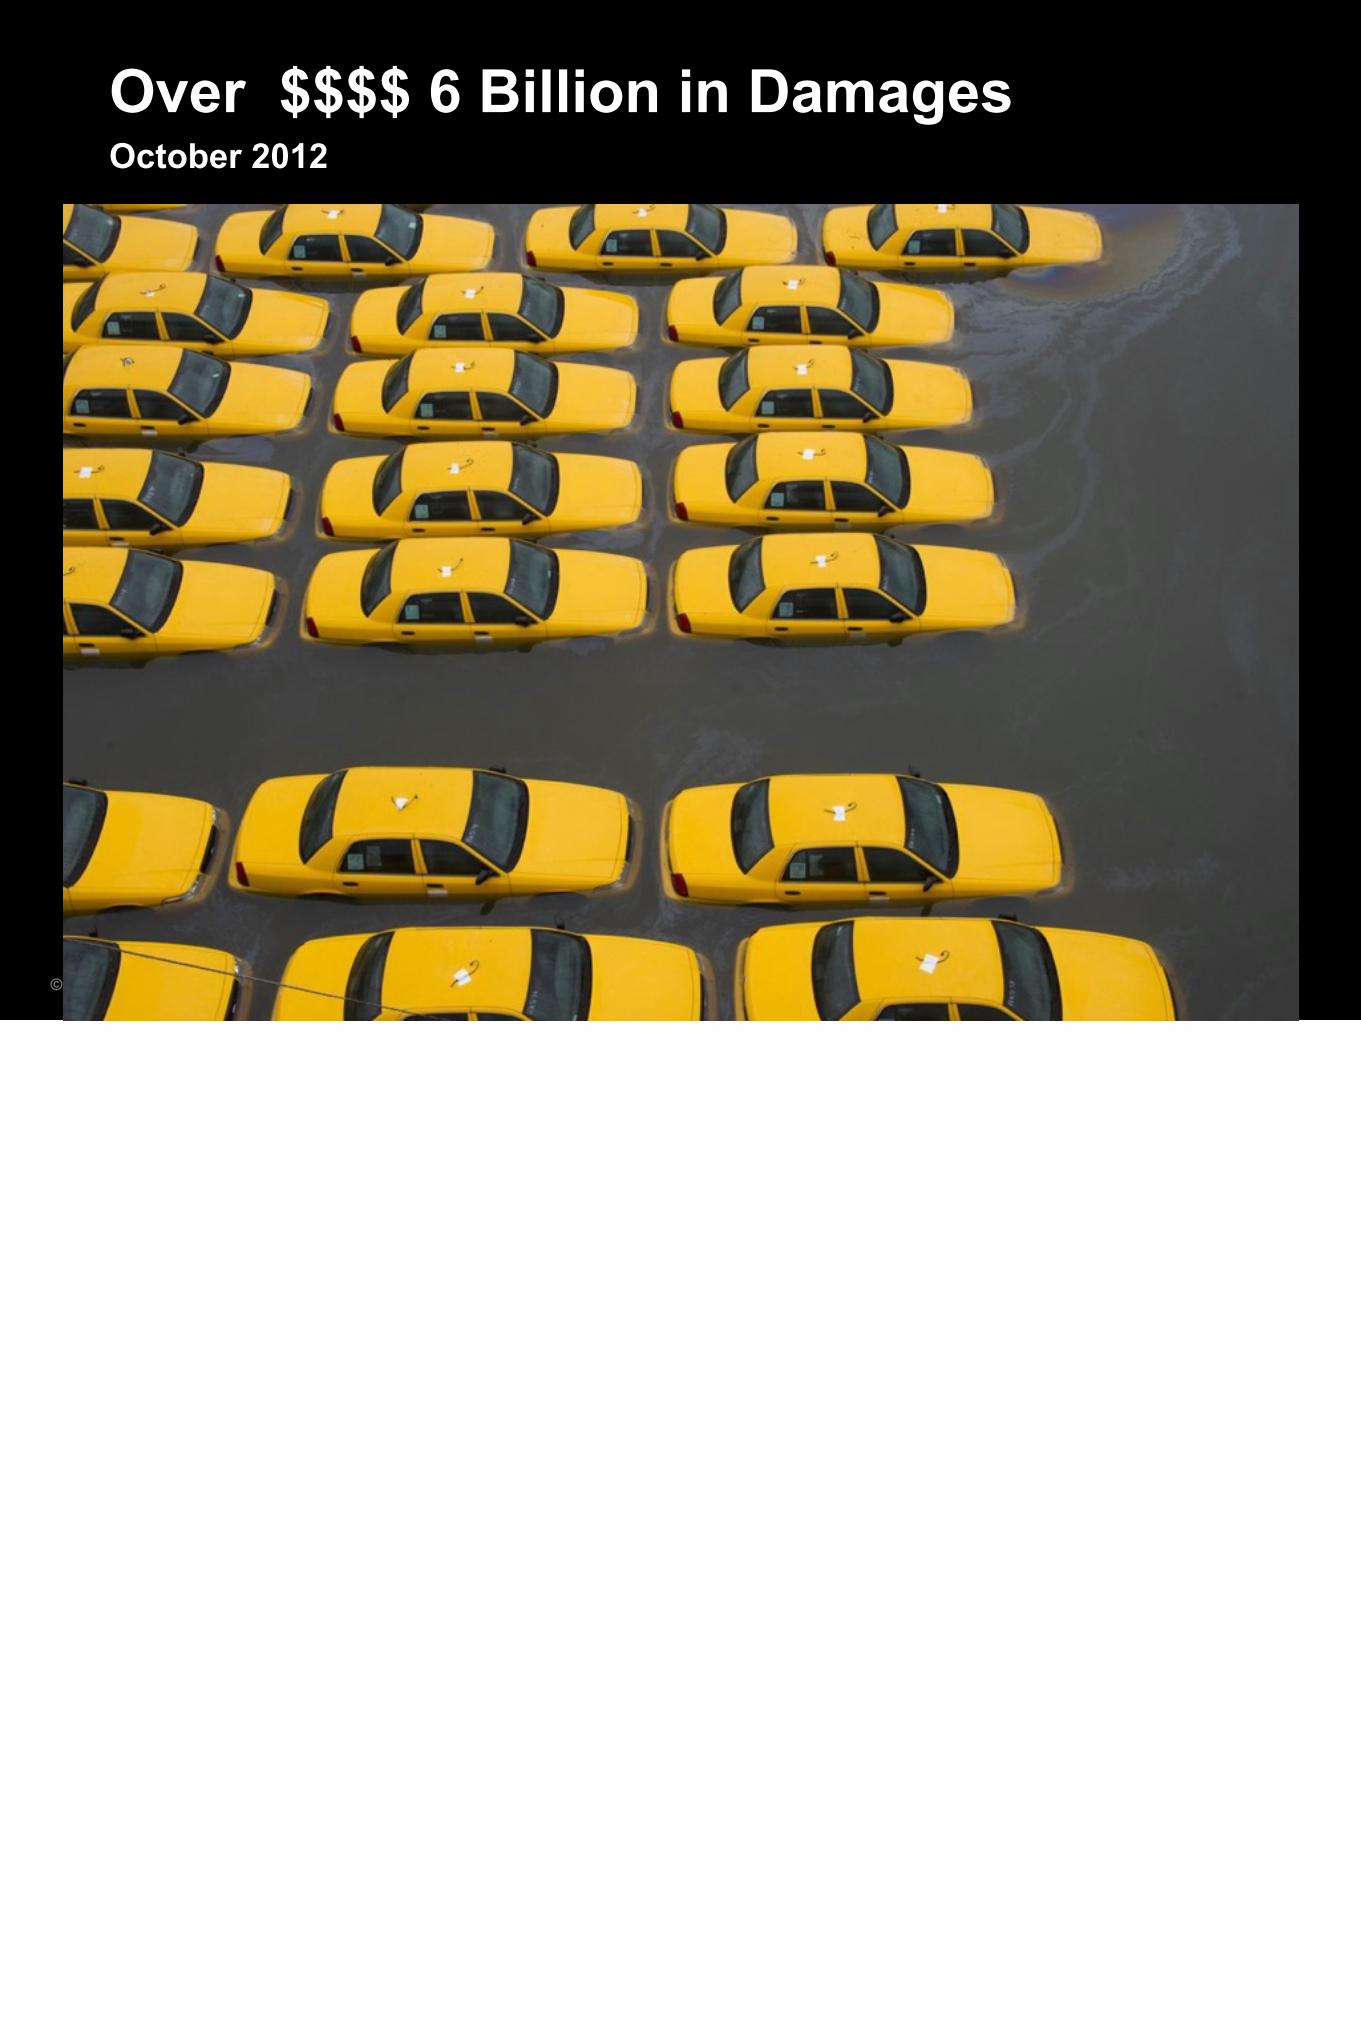
Over $$$$ 6 Billion in Damages October 2012
© 2010 Sean R. Heavey
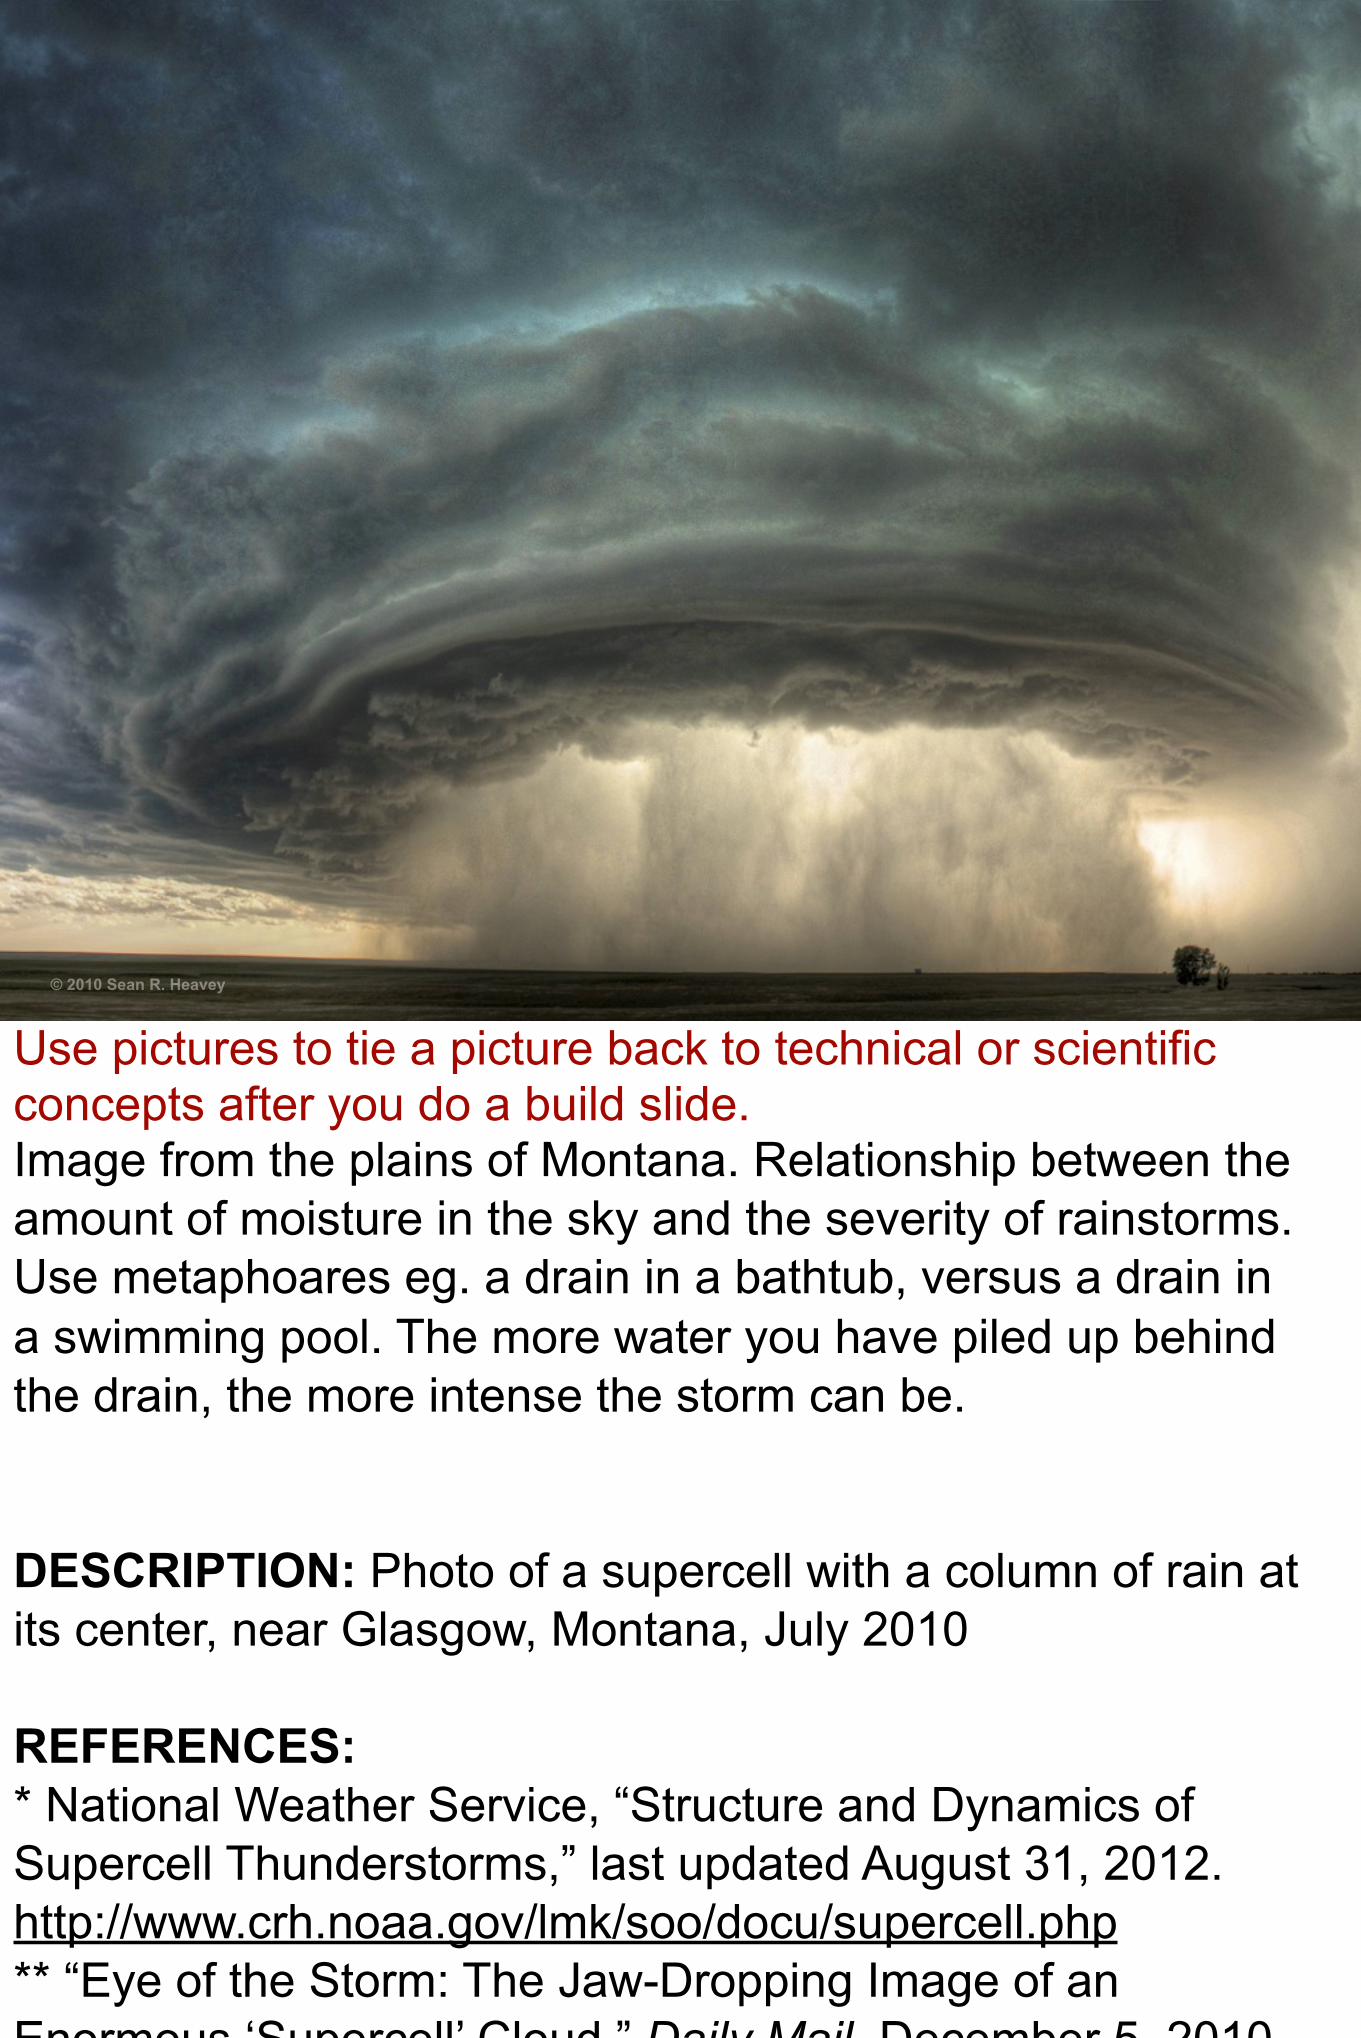
Use pictures to tie a picture back to technical or scientific concepts after you do a build slide. Image from the plains of Montana. Relationship between the amount of moisture in the sky and the severity of rainstorms. Use metaphoares eg. a drain in a bathtub, versus a drain in a swimming pool. The more water you have piled up behind the drain, the more intense the storm can be.
DESCRIPTION: Photo of a supercell with a column of rain at its center, near Glasgow, Montana, July 2010
REFERENCES:* National Weather Service, “Structure and Dynamics of Supercell Thunderstorms,” last updated August 31, 2012. http://www.crh.noaa.gov/lmk/soo/docu/supercell.php ** “Eye of the Storm: The Jaw-Dropping Image of an Enormous ‘Supercell’ Cloud,” Daily Mail, December 5, 2010. http://www.dailymail.co.uk/sciencetech/article-1334672/Jaw-dropping-image-enormous-supercell-cloud-Glasgow-Montana.html#ixzz177N0KRiT*** Jason Samenow, “Mostly Cloudy: Linking Climate Change to Severe Storms in the U.S.,” The Washington Post, August 13, 2012. http://www.washingtonpost.com/blogs/capital-weather-gang/post/mostly-cloudy-linking-climate-change-to-severe-storms-in-the-us/2012/08/13/731c46e0-e558-11e1-936a-b801f1abab19_blog.html **** T. Karl et al., eds., Weather and Climate Extremes in a Changing Climate. Regions of Focus: North America, Hawaii, Caribbean, and U.S. Pacific Islands (U.S. Climate Change Science Program and the Subcommittee on Global Change Research, June 2008). http://downloads.climatescience.gov/sap/sap3-3/sap3-3-final-all.pdf
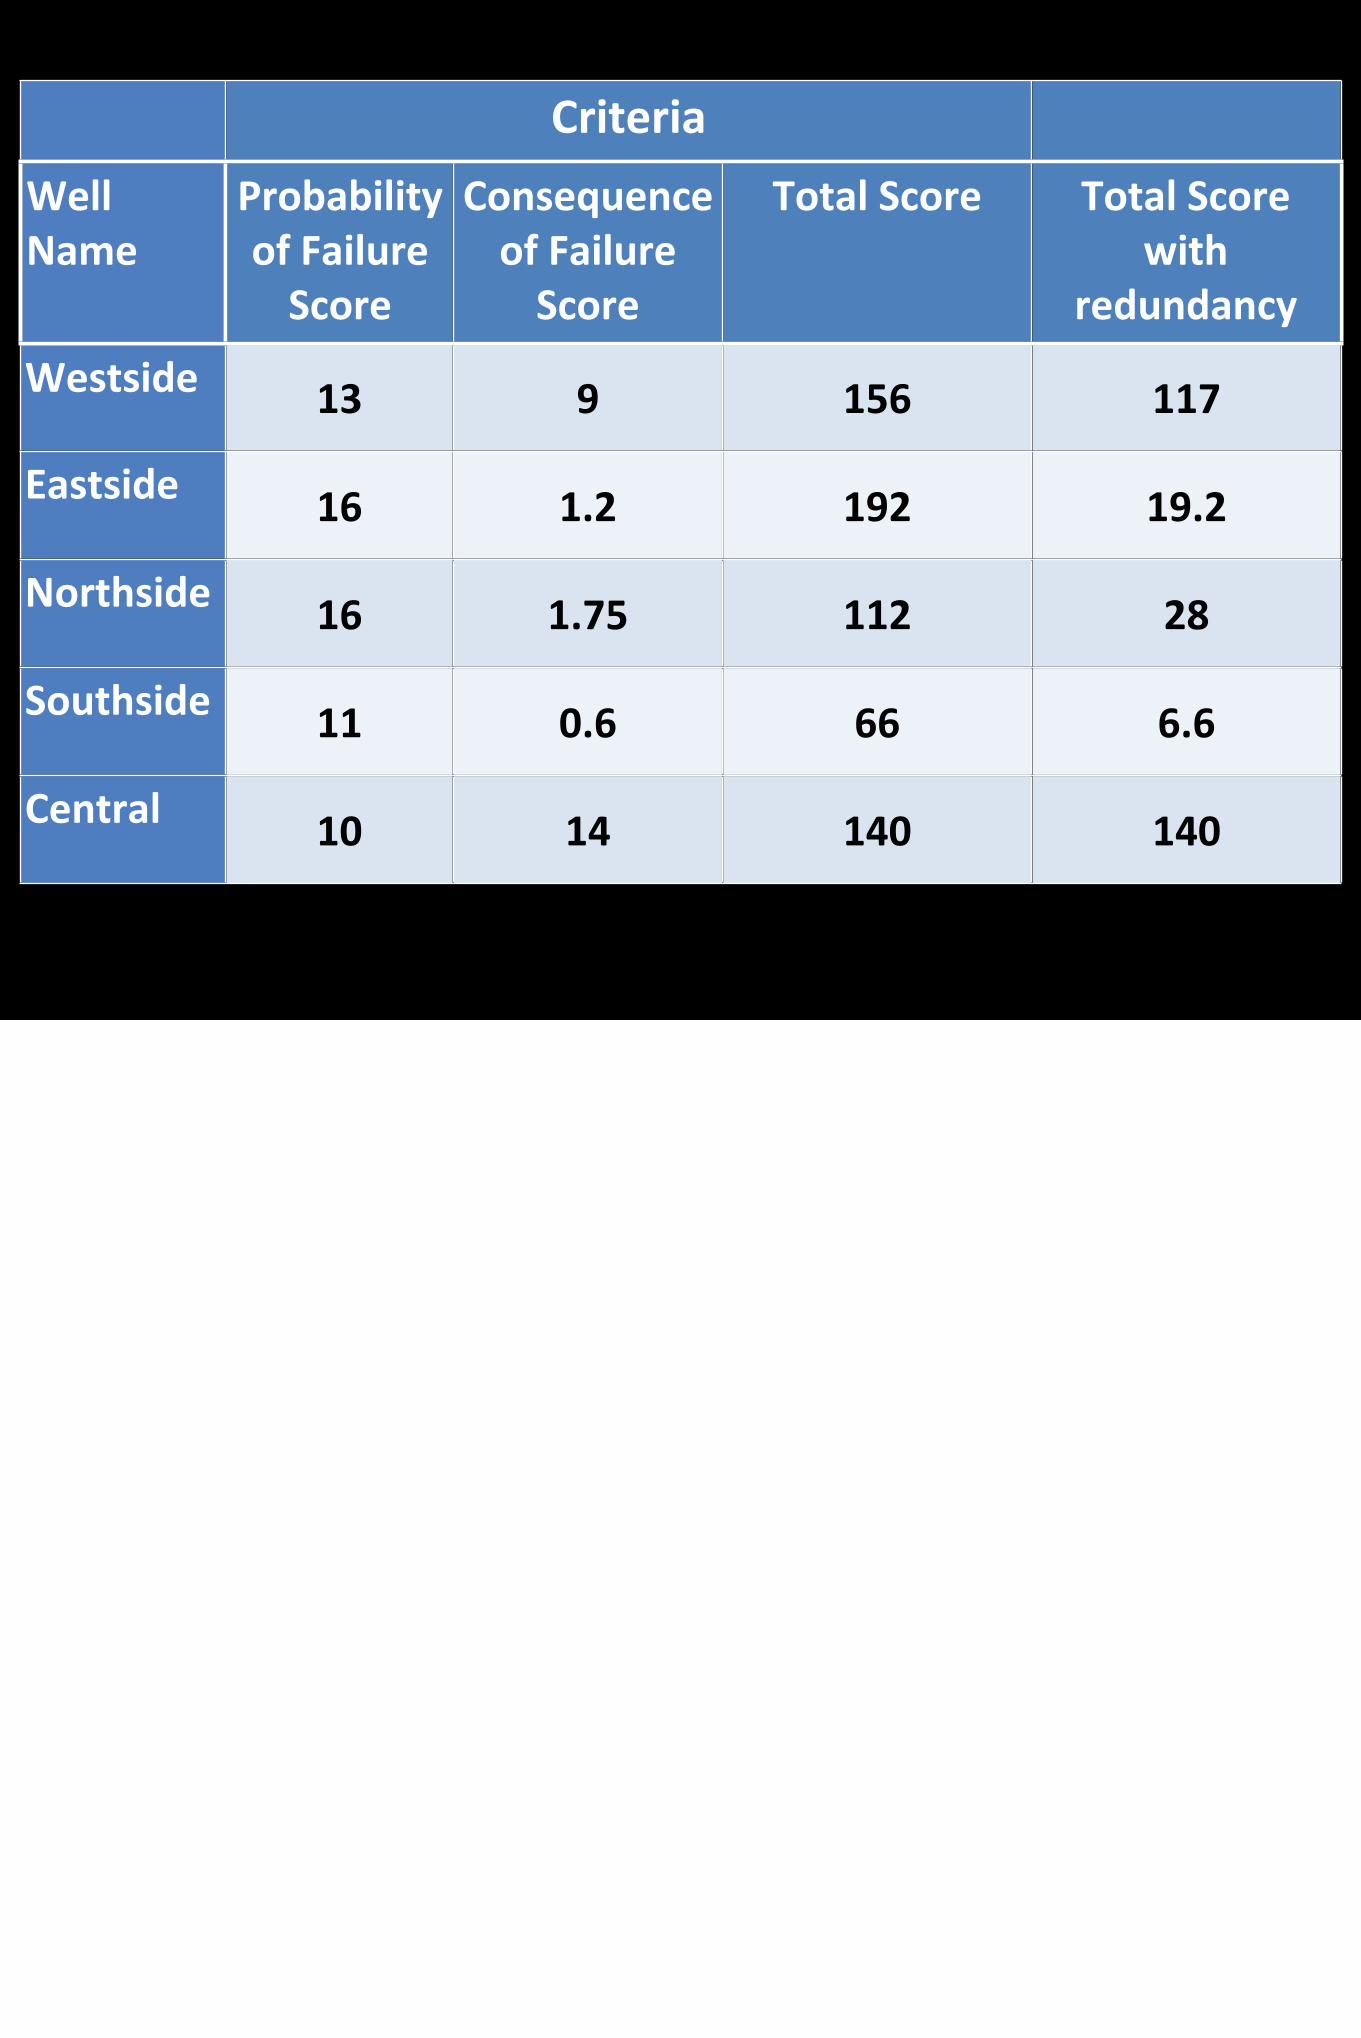
Well Probability of FailureCriteriaCriteriaCriteria Well Name
Probability of Failure Score
Consequence of Failure Score
Total Score Total Score with
redundancy
Westside 13 9 156 117
Eastside 16 1.2 192 19.2
Northside 16 1.75 112 28
Southside 11 0.6 66 6.6
Central 10 14 140 140
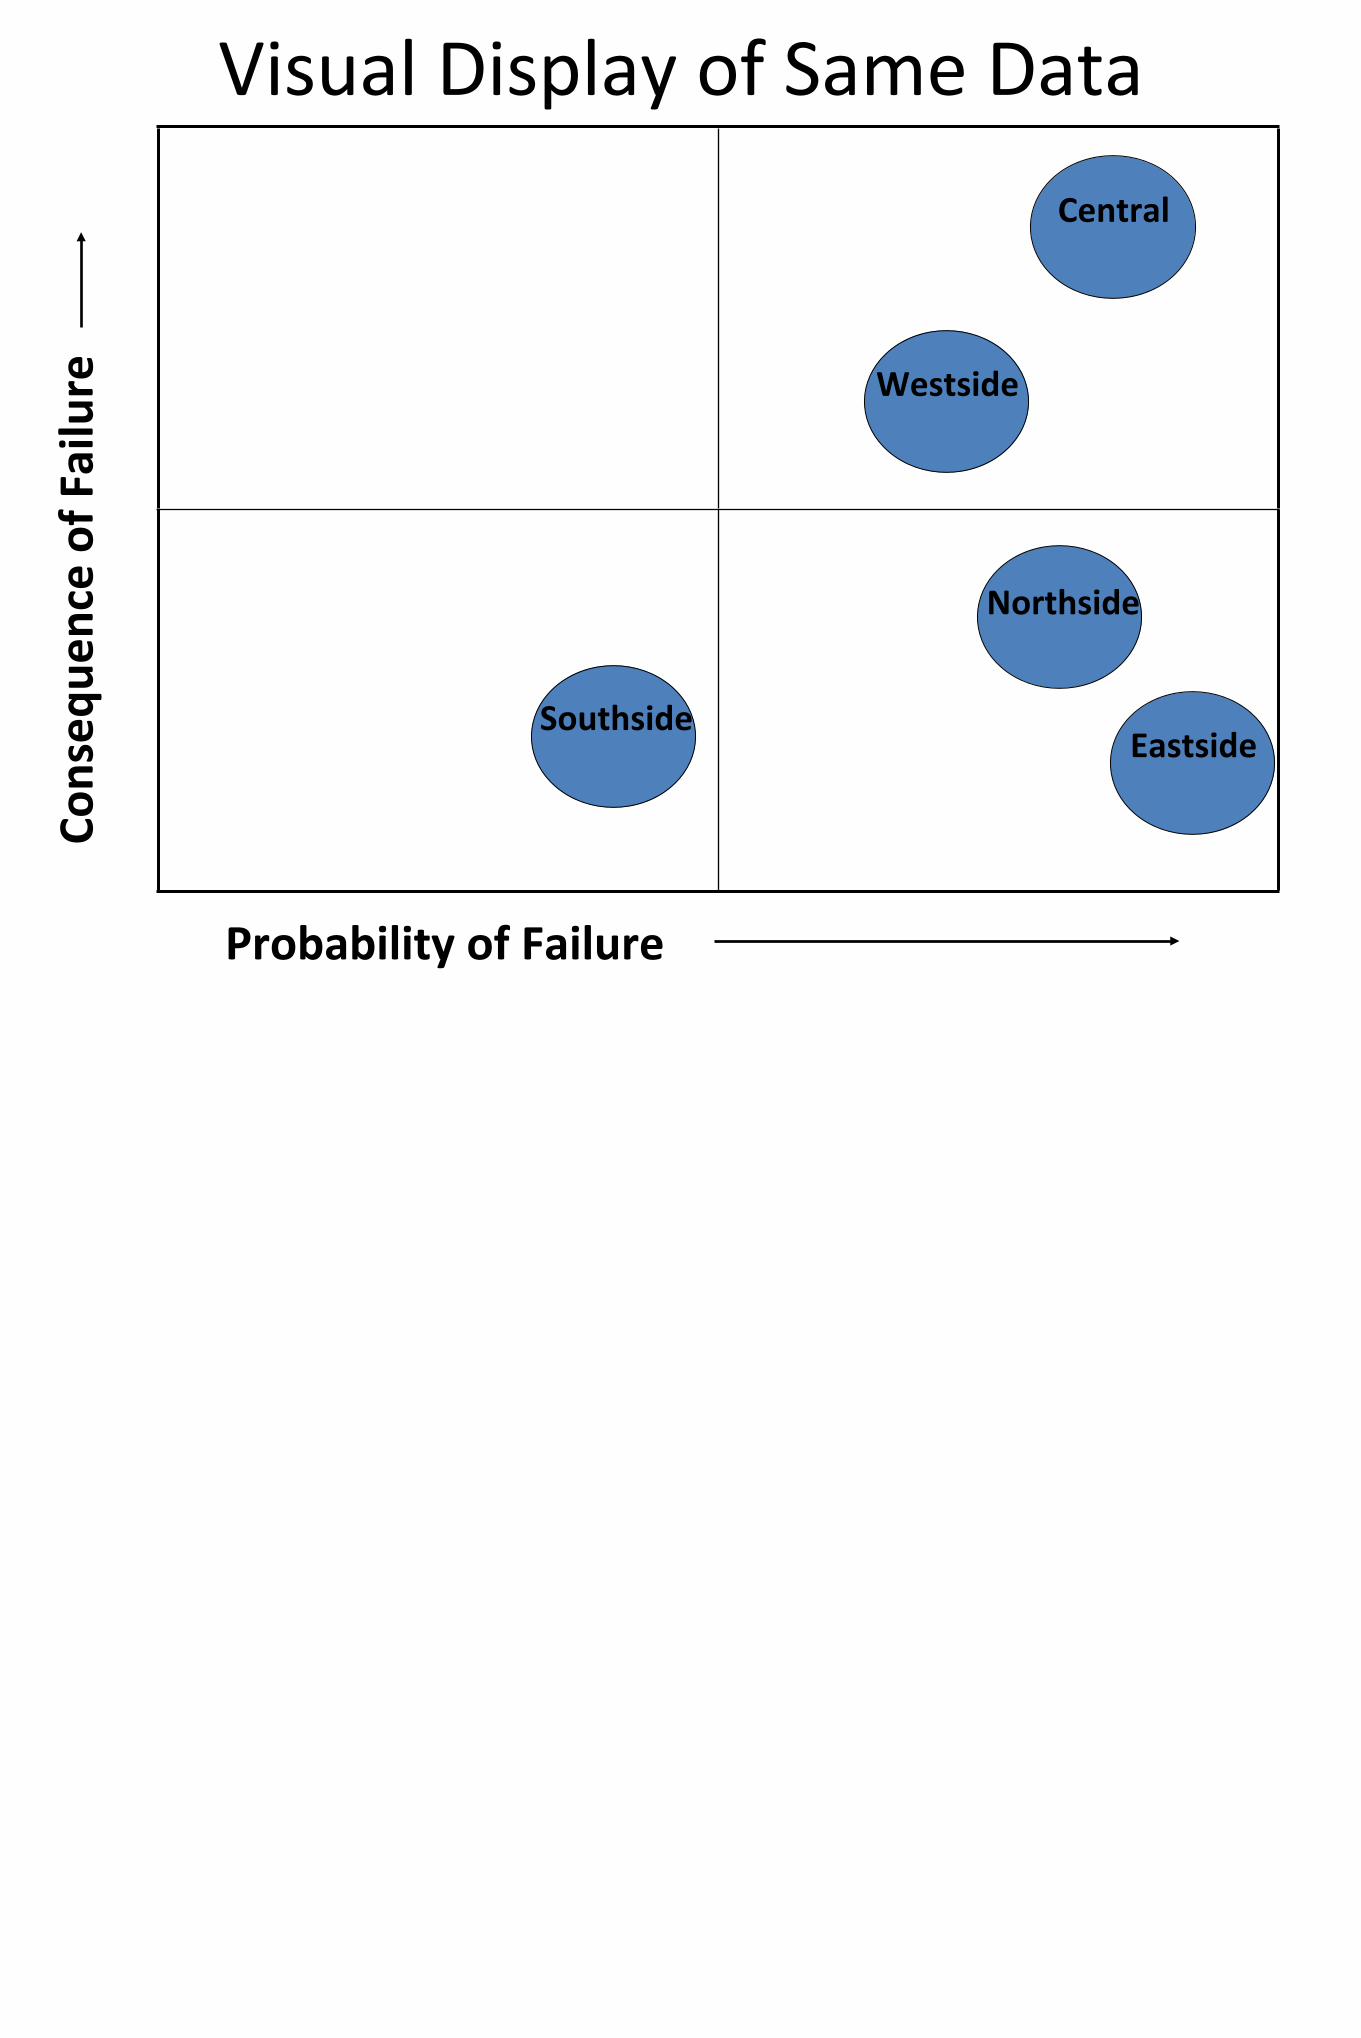
Conseq
uence of Failure
Probability of Failure
Visual Display of Same Data
Westside
Central
SouthsideEastside
Northside
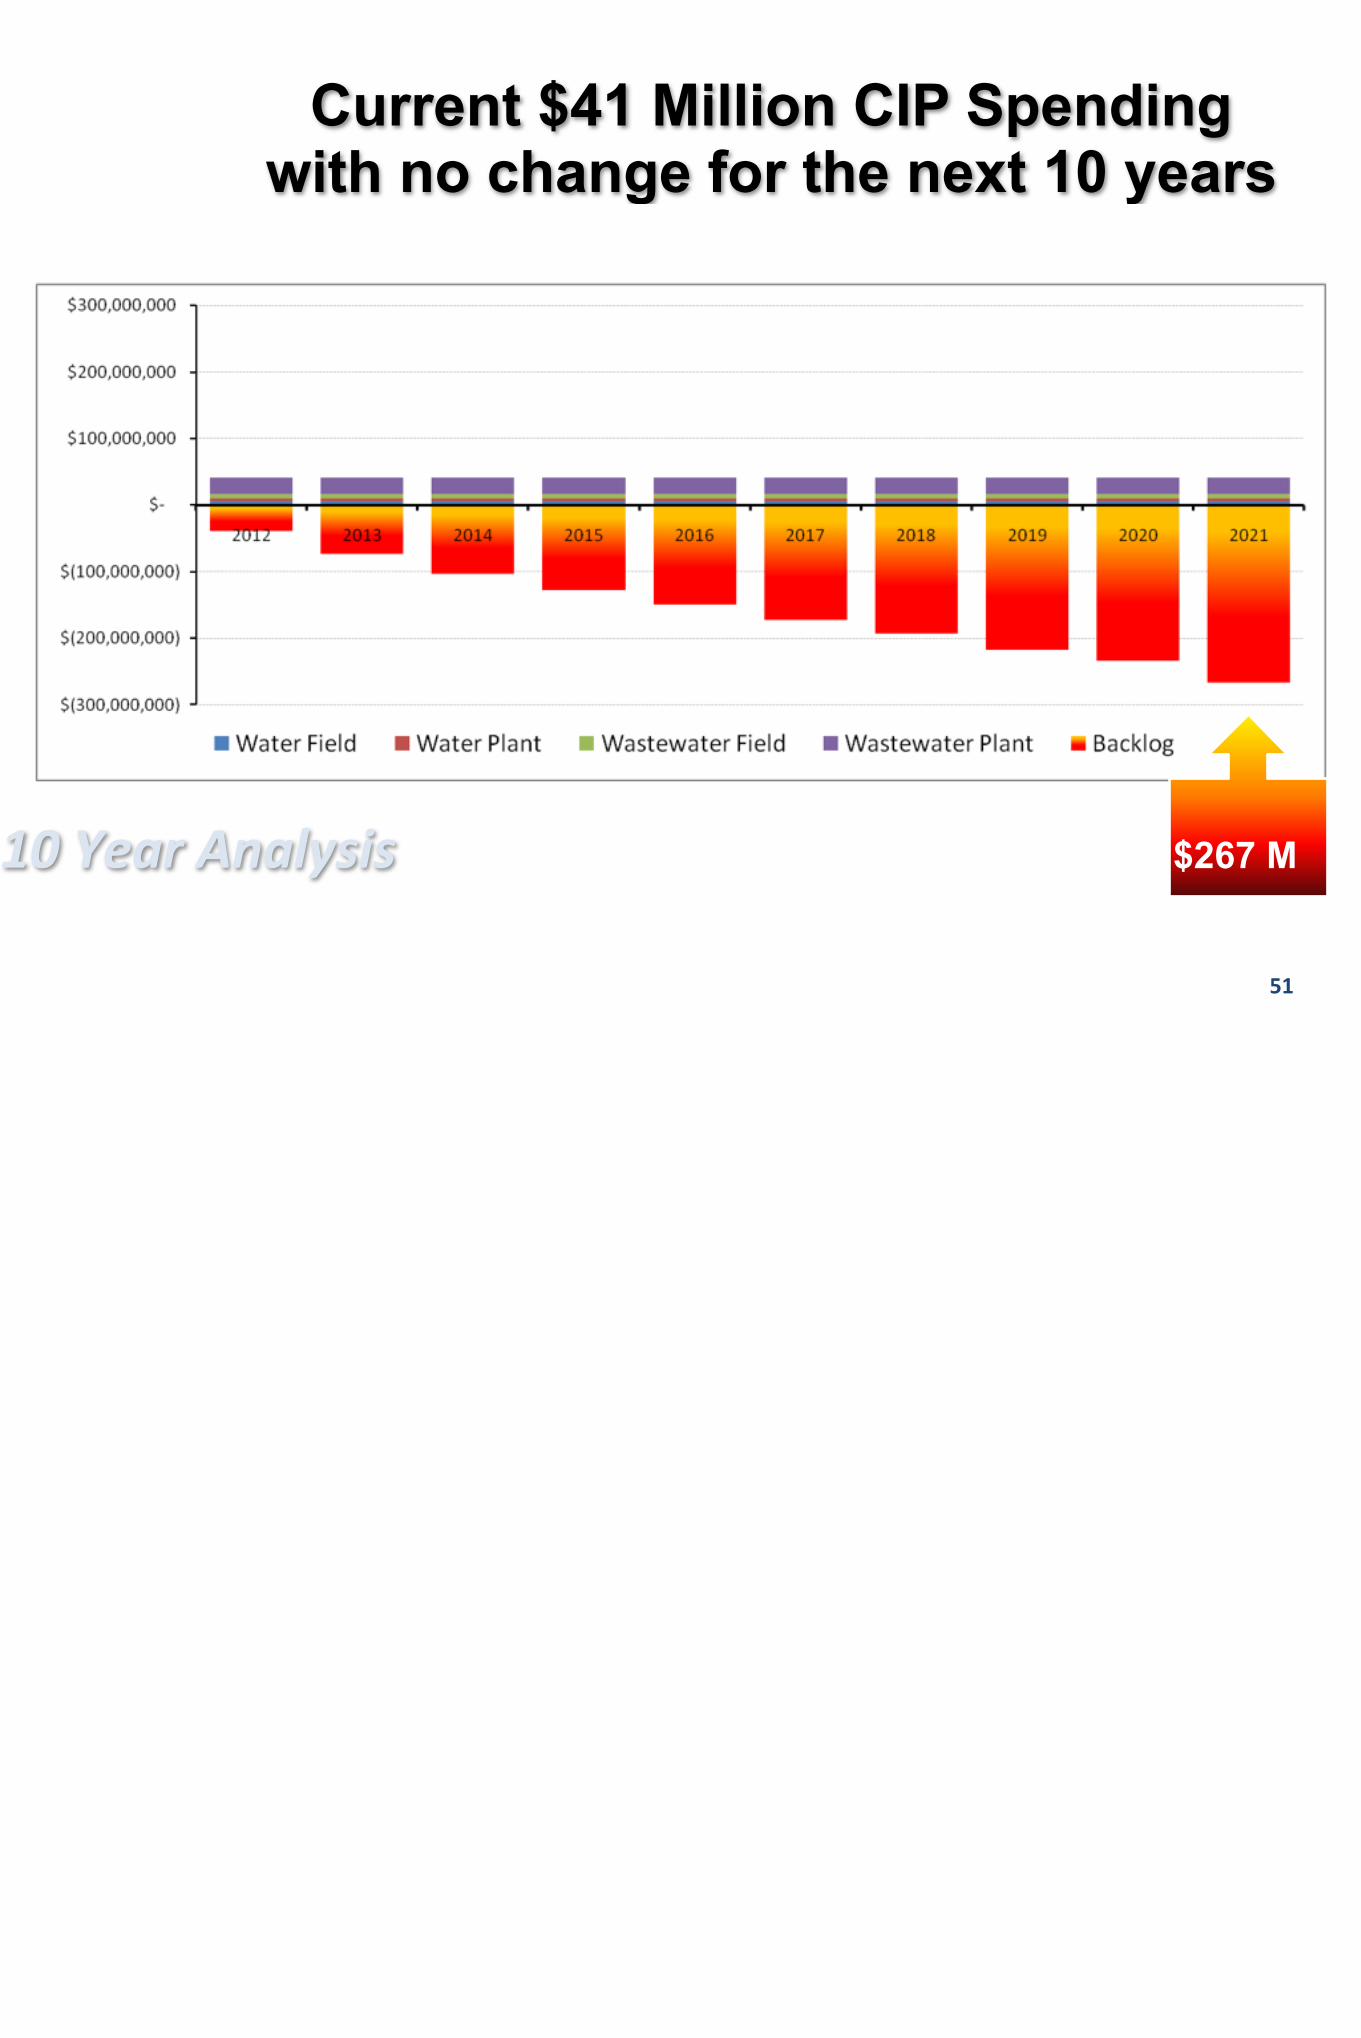
Current $41 Million CIP Spendingwith no change for the next 10 years
10 Year Analysis $267 M
51
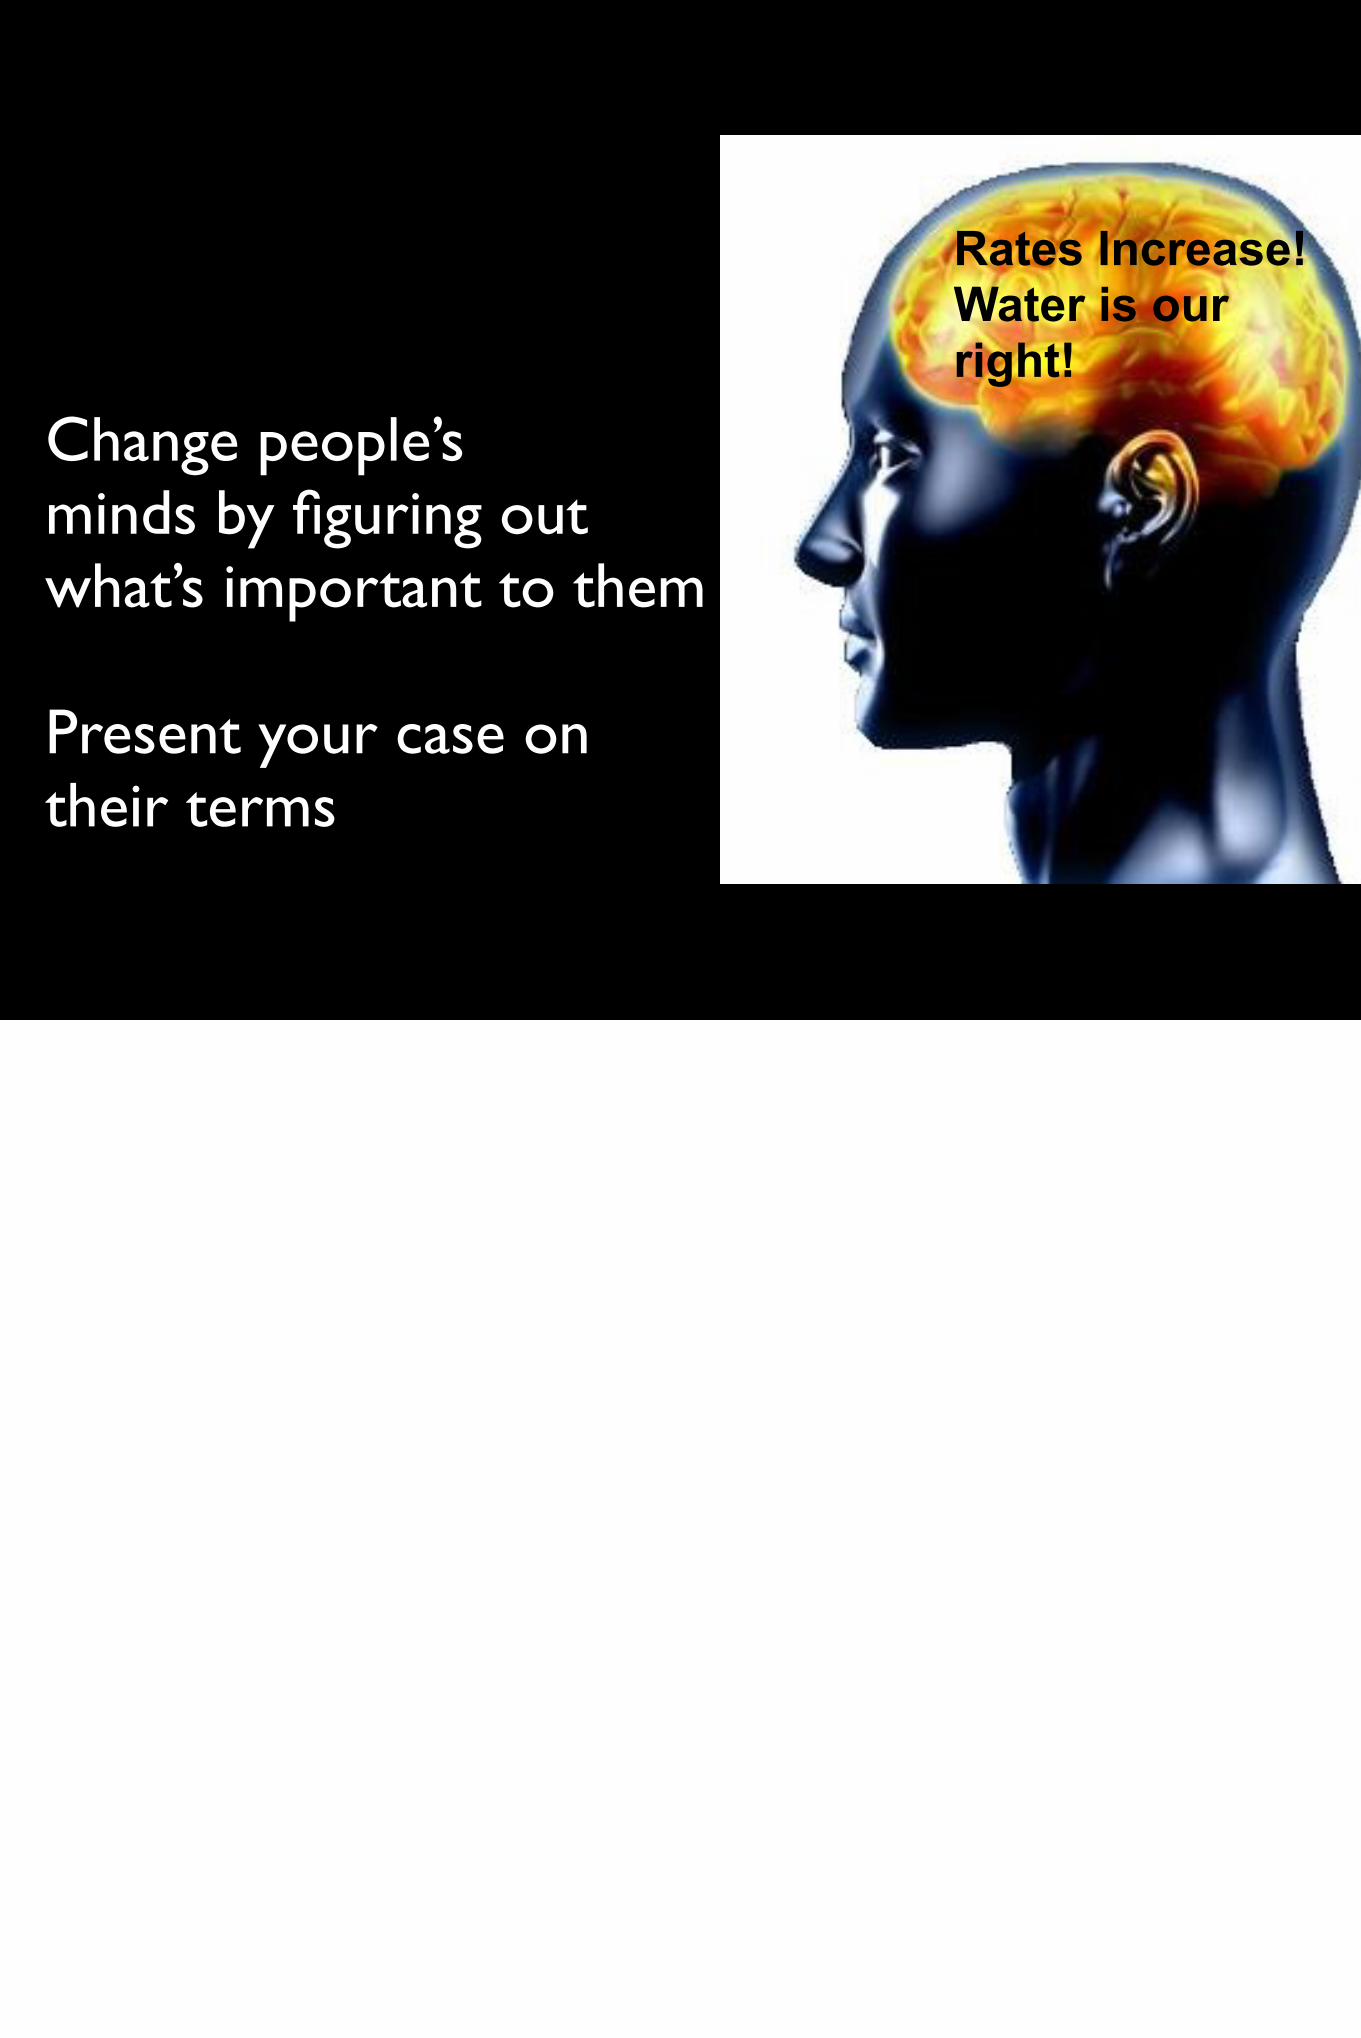
Text
Change people’s minds by figuring out what’s important to them
Present your case on their terms
Rates Increase! Water is our right!

Our Infrastructure Is Aging

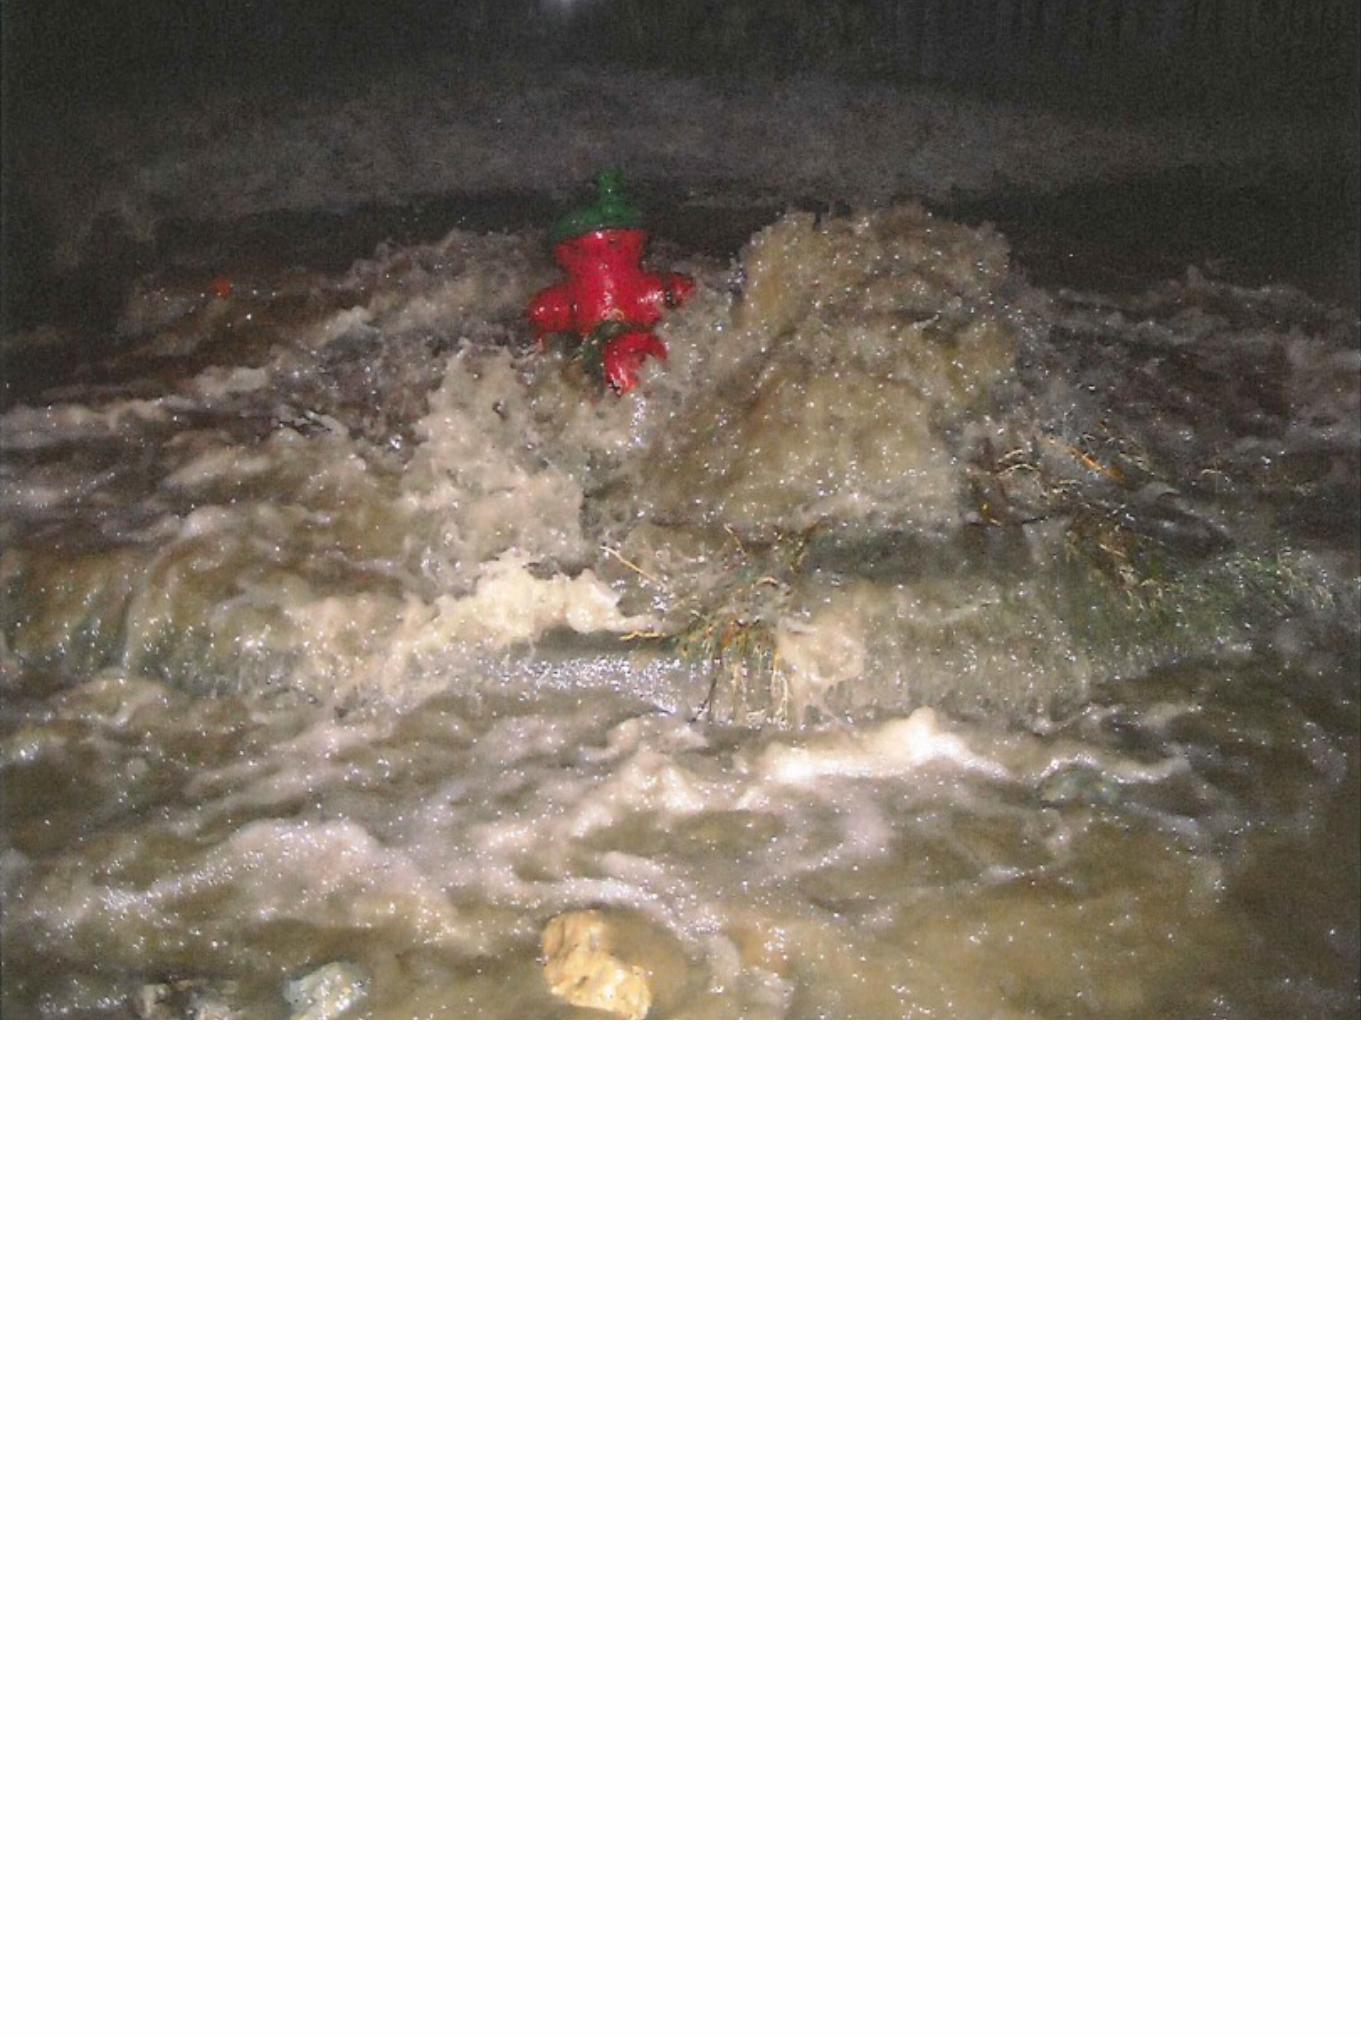
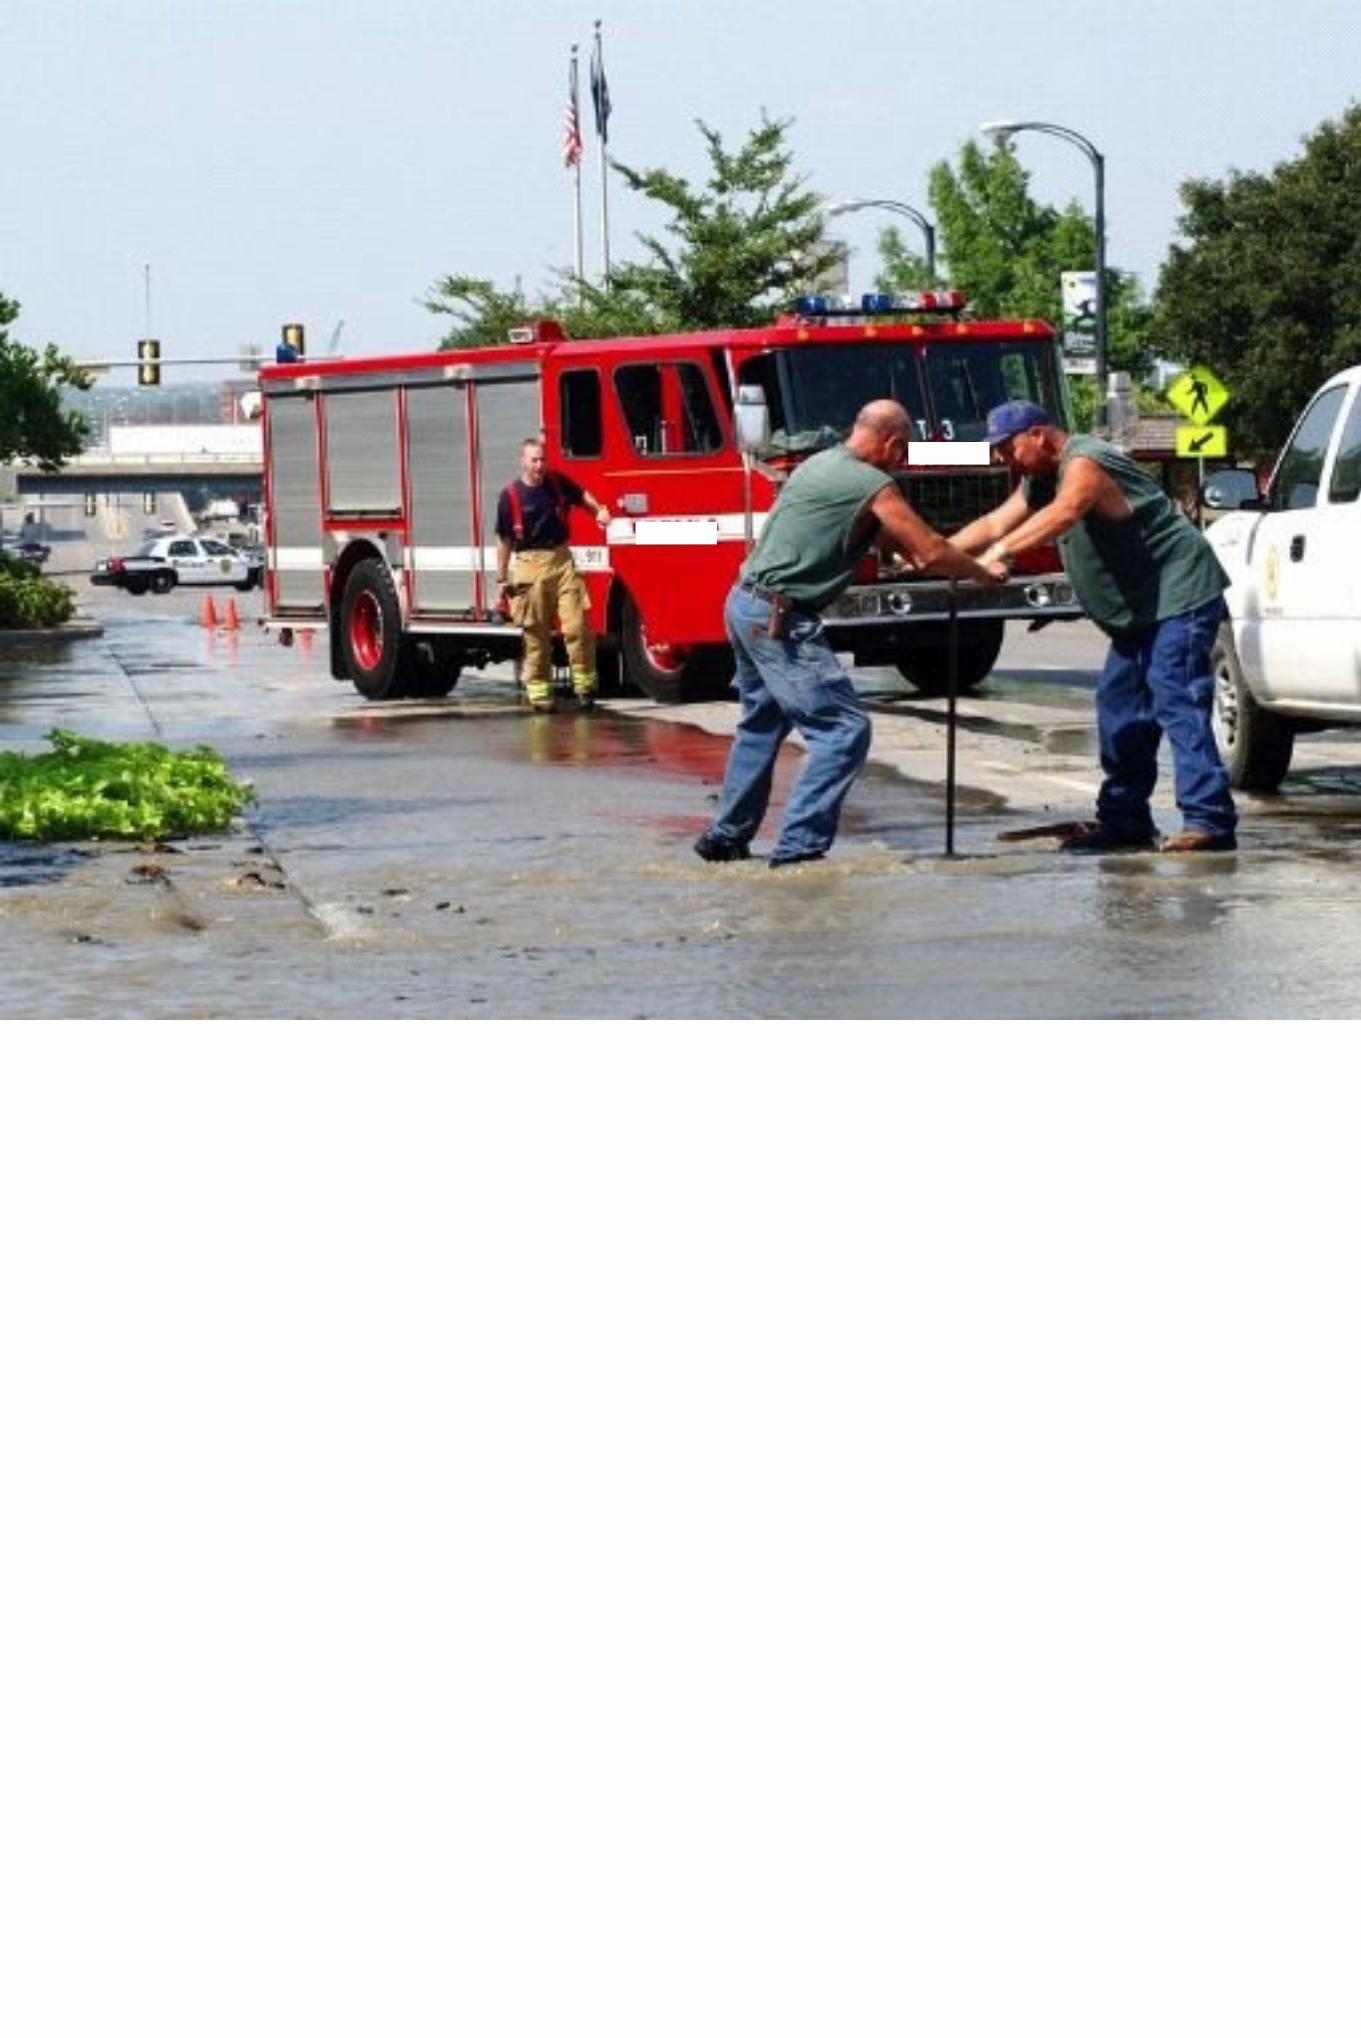
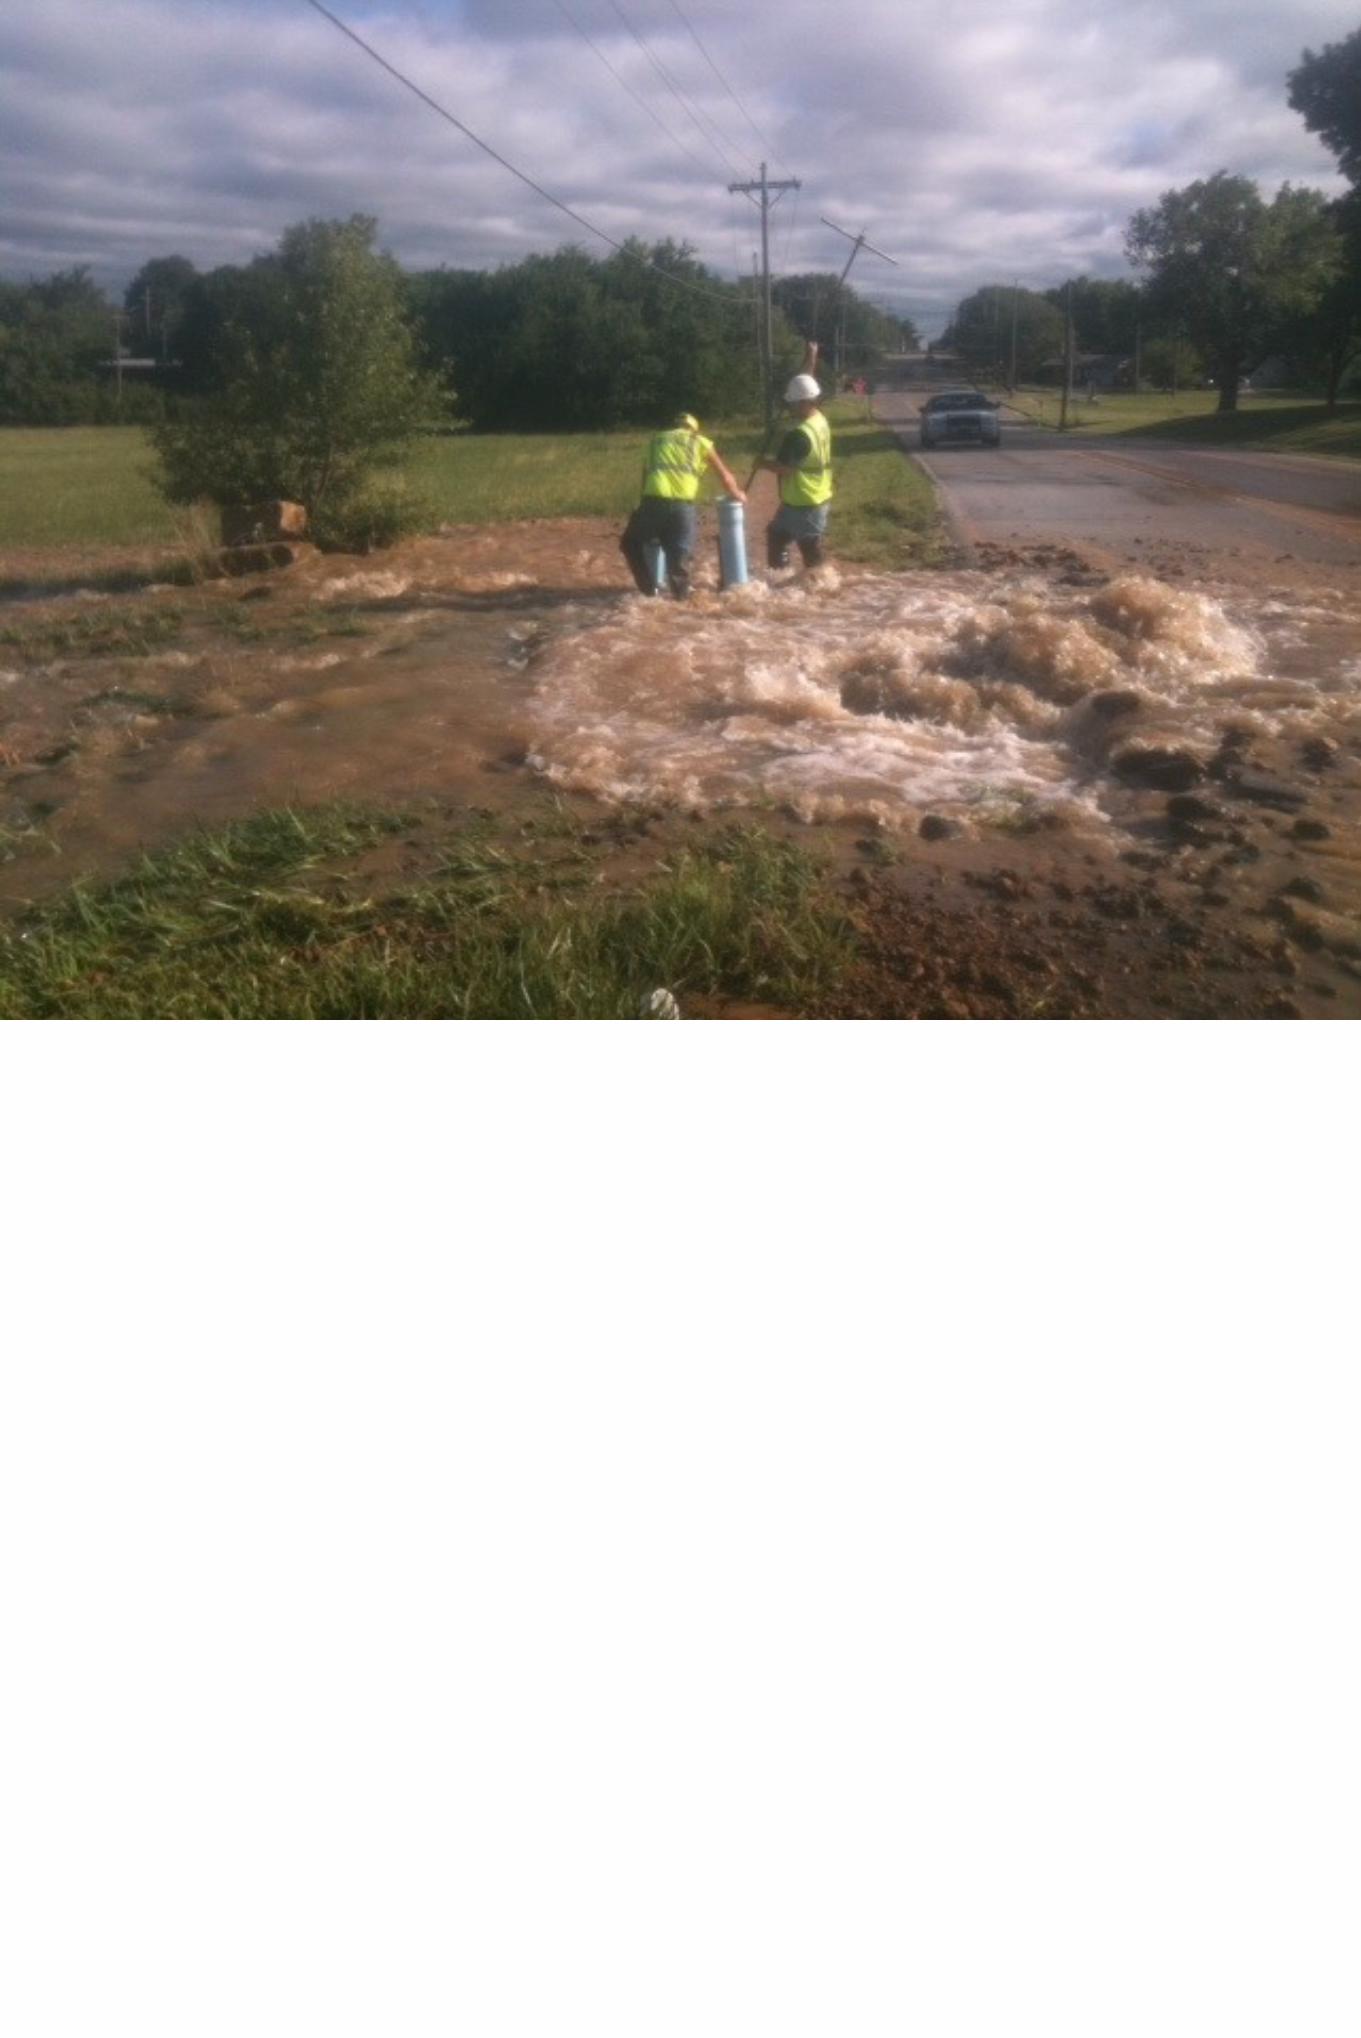
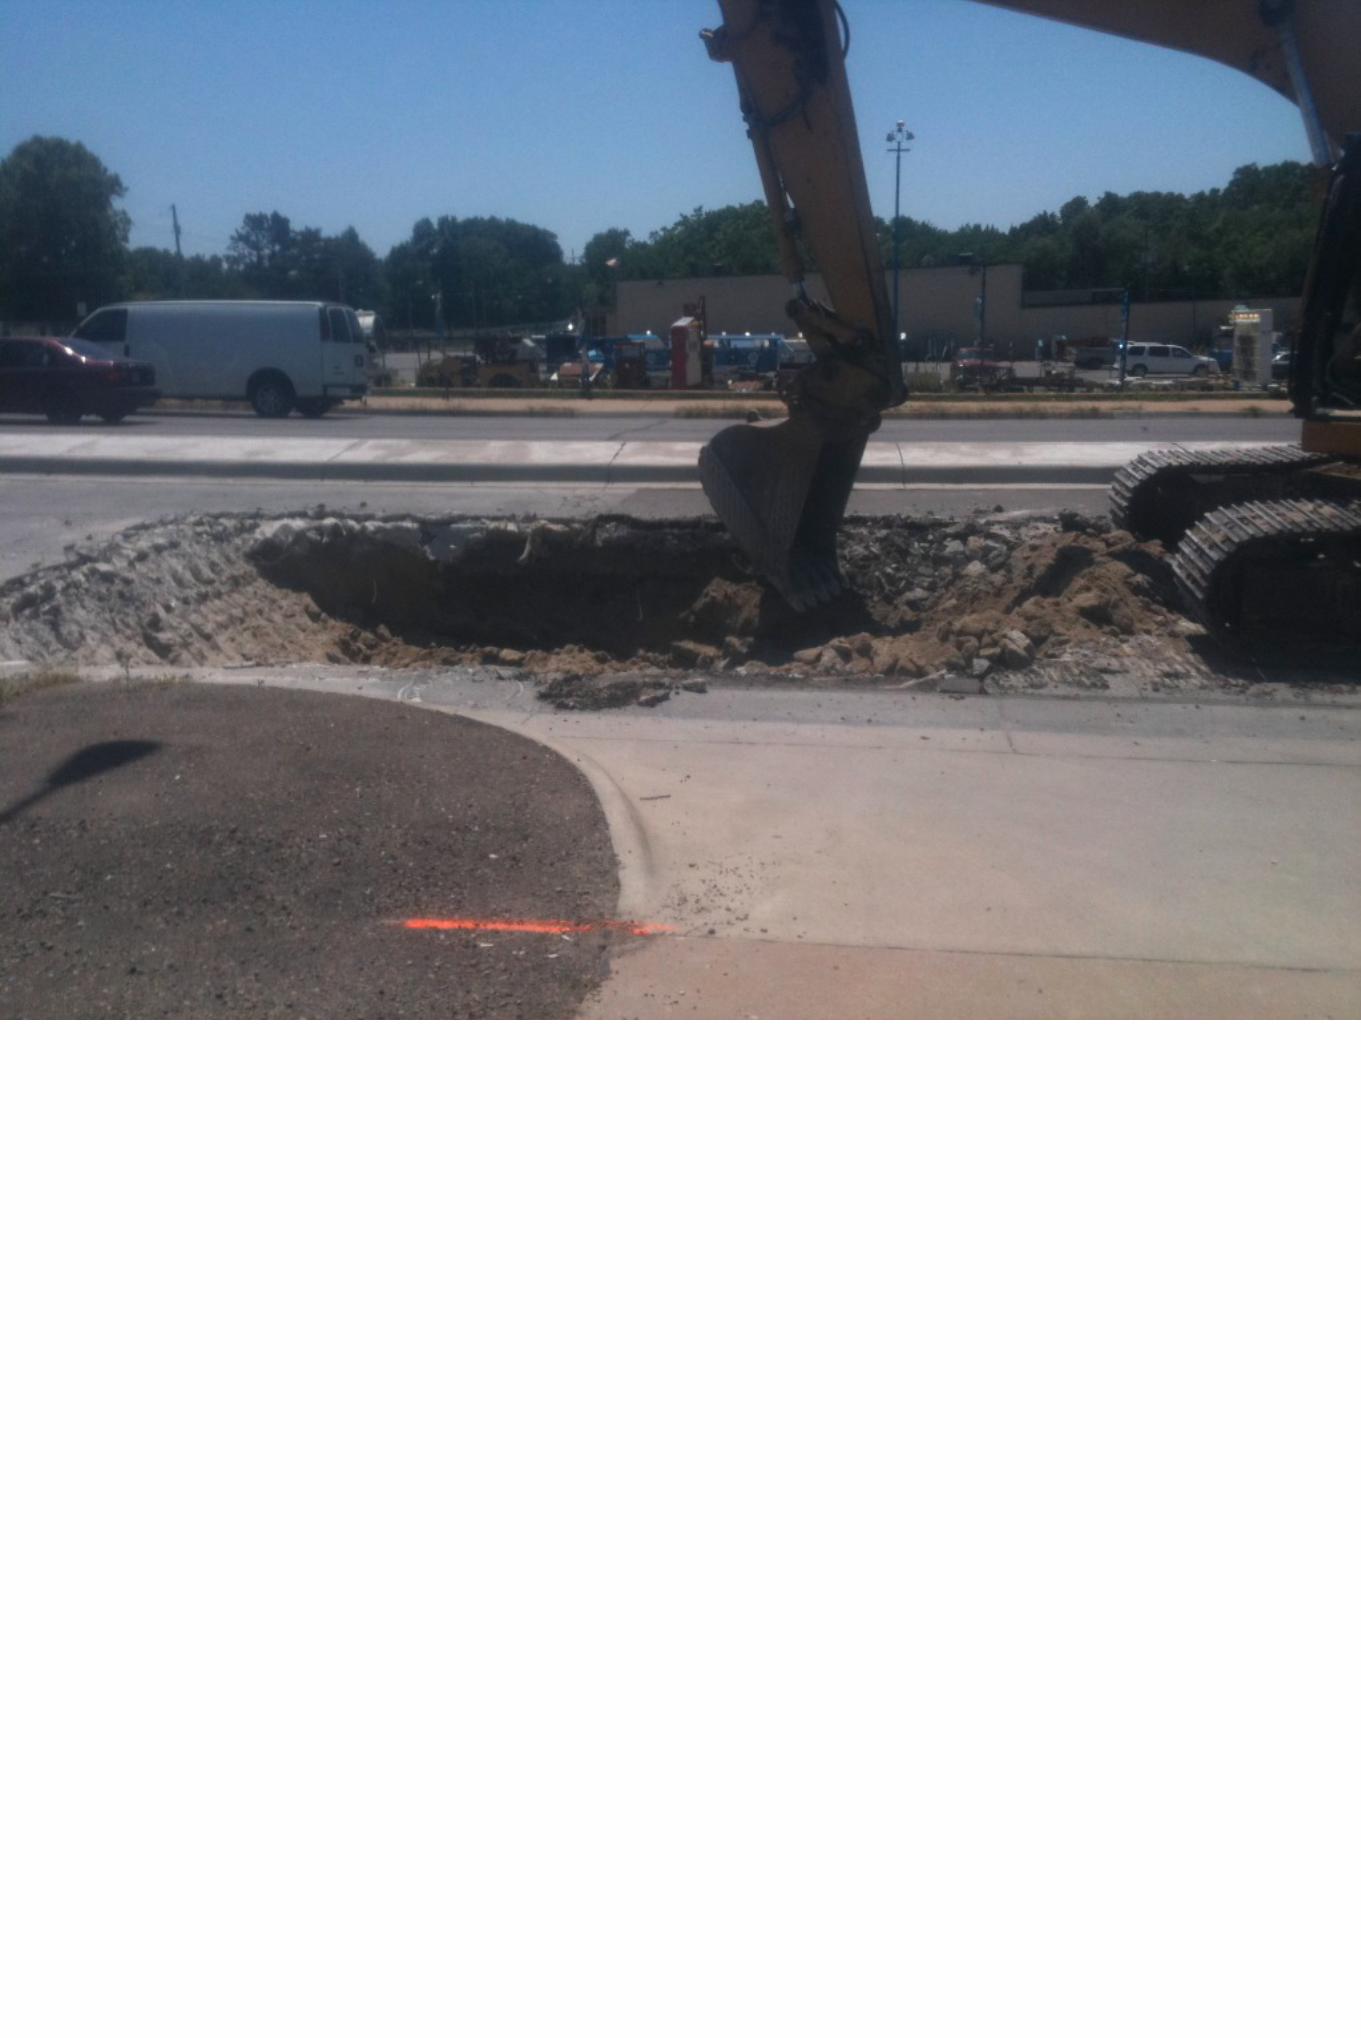
This 130 Year Old Pipe Broke Last Year.
The Situa%on Will Con%nue to Get Worse
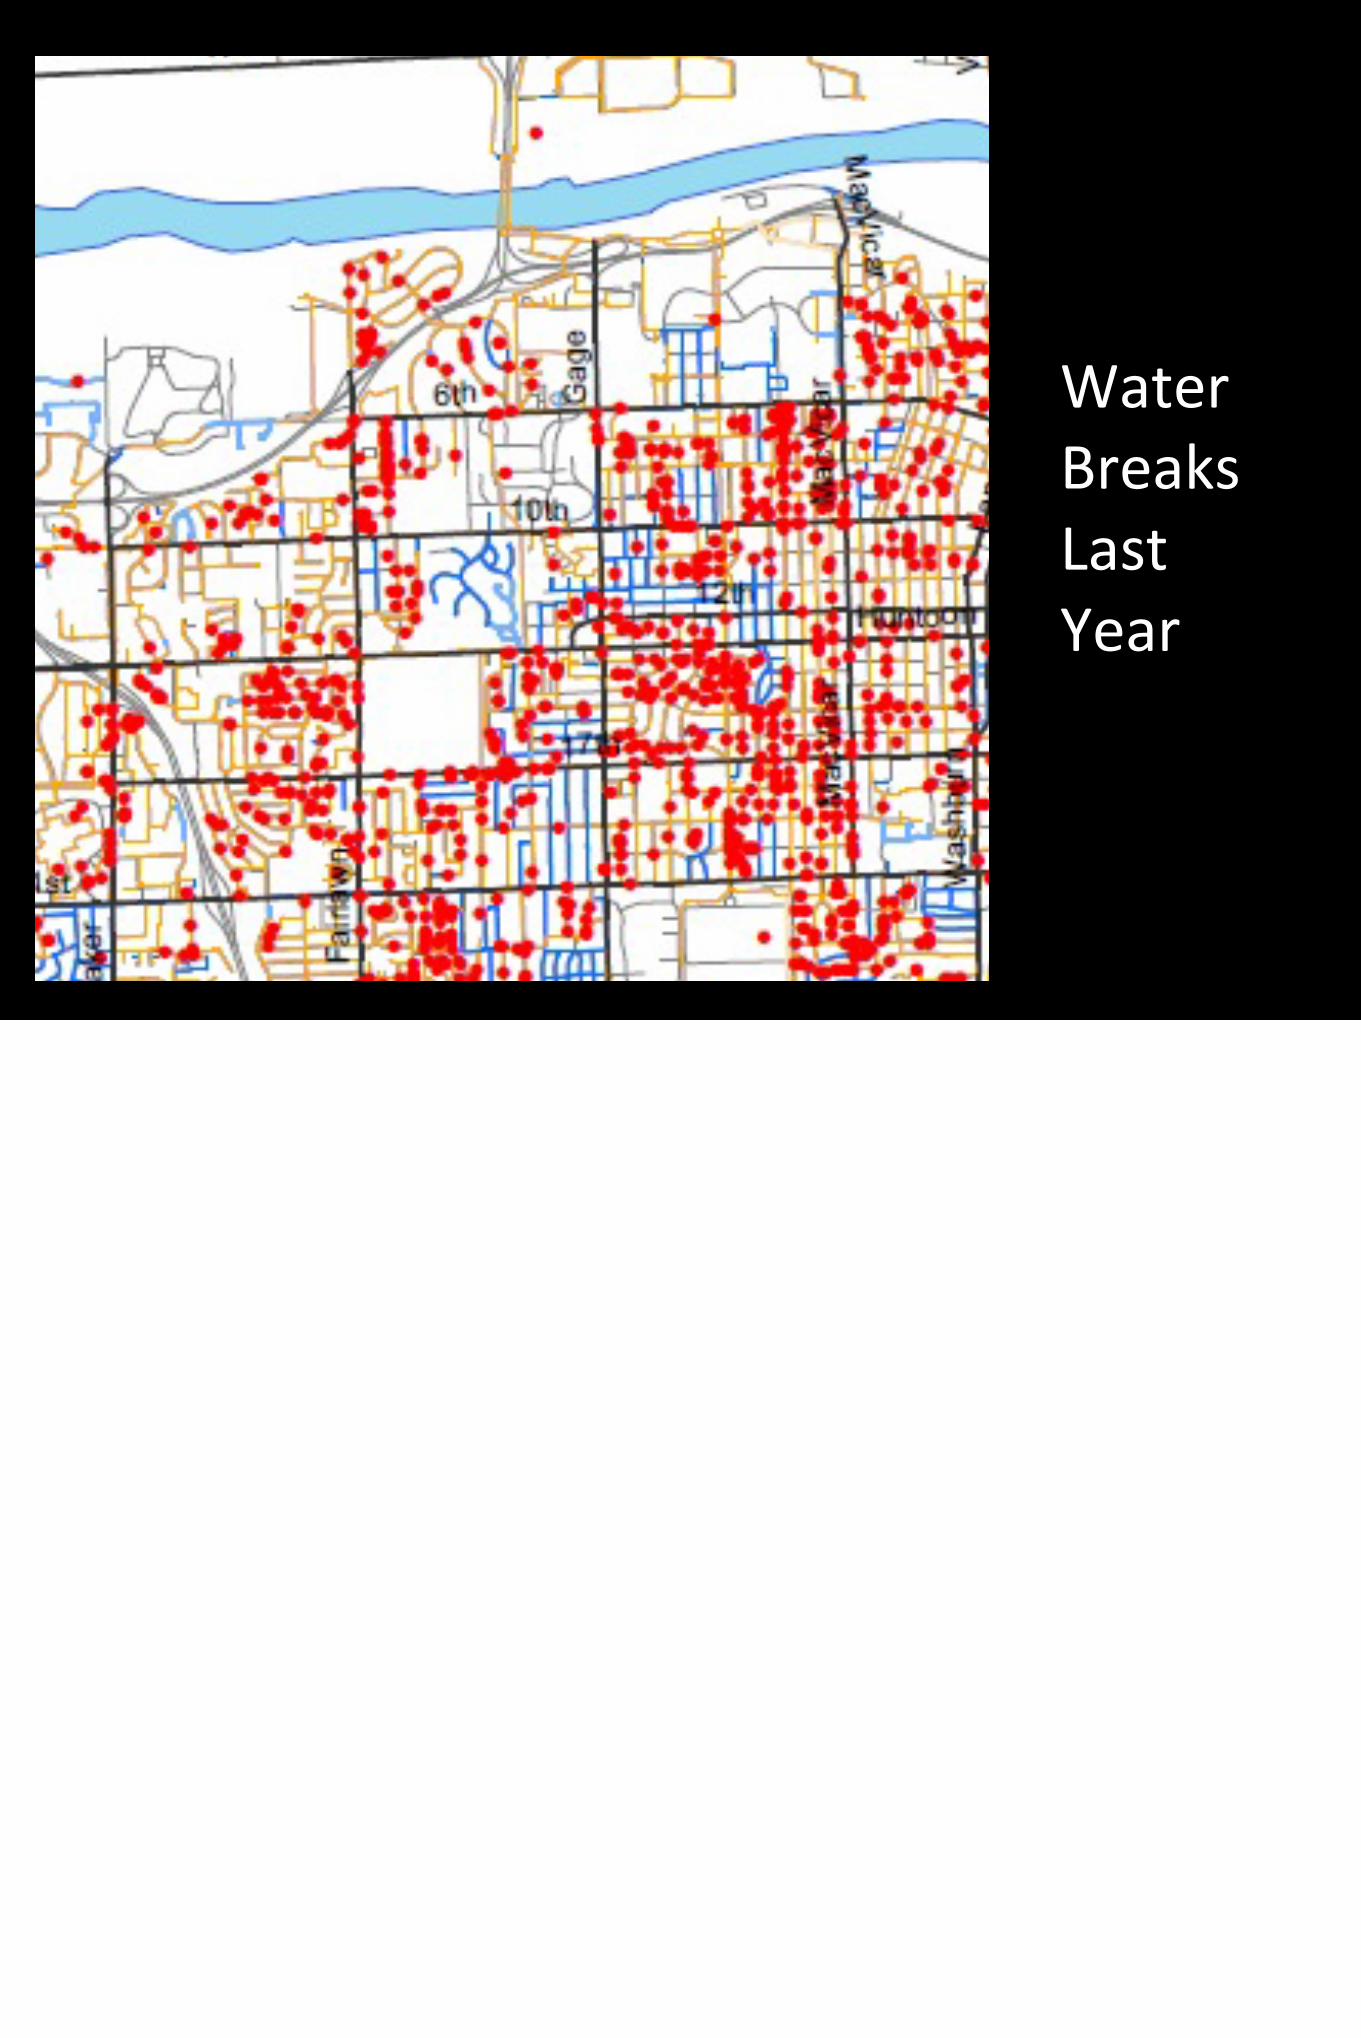
Water Breaks Last Year
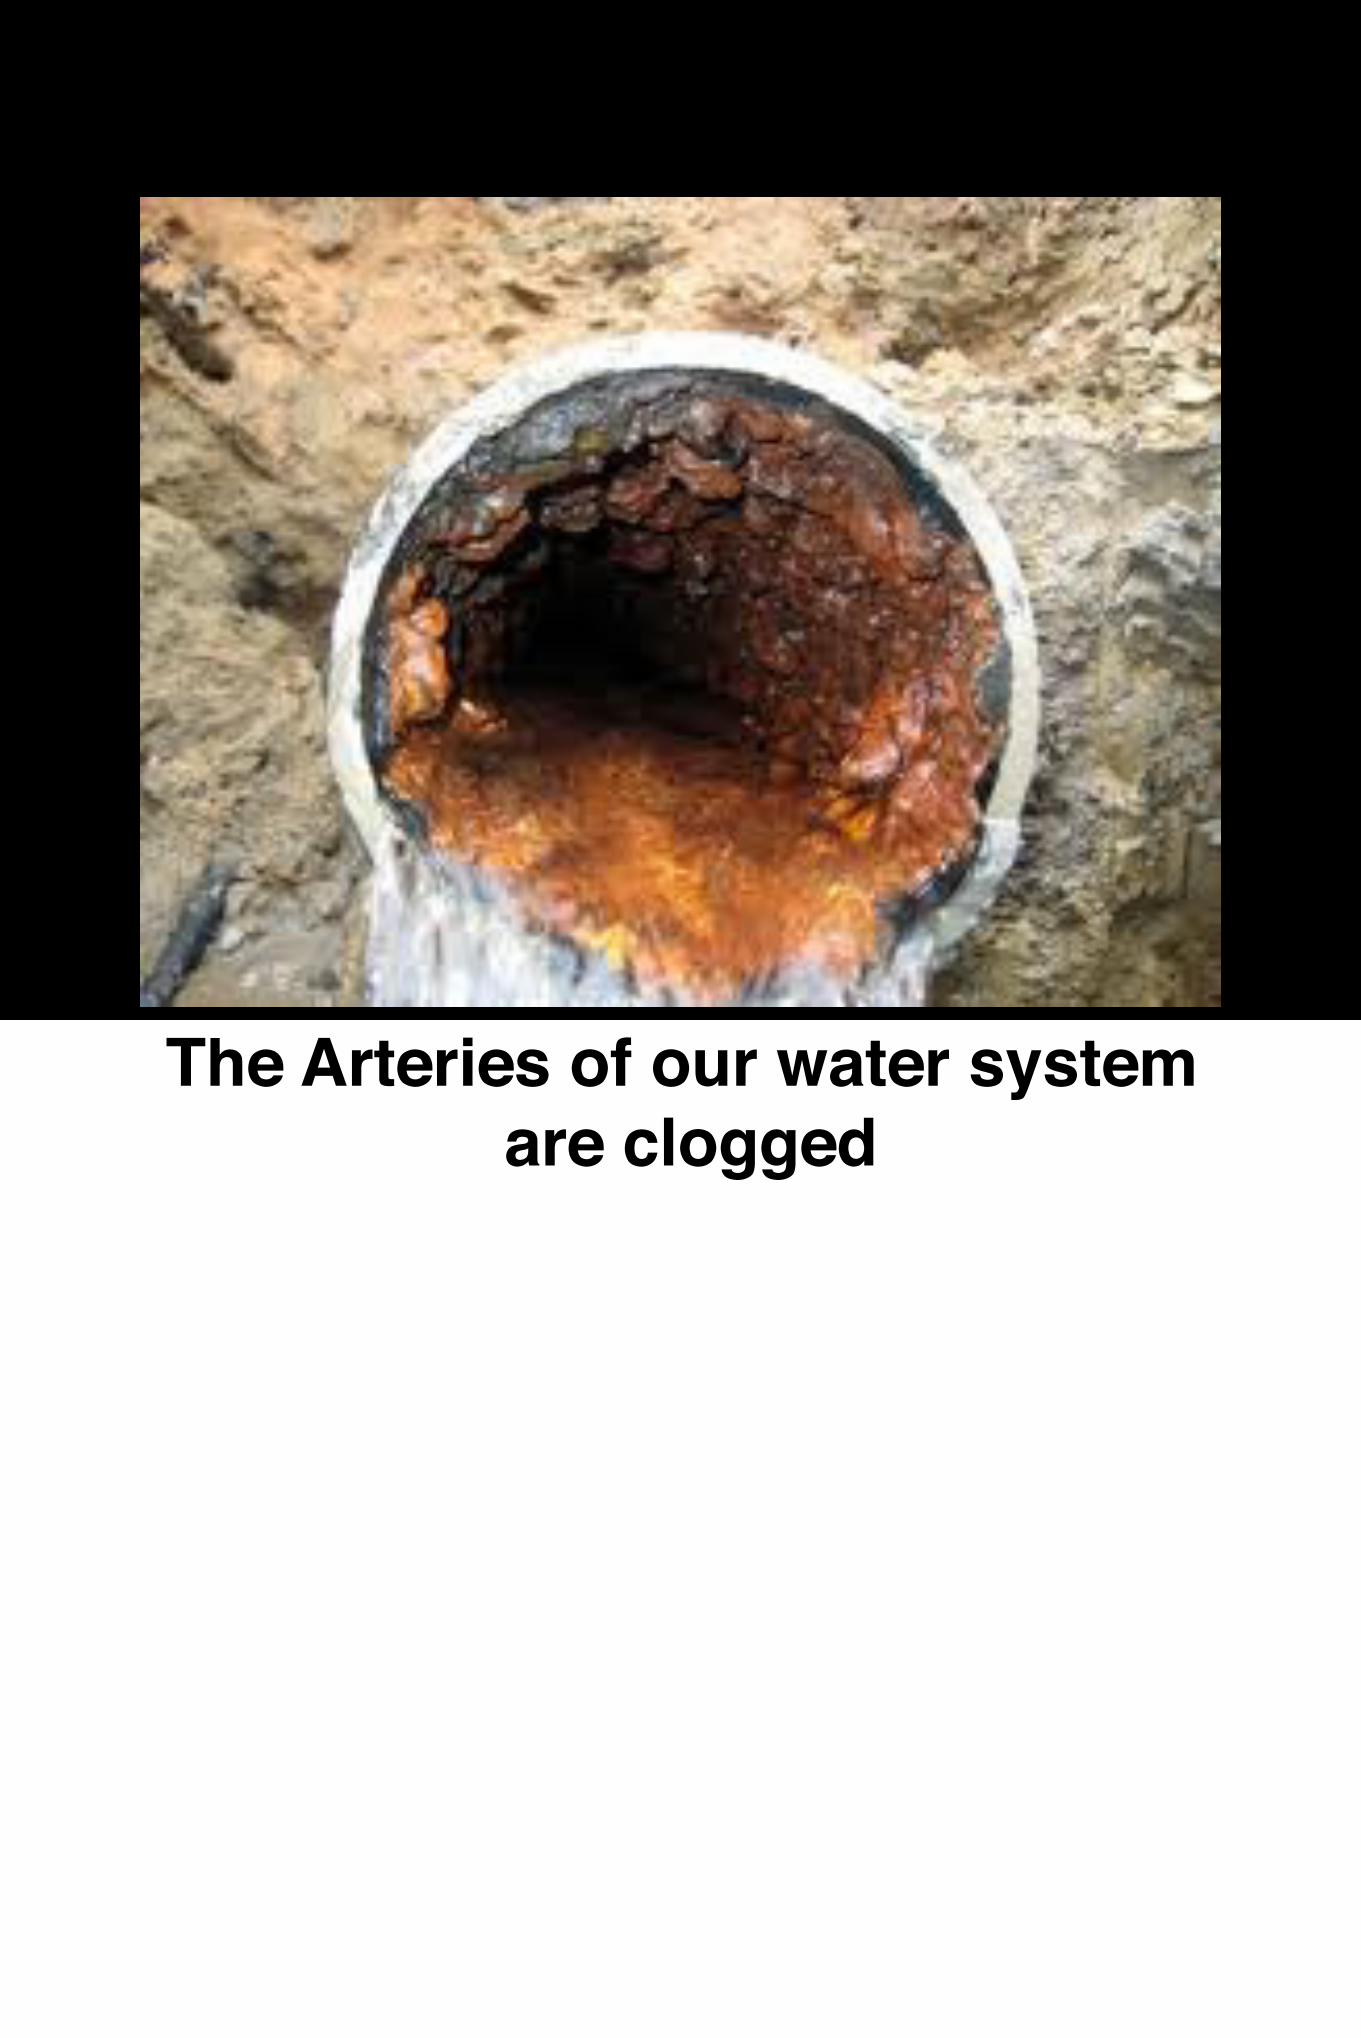
The Arteries of our water system are clogged


Transition Slide
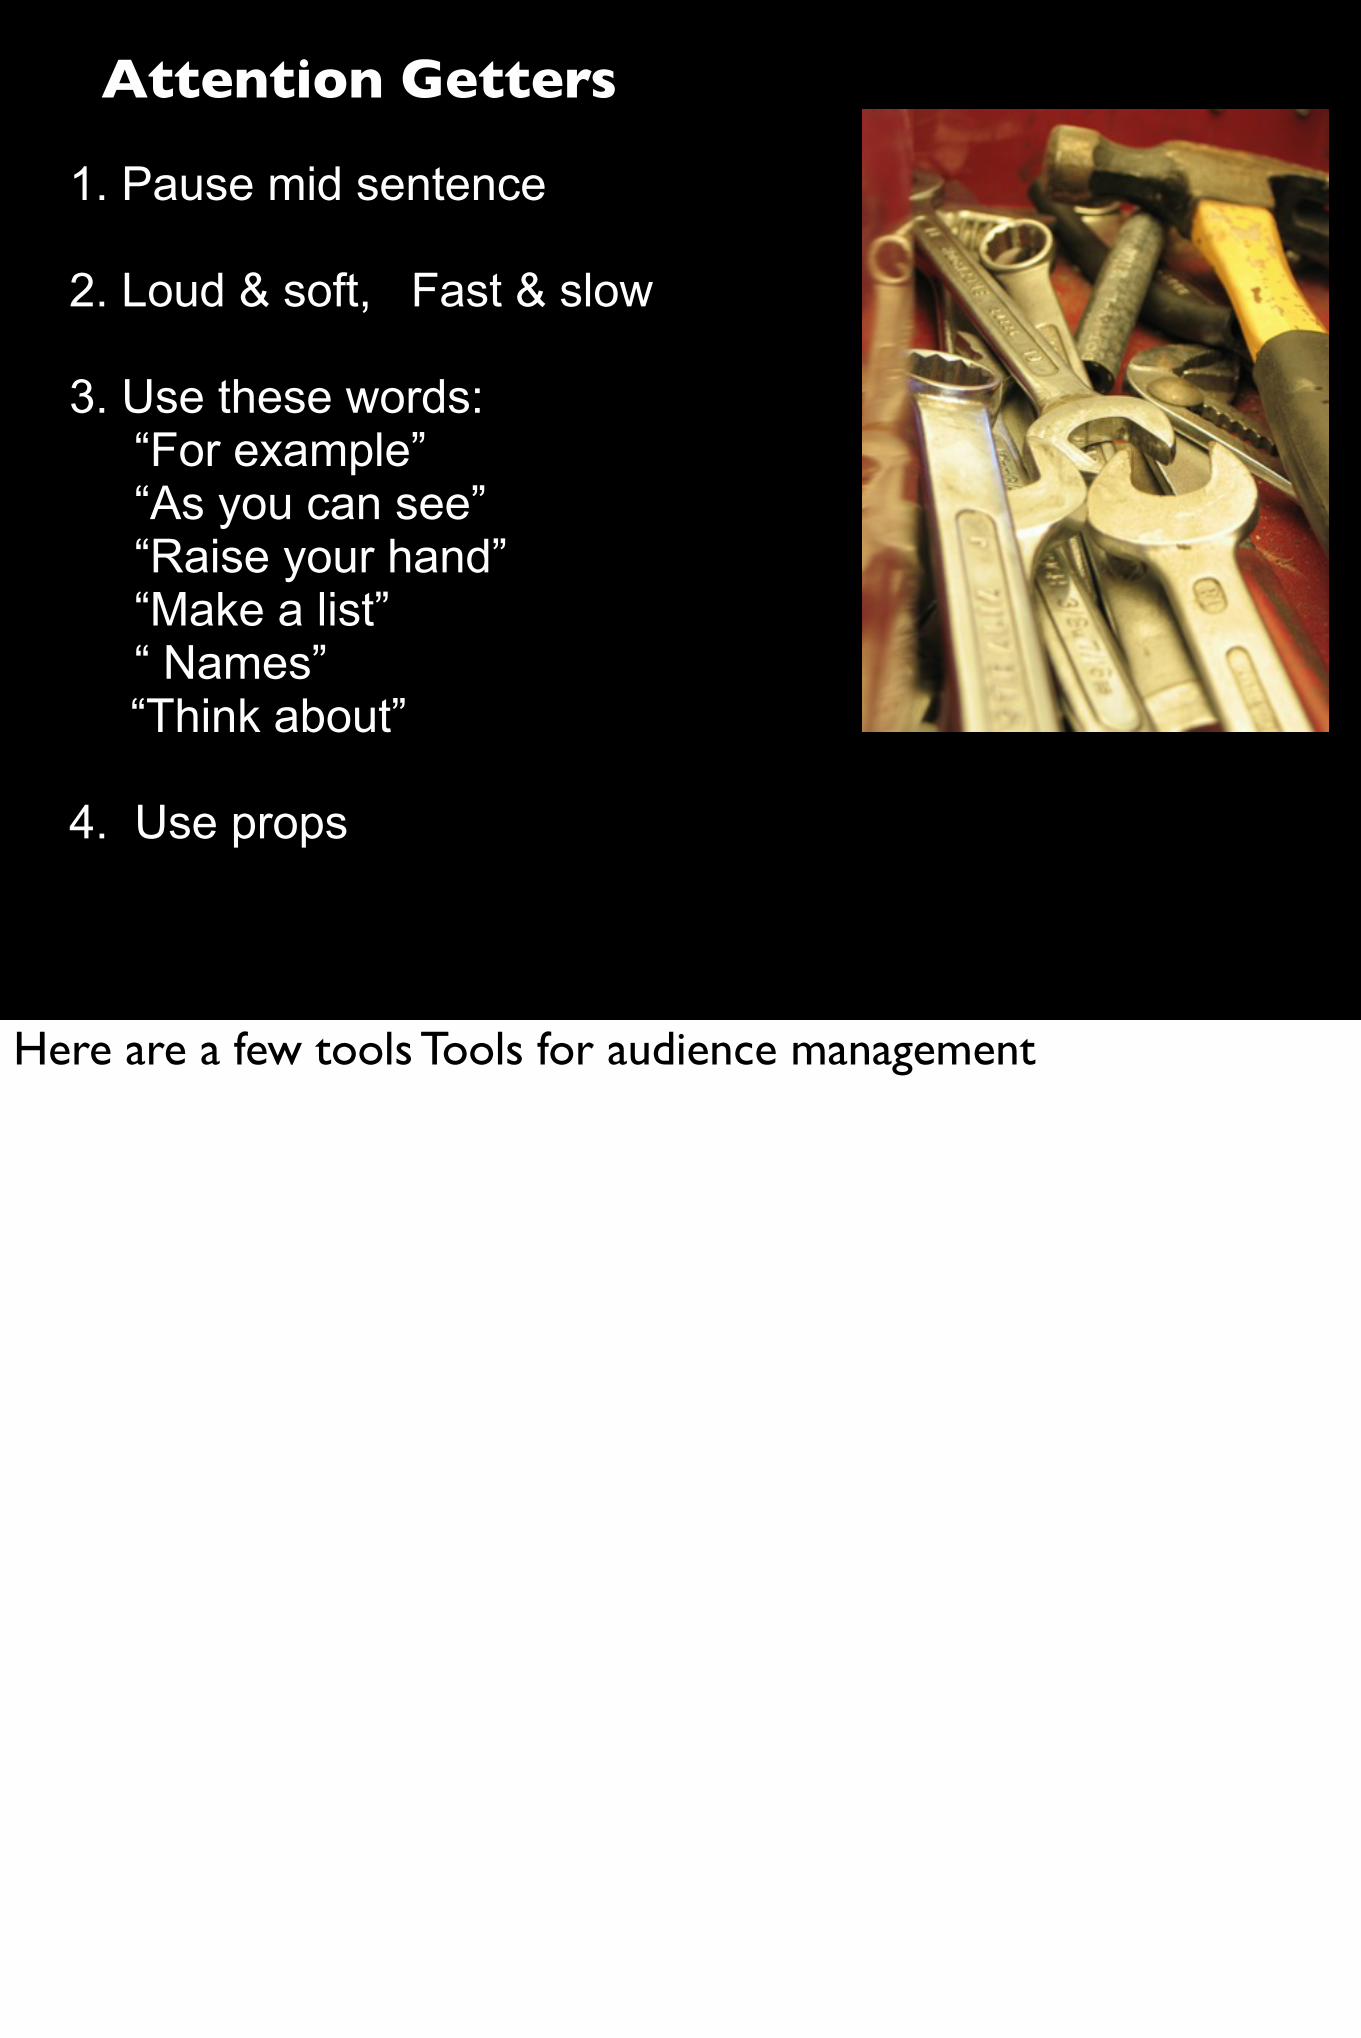
1. Pause mid sentence
2. Loud & soft, Fast & slow
3. Use these words: “For example” “As you can see” “Raise your hand” “Make a list” “ Names” “Think about”
4. Use props
Attention Getters
Here are a few tools Tools for audience management
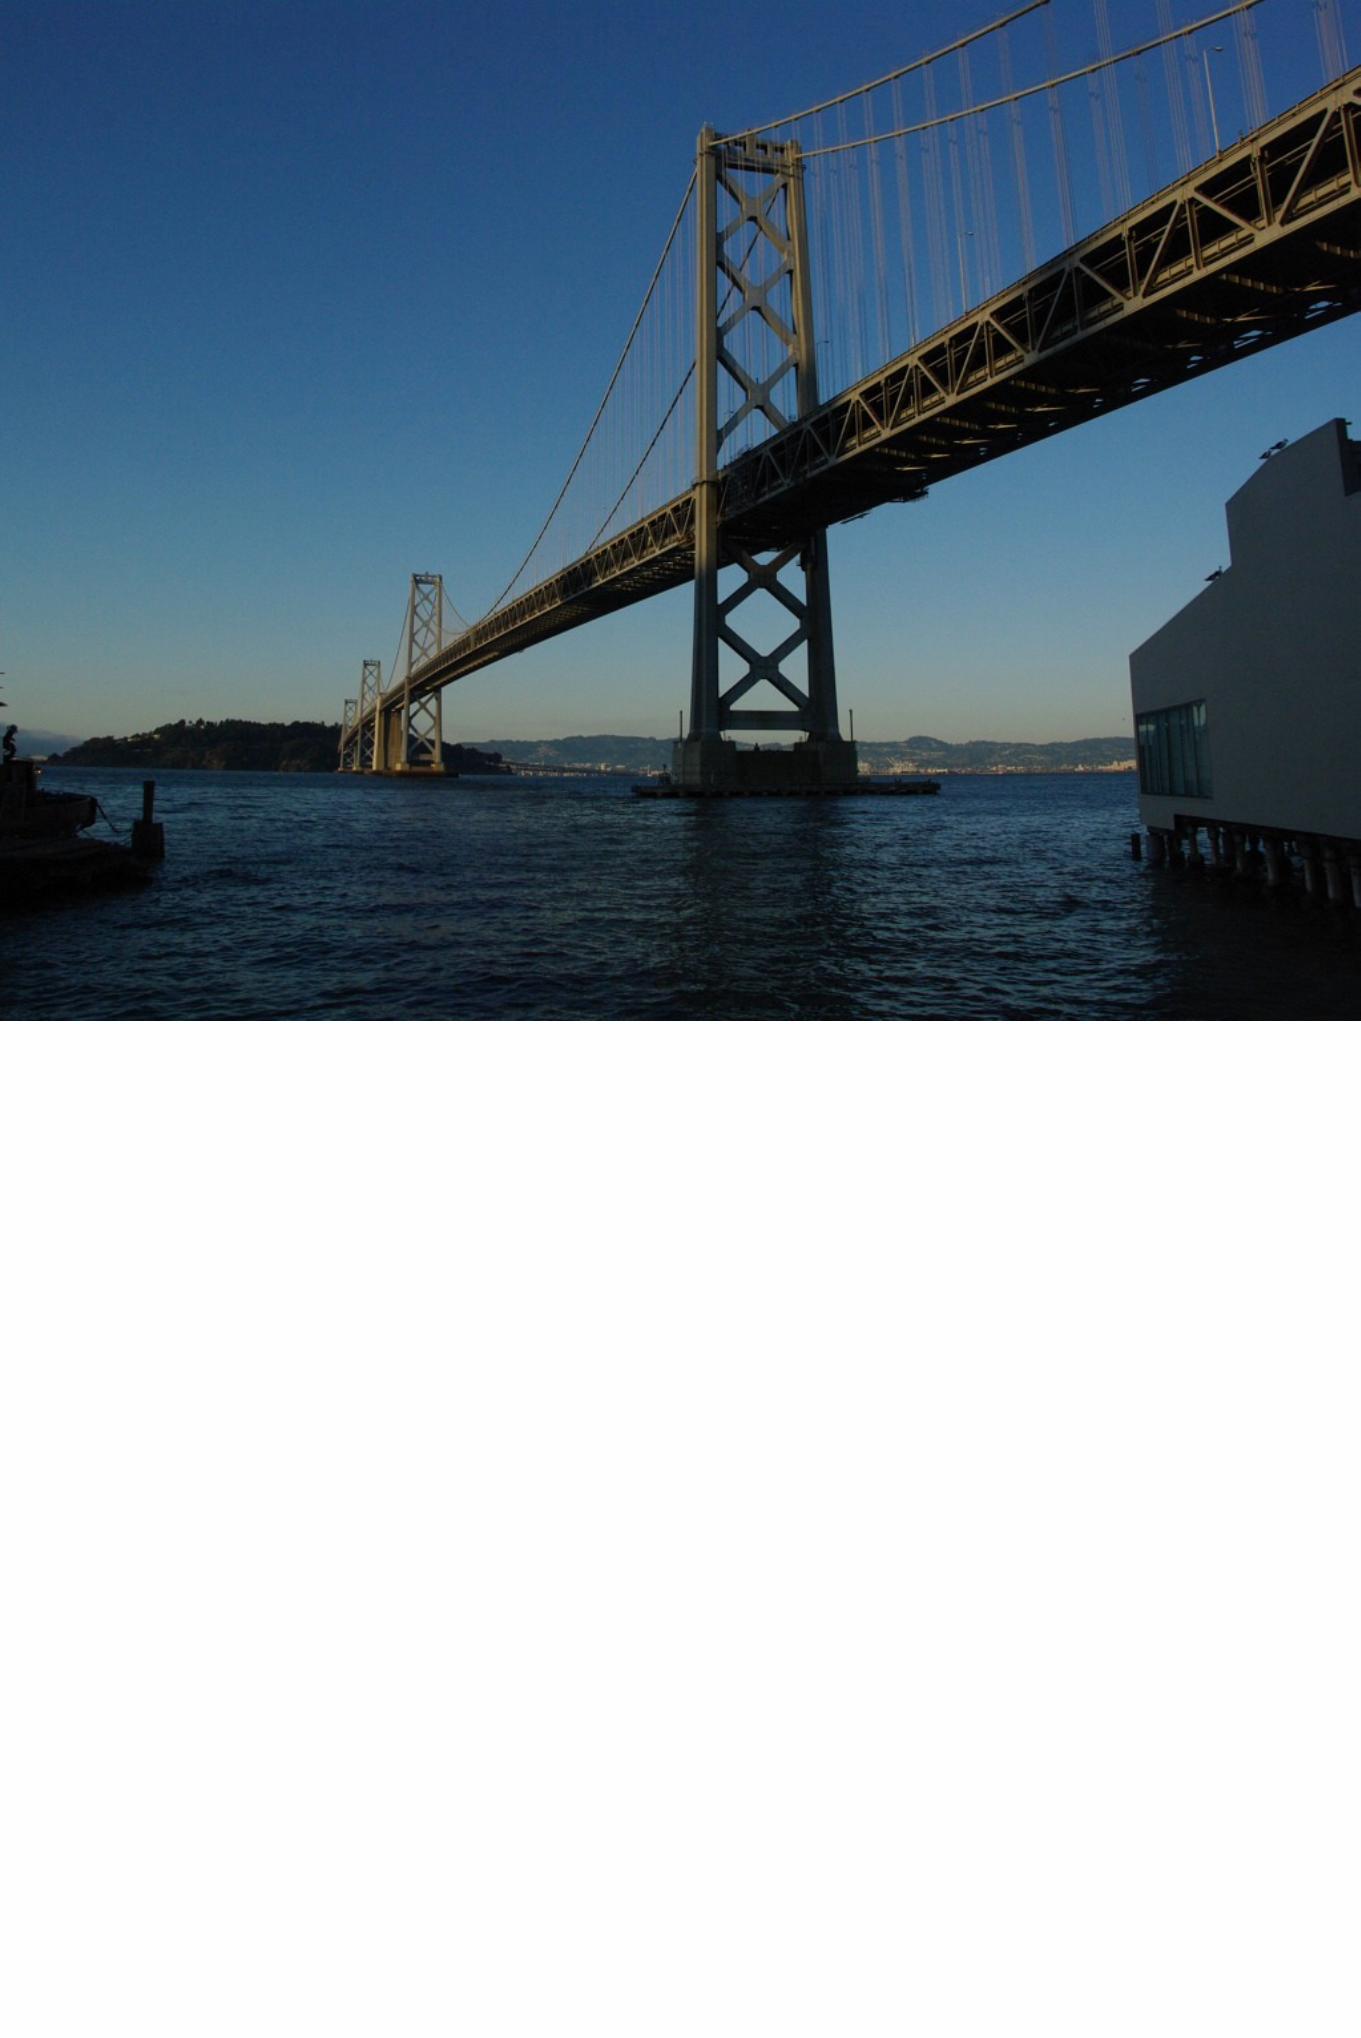

The Opening

The First 90 Seconds
A question to consider their relationship to topic
Compelling statistic
A thousand word picture
Tell a story

The Close

The opening
The Close Pause and reengage eye contactMake it clear what you want them to do End with a story, quote or vision
Make sure you reengage eye contact

The Q & A

Questions?

© 2008 AP Photo/Jeff Roberson
Pose a question“ Which of these techniques could you use tomorrow? ”
“What is in your way to using the new techniques?”
Save time for Q & A!

Leave time for evaluation.
Q and A
Does anyone have any questions?
ha ha NOT
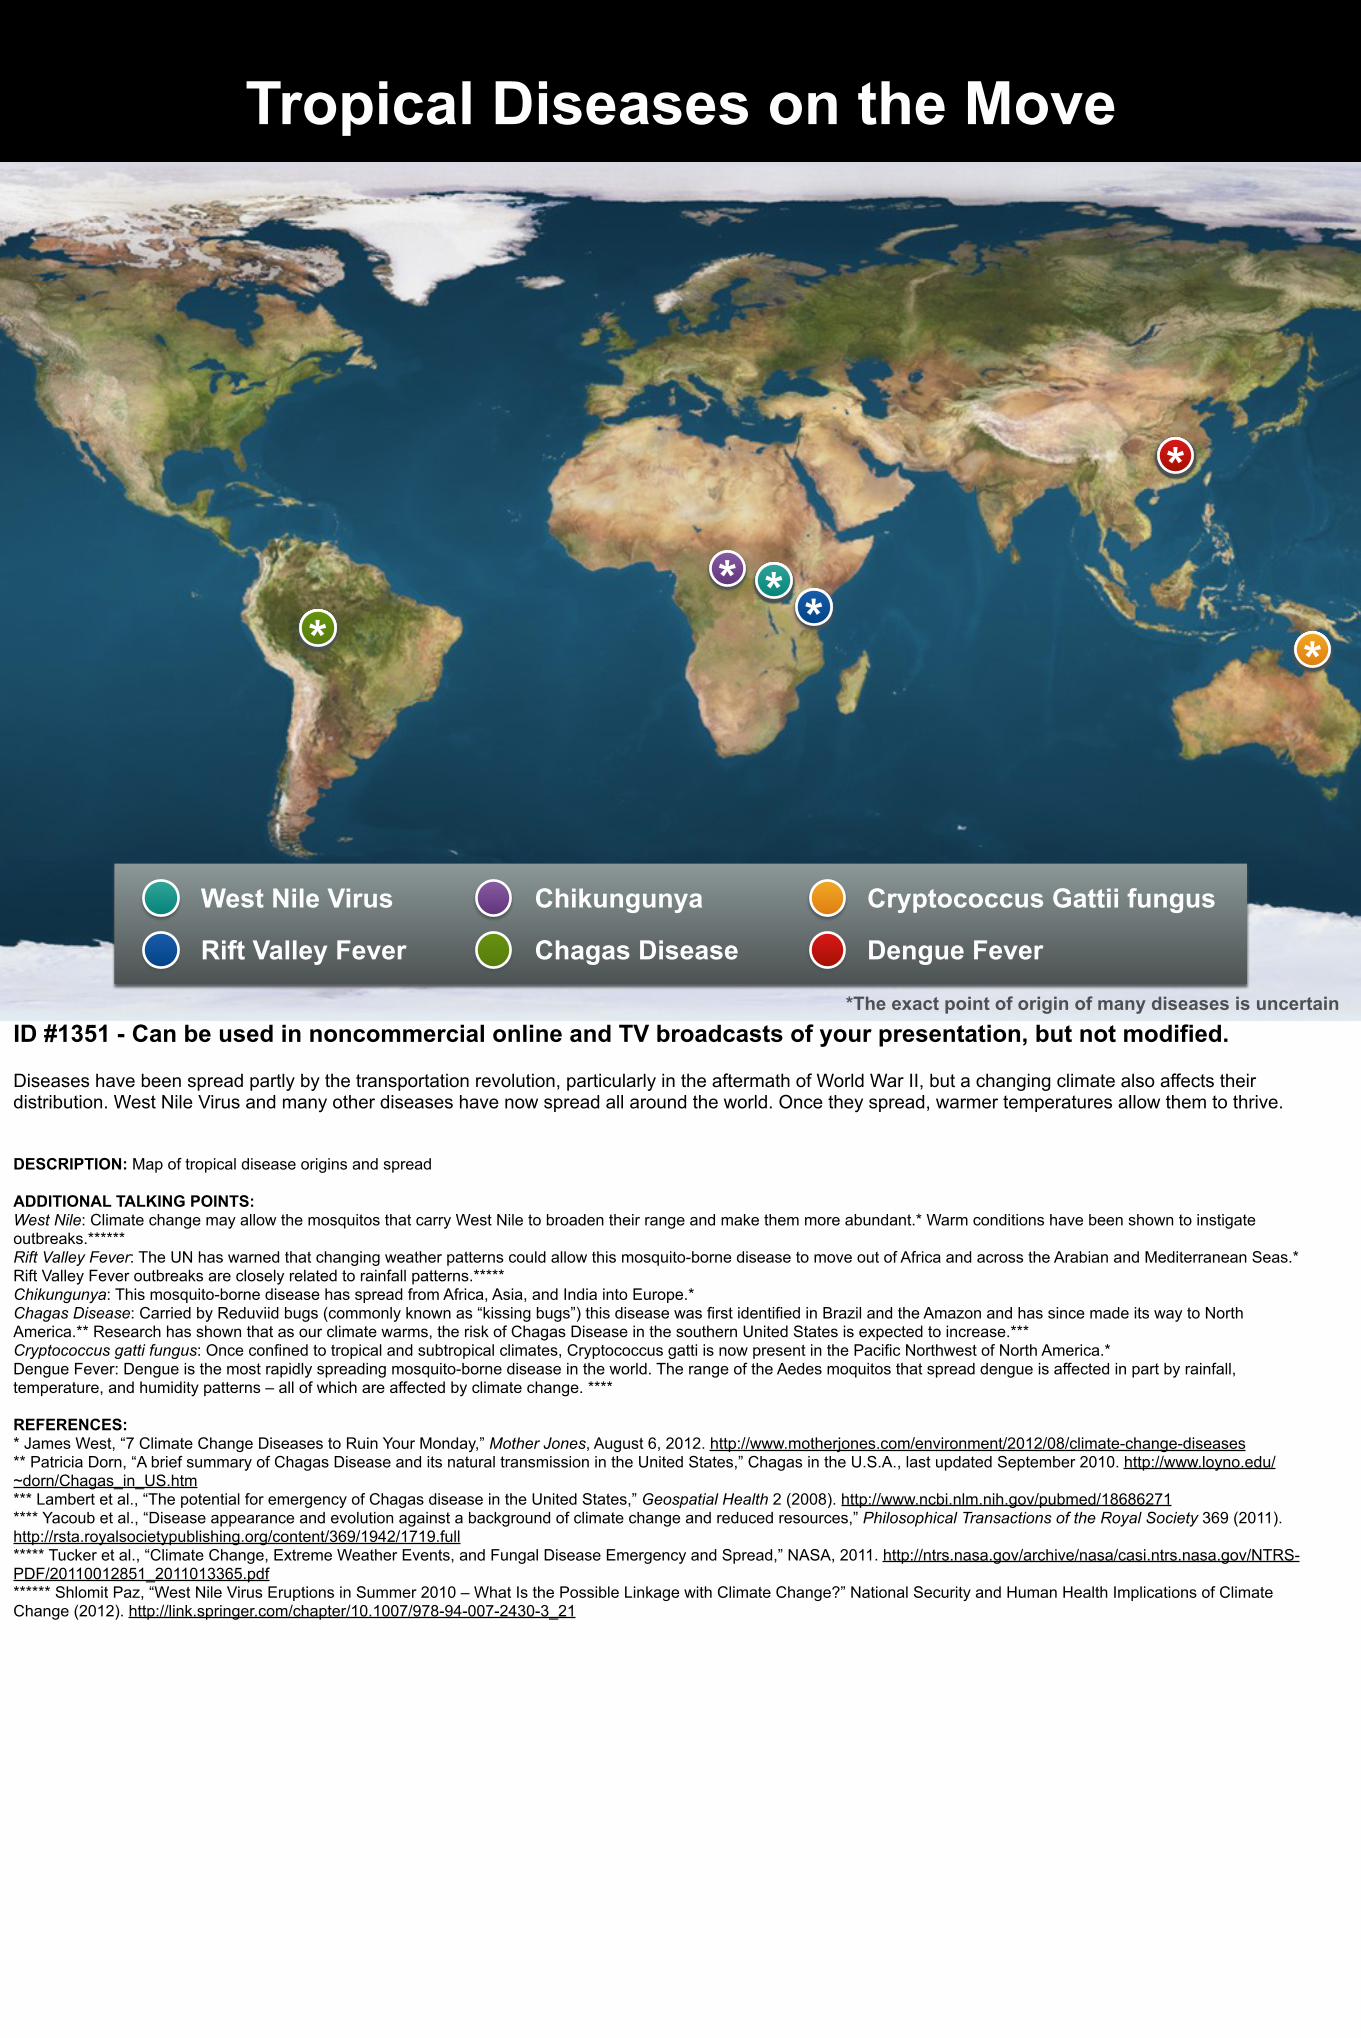
Tropical Diseases on the Move
West Nile Virus Cryptococcus Gattii fungusChikungunya
Rift Valley Fever Dengue Fever
*The exact point of origin of many diseases is uncertain
Chagas Disease
** * *
*
*
ID #1351 - Can be used in noncommercial online and TV broadcasts of your presentation, but not modified.
Diseases have been spread partly by the transportation revolution, particularly in the aftermath of World War II, but a changing climate also affects their distribution. West Nile Virus and many other diseases have now spread all around the world. Once they spread, warmer temperatures allow them to thrive.
DESCRIPTION: Map of tropical disease origins and spread
ADDITIONAL TALKING POINTS: West Nile: Climate change may allow the mosquitos that carry West Nile to broaden their range and make them more abundant.* Warm conditions have been shown to instigate outbreaks.******Rift Valley Fever: The UN has warned that changing weather patterns could allow this mosquito-borne disease to move out of Africa and across the Arabian and Mediterranean Seas.* Rift Valley Fever outbreaks are closely related to rainfall patterns.*****Chikungunya: This mosquito-borne disease has spread from Africa, Asia, and India into Europe.*Chagas Disease: Carried by Reduviid bugs (commonly known as “kissing bugs”) this disease was first identified in Brazil and the Amazon and has since made its way to North America.** Research has shown that as our climate warms, the risk of Chagas Disease in the southern United States is expected to increase.***Cryptococcus gatti fungus: Once confined to tropical and subtropical climates, Cryptococcus gatti is now present in the Pacific Northwest of North America.*Dengue Fever: Dengue is the most rapidly spreading mosquito-borne disease in the world. The range of the Aedes moquitos that spread dengue is affected in part by rainfall, temperature, and humidity patterns – all of which are affected by climate change. ****
REFERENCES:* James West, “7 Climate Change Diseases to Ruin Your Monday,” Mother Jones, August 6, 2012. http://www.motherjones.com/environment/2012/08/climate-change-diseases ** Patricia Dorn, “A brief summary of Chagas Disease and its natural transmission in the United States,” Chagas in the U.S.A., last updated September 2010. http://www.loyno.edu/~dorn/Chagas_in_US.htm *** Lambert et al., “The potential for emergency of Chagas disease in the United States,” Geospatial Health 2 (2008). http://www.ncbi.nlm.nih.gov/pubmed/18686271 **** Yacoub et al., “Disease appearance and evolution against a background of climate change and reduced resources,” Philosophical Transactions of the Royal Society 369 (2011). http://rsta.royalsocietypublishing.org/content/369/1942/1719.full***** Tucker et al., “Climate Change, Extreme Weather Events, and Fungal Disease Emergency and Spread,” NASA, 2011. http://ntrs.nasa.gov/archive/nasa/casi.ntrs.nasa.gov/NTRS-PDF/20110012851_2011013365.pdf ****** Shlomit Paz, “West Nile Virus Eruptions in Summer 2010 – What Is the Possible Linkage with Climate Change?” National Security and Human Health Implications of Climate Change (2012). http://link.springer.com/chapter/10.1007/978-94-007-2430-3_21
© 2011 AP Photo/Erwin Mascarinas
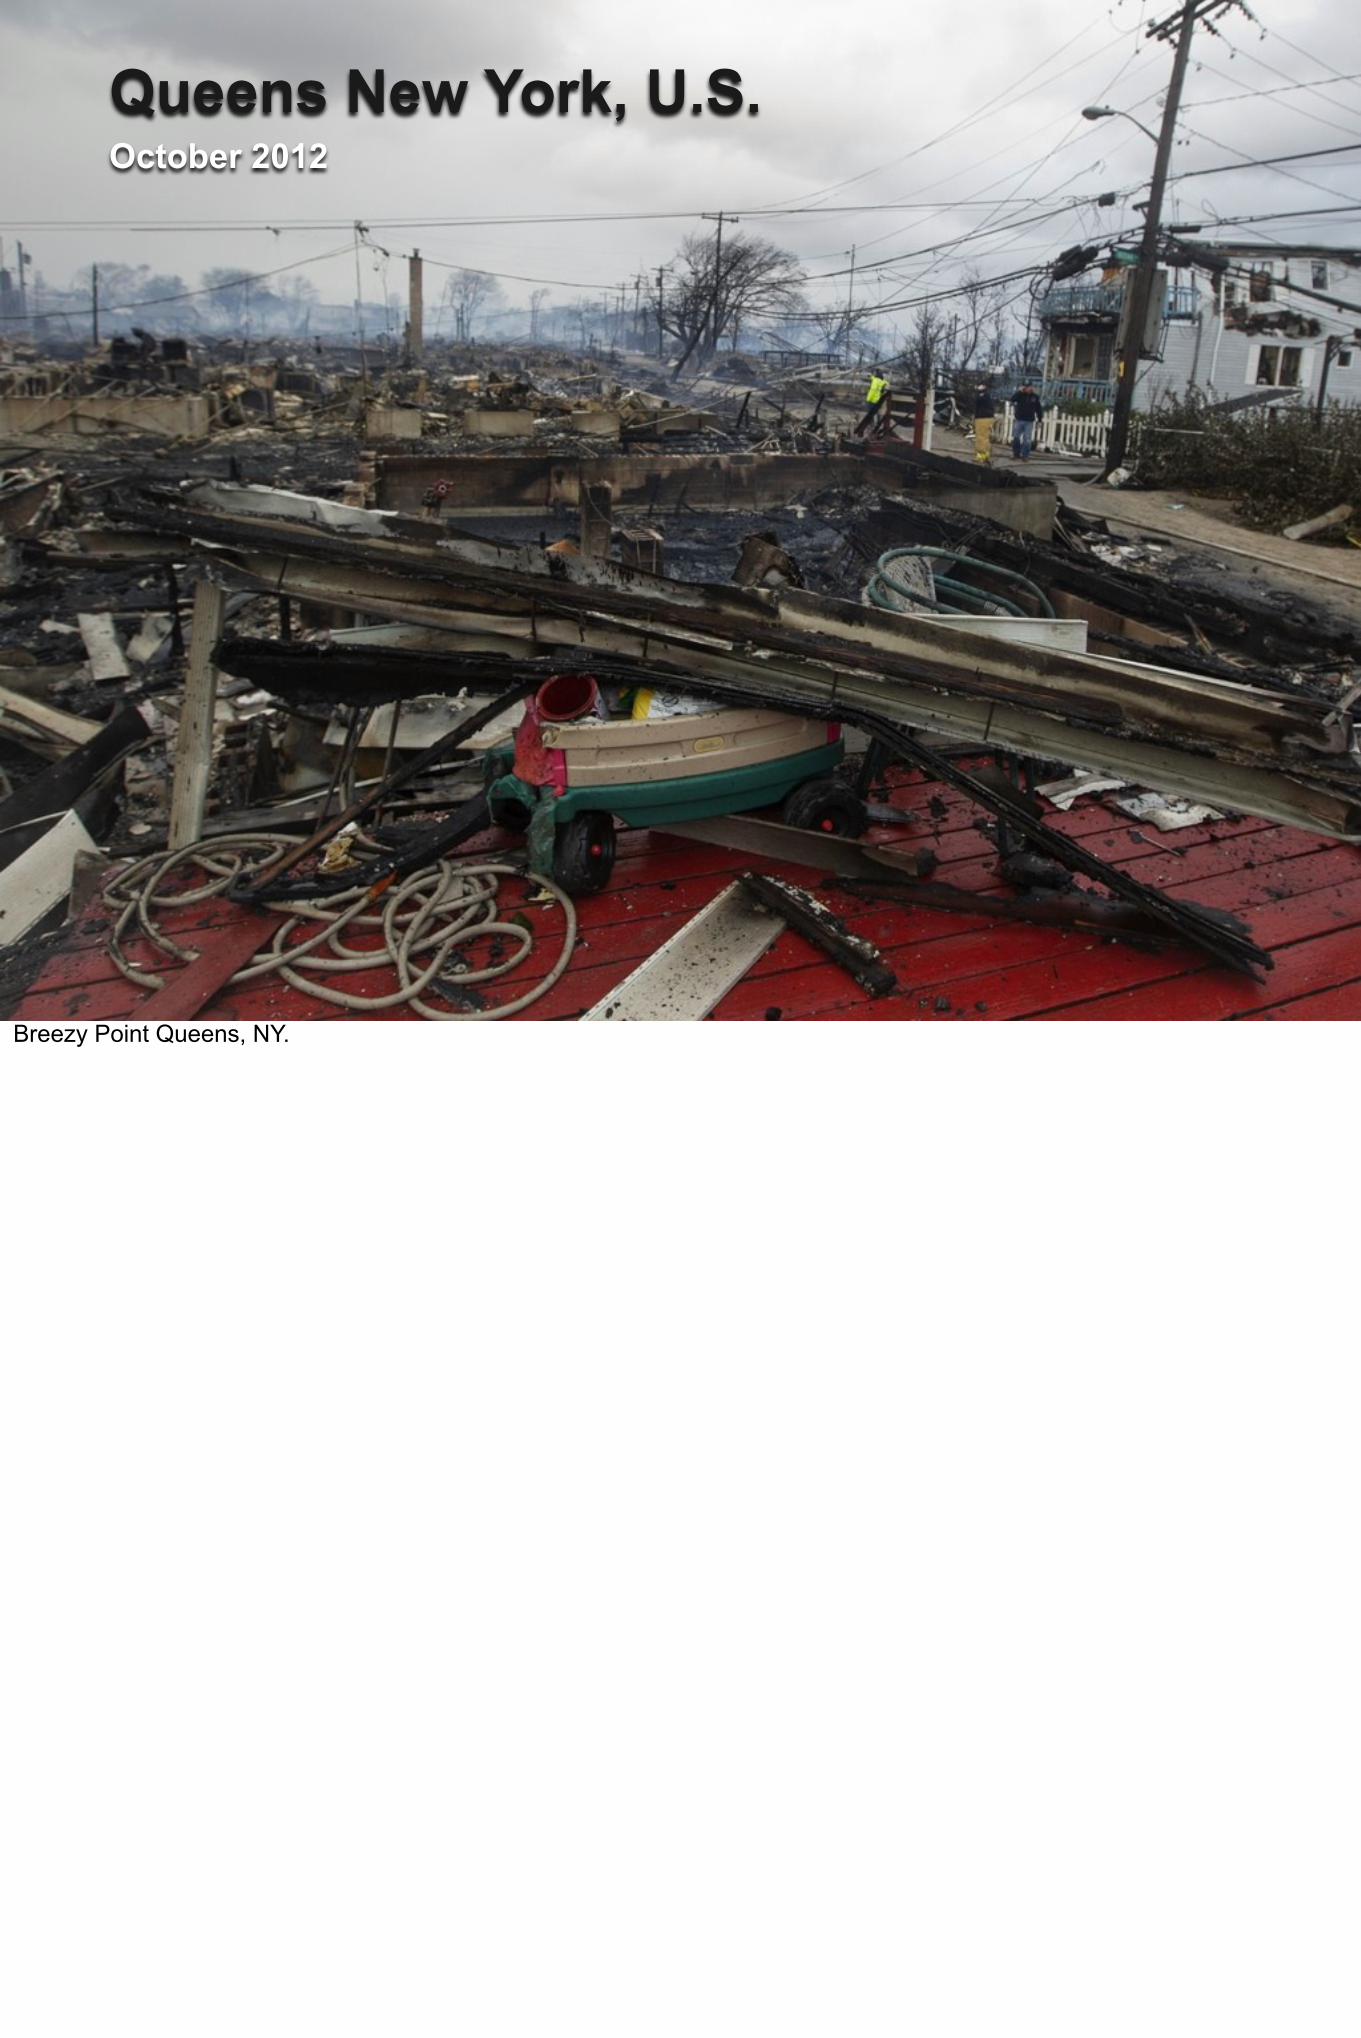
Queens New York, U.S. October 2012
Breezy Point Queens, NY.
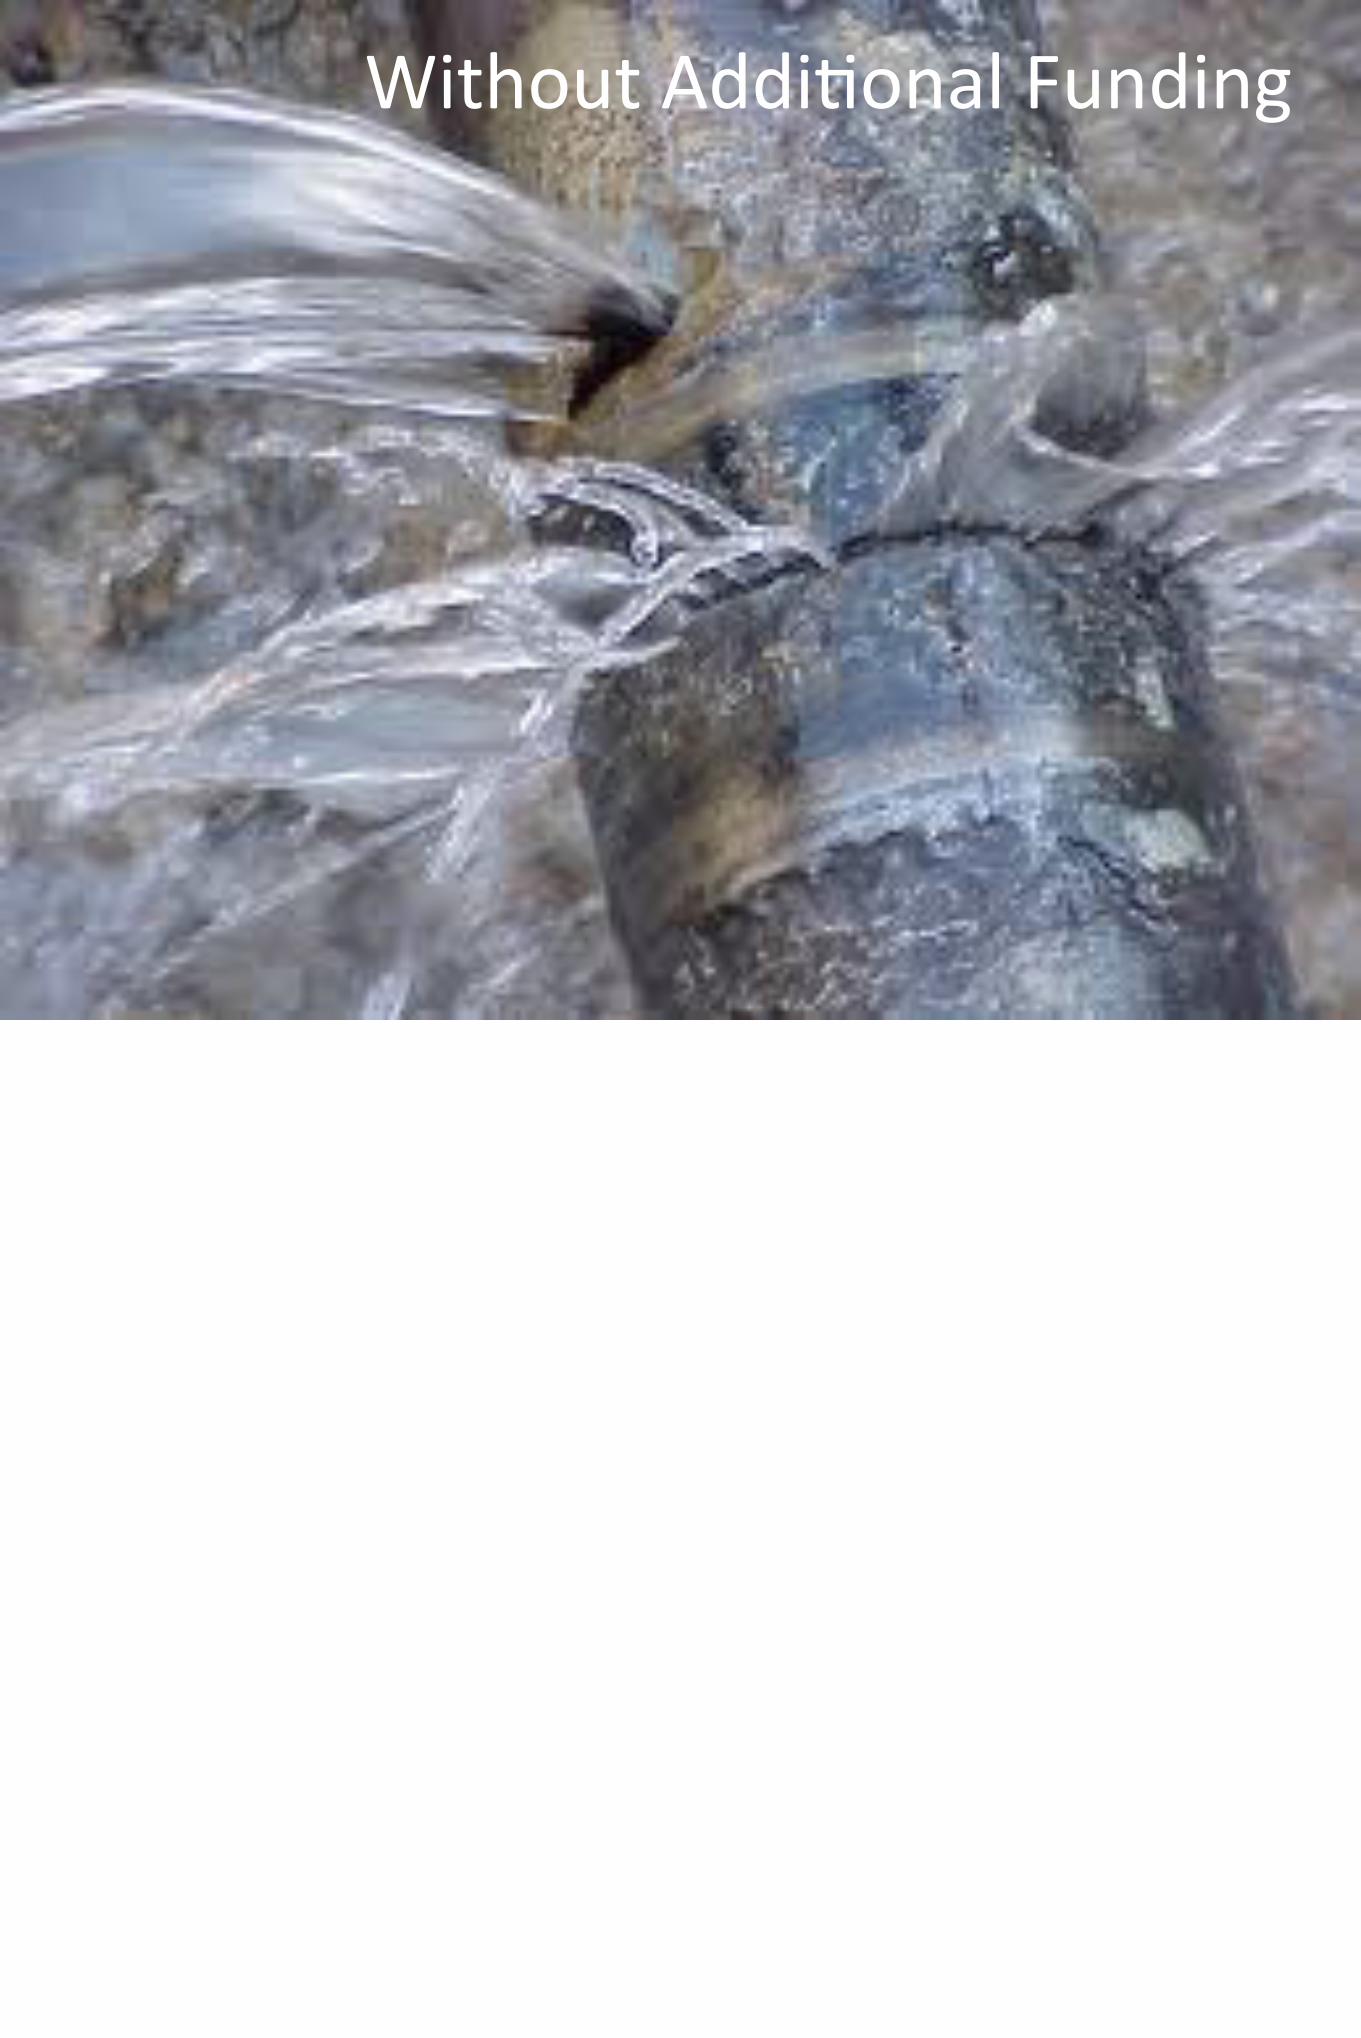
Without Addi%onal Funding
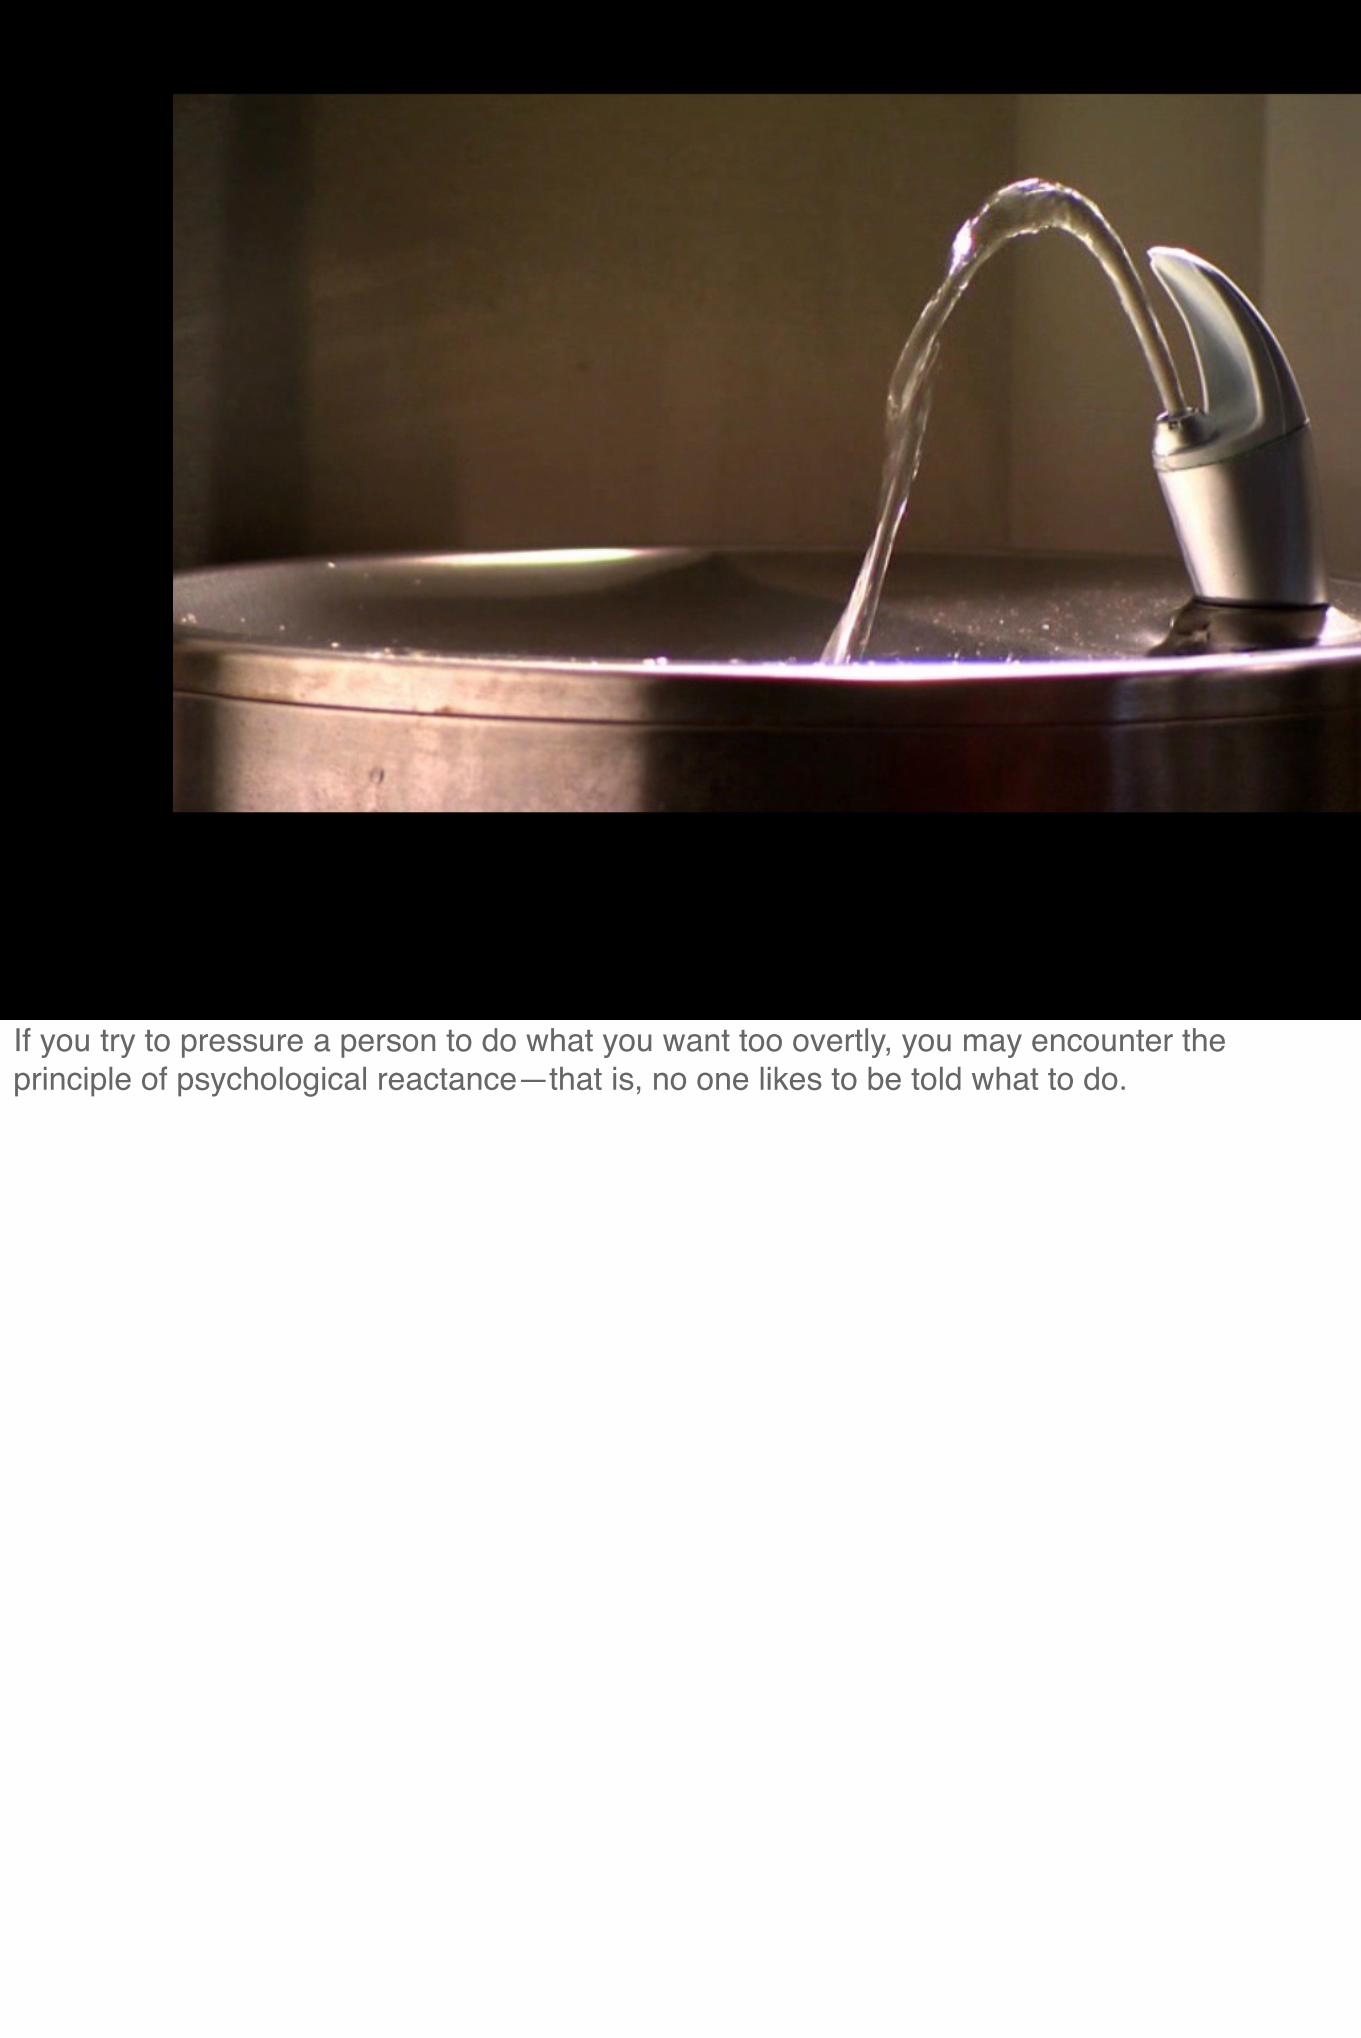
If you try to pressure a person to do what you want too overtly, you may encounter the principle of psychological reactance—that is, no one likes to be told what to do.