Embed Size (px)
Citation preview
IBM Global Business Services InsuranceExecutive Report
IBM Institute for Business Value
Powerful interaction pointsSaying goodbye to the channel
IBM Institute for Business ValueIBM Global Business Services, through the IBM Institute for Business Value, develops fact-based strategic insights for senior executives around critical public and private sector issues. This executive report is based on an in-depth study by the Institute’s research team. It is part of an ongoing commitment by IBM Global Business Services to provide analysis and viewpoints that help companies realize business value. You may contact the authors or send an e-mail to [email protected] for more information. Additional studies from the IBM Institute for Business Value can be found at ibm.com/iibv
About I.VW University of St. GallenI.VW (Institute for Insurance Economics) is a leading European university research center for risk management and insurance topics. For over 50 years, its activities have focused on monitoring trends and strategic challenges of the insurance industry. In addition to scientific research and teaching, I.VW regularly performs top executive education programs on an international level.
Introduction
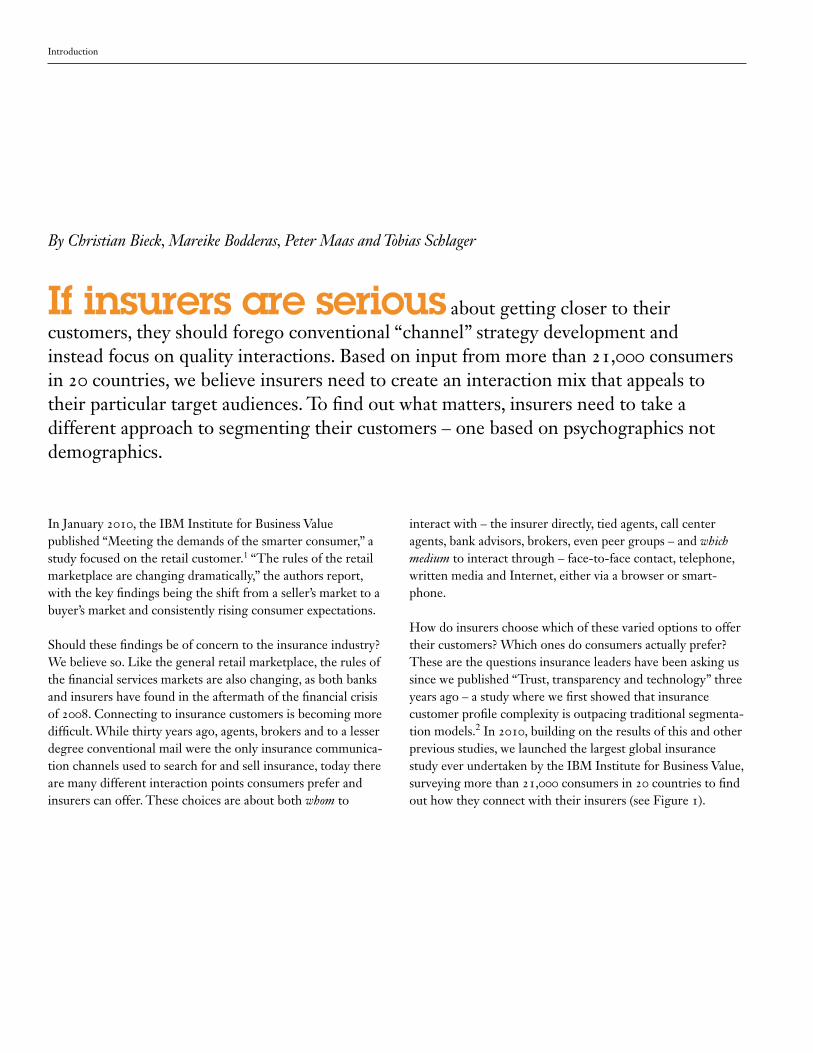
If insurers are serious about getting closer to their customers, they should forego conventional “channel” strategy development and instead focus on quality interactions. Based on input from more than 21,000 consumers in 20 countries, we believe insurers need to create an interaction mix that appeals to their particular target audiences. To find out what matters, insurers need to take a different approach to segmenting their customers – one based on psychographics not demographics.
In January 2010, the IBM Institute for Business Value published “Meeting the demands of the smarter consumer,” a study focused on the retail customer.1 “The rules of the retail marketplace are changing dramatically,” the authors report, with the key findings being the shift from a seller’s market to a buyer’s market and consistently rising consumer expectations.
Should these findings be of concern to the insurance industry? We believe so. Like the general retail marketplace, the rules of the financial services markets are also changing, as both banks and insurers have found in the aftermath of the financial crisis of 2008. Connecting to insurance customers is becoming more difficult. While thirty years ago, agents, brokers and to a lesser degree conventional mail were the only insurance communica-tion channels used to search for and sell insurance, today there are many different interaction points consumers prefer and insurers can offer. These choices are about both whom to
interact with – the insurer directly, tied agents, call center agents, bank advisors, brokers, even peer groups – and which medium to interact through – face-to-face contact, telephone, written media and Internet, either via a browser or smart-phone.
How do insurers choose which of these varied options to offer their customers? Which ones do consumers actually prefer? These are the questions insurance leaders have been asking us since we published “Trust, transparency and technology” three years ago – a study where we first showed that insurance customer profile complexity is outpacing traditional segmenta-tion models.2 In 2010, building on the results of this and other previous studies, we launched the largest global insurance study ever undertaken by the IBM Institute for Business Value, surveying more than 21,000 consumers in 20 countries to find out how they connect with their insurers (see Figure 1).
By Christian Bieck, Mareike Bodderas, Peter Maas and Tobias Schlager
2 Powerful interaction points
When thinking about how to connect with consumers, insurers – and consultants – often talk about the “channel strategy,” but this terminology is indicative of the problem. A “channel” infers a one-way communication from insurer to customer, and today’s customers don’t think that way. Perhaps the strongest message from our survey is that consumers don’t want infor-
mation to be channeled; they want access. They want to interact with their providers. In this paper, we will be talking about interaction points. Connecting to the insurer by phone is an interaction point, as are emails to the broker, meetings with the tied agent and even clickthroughs on the website of an aggregator that provides independent insurance comparisons.
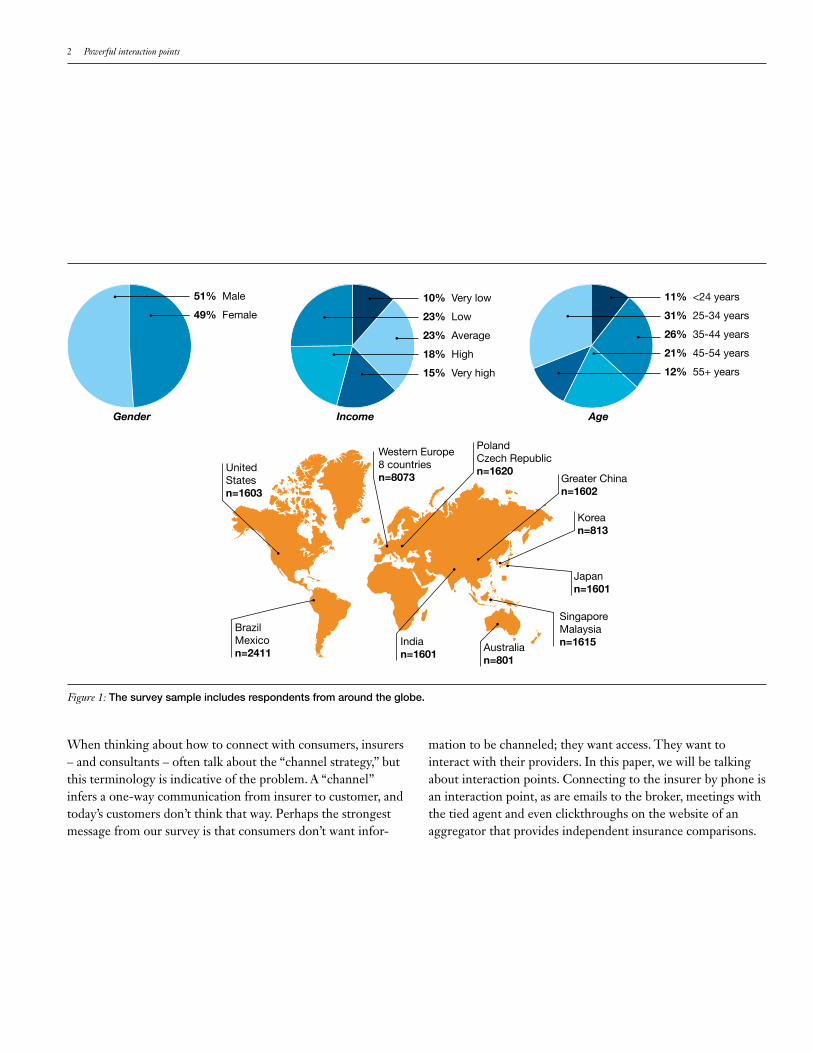
Figure 1: The survey sample includes respondents from around the globe.
51% Male
49% Female
Gender
10% Very low
23% Low
23% Average
18% High
15% Very high
11% <24 years
31% 25-34 years
26% 35-44 years
21% 45-54 years
12% 55+ years
Income Age
United Statesn=1603
BrazilMexicon=2411
Western Europe8 countriesn=8073
PolandCzech Republicn=1620
Indian=1601
Australian=801
SingaporeMalaysian=1615
Japann=1601
Korean=813
Greater Chinan=1602
IBM Global Business Services 3
What else did we learn by surveying these 21,740 consumers?
• Customers are becoming harder to satisfy and harder to maintain, and generally, they still don’t trust the insurance industry. As we have reported in previous studies, we believe that without specific efforts by the insurance industry to change this perception, it is not going to change.3
• Consumers prefer interaction point choices. And while there is no comparable substitute for insurance itself, consumers can and will switch insurers if their preferred interaction points are not available.
• Despite the commonly held view that the web is all that matters now, consumers often prefer personal interaction. Insurance is still a product that relies on personal trust – people want to buy from people. Our research indicates that personal interactions – with tied agents, brokers or bank advisors – lead to higher loyalty and ultimately, higher per-customer revenue.
Insurance has shifted from a seller’s to a buyer’s market. And while modern consumers are willing to buy, it is not all about price, as is the pervasive myth. Insurers also have to provide quality service and reach customers with the right interaction mix.
Research methodologyFor this study, the IBM Institute for Business Value and the I.VW Institute of Insurance Economics of the University of St. Gallen, Switzerland, gathered the responses of 21,740 consumers from 20 countries globally. Sample size was generally 800 respondents per country. For some of the larger markets, we collected additional demographic charac-teristics like region/state and ethnicity; in these markets, we doubled the sample size to 1,600 respondents. The survey was conducted online, with quotas guaranteeing a represen-tative cross-section of the total population.
To determine the usage of and the attitude toward insurance interaction points, we concentrated on actual searches and purchases over the past five years, with respondents evalu-ating the channels used on several dimensions. In addition, we asked about future channel usage with specific questions on new media usage, including smartphones and social media.
A specific upfront question about the type of insurance allowed us to evaluate Life and non-Life insurance sepa-rately. Health insurance was excluded due to wide national variances in the way interaction occurs in that sub-industry. The survey was consumer-oriented and focused exclusively on retail insurance.
Consumers don’t want information to be channeled; they want to interact with their providers.
4 Powerful interaction points
Getting closer to the customerThe growth challengeFor the first few years of the new millennium, cost take-out and consolidation have been the main focus of most insurers. Cost ratios fell while industry concentration rose sharply, fueled by strong capitalization and a wave of demutualizations.4
Since 2007, the focus has been changing. In real terms, premiums have declined for the first time since 1980, dropping by 3.8 percent globally in 2008 and 1.1 percent in 2009. (Overall however, the strong decline in the industrialized economies was mitigated by growth in the emerging markets, with China leading the way with 14.6 percent growth in 2009.)5 While profitability – especially in Property & Casualty – has remained stable during this timeframe, insurance CEOs are now asking: How can we achieve growth?
For 90 percent of insurance CEOs, the core answer to the growth challenge is to get closer to their customers.6 For today’s C-suite executives or board members, this may be an unusual notion since the insurance industry was firmly a seller’s market for much of their careers. As the CEO of a large European insurer stated in an interview for a previous IBM Institute for Business Value study, “Convenience for customers is new to the insurance industry. We are behind other industries here.”7 Historically, the only in-depth view insurers have taken of their (actual and potential) customer base has been through product-tinted demographic lenses. Their aim was less in understanding customer needs to enable better overall customer experience in search, purchase and service, but more to design products tailored to a particular demographic that a well-trained sales force then sold.
In mature and close-to-saturated markets, merely selling whatever product insurers develop is no longer an effective strategy. Insurers have to understand consumer behavior and their – often unvoiced – needs. The question of how to grow becomes one of how to interact effectively with customers in a way that meets the needs of both the customer and the insurer.
In emerging markets, effective interaction is also key to growth, but for somewhat different reasons. In these markets, insurers are challenged with how to even reach these customers and how to do so before – or better than – their competitors do.
Effectively reaching customers may be the first obstacle, but keeping them is proving to be another challenge.
The loyalty trapInsurance penetration (total insurance premiums as a percentage of GDP) has remained stable over the last year.8 Unfortunately for insurers, customer loyalty has not. In the current study, we measured customer loyalty in two ways: by how frequently customers switched their providers in the last five years and by the number of insurers they contract with for the various lines. Even taking into account that some insurers do not offer all lines to all consumers, loyalty by these measures has fallen. For example, in 2008, 42 percent of consumers said they maintained coverage for all their needs with one insurer – two years later that number has dropped to 31 percent. During this same time period, the number of consumers contracting with three or more insurers has risen by 20 percent. It is no surprise that the reporting of cancellation rates has virtually disappeared from the annual reports of today’s major insurers. Our research indicates that this rate is steadily rising and is currently between 4 and 5 percent overall – too high, considering the cost of acquiring new customers.
IBM Global Business Services 5
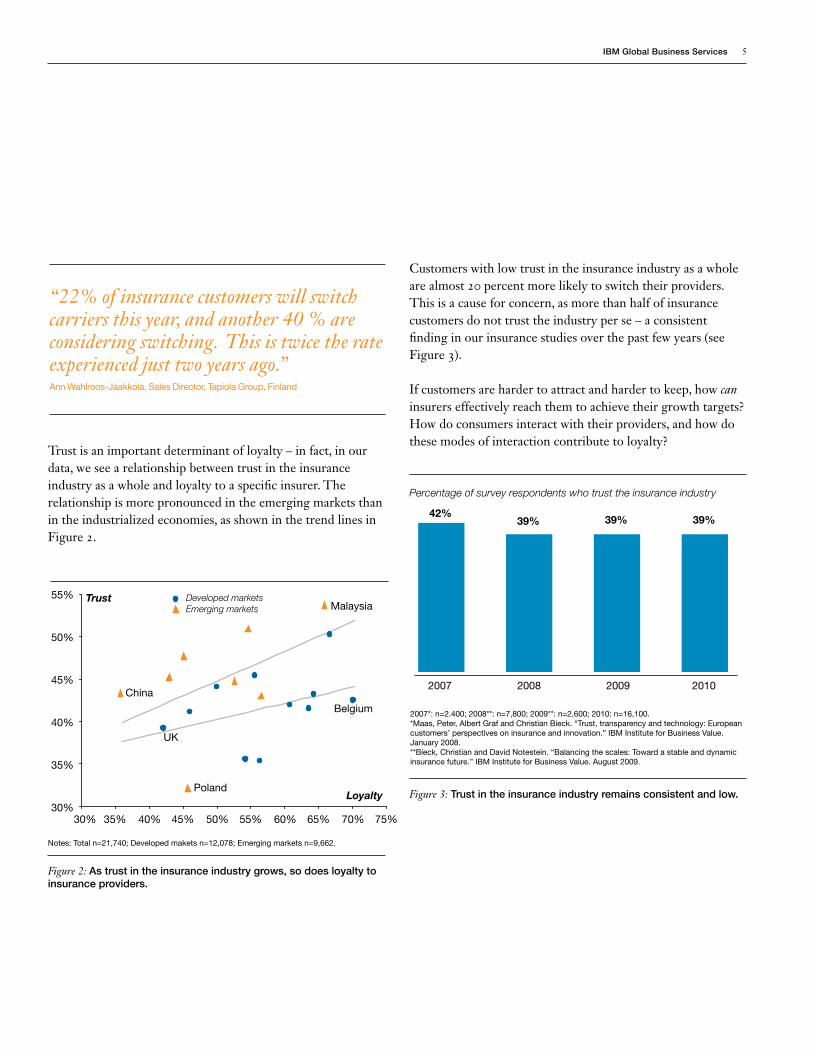
Trust is an important determinant of loyalty – in fact, in our data, we see a relationship between trust in the insurance industry as a whole and loyalty to a specific insurer. The relationship is more pronounced in the emerging markets than in the industrialized economies, as shown in the trend lines in Figure 2.
“22% of insurance customers will switch carriers this year, and another 40 % are considering switching. This is twice the rate experienced just two years ago.” Ann Wahlroos-Jaakkola, Sales Director, Tapiola Group, Finland
Customers with low trust in the insurance industry as a whole are almost 20 percent more likely to switch their providers. This is a cause for concern, as more than half of insurance customers do not trust the industry per se – a consistent finding in our insurance studies over the past few years (see Figure 3).
If customers are harder to attract and harder to keep, how can insurers effectively reach them to achieve their growth targets? How do consumers interact with their providers, and how do these modes of interaction contribute to loyalty?
55%
50%
45%
40%
35%
30%30% 35% 40% 45% 50% 55% 60% 65% 70% 75%
Notes: Total n=21,740; Developed makets n=12,078; Emerging markets n=9,662.
Figure 2: As trust in the insurance industry grows, so does loyalty to insurance providers.
Trust
Loyalty
China
UK
Malaysia
Belgium
Poland
Developed marketsEmerging markets
2007
2007*: n=2.400; 2008**: n=7,800; 2009**: n=2,600; 2010: n=16,100.*Maas, Peter, Albert Graf and Christian Bieck. “Trust, transparency and technology: European customers’ perspectives on insurance and innovation.” IBM Institute for Business Value. January 2008.**Bieck, Christian and David Notestein. “Balancing the scales: Toward a stable and dynamic insurance future.” IBM Institute for Business Value. August 2009.
Figure 3: Trust in the insurance industry remains consistent and low.
2008 2009 2010
42%39% 39% 39%
Percentage of survey respondents who trust the insurance industry

6 Powerful interaction points
The customer of the future – diverse and multimodalHow customers searchAs we stated in 2008 in “Trust, transparency and technology,” customers have a broad range of attitudes about insurance and want to be treated as unique individuals. A one-size-fits-all approach is unlikely to work, whether it is related to marketing, products or service.9
In this study, we sought to verify whether this finding about attitudes toward insurance in general is transferable to consumers’ attitudes toward interaction with insurers. The short answer: It is. Mirroring findings from other industries, insurance customers have become truly “multimodal.” Slightly
more than 20 percent of consumers use only a single point of interaction for searching, while another 20 percent of respondents say they use more than four different interaction points to search for insurance. Our research shows there are five predominant channels for information gathering: number one is the insurer’s own website (49.4 percent) followed by interaction with the tied agent (47.9 percent) and peer groups like friends or family (46.4 percent). Following closely with just below a 40 percent response rate, we find independent agents or brokers (39.3 percent) and, finally, the websites of aggregators or independent comparison providers (35.5 percent). While the remaining interaction points are being used less frequently (see Figure 4), insurers should consider using them since their totals represent substantial potential communication.
Website insurer
Personal contact with a tied agent
People I know personally (friends, family, employer, etc.)
Personal contact with an independent agent or broker
Website independent comparison provider
Personal contact with a bank advisor
Advertisements (print, TV)
Forum, discussion group or social media (e.g., LinkedIn)
Website other
Journals (consumer test, business)
Conventional mail
Smartphone applications
49.4
47.9
46.4
39.3
35.5
22.4
14.4
13.2
12.6
10.4
7.7
1.0
Figure 4: Consumers use a variety of interaction points to search for insurance.
Percentage of survey respondents
IBM Global Business Services 7
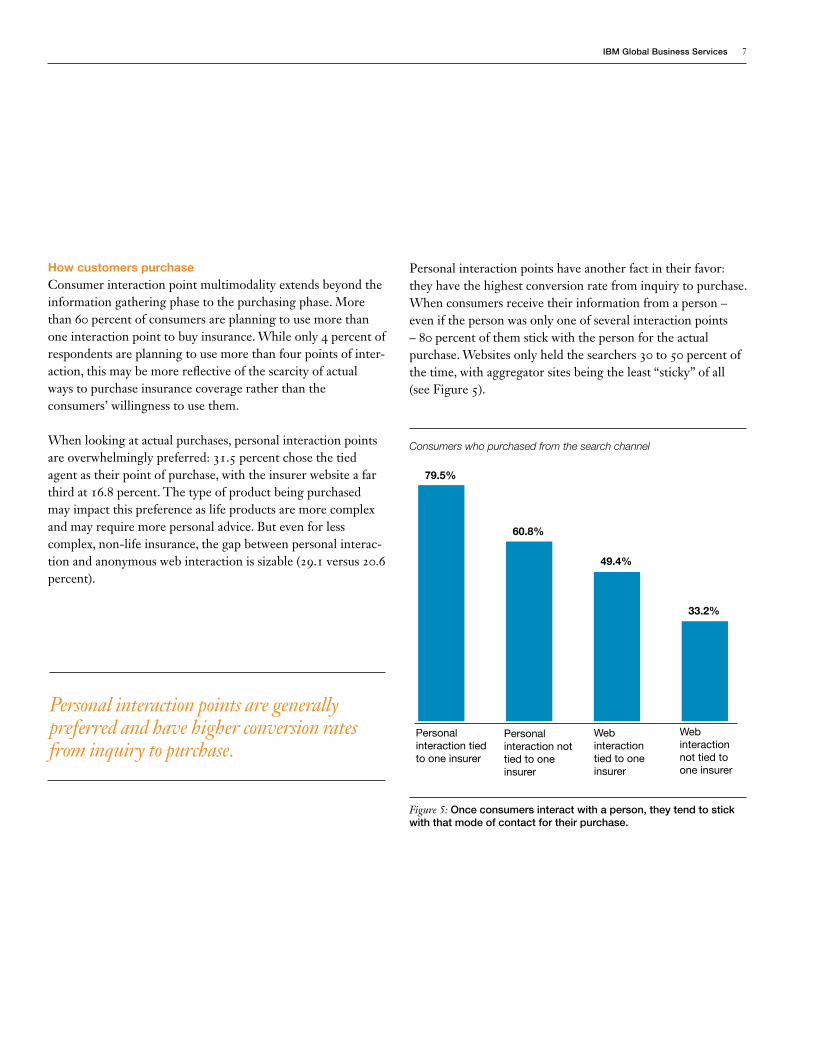
How customers purchaseConsumer interaction point multimodality extends beyond the information gathering phase to the purchasing phase. More than 60 percent of consumers are planning to use more than one interaction point to buy insurance. While only 4 percent of respondents are planning to use more than four points of inter-action, this may be more reflective of the scarcity of actual ways to purchase insurance coverage rather than the consumers’ willingness to use them.
When looking at actual purchases, personal interaction points are overwhelmingly preferred: 31.5 percent chose the tied agent as their point of purchase, with the insurer website a far third at 16.8 percent. The type of product being purchased may impact this preference as life products are more complex and may require more personal advice. But even for less complex, non-life insurance, the gap between personal interac-tion and anonymous web interaction is sizable (29.1 versus 20.6 percent).
Personal interaction tied to one insurer
Figure 5: Once consumers interact with a person, they tend to stick with that mode of contact for their purchase.
79.5%
60.8%
49.4%
33.2%
Consumers who purchased from the search channel
Personal interaction not tied to one insurer
Web interaction tied to one insurer
Web interaction not tied to one insurer
Personal interaction points are generally preferred and have higher conversion rates from inquiry to purchase.
Personal interaction points have another fact in their favor: they have the highest conversion rate from inquiry to purchase. When consumers receive their information from a person – even if the person was only one of several interaction points – 80 percent of them stick with the person for the actual purchase. Websites only held the searchers 30 to 50 percent of the time, with aggregator sites being the least “sticky” of all (see Figure 5).

8 Powerful interaction points
The consumer of the future as a situational beingOur data has pointed to a fact that conventional wisdom has generally ignored, but which observers of the “consumer of the future” have highlighted for some time: in the modern world, the consumer is beginning to tailor behaviors and atti-tudes not only to an underlying value system, but also to the current situation. The Copenhagen Institute for Future Studies calls this the Situational Individual – or “Situal.”10
How do we see this phenomenon in our data? Looking at the general usage of emerging media, such as smartphone apps, about 40 percent of respondents in the United States say they are comfortable with these media and that they gener-ally meet their needs. This roughly corresponds with actual smartphone usage in the United States.11 Yet, less than 4 percent of our U.S. survey respondents can imagine using the smartphone for insurance searching or purchasing, indi-cating an insurance decision is not a time when the Situal would use a smartphone.
Does this mean insurers should ignore the smartphone as an interaction point? We do not believe so. A large part of the disparity may be due to the current perception of the insur-ance industry as less innovative – a view that the industry itself can change by displaying greater innovativeness.12 Also, given the rapid rate of technological advance, consumer interaction preferences can and will change just as rapidly. Becoming flexible enough to incorporate new channels quickly into their interaction strategies will be crit-ical for insurers to stay in contact with the future consumer.
The user experienceThe quality of the experience consumers have with interaction points influences their satisfaction and ultimately their behavior. What improvements would insurers need to make to increase the customers’ perceived value? To answer that question, we asked our respondents to rate the interaction points on several criteria, which we then combined, per statistical factor analysis, into a set of four “channel dimen-sions.”
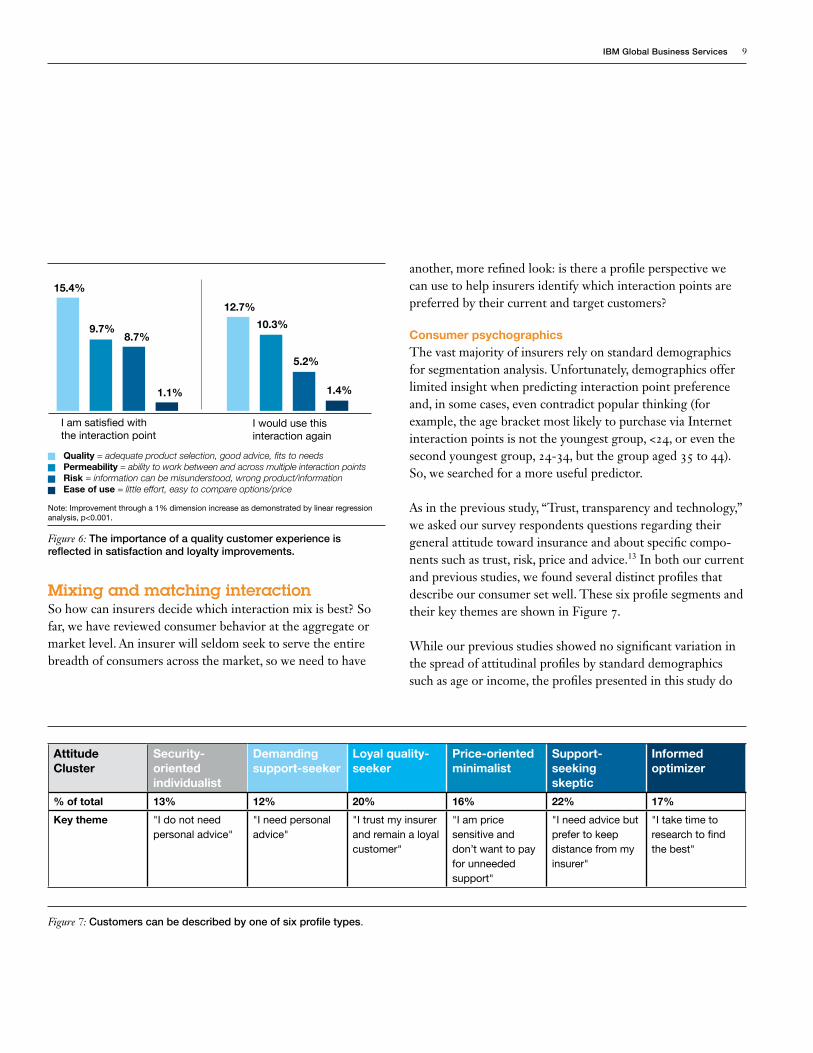
This analysis provides some clear insight on where to focus improvement efforts: the highest impact can be achieved by an improvement in quality, which consumers associate with a good selection of products and good or helpful advice from the channel. A mere 1 percent increase in perceived quality of the interaction would raise customer satisfaction with the interac-tion point by 15.4 percent, and increase the likelihood of repeat use by 12.7 percent. Interestingly, the same 1 percent increase in ease of use would have very little impact on satisfaction or likelihood of repeat business, as seen in Figure 6.
Figure 6 also reinforces the finding of preference for interac-tion point multimodality since permeability (i.e., the ease of combining and switching channels) is an important criterion both for satisfaction and repeat usage.
The research makes it clear that insurers need to strive for a mix of interaction points to meet the needs of modern consumers who prefer to use a variety of interaction points. At the same time, mix alone is not enough; the interaction must be experienced as high quality.
IBM Global Business Services 9
Mixing and matching interactionSo how can insurers decide which interaction mix is best? So far, we have reviewed consumer behavior at the aggregate or market level. An insurer will seldom seek to serve the entire breadth of consumers across the market, so we need to have
another, more refined look: is there a profile perspective we can use to help insurers identify which interaction points are preferred by their current and target customers?
Consumer psychographicsThe vast majority of insurers rely on standard demographics for segmentation analysis. Unfortunately, demographics offer limited insight when predicting interaction point preference and, in some cases, even contradict popular thinking (for example, the age bracket most likely to purchase via Internet interaction points is not the youngest group, <24, or even the second youngest group, 24-34, but the group aged 35 to 44). So, we searched for a more useful predictor.
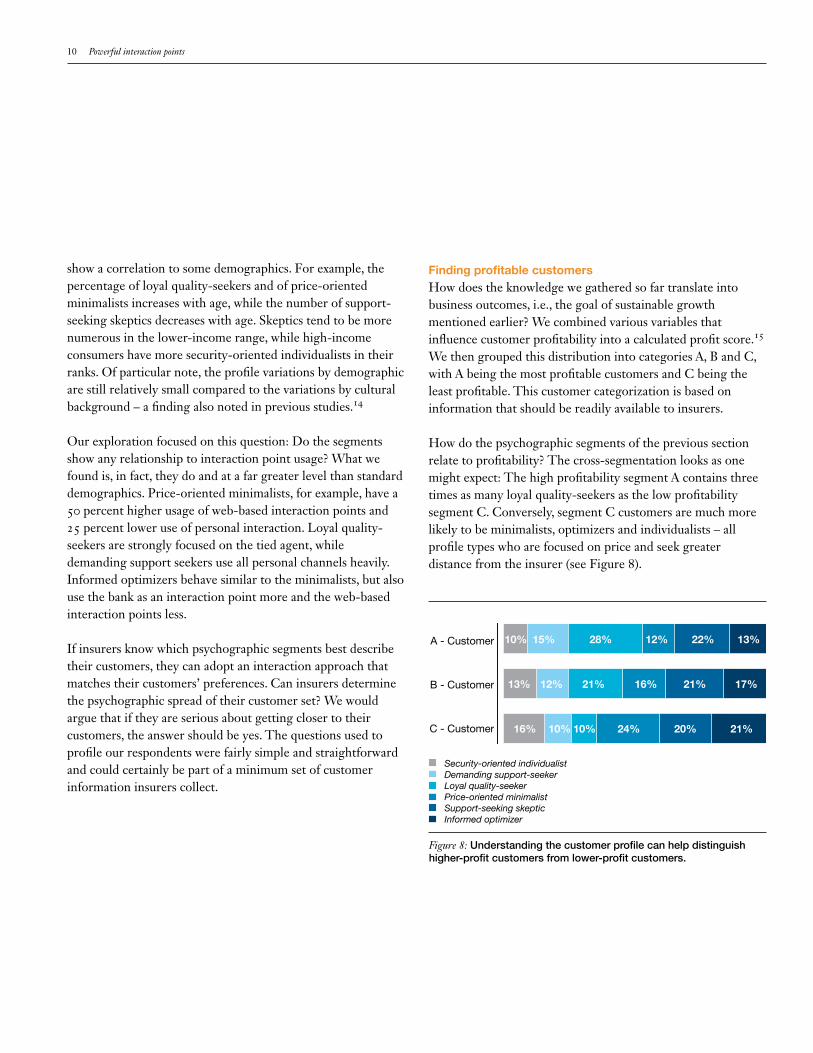
As in the previous study, “Trust, transparency and technology,” we asked our survey respondents questions regarding their general attitude toward insurance and about specific compo-nents such as trust, risk, price and advice.13 In both our current and previous studies, we found several distinct profiles that describe our consumer set well. These six profile segments and their key themes are shown in Figure 7.
While our previous studies showed no significant variation in the spread of attitudinal profiles by standard demographics such as age or income, the profiles presented in this study do
I am satisfied with the interaction point
Figure 6: The importance of a quality customer experience is reflected in satisfaction and loyalty improvements.
15.4%
10.3%
12.7%
5.2%
I would use this interaction again
9.7%8.7%
1.1% 1.4%
Quality = adequate product selection, good advice, fits to needsPermeability = ability to work between and across multiple interaction pointsRisk = information can be misunderstood, wrong product/informationEase of use = little effort, easy to compare options/price
Note: Improvement through a 1% dimension increase as demonstrated by linear regression analysis, p<0.001.
Figure 7: Customers can be described by one of six profile types.
Attitude Cluster
Security-oriented individualist
Demanding support-seeker
Loyal quality-seeker
Price-oriented minimalist
Support-seeking skeptic
Informed optimizer
% of total 13% 12% 20% 16% 22% 17%
Key theme "I do not need personal advice"
"I need personal advice"
"I trust my insurer and remain a loyal customer"
"I am price sensitive and don’t want to pay for unneeded support"
"I need advice but prefer to keep distance from my insurer"
"I take time to research to find the best"
10 Powerful interaction points
show a correlation to some demographics. For example, the percentage of loyal quality-seekers and of price-oriented minimalists increases with age, while the number of support-seeking skeptics decreases with age. Skeptics tend to be more numerous in the lower-income range, while high-income consumers have more security-oriented individualists in their ranks. Of particular note, the profile variations by demographic are still relatively small compared to the variations by cultural background – a finding also noted in previous studies.14
Our exploration focused on this question: Do the segments show any relationship to interaction point usage? What we found is, in fact, they do and at a far greater level than standard demographics. Price-oriented minimalists, for example, have a 50 percent higher usage of web-based interaction points and 25 percent lower use of personal interaction. Loyal quality-seekers are strongly focused on the tied agent, while demanding support seekers use all personal channels heavily. Informed optimizers behave similar to the minimalists, but also use the bank as an interaction point more and the web-based interaction points less.
If insurers know which psychographic segments best describe their customers, they can adopt an interaction approach that matches their customers’ preferences. Can insurers determine the psychographic spread of their customer set? We would argue that if they are serious about getting closer to their customers, the answer should be yes. The questions used to profile our respondents were fairly simple and straightforward and could certainly be part of a minimum set of customer information insurers collect.
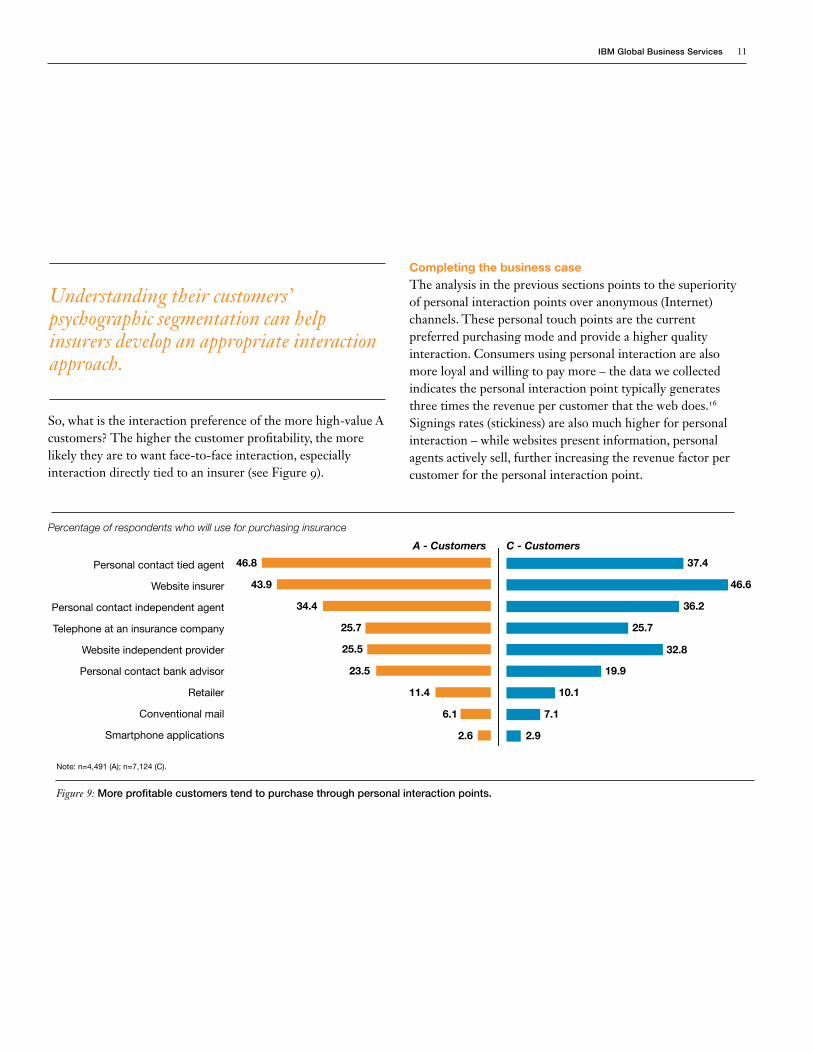
Finding profitable customersHow does the knowledge we gathered so far translate into business outcomes, i.e., the goal of sustainable growth mentioned earlier? We combined various variables that influence customer profitability into a calculated profit score.15 We then grouped this distribution into categories A, B and C, with A being the most profitable customers and C being the least profitable. This customer categorization is based on information that should be readily available to insurers.
How do the psychographic segments of the previous section relate to profitability? The cross-segmentation looks as one might expect: The high profitability segment A contains three times as many loyal quality-seekers as the low profitability segment C. Conversely, segment C customers are much more likely to be minimalists, optimizers and individualists – all profile types who are focused on price and seek greater distance from the insurer (see Figure 8).
A - Customer
B - Customer
C - Customer
10% 15% 28% 12% 22% 13%
13% 12% 21% 16% 21% 17%
16% 10% 10% 24% 20% 21%
Figure 8: Understanding the customer profile can help distinguish higher-profit customers from lower-profit customers.
Security-oriented individualistDemanding support-seekerLoyal quality-seekerPrice-oriented minimalistSupport-seeking skepticInformed optimizer
IBM Global Business Services 11
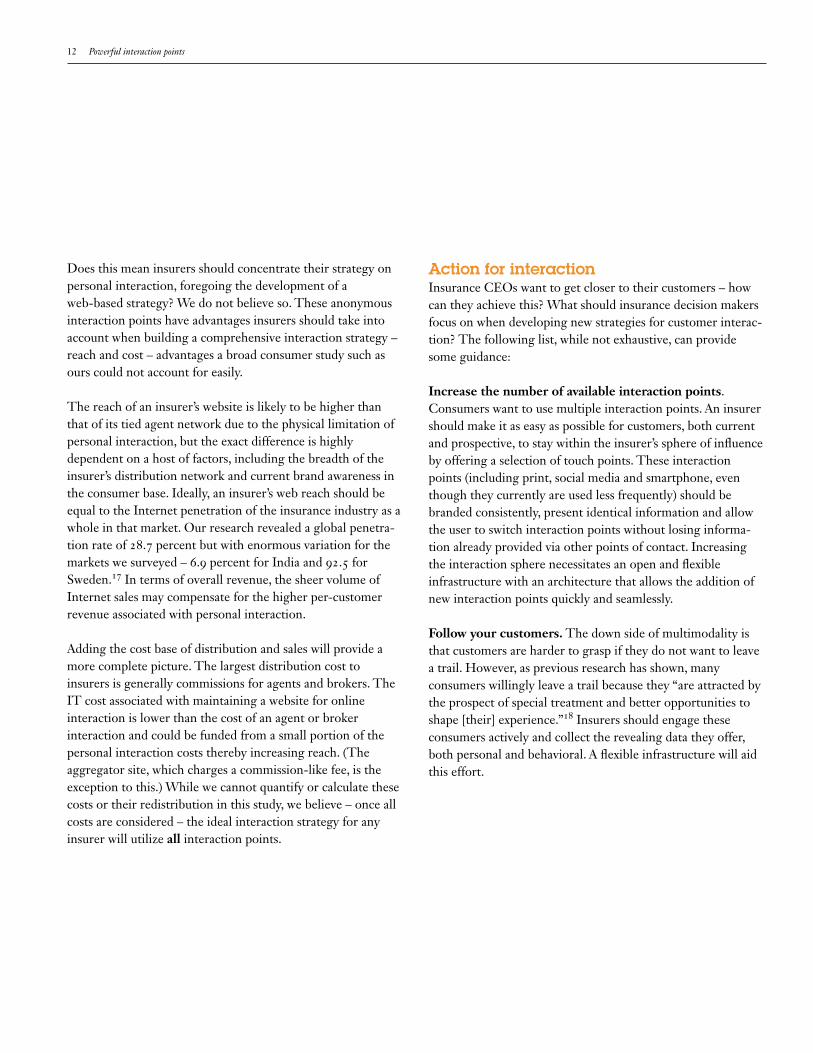
So, what is the interaction preference of the more high-value A customers? The higher the customer profitability, the more likely they are to want face-to-face interaction, especially interaction directly tied to an insurer (see Figure 9).
Completing the business caseThe analysis in the previous sections points to the superiority of personal interaction points over anonymous (Internet) channels. These personal touch points are the current preferred purchasing mode and provide a higher quality interaction. Consumers using personal interaction are also more loyal and willing to pay more – the data we collected indicates the personal interaction point typically generates three times the revenue per customer that the web does.16 Signings rates (stickiness) are also much higher for personal interaction – while websites present information, personal agents actively sell, further increasing the revenue factor per customer for the personal interaction point.
Understanding their customers’ psychographic segmentation can help insurers develop an appropriate interaction approach.
A - Customers
Personal contact tied agent
Website insurer
Personal contact independent agent
Telephone at an insurance company
Website independent provider
Personal contact bank advisor
Retailer
Conventional mail
Smartphone applications
46.8 37.4
43.9 46.6
34.4 36.2
25.7 25.7
25.5 32.8
23.5 19.9
11.4 10.1
6.1 7.1
2.6 2.9
Figure 9: More profitable customers tend to purchase through personal interaction points.
C - Customers
Percentage of respondents who will use for purchasing insurance
Note: n=4,491 (A); n=7,124 (C).
12 Powerful interaction points
Does this mean insurers should concentrate their strategy on personal interaction, foregoing the development of a web-based strategy? We do not believe so. These anonymous interaction points have advantages insurers should take into account when building a comprehensive interaction strategy – reach and cost – advantages a broad consumer study such as ours could not account for easily.
The reach of an insurer’s website is likely to be higher than that of its tied agent network due to the physical limitation of personal interaction, but the exact difference is highly dependent on a host of factors, including the breadth of the insurer’s distribution network and current brand awareness in the consumer base. Ideally, an insurer’s web reach should be equal to the Internet penetration of the insurance industry as a whole in that market. Our research revealed a global penetra-tion rate of 28.7 percent but with enormous variation for the markets we surveyed – 6.9 percent for India and 92.5 for Sweden.17 In terms of overall revenue, the sheer volume of Internet sales may compensate for the higher per-customer revenue associated with personal interaction.
Adding the cost base of distribution and sales will provide a more complete picture. The largest distribution cost to insurers is generally commissions for agents and brokers. The IT cost associated with maintaining a website for online interaction is lower than the cost of an agent or broker interaction and could be funded from a small portion of the personal interaction costs thereby increasing reach. (The aggregator site, which charges a commission-like fee, is the exception to this.) While we cannot quantify or calculate these costs or their redistribution in this study, we believe – once all costs are considered – the ideal interaction strategy for any insurer will utilize all interaction points.
Action for interactionInsurance CEOs want to get closer to their customers – how can they achieve this? What should insurance decision makers focus on when developing new strategies for customer interac-tion? The following list, while not exhaustive, can provide some guidance:
Increase the number of available interaction points. Consumers want to use multiple interaction points. An insurer should make it as easy as possible for customers, both current and prospective, to stay within the insurer’s sphere of influence by offering a selection of touch points. These interaction points (including print, social media and smartphone, even though they currently are used less frequently) should be branded consistently, present identical information and allow the user to switch interaction points without losing informa-tion already provided via other points of contact. Increasing the interaction sphere necessitates an open and flexible infrastructure with an architecture that allows the addition of new interaction points quickly and seamlessly.
Follow your customers. The down side of multimodality is that customers are harder to grasp if they do not want to leave a trail. However, as previous research has shown, many consumers willingly leave a trail because they “are attracted by the prospect of special treatment and better opportunities to shape [their] experience.”18 Insurers should engage these consumers actively and collect the revealing data they offer, both personal and behavioral. A flexible infrastructure will aid this effort.
IBM Global Business Services 13
Use customer analytics. In addition to the customers’ data trail, massive amounts of customer information are available to the insurer. Unfortunately, often it is only the data directly related to actual policies that is explicit and stored – attitudinal and behavioral data remains confined to the minds of the insurer’s sales people and are seldom used for strategic purposes. It is a one-time effort to make this data explicit, and doing so would allow an insurer to reproduce our psycho-graphic segmentation. This more telling segmentation will allow insurers to compare current interaction point offerings to the preferred mix of current and targeted customers.
Improve interaction quality. The several aspects of interac-tion quality we examined – good advice, an adequate range of products matching actual consumer needs and finally fast and efficient service in the moment of truth – will strongly determine whether customers will use the particular interac-tion point again and, perhaps more importantly, whether they will become advocates and recommend it to their peers. However, the multiplier works both ways – an interaction point of bad quality is worse than none at all if it creates antagonistic consumers. How exactly can an insurer improve quality? Ask its customers. And in order to determine the quality requirements of each interaction point, insurers will need customer data analytics.
Build a comprehensive business case. An insurer’s stake-holders will want to understand the bottom-line effect of adding interaction points, for example, another web channel, but they also will want to understand the business implications of the overall mix. The calculations referenced in the previous section are revenue measurement starting points. A more comprehensive revenue calculation is possible with sufficient customer analytics. The cost-side calculation is also possible. To make it comprehensive, a thorough assessment of all agent, broker and other classical interaction costs – not just commis-sions – should be considered. For many insurers, there is strong internal opposition to such transparency. We would argue that proponents of the personal channels have nothing to fear; for as this research shows, the benefits of including personal interactions as part of a comprehensive business case compels insurers to keep them as an integral part of the mix.
The key to succeeding with all of the above is flexibility and the smart use of analytics. The world has never been as complex and full of constant and rapid change as today – and the evolving preferences of tomorrow’s consumer are part of this complexity.
As highlighted in the “Meeting the demands of the Smarter Consumer” study report: “All consumers – whatever their nationalities, ages or socioeconomic backgrounds – will expect ubiquitous access to the information, products and services they want… Smarter consumers will thus produce smarter retailers, retailers that are better equipped to win a bigger share of the minds, hearts and wallets of the consumers they delight.”19 Insurers would do well to heed these words. “All consumers” are their consumers, and the starting point for being a smarter insurer and delighting customers is the right mix of interaction points.
To get closer to customers, insurers should increase interaction points, follow customers, use analytics, improve interaction quality and build a comprehensive business case.
14 Powerful interaction points
To learn more about this IBM Institute for Business Value study, please contact us at [email protected]. For a full catalog of our research, visit:
ibm.com/iibv
Be among the first to receive the latest insights from the IBM Institute for Business Value. Subscribe to IdeaWatch, our monthly e-newsletter featuring executive reports that offer strategic insights and recommendations based on IBV research:
ibm.com/gbs/ideawatch/subscribe
About the authors Christian Bieck is the global insurance leader for the IBM Institute for Business Value. Christian is an economist by training and worked in various roles in the insurance industry in Europe before joining IBM as a process consultant and researcher. Christian is a frequent speaker on thought leader-ship and innovation at insurance events and workshops. He has authored various papers on insurance trends and implications, both for the IBM Institute for Business Value and for interna-tional insurance industry publications. He can be reached at [email protected].
Mareike Bodderas is research associate and project leader at the Institute of Insurance Economics at the University of St. Gallen. Mareike is responsible for applied research projects within the Institute. She is doing research on service manage-ment and service marketing within the financial services industry. Mareike has presented on these topics at leading management and marketing conferences in America and Europe and is author of several papers in this field. She graduated with a degree in Sociology from the University of Bremen, Germany, and received her Ph.D. in Business Admin-istration from the University of St. Gallen, Switzerland. Mareike can be reached at [email protected].

IBM Global Business Services 15
Dr. Peter Maas is Professor for Service, Insurance and Risk Management at the University of St. Gallen. He is a member of the Executive Board of the Institute of Insurance Economics and serves as academic director in numerous top management seminars on an international level. Acting as a Research Director of the joint project “Customer Value in Service Indus-tries,” his research activities have for many years focused on strategy and transformation in the financial services industries as well as on integrated service management. He graduated and received his Ph.D. from the University of Cologne in Germany. He is also the author and editor of numerous books in the areas of behavioral finance, financial services strategies and customer value management. Peter can be reached at [email protected].
Tobias Schlager is project leader at the Institute of Insurance Economics at the University of St. Gallen. Tobias studied international business affairs, and is now pursuing his doctorate degree. Prior to this he worked on several consulting projects. Tobias’ research focus is marketing and strategy of financial services, with a specialization in customer value. Recently, he presented his research ideas at the La Londe conference in Service Management 2010 and the Strategic Management Society Annual Meeting 2010. He can be reached at [email protected].
The right partner for a changing worldAt IBM, we collaborate with our clients, bringing together business insight, advanced research and technology to give them a distinct advantage in today’s rapidly changing environment. Through our integrated approach to business design and execution, we help turn strategies into action. And with expertise in 17 industries and global capabilities that span 170 countries, we can help clients anticipate change and profit from new opportunities.
16 Powerful interaction points
Notes and references1 Schaefer, Melissa and Laura VanTine. “Meeting the
demands of the Smarter Consumer.” IBM Institute for Business Value. January 2010. http://www-935.ibm.com/services/us/gbs/bus/html/ibv-the-smarter-consumer.html?cntxt=a1000063
2 Maas, Peter, Albert Graf and Christian Bieck. “Trust, transparency and technology: European customers’ perspectives on insurance and innovation.” IBM Institute for Business Value. January 2008. https://www-935.ibm.com/services/us/gbs/bus/pdf/gbe03008-usen-02-insurancet3.pdf
3 Ibid.
4 “Getting together: Globals take the lead in life insurance M&A.” Swiss Re sigma. January 2006. http://media.swissre.com/documents/sigma1_2006_en.pdf
5 “World insurance in 2009: Premiums dipped, but industry capital improved.” Swiss Re sigma. February 2010. http://media.swissre.com/documents/sigma2_2010_en.pdf
6 “Capitalizing on Complexity: Insights from the Global Chief Executive Officer Study.” IBM Institute for Business Value. May 2010. http://www.ibm.com/CEOstudy2010
7 This anonymous quote came from an interview associated with the IBM Global CEO Study. “Capitalizing on Complexity: Insights from the Global Chief Executive Officer Study.” IBM Institute for Business Value. May 2010. http://www.ibm.com/CEOstudy2010
8 “World insurance in 2009: Premiums dipped, but industry capital improved.” Swiss Re sigma. February 2010. http://media.swissre.com/documents/sigma2_2010_en.pdf
9 Maas, Peter, Albert Graf and Christian Bieck. “Trust, transparency and technology: European customers’ perspectives on insurance and innovation.” IBM Institute for Business Value. January 2008. https://www-935.ibm.com/services/us/gbs/bus/pdf/gbe03008-usen-02-insurancet3.pdf
10 Kristensen, Af Henrik S. “The Situal is a Large-scale Consumer of (Good) Stories.” Copenhagen Institute for Future Studies. October 24, 2002. http://www.cifs.dk/scripts/artikel.asp?id=717
11 Gonsalves, Antone. “Android Phones Steal Market Share.” InformationWeek. April 7, 2010; Strategy Analytics, “Global Smartphone Sales Forecast by Country,” August and October 2009, as quoted from Vega, Ralph de la, “United States: Leading the Mobile Broadband Revolution,” Keynote Speech to CTIA Wireless Conference 2010; IBM Institute for Business Value analysis.
12 Bieck, Christian and Ake Freij. “Solving the innovation puzzle.” IBM Institute for Business Value, September 2010. http://www-935.ibm.com/services/us/gbs/thoughtleadership/ibv-banking-insurance-innovation.html?ca=rss_bcs
13 Maas, Peter, Albert Graf and Christian Bieck. “Trust, transparency and technology: European customers’ perspectives on insurance and innovation.” IBM Institute for Business Value. January 2008. https://www-935.ibm.com/services/us/gbs/bus/pdf/gbe03008-usen-02-insurancet3.pdf
14 Ibid; Bieck, Christian and David Notestein. “Balancing the scales: Toward a stable and dynamic insurance future.” IBM Institute for Business Value. August 2009. ftp://public.dhe.ibm.com/common/ssi/ecm/en/gbe03237usen/GBE03237USEN.PDF
15 Profitability calculation: The customer profitability index (CPI) shows the level of potential revenue from that customer. A high CPI shows high income, plans to buy insurance in the next few years, low propensity to switch providers, preference for few providers and low price sensitivity. The resulting distribution was split into the segments; the A segment was set above mean plus one standard deviation.
IBM Global Business Services 17
16 Channel revenue comparisons: To understand potential willingness to pay for the use of interaction points, we let respondents compare them on price. Correcting for potential survey bias (ceteris paribus, respondents will always want to pay less), we calculated a “net payer score,” which reflects the percentage of people willing to pay more for channel usage in relation to those willing to pay less.
A fairly large percentage of respondents are actually willing to pay more when using personal interaction points – a finding that is already sometimes reflected in insurer strategies where the customer pays less online (for a stripped-down product). Just comparing tied agent and the insurer website, the numbers show a net 28.2 percent of respondents are willing to pay more than the baseline to interact via a tied agent, versus the insurer website where a net 2.4 percent of respondents want to pay less than the baseline. How much more? For tied agents, about 20 percent more than for website.
Taking into account the stickiness from Figure 5, and if we assume $100 premium per signing customer and an equal chance per channel of the customer actually signing for coverage, we arrive at the following calculation for a given number of consumers starting to search and later purchasing insurance:
• tied agent: $100 [premium per customer] x 79.5% [stickiness] x 128.2% [people willing to pay] x 120% [amount willing to pay] = $122 per customer
• direct insurer website: $100 [premium per customer] x 49.4% [stickiness] x (100-2.4% [people willing to pay]) = $48.2 per customer
This would suggest that insurers could expect about 2.5 times the revenue per customer from the tied agent channel as from their website. If we add loyalty – tied agent customers are 20% more likely not to switch providers over the next five years – revenue is roughly 3 times higher per customer for the tied agent.
This calculation does not taking into account actual signing rates (i.e., number of consumers who started searching who did sign) and switching within one interaction point across several competitors.
17 Internet World Stats: Usage and Population Statistics. http://www.internetworldstats.com
18 Schaefer, Melissa and Laura VanTine. “Meeting the demands of the Smarter Consumer.” IBM Institute for Business Value. January 2010. http://www-935.ibm.com/services/us/gbs/bus/html/ibv-the-smarter-consumer.html?cntxt=a1000063
19 Ibid.
Please Recycle
© Copyright IBM Corporation 2010
IBM Global Services Route 100 Somers, NY 10589 U.S.A.
Produced in the United States of America December 2010
All Rights Reserved
IBM, the IBM logo and ibm.com are trademarks or registered trademarks of International Business Machines Corporation in the United States, other countries, or both. If these and other IBM trademarked terms are marked on their first occurrence in this information with a trademark symbol (® or ™), these symbols indicate U.S. registered or common law trademarks owned by IBM at the time this information was published. Such trademarks may also be registered or common law trademarks in other countries. A current list of IBM trademarks is available on the Web at “Copyright and trademark information” at ibm.com/legal/copytrade.shtml
Other company, product and service names may be trademarks or service marks of others.
References in this publication to IBM products and services do not imply that IBM intends to make them available in all countries in which IBM operates.
GBE03379-USEN-00
In association with