Embed Size (px)
Citation preview
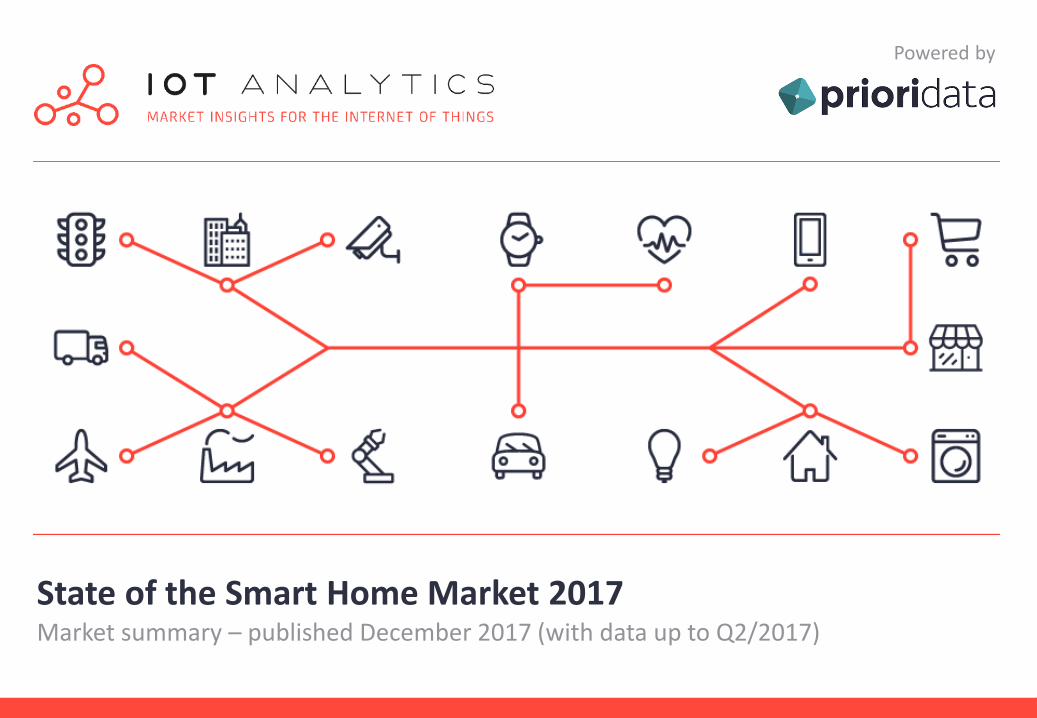
State of the Smart Home Market 2017Market summary – published December 2017 (with data up to Q2/2017)
Powered by
About this document
This document presents an excerpt of IoT Analytics’ Smart Home Market database and is intended for the general public. The summary presented in this document is based on extensive research, a comprehensive market model, raw data supplied by Priori Data and the subsequent overall data analysis.
The purpose of this document is to inform the overall public of the state, growth and details of the global Smart Home Market – through the IoT Analytics research lens.
Co
pyr
igh
t ©
20
17
by
ww
w.io
t-an
alyt
ics.
com
All
righ
ts r
eser
ved
2
State of the Global Smart Home Market – Overview
Co
pyr
igh
t ©
20
17
by
ww
w.io
t-an
alyt
ics.
com
All
righ
ts r
eser
ved
3
107%
21,674%
110%
163%
137%
Segments
Smoke Detectors
Security systems
Appliances
Outlets & Switches
Thermostats
Gateways
Speakers
Lighting
32
733
17
802
218
724
101
646
Global Revenue in MUSD
Q2 Revenue in MUSD
Source: Priori Data, IoT Analytics
Top Countries
Units Sold Q2/2017 vs. Q1/2017
+XX% = Q2/2016 vs. Q2/2017
Q2/2017
+134%
+31%
+78%
+349%
+56%
+81%
+80%
+62%
Vendors – Top 5 Movers*
World Smart Home Market
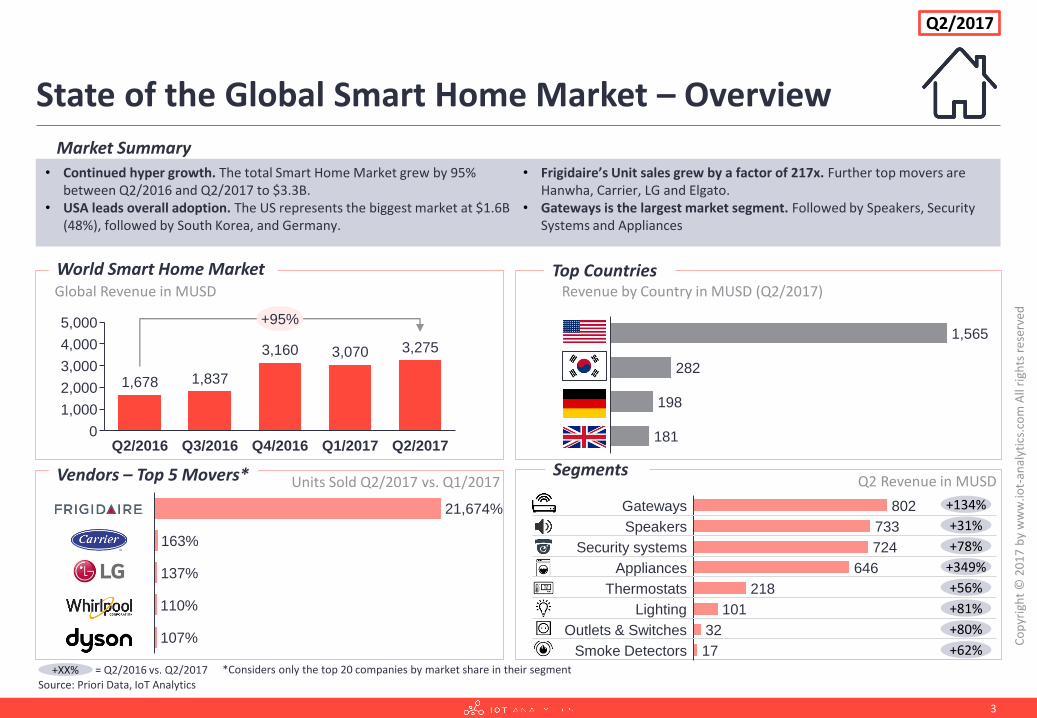
Market Summary
• Continued hyper growth. The total Smart Home Market grew by 95% between Q2/2016 and Q2/2017 to $3.3B.
• USA leads overall adoption. The US represents the biggest market at $1.6B (48%), followed by South Korea, and Germany.
• Frigidaire’s Unit sales grew by a factor of 217x. Further top movers are Hanwha, Carrier, LG and Elgato.
• Gateways is the largest market segment. Followed by Speakers, Security Systems and Appliances
4,000
5,000
2,000
3,000
1,000
0Q3/2016 Q1/2017Q2/2016 Q4/2016 Q2/2017
1,678
3,160 3,070
+95%
1,837
3,275
Revenue by Country in MUSD (Q2/2017)
2
3
4
1
181
1,565
198
282
*Considers only the top 20 companies by market share in their segment
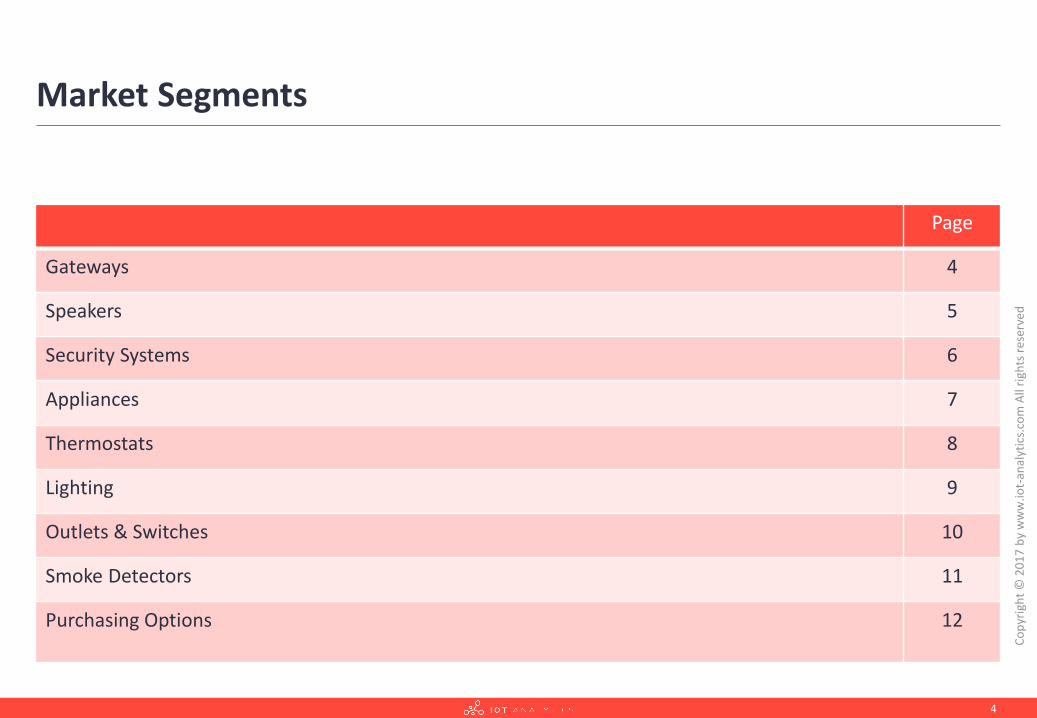
Market Segments
Page
Gateways 4
Speakers 5
Security Systems 6
Appliances 7
Thermostats 8
Lighting 9
Outlets & Switches 10
Smoke Detectors 11
Purchasing Options 12
Co
pyr
igh
t ©
20
17
by
ww
w.io
t-an
alyt
ics.
com
All
righ
ts r
eser
ved
4
Top 3 Rated Apps
State of the Global Smart Home MarketDeep-dive: Gateways
Co
pyr
igh
t ©
20
17
by
ww
w.io
t-an
alyt
ics.
com
All
righ
ts r
eser
ved
5
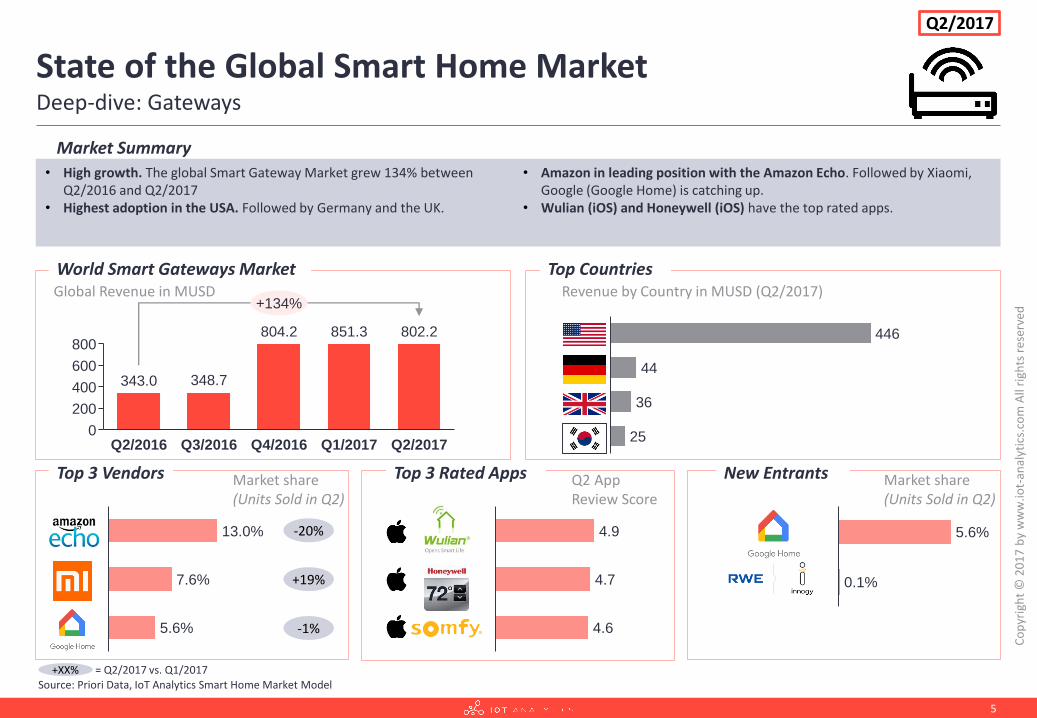
• High growth. The global Smart Gateway Market grew 134% between Q2/2016 and Q2/2017
• Highest adoption in the USA. Followed by Germany and the UK.
• Amazon in leading position with the Amazon Echo. Followed by Xiaomi, Google (Google Home) is catching up.
• Wulian (iOS) and Honeywell (iOS) have the top rated apps.
4.7
4.9
4.6
Top 3 Vendors
Source: Priori Data, IoT Analytics Smart Home Market Model
World Smart Gateways Market
5.6%
13.0%
7.6%
-20%
+19%
-1%
Global Revenue in MUSD
Market share(Units Sold in Q2)
Q2 App Review Score
Market Summary
400
800
600
200
0Q4/2016 Q1/2017Q2/2016 Q3/2016 Q2/2017
851.3 802.2
+134%
804.2
348.7343.0
+XX% = Q2/2017 vs. Q1/2017
Q2/2017
25
446
36
44
Revenue by Country in MUSD (Q2/2017)
5.6%
0.1%
New Entrants Market share(Units Sold in Q2)
Top Countries
Top 3 Rated Apps
State of the Global Smart Home MarketDeep-dive: Speakers
Co
pyr
igh
t ©
20
17
by
ww
w.io
t-an
alyt
ics.
com
All
righ
ts r
eser
ved
6
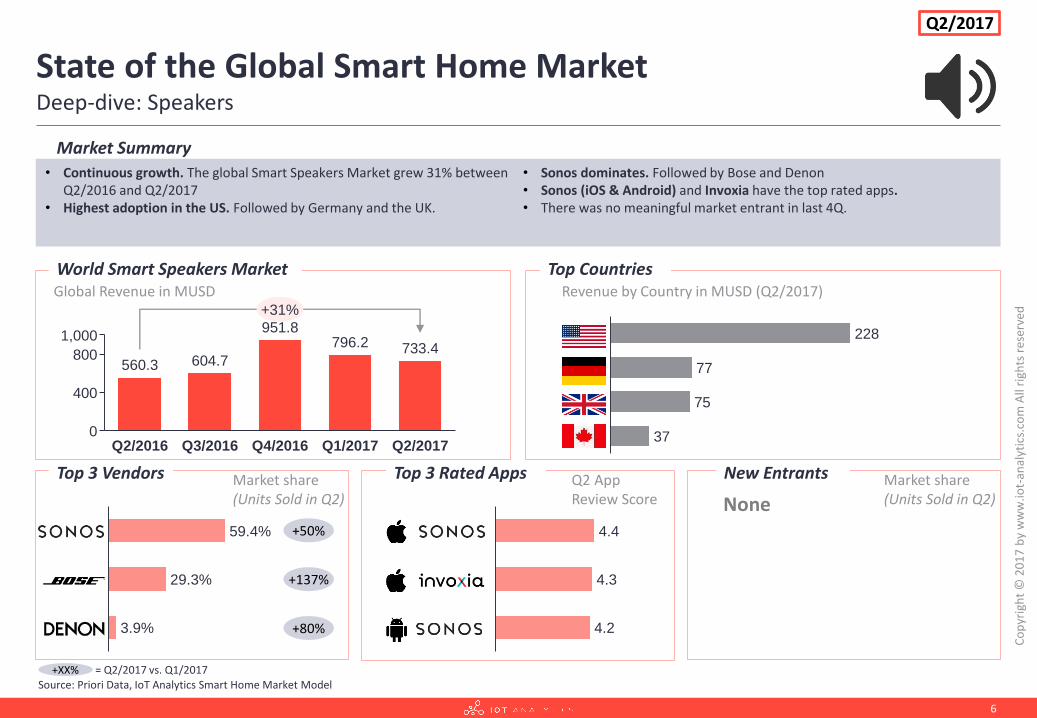
• Continuous growth. The global Smart Speakers Market grew 31% between Q2/2016 and Q2/2017
• Highest adoption in the US. Followed by Germany and the UK.
• Sonos dominates. Followed by Bose and Denon• Sonos (iOS & Android) and Invoxia have the top rated apps.• There was no meaningful market entrant in last 4Q.
4.3
4.4
4.2
Top 3 Vendors
Source: Priori Data, IoT Analytics Smart Home Market Model
World Smart Speakers Market
59.4%
3.9%
29.3%
+50%
+137%
+80%
Global Revenue in MUSD
Market share(Units Sold in Q2)
Q2 App Review Score
Market Summary
1,000
400
0
800
Q1/2017Q3/2016 Q4/2016Q2/2016 Q2/2017
796.2951.8
733.4
+31%
560.3 604.7
+XX%
Q2/2017
37
228
75
77
Revenue by Country in MUSD (Q2/2017)
New Entrants Market share(Units Sold in Q2)
Top Countries
None
= Q2/2017 vs. Q1/2017
Top 3 Rated Apps
State of the Global Smart Home MarketDeep-dive: Security Systems
Co
pyr
igh
t ©
20
17
by
ww
w.io
t-an
alyt
ics.
com
All
righ
ts r
eser
ved
7
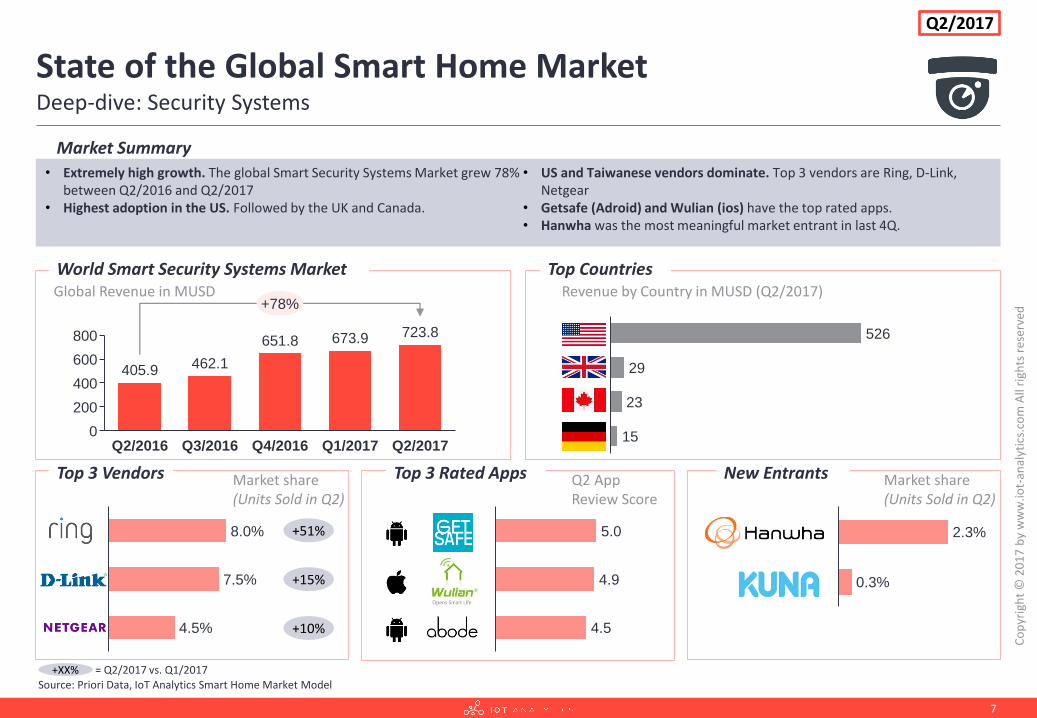
• Extremely high growth. The global Smart Security Systems Market grew 78% between Q2/2016 and Q2/2017
• Highest adoption in the US. Followed by the UK and Canada.
• US and Taiwanese vendors dominate. Top 3 vendors are Ring, D-Link, Netgear
• Getsafe (Adroid) and Wulian (ios) have the top rated apps.• Hanwha was the most meaningful market entrant in last 4Q.
4.9
5.0
4.5
Top 3 Vendors
Source: Priori Data, IoT Analytics Smart Home Market Model
World Smart Security Systems Market
4.5%
8.0%
7.5%
+51%
+15%
+10%
Global Revenue in MUSD
Market share(Units Sold in Q2)
Q2 App Review Score
Market Summary
400
800
600
200
0Q4/2016 Q1/2017Q2/2016 Q3/2016 Q2/2017
673.9 723.8
+78%
651.8
462.1405.9
+XX%
Q2/2017
15
526
23
29
Revenue by Country in MUSD (Q2/2017)
2.3%
0.3%
New Entrants Market share(Units Sold in Q2)
Top Countries
= Q2/2017 vs. Q1/2017
Top 3 Rated Apps
State of the Global Smart Home MarketDeep-dive: Appliances
Co
pyr
igh
t ©
20
17
by
ww
w.io
t-an
alyt
ics.
com
All
righ
ts r
eser
ved
8
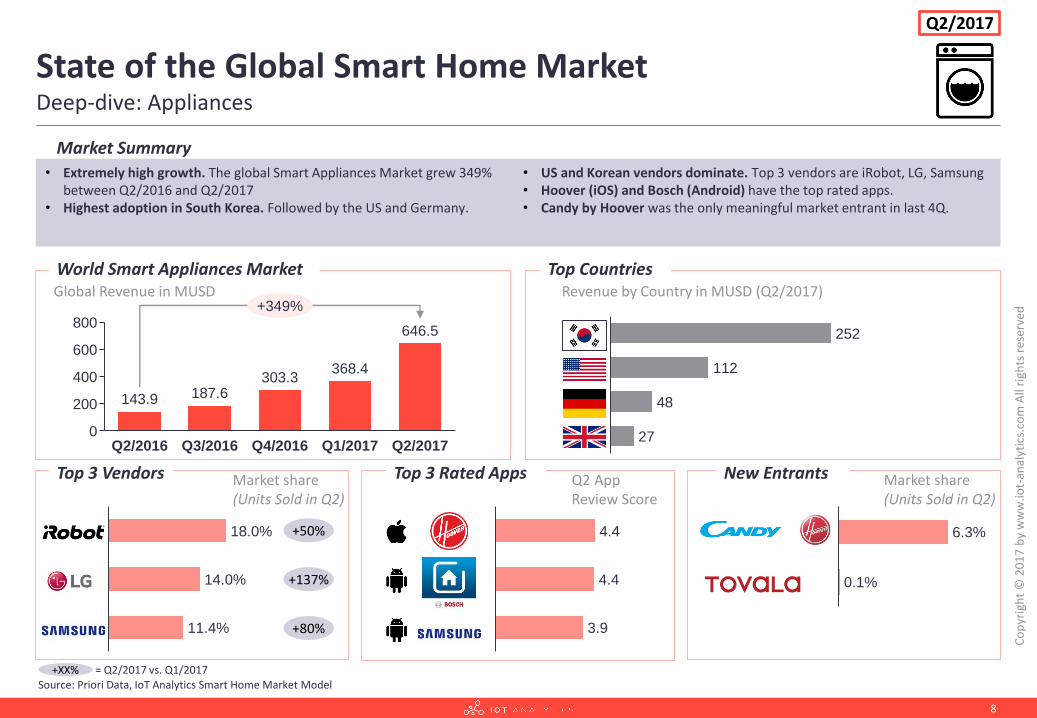
• Extremely high growth. The global Smart Appliances Market grew 349% between Q2/2016 and Q2/2017
• Highest adoption in South Korea. Followed by the US and Germany.
• US and Korean vendors dominate. Top 3 vendors are iRobot, LG, Samsung• Hoover (iOS) and Bosch (Android) have the top rated apps.• Candy by Hoover was the only meaningful market entrant in last 4Q.
4.4
4.4
3.9
Top 3 Vendors
Source: Priori Data, IoT Analytics Smart Home Market Model
World Smart Appliances Market
11.4%
18.0%
14.0%
+50%
+137%
+80%
Global Revenue in MUSD
Market share(Units Sold in Q2)
Q2 App Review Score
Market Summary
400
800
600
200
0Q4/2016 Q1/2017Q2/2016 Q3/2016 Q2/2017
368.4
646.5
+349%
303.3187.6143.9
+XX%
Q2/2017
27
252
48
112
Revenue by Country in MUSD (Q2/2017)
6.3%
0.1%
New Entrants Market share(Units Sold in Q2)
Top Countries
= Q2/2017 vs. Q1/2017
Top 3 Rated Apps
State of the Global Smart Home MarketDeep-dive: Thermostats
Co
pyr
igh
t ©
20
17
by
ww
w.io
t-an
alyt
ics.
com
All
righ
ts r
eser
ved
9
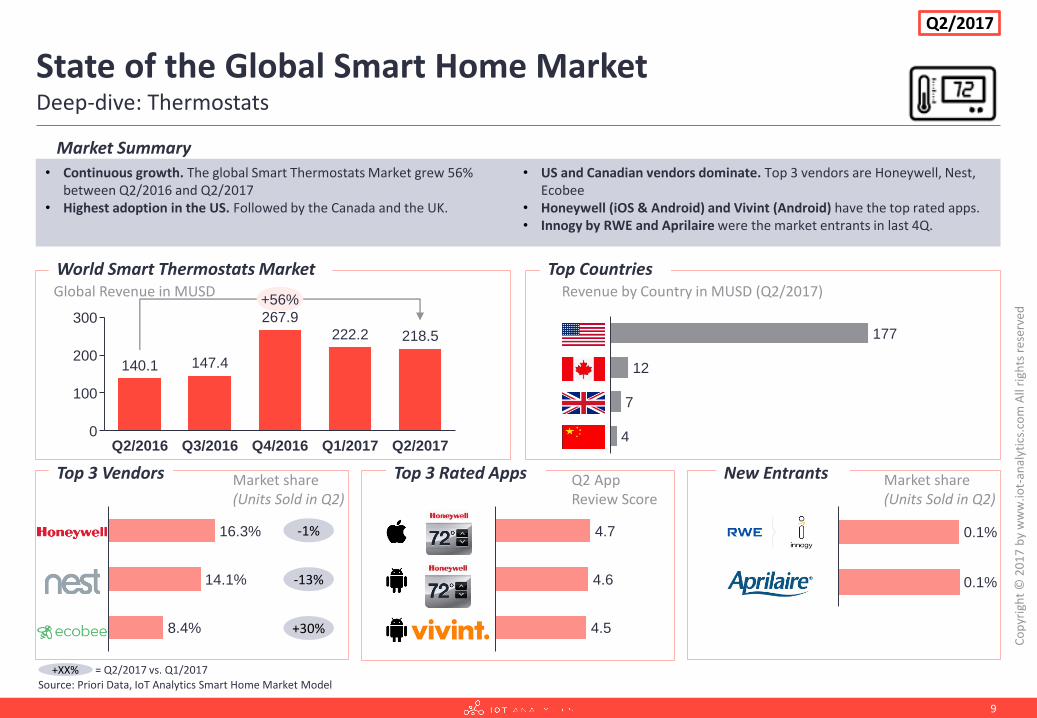
• Continuous growth. The global Smart Thermostats Market grew 56% between Q2/2016 and Q2/2017
• Highest adoption in the US. Followed by the Canada and the UK.
• US and Canadian vendors dominate. Top 3 vendors are Honeywell, Nest, Ecobee
• Honeywell (iOS & Android) and Vivint (Android) have the top rated apps.• Innogy by RWE and Aprilaire were the market entrants in last 4Q.
4.6
4.7
4.5
Top 3 Vendors
Source: Priori Data, IoT Analytics Smart Home Market Model
World Smart Thermostats Market
8.4%
16.3%
14.1%
-1%
-13%
+30%
Global Revenue in MUSD
Market share(Units Sold in Q2)
Q2 App Review Score
Market Summary
300
100
0
200
Q1/2017Q3/2016 Q4/2016Q2/2016 Q2/2017
222.2
267.9
218.5
+56%
140.1 147.4
+XX%
Q2/2017
4
177
12
7
Revenue by Country in MUSD (Q2/2017)
0.1%
0.1%
New Entrants Market share(Units Sold in Q2)
Top Countries
= Q2/2017 vs. Q1/2017
Top 3 Rated Apps
State of the Global Smart Home MarketDeep-dive: Lighting
Co
pyr
igh
t ©
20
17
by
ww
w.io
t-an
alyt
ics.
com
All
righ
ts r
eser
ved
10
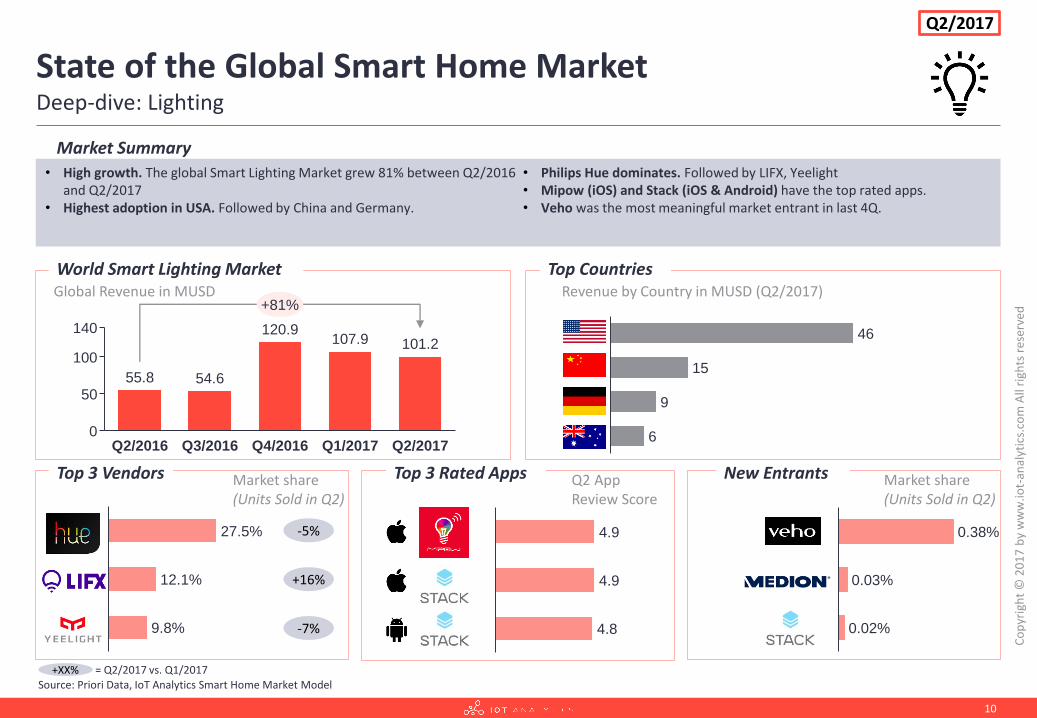
• High growth. The global Smart Lighting Market grew 81% between Q2/2016 and Q2/2017
• Highest adoption in USA. Followed by China and Germany.
• Philips Hue dominates. Followed by LIFX, Yeelight• Mipow (iOS) and Stack (iOS & Android) have the top rated apps.• Veho was the most meaningful market entrant in last 4Q.
4.9
4.9
4.8
Top 3 Vendors
Source: Priori Data, IoT Analytics Smart Home Market Model
World Smart Lighting Market
9.8%
27.5%
12.1%
-5%
+16%
-7%
Global Revenue in MUSD
Market share(Units Sold in Q2)
Q2 App Review Score
Market Summary
140
50
0
100
Q1/2017Q3/2016 Q4/2016Q2/2016 Q2/2017
107.9120.9
101.2
+81%
55.8 54.6
+XX%
Q2/2017
9
46
15
6
Revenue by Country in MUSD (Q2/2017)
0.03%
0.38%
0.02%
New Entrants Market share(Units Sold in Q2)
Top Countries
= Q2/2017 vs. Q1/2017
Top 3 Rated Apps
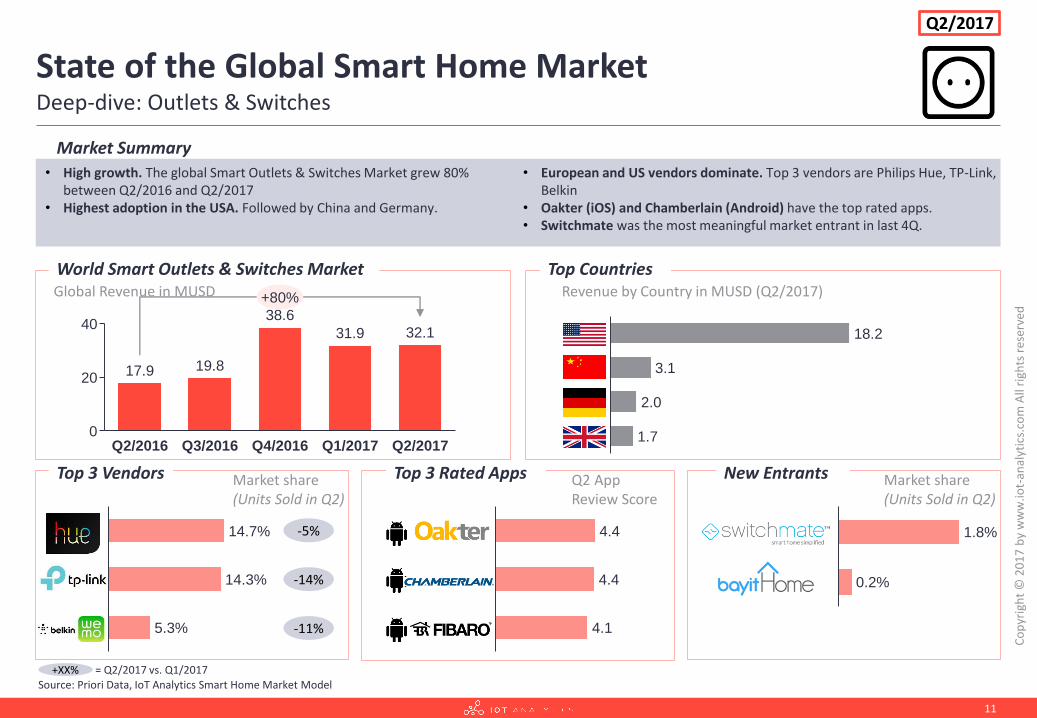
State of the Global Smart Home MarketDeep-dive: Outlets & Switches
Co
pyr
igh
t ©
20
17
by
ww
w.io
t-an
alyt
ics.
com
All
righ
ts r
eser
ved
11
• High growth. The global Smart Outlets & Switches Market grew 80% between Q2/2016 and Q2/2017
• Highest adoption in the USA. Followed by China and Germany.
• European and US vendors dominate. Top 3 vendors are Philips Hue, TP-Link, Belkin
• Oakter (iOS) and Chamberlain (Android) have the top rated apps.• Switchmate was the most meaningful market entrant in last 4Q.
4.4
4.4
4.1
Top 3 Vendors
Source: Priori Data, IoT Analytics Smart Home Market Model
World Smart Outlets & Switches Market
5.3%
14.7%
14.3%
-5%
-14%
-11%
Global Revenue in MUSD
Market share(Units Sold in Q2)
Q2 App Review Score
Market Summary
40
20
0Q3/2016 Q4/2016 Q2/2017Q1/2017Q2/2016
31.9
38.6
32.1
17.9 19.8
+80%
+XX% = Q2/2017 vs. Q1/2017
Q2/2017
3.1
18.2
1.7
2.0
Revenue by Country in MUSD (Q2/2017)
1.8%
0.2%
New Entrants Market share(Units Sold in Q2)
Top Countries
Top 3 Rated Apps
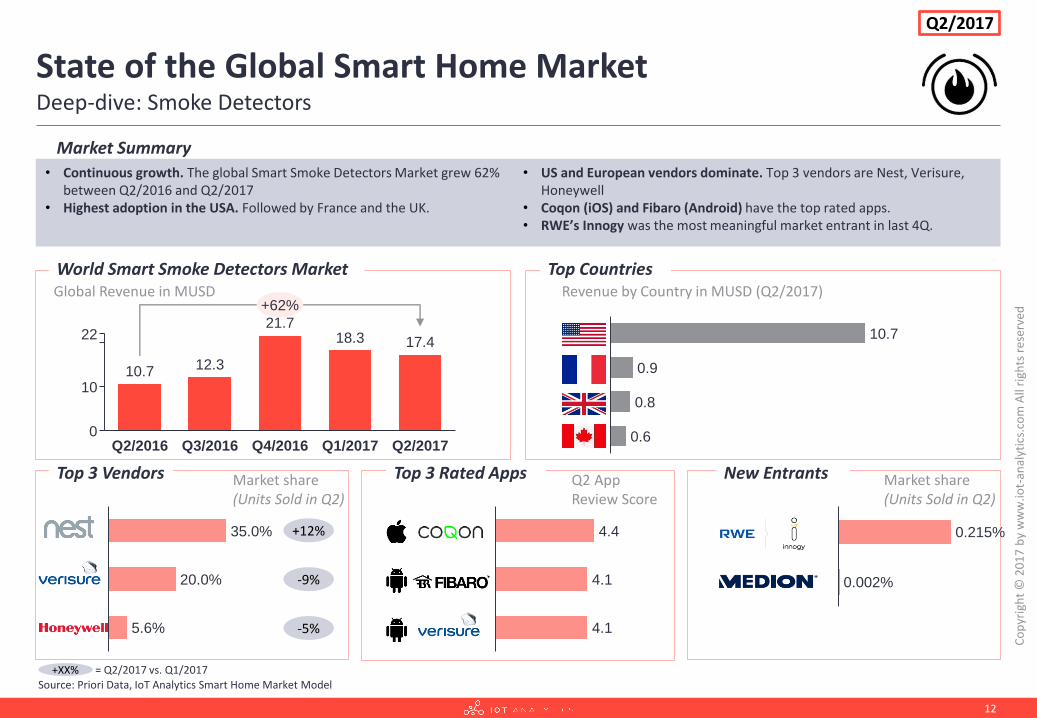
State of the Global Smart Home MarketDeep-dive: Smoke Detectors
Co
pyr
igh
t ©
20
17
by
ww
w.io
t-an
alyt
ics.
com
All
righ
ts r
eser
ved
12
• Continuous growth. The global Smart Smoke Detectors Market grew 62% between Q2/2016 and Q2/2017
• Highest adoption in the USA. Followed by France and the UK.
• US and European vendors dominate. Top 3 vendors are Nest, Verisure, Honeywell
• Coqon (iOS) and Fibaro (Android) have the top rated apps.• RWE’s Innogy was the most meaningful market entrant in last 4Q.
4.4
4.1
4.1
Top 3 Vendors
Source: Priori Data, IoT Analytics Smart Home Market Model
World Smart Smoke Detectors Market
5.6%
35.0%
20.0%
+12%
-9%
-5%
Global Revenue in MUSD
Market share(Units Sold in Q2)
Q2 App Review Score
Market Summary
22
10
0Q1/2017Q3/2016 Q4/2016Q2/2016 Q2/2017
18.321.7
17.4
+62%
10.7 12.3
+XX% = Q2/2017 vs. Q1/2017
Q2/2017
0.6
10.7
0.9
0.8
Revenue by Country in MUSD (Q2/2017)
New Entrants Market share(Units Sold in Q2)
0.215%
0.002%
Top Countries
Methodology and definitions
Segment Includes
Lighting Light bulbs, lighting systems
Appliances Washers, dryers, fridges, ovens & microwavers, vacuum cleaners
Smoke Detectors Alarm devices that warn in the case of smoke
Security Systems Motion sensors, cameras, locks, home security systems
Gateways Central hub used to connect and control smart home devices
Thermostats Devices for automatic room temperature regulation
Outlets & Switches Wall-mounted sockets and switches, outlet plugs
Speakers WiFi-enabled speakers
Co
pyr
igh
t ©
20
17
by
ww
w.io
t-an
alyt
ics.
com
All
righ
ts r
eser
ved
13
The data presented as part of this presentation is based on IoT Analytics’ app-based Smart Home market model. Although based on a bottom-up approach, IoTAnalytics does not claim exhaustiveness of the data and acknowledges that individual companies may be missing or under or overestimated. Raw input, such asapp downloads and app ratings have been provided by Priori Data, the Mobile App Data Intelligence Company. The data has been enriched by generally availablepricing information and have been triangulated with publicly available revenue figures and personal discussions with selected market participants. Please note:Priori Data optimizes their algorithms over time: The optimized models also affect past data sets. Therefore future model updates may see a change in historicdata.
The smart home market model includes global consumer device sales for the residential home automation market in 8 segments. It does not include commercialbuilding solutions. Prerequisite for a company to be in included in the model is the existence of an own app listed in the iOS or Android store that is used to controlthe respective Smart Home device or a set of Smart Home devices. More than relevant 200 apps are tracked on a day-by-day basis.
1. General: What is included?
2. Segments: What is included?
3. The model
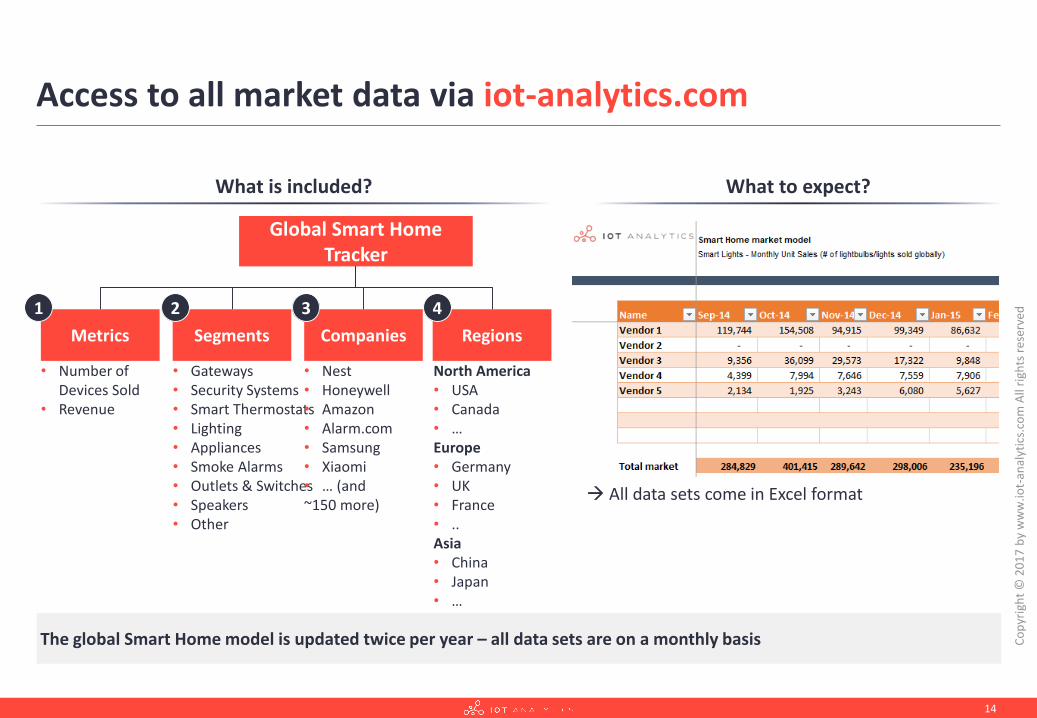
Access to all market data via iot-analytics.com
Co
pyr
igh
t ©
20
17
by
ww
w.io
t-an
alyt
ics.
com
All
righ
ts r
eser
ved
14
What is included?
Global Smart Home Tracker
Metrics
• Number of Devices Sold
• Revenue
1
Segments
• Gateways• Security Systems• Smart Thermostats• Lighting• Appliances• Smoke Alarms• Outlets & Switches• Speakers• Other
2
Companies
• Nest• Honeywell• Amazon• Alarm.com• Samsung• Xiaomi• … (and ~150 more)
3
Regions
North America• USA• Canada• …Europe• Germany• UK• France• ..Asia• China• Japan• …
4
14The global Smart Home model is updated twice per year – all data sets are on a monthly basis
What to expect?
All data sets come in Excel format
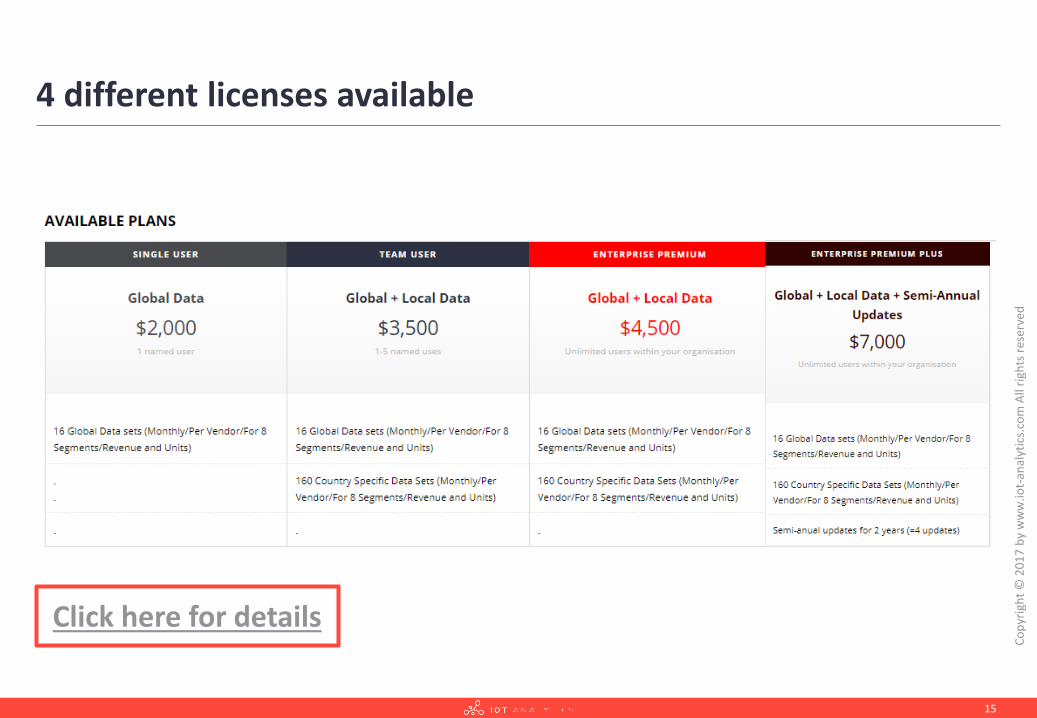
4 different licenses available
Co
pyr
igh
t ©
20
17
by
ww
w.io
t-an
alyt
ics.
com
All
righ
ts r
eser
ved
15
Click here for details
Legal disclaimer
IoT Analytics is a leading provider of market insights and competitive intelligence for the Internet of Things (IoT). This document is intended for
general informational purposes only, does not take into account the reader’s specific circumstances, and may not reflect the most current
developments. IoT Analytics disclaims, to the fullest extent permitted by applicable law, any and all liability for the accuracy and completeness of the
information in this document and for any acts or omissions made based on such information. IoT Analytics is not responsible for any incorrect
information supplied to us by third parties. Quantitative market information is based primarily on app data and therefore is subject to fluctuation. IoT
Analytics does not provide legal, regulatory, audit, or tax advice. Readers are responsible for obtaining such advice from their own legal counsel or
other licensed professionals.
For more information, visit http://www.iot-analytics.com
For information regarding citation permission, write to:
IoT Analytics GmbH
Zirkusweg 2
20359 Hamburg, Germany
IoT Analytics Research Team
Zana Diaz Williams, Senior Analyst
Padraig Scully, VP Market Research
Knud Lasse Lueth, Managing Director
Published: November 2017
16
Co
pyr
igh
t ©
20
17
by
ww
w.io
t-an
alyt
ics.
com
All
righ
ts r
eser
ved
Predictive Maintenance – Market Report 2017-2022

IoT Analytics GmbHMarket Insights for the Internet of Things
Zirkusweg 2 (Astraturm, 6. OG)20359 HamburgGermany
[email protected]+49 40 88950090http://iot-analytics.com