Embed Size (px)
DESCRIPTION
Powercenter 05 Using the Debugger
Citation preview

5 - 1
Lab 5
Using the Debugger
Lab at a Glance ............................................................... 2
Objectives ......................................................................... 2 The Problem ..................................................................... 2 Duration ............................................................................ 3
Exercises ......................................................................... 4
Exercise 1: Prepare Debugger .......................................... 4 Exercise 2: Run the Debugger .......................................... 7
Lab 5. Using the Debugger
5- 2
Lab at a Glance
The exercises in this lab are designed to familiarize the student
with the process of using the PowerCenter Debugger. In this
lab, the student will troubleshoot a mapping that is not
producing the correct data results.
Objectives
After completing the lab, the student will be able to:
Use the PowerCenter Debugger.
Start and stop the Debugger.
Set breakpoints in the Debugger.
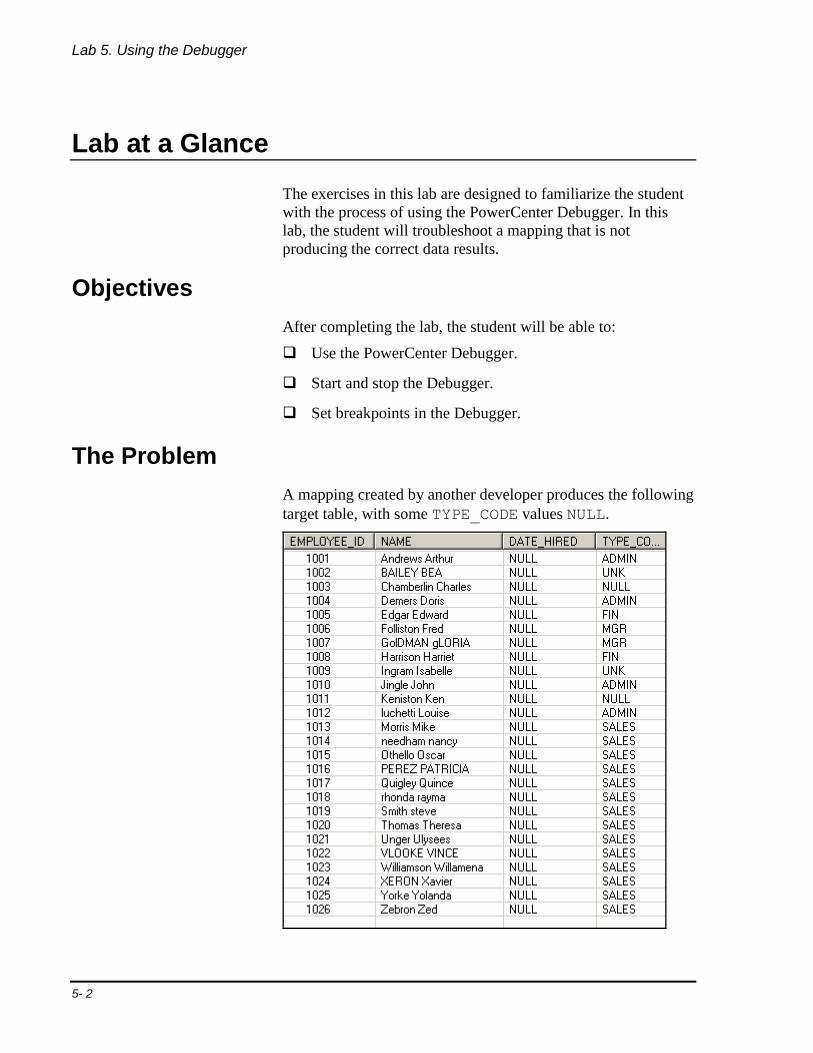
The Problem
A mapping created by another developer produces the following
target table, with some TYPE_CODE values NULL.

Lab 5. Using the Debugger
5 - 3
Duration
This lab should take approximately 30 minutes.

Lab 5. Using the Debugger
5- 4
Exercises
Exercise 1: Prepare Debugger
This exercise sets up the Mapping Designer in preparation for
debugging. Some of the steps may not be necessary if the
Designer has remained open since the previous labs.
Step 1. Open the Designer.
Select Start | Programs | Informatica Platform 8.0 |
Informatica PowerCenter Client 8.0 | Designer.
Connect to the PC_Course repository.
Step 2. Close the mapping.
Open the Mapping Designer by clicking the button in the
toolbar:
Close the mapping by selecting Mappings | Close or by
clicking the Close Mapping button in the Mappings
toolbar (if visible).
Step 3. Copy the mapping to be debugged.
Simply selecting or expanding your folder does not actually open it. There are several ways to open it: - Double-click on it. - Right-click it and select Open from the popup menu. - Left-click it and click control-O. - Left-click it and select the folder-open icon in the toolbar.
Ensure the Designer is in “workbook mode” by selecting
View | Workbook.
When in “workbook mode”, the bottom of the Workspace
will display tabs for all of the open folders.
Open the Studentxx folder.
Locate the Shared_Student folder in the Navigator window
and expand it by clicking on the ‘+’ sign to the left of the
folder name.
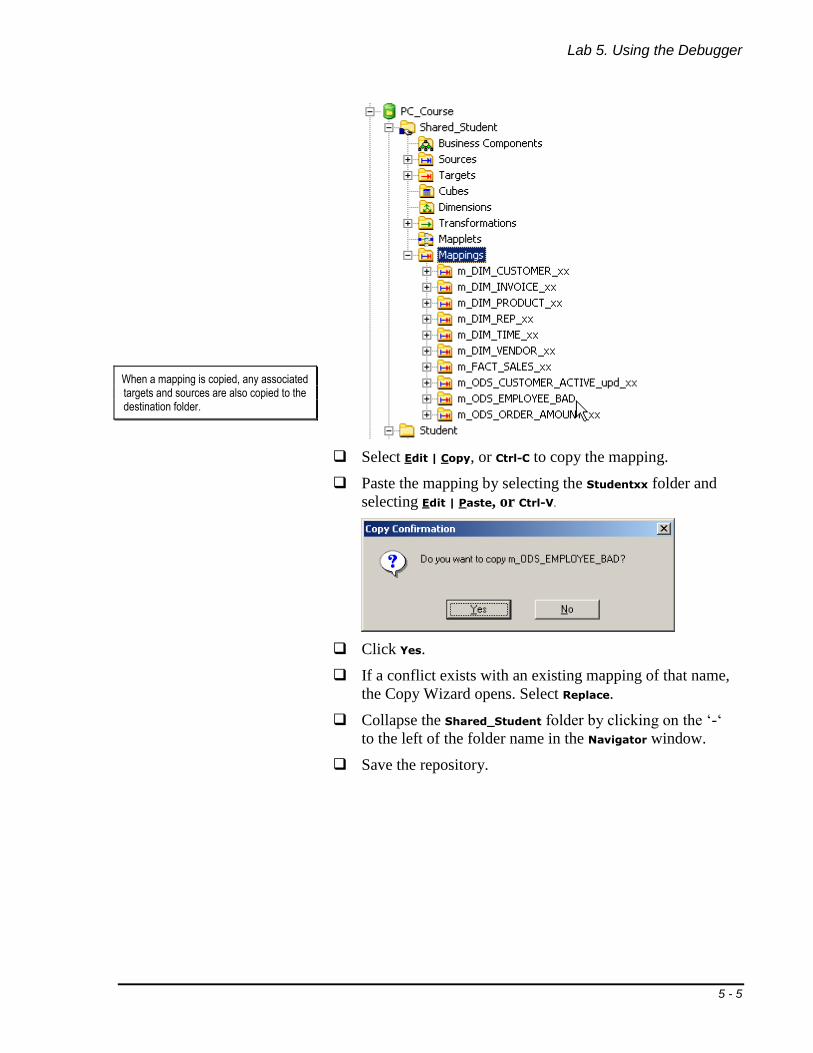
Continue to drill down to the Mappings node and select
the m_ODS_EMPLOYEE_BAD mapping:
Lab 5. Using the Debugger
5 - 5
When a mapping is copied, any associated targets and sources are also copied to the destination folder.
Select Edit | Copy, or Ctrl-C to copy the mapping.
Paste the mapping by selecting the Studentxx folder and
selecting Edit | Paste, or Ctrl-V.
Click Yes.
If a conflict exists with an existing mapping of that name,
the Copy Wizard opens. Select Replace.
Collapse the Shared_Student folder by clicking on the ‘-‘
to the left of the folder name in the Navigator window.
Save the repository.
Lab 5. Using the Debugger
5- 6
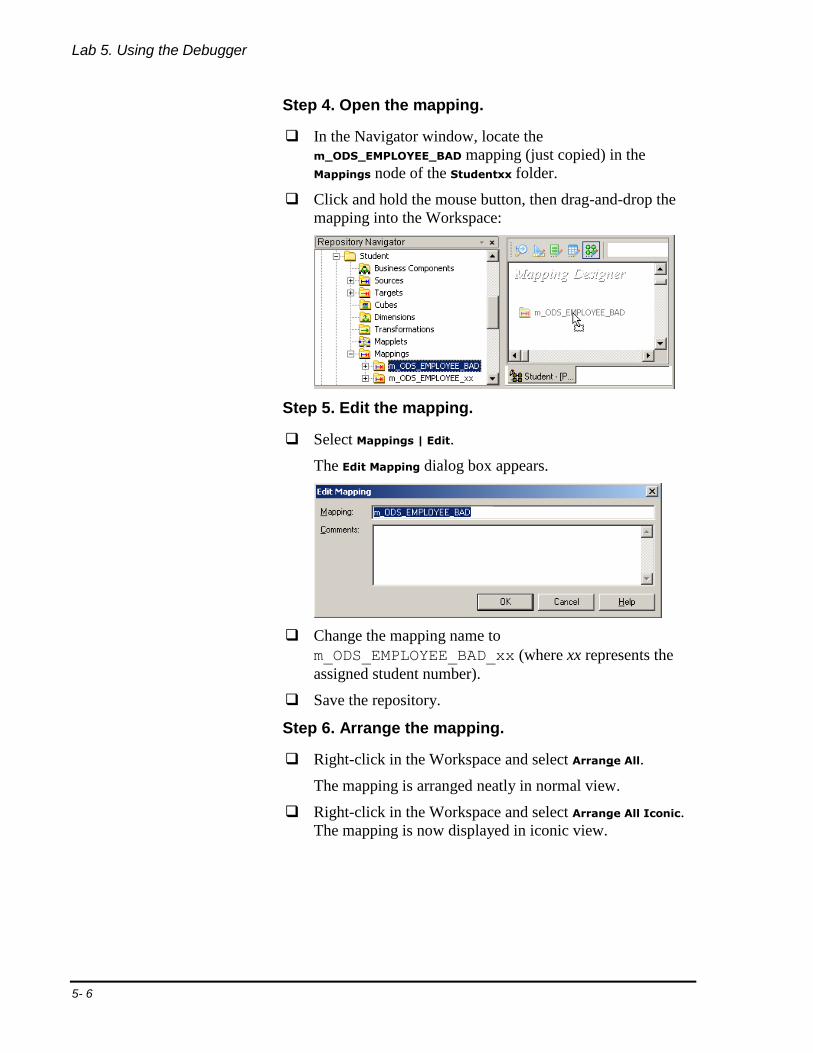
Step 4. Open the mapping.
In the Navigator window, locate the
m_ODS_EMPLOYEE_BAD mapping (just copied) in the
Mappings node of the Studentxx folder.
Click and hold the mouse button, then drag-and-drop the
mapping into the Workspace:
Step 5. Edit the mapping.
Select Mappings | Edit.
The Edit Mapping dialog box appears.
Change the mapping name to
m_ODS_EMPLOYEE_BAD_xx (where xx represents the
assigned student number).
Save the repository.
Step 6. Arrange the mapping.
Right-click in the Workspace and select Arrange All.
The mapping is arranged neatly in normal view.
Right-click in the Workspace and select Arrange All Iconic.
The mapping is now displayed in iconic view.

Lab 5. Using the Debugger
5 - 7
Exercise 2: Run the Debugger
Step 1. Activate the Debugger toolbar.
Select Tools | Customize and check the Debugger checkbox
on the Toolbars tab:
The Debugger toolbar is added to the available toolbars:
Select Tools | Options.
Select the Debug tab.
Under Data Display, if Value is not in Selected, move it
there.
Step 2. Start the Debugger.
Click on the Start Debugger button, or select Mappings
| Debugger | Start Debugger or click F9.
The Debug Mapping window appears.

Lab 5. Using the Debugger
5- 8
Since no session has been created to represent this new mapping, the Debug Mapping Wizard has the ability to create one on the fly. This is especially useful - a developer can test complex expressions and logic before trying to create a workflow with a session task.
Click on the Next button.
The next Debug Mapping wizard page appears.
Leave PC_Server as the Server to use for the debug
session.
In the Session field, leave the default radio button (Create
a debug session instance for this mapping) selected.
Click on the Next button.
Lab 5. Using the Debugger
5 - 9
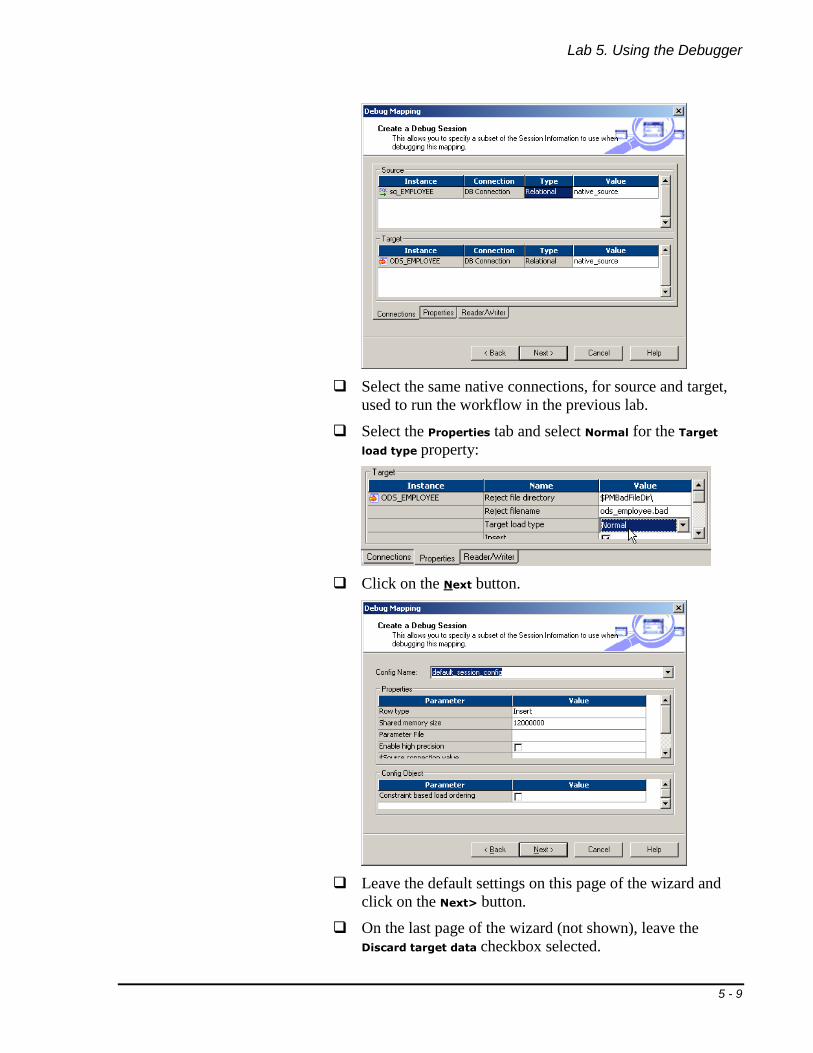
Select the same native connections, for source and target,
used to run the workflow in the previous lab.
Select the Properties tab and select Normal for the Target
load type property:
Click on the Next button.
Leave the default settings on this page of the wizard and
click on the Next> button.
On the last page of the wizard (not shown), leave the
Discard target data checkbox selected.
Lab 5. Using the Debugger
5- 10
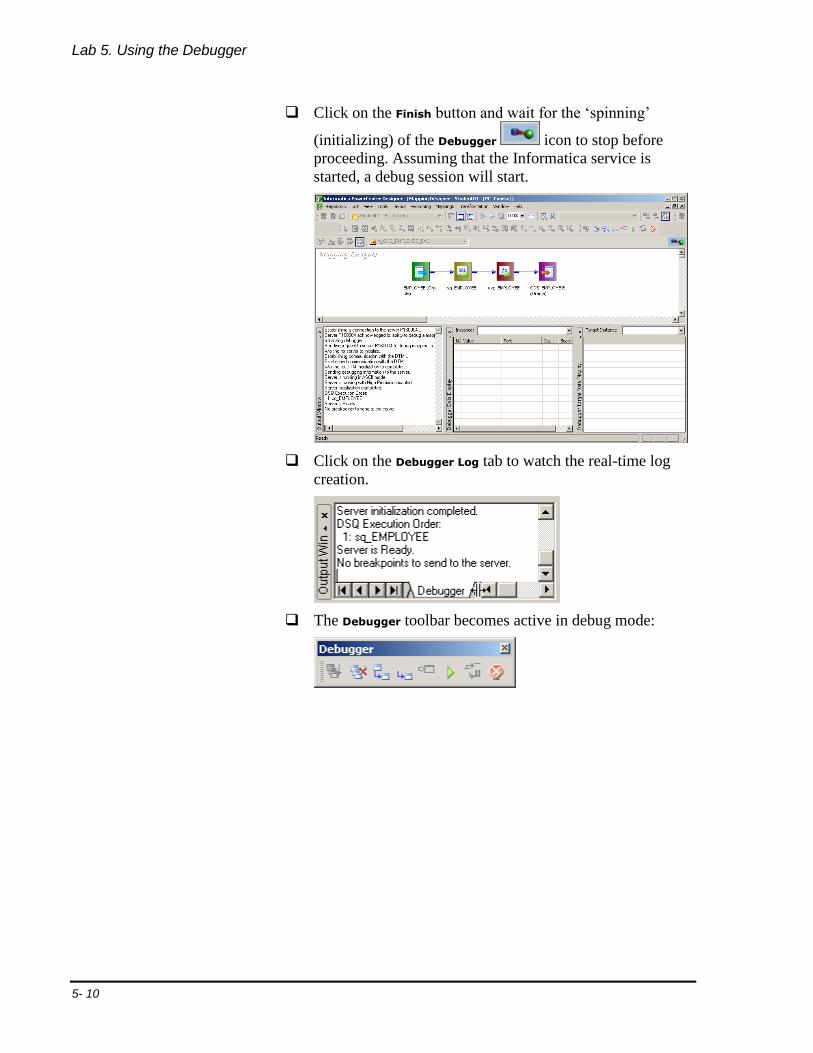
Click on the Finish button and wait for the ‘spinning’
(initializing) of the Debugger icon to stop before
proceeding. Assuming that the Informatica service is
started, a debug session will start.
Click on the Debugger Log tab to watch the real-time log
creation.
The Debugger toolbar becomes active in debug mode:
Lab 5. Using the Debugger
5 - 11
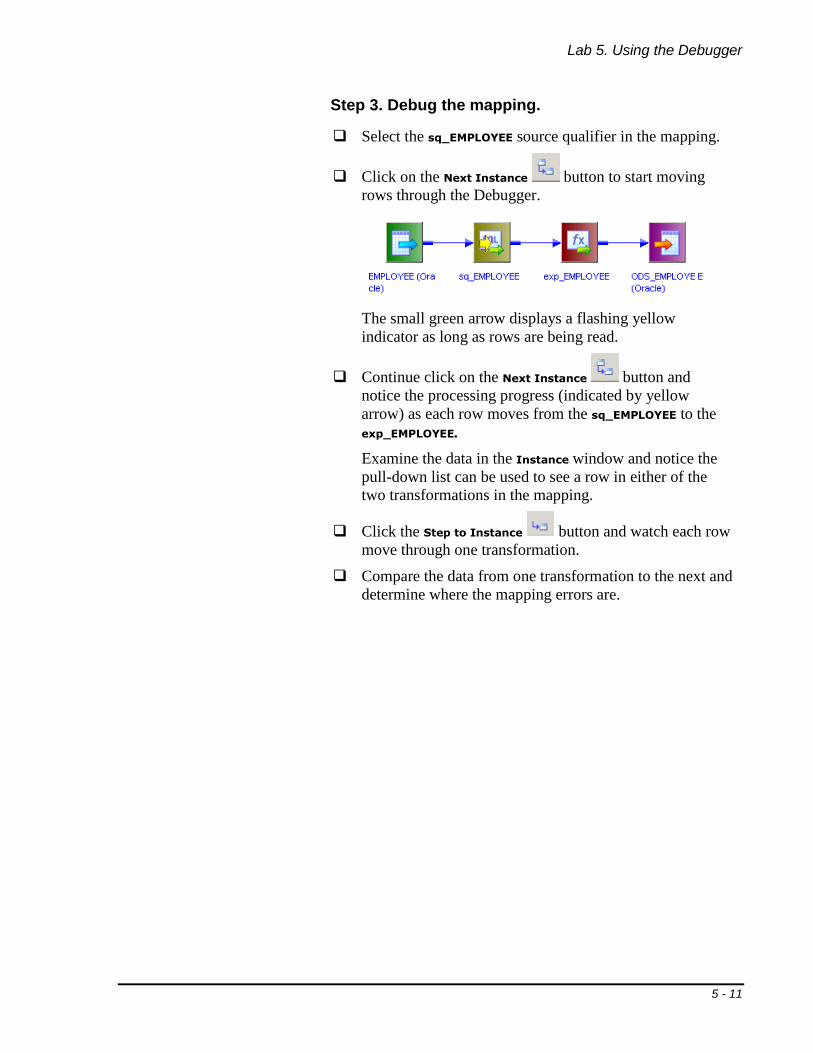
Step 3. Debug the mapping.
Select the sq_EMPLOYEE source qualifier in the mapping.
Click on the Next Instance button to start moving
rows through the Debugger.
The small green arrow displays a flashing yellow
indicator as long as rows are being read.
Continue click on the Next Instance button and
notice the processing progress (indicated by yellow
arrow) as each row moves from the sq_EMPLOYEE to the
exp_EMPLOYEE.
Examine the data in the Instance window and notice the
pull-down list can be used to see a row in either of the
two transformations in the mapping.
Click the Step to Instance button and watch each row
move through one transformation.
Compare the data from one transformation to the next and
determine where the mapping errors are.
Lab 5. Using the Debugger
5- 12
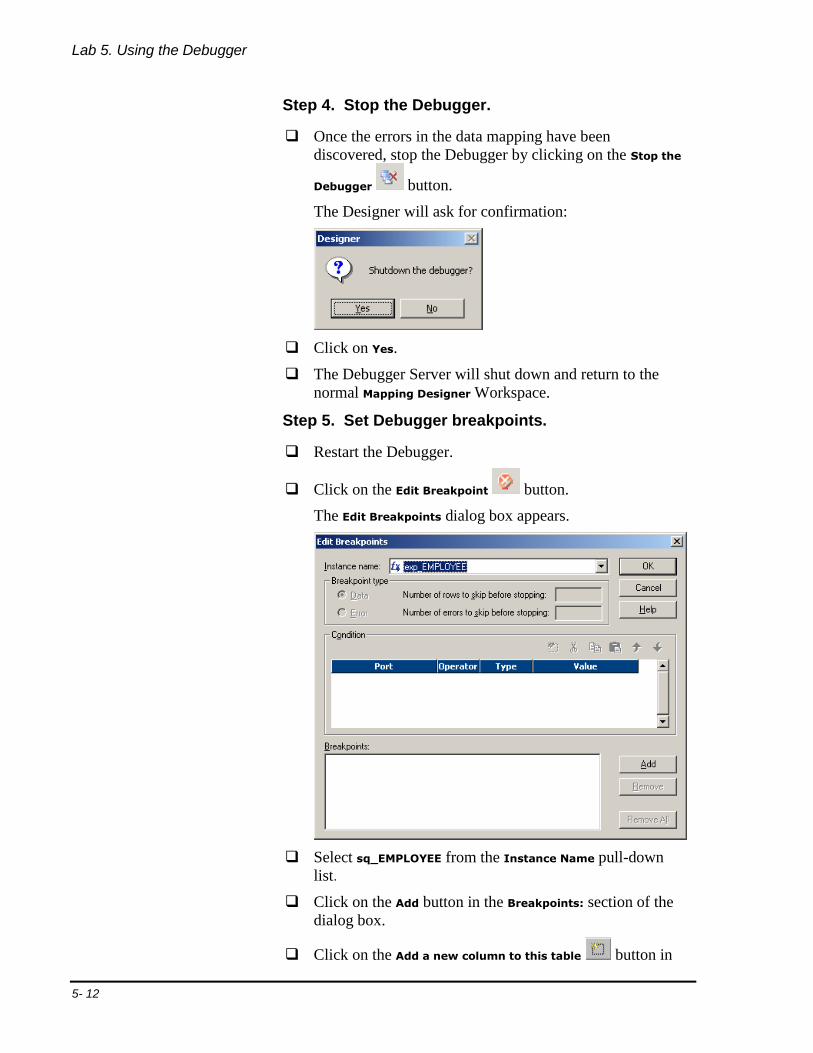
Step 4. Stop the Debugger.
Once the errors in the data mapping have been
discovered, stop the Debugger by clicking on the Stop the
Debugger button.
The Designer will ask for confirmation:
Click on Yes.
The Debugger Server will shut down and return to the
normal Mapping Designer Workspace.
Step 5. Set Debugger breakpoints.
Restart the Debugger.
Click on the Edit Breakpoint button.
The Edit Breakpoints dialog box appears.
Select sq_EMPLOYEE from the Instance Name pull-down
list.
Click on the Add button in the Breakpoints: section of the
dialog box.
Click on the Add a new column to this table button in

Lab 5. Using the Debugger
5 - 13
Best practice is to restart the Debugger, since Continue will miss breakpoints on rows that have already been processed.
Note that the defined breakpoint is still present. Breakpoints remain associated with a mapping until they are deleted. A breakpoint can be edited as long as the Debugger is not running.
the Condition section the dialog box.
Select <<ANY-PORT>> from the Port pull-down list.
Select ISNULL from the Operator pull-down list.
Click OK to save the breakpoint.
Click the Continue button on the Debugger toolbar.
The Debugger will run through all the rows until the first
occurrence of a NULL. Note that two rows pass to the
target, then the Debugger pauses.
Check the Instance window and note the presence of a
NULL in the TYPE_CODE column.
Click the Continue button.
Ten rows enter the target and the Debugger pauses when
it encounters a row where the TYPE_CODE column is
NULL.
Click the Continue button.
A NULL is not found in any other rows. All rows
Lab 5. Using the Debugger
5- 14
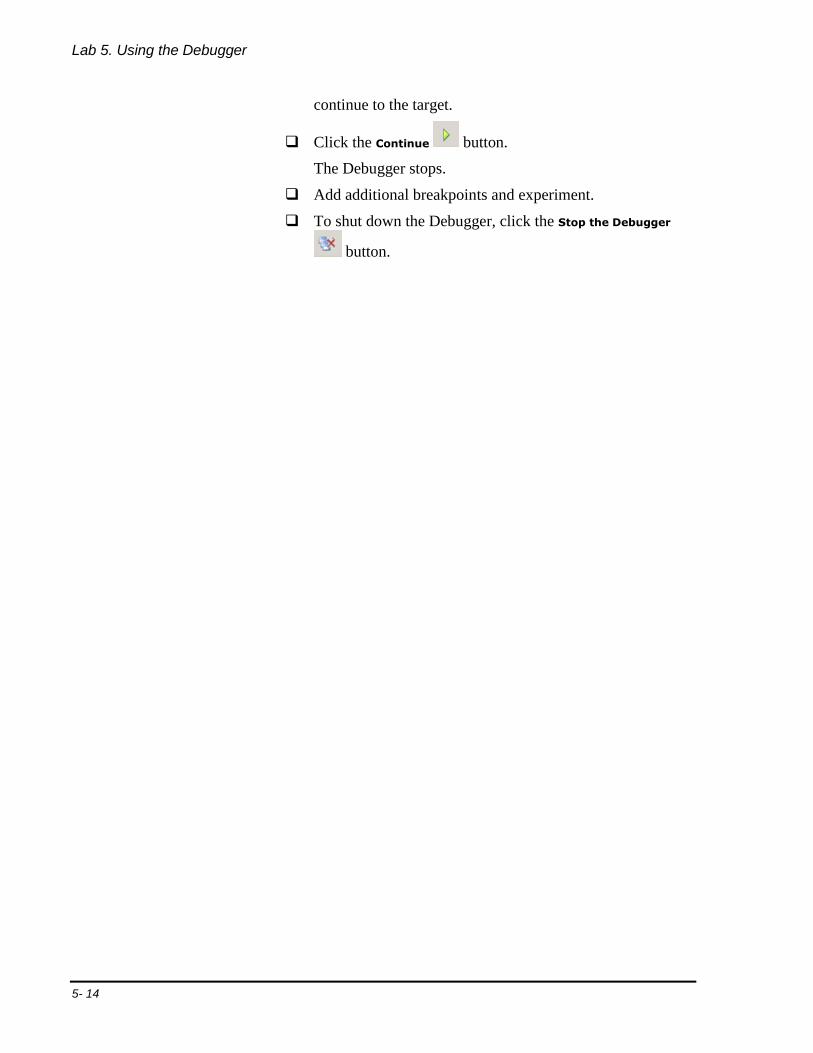
continue to the target.
Click the Continue button.
The Debugger stops.
Add additional breakpoints and experiment.
To shut down the Debugger, click the Stop the Debugger
button.