Embed Size (px)
Citation preview

Level 9, 38 Cavenagh Street DARWIN NT 0800
Postal Address GPO Box 915 DARWIN NT 0801
Email: [email protected]
Website: www.utilicom.nt.gov.au
POWER SYSTEM REVIEW
2009-10
March 2011

i
March 2011
Table of Contents
Overview .................................................................................................................................................................. 1
Key findings ............................................................................................................................................................. 1
Generation adequacy ...................................................................................................................................... 1
Fuel supply ..................................................................................................................................................... 3
Electricity networks adequacy ......................................................................................................................... 3
Reliability ..................................................................................................................................................... 5
Customer service performance ....................................................................................................................... 5
Introduction .............................................................................................................................................................. 7
Overview of 2009-10 Review ................................................................................................................................... 7
Role of expert advisor...................................................................................................................................... 7
Availability of information ................................................................................................................................. 8
Structure and scope of Review ................................................................................................................................ 9
Electricity supply in the Territory ............................................................................................................................ 10
Introduction ............................................................................................................................................................ 10
Electricity industry participants ............................................................................................................................... 11
Market statistics ..................................................................................................................................................... 11
Industry developments and key events .................................................................................................................. 12
Priority work program .................................................................................................................................... 12
Natural gas supply ......................................................................................................................................... 12
Darwin-Katherine system black on 30 January 2010..................................................................................... 12
Generation investment program .................................................................................................................... 13
Subsequent developments ............................................................................................................................ 13
Electricity generation .............................................................................................................................................. 14
Generation capacity ............................................................................................................................................... 14
Generation supply-demand balance ...................................................................................................................... 17
Projected available generation capacity ........................................................................................................ 17
System demand forecasts ..................................................................................................................................... 19
Development of system demand forecast scenarios ..................................................................................... 20
Forecast system demand scenarios .............................................................................................................. 21
Generation supply-demand balance ...................................................................................................................... 24
Generation supply-demand balance – Darwin-Katherine system .................................................................. 26
Generation supply demand balance – Alice Springs ..................................................................................... 31
Generation supply demand balance – Tennant Creek .................................................................................. 33

ii
March 2011
Fuel supplies .......................................................................................................................................................... 34
Natural gas supply ......................................................................................................................................... 34
Alternative fuel sources ................................................................................................................................. 34
Adequacy of fuel supplies .............................................................................................................................. 35
Electricity networks ................................................................................................................................................ 38
Scope of assessment and availability of data ................................................................................................ 38
Transmission and distribution networks in the Territory ......................................................................................... 38
Network infrastructure ................................................................................................................................... 39
Network capacity and constraints .......................................................................................................................... 41
Network peak demand forecasts ................................................................................................................... 42
Transmission/sub-transmission network capacity and constraints ................................................................ 42
Distribution network capacity and constraints ................................................................................................ 45
Customer service and reliability performance ........................................................................................................ 47
Reliability performance .......................................................................................................................................... 47
Overall reliability performance ....................................................................................................................... 47
Darwin region reliability performance ............................................................................................................ 54
Katherine region reliability performance ........................................................................................................ 55
Alice Springs region reliability performance ................................................................................................... 57
Tennant Creek reliability performance ........................................................................................................... 58
Customer service performance .............................................................................................................................. 60
Reconnections / connections ......................................................................................................................... 60
Quality of supply complaints .......................................................................................................................... 61
Telephone call response ............................................................................................................................... 61
Customer complaints ..................................................................................................................................... 61
Appendix A ................................................................................................................................... 63
System maximum demand forecasts 2010-11 to 2019-20 ..................................................................................... 63
Appendix B ................................................................................................................................... 65
Zone substation demand for 2007-08 to 2015-16 .................................................................................................. 65

iii
March 2011
Disclaimer
The Power System Review is prepared by the Utilities Commission in accordance with
section 45 of the Electricity Reform Act.
The Review is prepared using information sourced from participants of the electricity supply
industry, Northern Territory Government agencies, consultant reports, and publicly available
information. The Commission understands this information to be current as at March 2011.
The Review contains predictions, estimates and statements that are based on the
Commission’s interpretation of data provided by electricity industry participants, and
assumptions about the power system, including load growth forecasts and the affect of
potential major developments in particular power systems. The Commission considers that
the Review is an accurate report within the normal tolerance of economic forecasts.
Any person using the information in the Review should independently verify the accuracy,
completeness, reliability and suitability of the information and source data. The Commission
accepts no liability (including liability to any person by reason of negligence) for any use of
the information in this Review or for any loss, damage, cost or expense incurred or arising by
reason of any error, negligent act, omission or misrepresentation in the information in this
Review or otherwise.
Inquiries
Any questions regarding this report should be directed in the first instance to the Executive
Officer, Utilities Commission at any of the following:
Utilities Commission
GPO Box 915
DARWIN NT 0801
Telephone: 08 8999 5480
Fax: 08 8999 6262
Email: [email protected]

1
March 2011
CHAPTER 1
Overview
1.1 The Commission’s annual Power System Review reports on power system
performance and capacity in the Northern Territory. The Review provides information
and analysis of historical and forecast power system performance, focusing on the
previous financial year, and on the upcoming 10 years.
1.2 This Review reports on actual system and network performance in 2009-10, and on
forecast system performance in the period 2010-11 to 2019-20.
1.3 The Commission engaged a consultant to assist the Commission to prepare the
2009-10 Review by providing expert advice on power system and distribution planning,
and reliability performance.
Key findings
1.4 Regular and comprehensive reporting on power system and distribution network
performance and health is a feature of the electricity supply industry elsewhere in
Australia.
1.5 The 2009-10 Review places an increased focus on electricity demand analysis. The
purpose is to provide a robust assessment of the adequacy of the power system (i.e.
generation) and the transmission and distribution networks (i.e. substations and lines).
1.6 The Commission is aware that electricity businesses operating elsewhere in Australia
have taken some time to establish the systems and processes required to meet
reporting requirements. Consequently, the Commission acknowledged from the outset
that not all the information requested from electricity industry participants in the
Territory, primarily the Power and Water Corporation (PWC), would be available for the
2009-10 Review.
1.7 The Commission expects PWC to provide a more comprehensive data set for the next
Review. In particular, the Commission expects that PWC will have improved demand
forecasts, with the PWC system (generation) demand forecasts available for the
2009-10 Review being too low for the purpose of assessing system adequacy. The
PWC networks demand forecasts appear more reasonable. The Commission notes
that the PWC is instituting information technology systems and business processes
that are intended to provide more complete asset performance information, and
improved electricity demand forecasting.
Generation adequacy
1.8 The generation supply-demand balance provides an assessment of generation
adequacy relative to forecast electricity demand in the Darwin-Katherine, Alice Springs
and Tennant Creek systems for the period 2010-11 to 2019-20.
1.9 Currently, a system is deemed to have adequate generation where there is sufficient
capacity available to maintain supply despite the loss of the two largest units of
generation plant, known as an N-2 event.

2
March 2011
1.10 The Commission considers that further work is necessary to identify an optimum level
of generation capacity for the Territory’s power systems that recognises reliability
performance and cost objectives. The Commission considers that probabilistic analysis
of the adequacy of generation capacity is necessary. This is the approach most
commonly used in Australia for identifying the potential for capacity constraints, and is
a more useful measure for generation planning purposes than the N-X methodology.
Generation adequacy – Darwin-Katherine
• The Darwin-Katherine system is expected to have sufficient generation capacity to
maintain supply under any credible electricity demand scenario despite the loss of
the two largest generation units in the system (an N-2 event) from mid-2011 to
2019-20.
• There is a credible risk of generation capacity constraints and poor generation
reliability during 2011, particularly prior to the commissioning of Channel Island
power station sets 8 and 9 which PWC has advised is expected to occur during
April 2011. There is potential for ongoing capacity constraints if the new Channel
Island plant experiences commissioning problems or from forced outages of
existing plant.
• The capacity being maintained in the Darwin-Katherine system for the period 2012
to 2016 may be greater than is reasonably necessary to maintain reliability of
supply depending on factors such as plant condition, maintenance requirements
and operating practices.
• The need for the planned level of generation capacity and reserves could be
prompted by doubts about the condition and reliability of existing generation plant,
particularly at Channel Island. There seems to be a perceived risk of these assets
failing or not being available for extended periods due to extended maintenance,
but this assumption is not explicitly recognised in PWC Generation planning. It
should be reflected in planning assumptions for the timing and duration of planned
outages or by de-rating of existing capacity.
• If the apparent, but not clearly documented, concerns about the reliability and
availability of the older Channel Island sets prove warranted, the reported available
capacity may be less for extended periods because plant is off-line for
maintenance.
Generation adequacy – Alice Springs
• The Alice Springs system is expected to have sufficient generation capacity to
meet forecast peak demand under any credible electricity demand growth scenario
from mid-2011 to 2019-20.
• There is a credible risk of generation capacity constraints and poor generation
reliability during 2011. The key risk period is prior to the commissioning of Owen
Springs sets 1-3 which PWC has advised is expected to occur by March 2011.
There is the potential for ongoing capacity constraints if the new Owen Springs
plant experiences commissioning problems or from forced outages of existing
plant.
• The level of the available capacity in the Alice Springs system is influenced by the
timing of commissioning new capacity at Owen Springs and decommissioning of
capacity at Ron Goodin. The Commission considers that PWC should keep the

3
March 2011
timing of the installation of new plant under review to optimise the amount of plant
installed or decommissioned on a yearly basis.
Generation adequacy – Tennant Creek
• The generation supply-demand balance in the Tennant Creek system is adequate
for the period to 2019-20.
• New capacity is expected to be commissioned in mid-2011, providing sufficient
capacity to meet an N-2 event for the period to 2019-20.
• Subject to industry standard operation and maintenance practices being followed,
generation capacity is sufficient to meet forecast demand, with a significant reserve
margin for the period January 2011 to June 2020.
Fuel supply
1.11 Natural gas is the main fuel for electricity generation in the Darwin-Katherine, Alice
Springs and Tennant Creek systems. However, a number of generation sets are dual
fuel, and able to use liquid fuels (i.e. diesel) as an alternative fuel source.
1.12 PWC has a range of contingency arrangements to maintain electricity supply in the
event of the partial or complete loss of the primary gas supply from Blacktip, with a
contingency supply arrangement with the Darwin liquid natural gas (LNG) plant,
linepack gas and diesel stocks.
1.13 These alternate fuel sources should provide access to a continued fuel supply to power
stations, even in the circumstances of partial or complete loss of gas from Blacktip due
to production or processing equipment failure or cyclonic activity or a pipeline rupture.
Electricity networks adequacy
1.14 For the 2009-10 Review, the Commission requested PWC Networks (as
owner/operator of the Darwin-Katherine, Alice Springs and Tennant Creek networks) to
provide equivalent information to that routinely reported by transmission and
distribution network operators in the national electricity market (NEM).
1.15 The Commission’s intention was to identify potential network capacity constraints in the
period 2010-11 to 2014-15:
• transmission/sub-transmission feeders that might exceed normal rating;
• bulk and zone substations that might exceed normal rating; and
• distribution feeders that might exceed normal rating.
1.16 Although routinely provided by network operators elsewhere in Australia, this is the first
time that PWC Networks has been requested to provide equivalent information. In
responding to the request, PWC Networks found that not all the information sought is
yet available.
1.17 This is not unexpected given the experience of network operators elsewhere in
Australia, and the Commission anticipates that PWC will take two or three years to
develop the systems and practices to collate and report the requested data. The
Commission expects to be able to provide a more comprehensive analysis of network
capacity and constraints in future Reviews.

4
March 2011
Transmission network adequacy – lines
1.18 Based on the information available, a high level assessment of capacity and
constraints in the Darwin-Katherine system has been undertaken due to the criticality
of the transmission/sub-transmission network to security of supply.
1.19 The analysis indicates a potential capacity constraint in the Palmerston sub-system,
with potential overloading of the Hudson Creek-Palmerston and Hudson
Creek-McMinn’s 66 kV network under first contingency conditions (N-1) in 2012-13 and
2013-14. However, this constraint is expected to be relieved on the completion of
Archer zone substation. The potential for overloading may also be managed by using
the low voltage distribution network to transfer load.
1.20 The Commission cautions that the assessment relies on a number of simplifying
assumptions and is presented to provide a high level indication of capacity and
potential capacity constraints. The Commission expects to provide a more authoritative
assessment in future Reviews as the necessary data becomes available.
Transmission network adequacy – substations
1.21 There are 28 bulk and zone substations across the Darwin-Katherine, Alice Springs
and Tennant Creek systems, with an assessment of substation utilisation possible for
25 substations.
1.22 With all transformers in service, all zone substations should have sufficient capacity to
meet forecast load for 2010-11. The Snell Street zone substation faces an emerging
capacity constraint.
1.23 Under N-1 conditions (i.e. the loss of one transformer), five substations face capacity
constraints in 2010-11 and 2013-14.
• Berrimah 66/11 kV, with 99 per cent utilisation in 2010-11 and 2013-14. PWC
Networks is planning construction of a new East Arm substation (operating from
circa 2015-16) to support the Berrimah substation;
• Centre Yard 66/11 kV, with 100 per cent utilisation in 2010-11 and 120 per cent
utilisation in 2013-14. Centre Yard is a small (0.5 MVA) substation where PWC
Networks is considering supplementing capacity by relocating spare transformers;
• Palmerston 66/11 kV, with 115 per cent utilisation in 2010-11 and 97.5 per cent
utilisation in 2013-14. The Palmerston substation will be supported by the new
Archer zone substation (expected to be operational in 2011) and load transfer
through the low voltage distribution network;
• Katherine 132/22 kV, with 107 per cent utilisation in 2010-11 and 109 per cent
utilisation in 2013-14. The Katherine substation is supported by Pine Creek and
Katherine generation. Accounting for this generation should resolve the apparent
constraint; and
• Snell Street 66/11 kV, with 106 per cent utilisation in 2010-11 and 116 per cent
utilisation in 2013-14. Snell Street represents the most critical constraint due to its
role supplying the Darwin CBD. PWC Networks intends construction of a
replacement substation (operating from circa 2011-12).
1.24 The Commission notes that the poor condition of equipment at the City Zone and Snell
Street substations makes a multiple contingency event a possibility which warrants a
continued priority being given to the capital program associated with the development

5
March 2011
of Frances Bay substation, upgrade of Snell Street substation and replacement of City
Zone substation.
Distribution network adequacy
1.25 PWC Networks was not able to provide the load flow studies or measurements on the
low voltage (11/22 kV) distribution network necessary for an assessment of loading
and capacity. The Commission considers that availability of this data is important and
anticipates that PWC Networks will provide such information for future Reviews.
Reliability
1.26 The Commission has examined reliability for 2005-06 to 2009-10 for:
• generation and network performance in the Darwin region and Katherine region (of the Darwin-Katherine system), Alice Springs and Tennant Creek systems, using a weighted total average of reliability outcomes for each system; and
• central business district (CBD), urban, short rural and long rural feeders (for 2009-10 only), using a weighted total average of feeder reliability for each system.
Generation performance trend
1.27 Territory customers experienced an average of 2.7 generation related outages a year
(SAIFI) between 2005-06 and 2009-10. This is significantly more than observed in the
NEM connected systems (e.g. for the 12 months ended 31 March 2010, Ergon Energy
reported a SAIFI of 0.02).
1.28 The Commission expects generation reliability performance to improve in the coming
years with the commissioning of new generation plant (especially Channel Island sets
8 and 9) and the planned major maintenance to existing generation plant.
Network performance trend – feeder performance
1.29 Examining feeder performance to identify network performance trend is the accepted
approach in Australia. As 2009-10 is the first year this data has been reported, there is
no time series data to compare reliability performance in the Territory over time.
1.30 The Commission has compared feeder performance in the Territory for 2009-10 with
the minimum performance standards applicable to comparable network categories in
Queensland.
1.31 Overall, the PWC feeder performance is reasonable when compared with the
regulatory expectations in Queensland. However, the frequency of outages on long
rural feeders is markedly higher than the minimum performance standard for the
Queensland distributors. The Commission will report feeder performance in future
Reviews to assess feeder performance achieved in the Territory over time.
Customer service performance
1.32 The customer service performance of PWC Networks and PWC Retail is measured
using the following indicators:
• the time taken to complete reconnections and new connections;
• the number of complaints about quality of electricity supply;
• the time taken to answer telephone calls (after the customer has chosen to speak to an operator); and
• the number of complaints about PWC Networks and PWC Retail customer service.

6
March 2011
Reconnections/connections
• the number of reconnections (i.e. those typically made when someone moves into a new residence) occurring within 24 hours is greater than 99 per cent.
• the number of connections to a property in a new subdivision in an urban area occurring within five working days is 92.1 per cent, continuing the improvement in the number occurring in time from a low point of 80.7 per cent in 2006-07.
• the number of connections to a property in a new subdivision in an urban area where minor works are required occurring within 10 weeks is 30.6 per cent, which is worse than in 2008-09 and the worst result in the five year period.
Quality of supply complaints
• The number of quality of supply complaints has increased substantially in Katherine and Tennant Creek from 2008-09. No reason has been given to the Commission.
Telephone call response times
• The reported percentage of telephone calls to PWC answered within 20 seconds of the customer choosing to speak to a human operator was 63 per cent in 2009-10. This represents an improvement from 2008-09, but is below the 76 per cent achieved in 2005-06.
Customer complaints
• PWC received 2477 electricity service related complaints during 2009-10, the highest number received since 2005-06 (2907).

7
March 2011
CHAPTER 2
Introduction
2.1 The Commission’s annual Power System Review reports on power system
performance and capacity in the Northern Territory. The Review provides information
and analysis of historical and forecast power system performance, focusing on the
previous financial year, and on the upcoming 10 years.
2.2 The Review is prepared in accordance with the Electricity Reform Act [s45], which
requires the Commission to:
• report forecasts of electricity load and generating capacity;
• report on the performance of the Territory’s power systems;
• advise on matters relating to the future capacity and reliability of the Territory’s
power systems relative to forecast load;
• advise on other electricity supply industry and market policy matters; and
• review the prospective trends in the capacity and reliability of the Territory’s power
systems relative to projected load growth.
2.3 The Review relates only to the Darwin-Katherine, Alice Springs and Tennant Creek
power systems (referred to as the market systems).1
2.4 The Review is prepared with the assistance and advice of participants in the electricity
supply industry, other electricity industry stakeholders and consultant reports. The input
of all those who have contributed is appreciated, but the views expressed in the
Review are those of the Commission, and may not necessarily reflect those of the
parties consulted.
Overview of 2009-10 Review
2.5 This Review reports on actual system and network performance in 2009-10, and on
forecast system performance in the period 2010-11 to 2019-20.
2.6 The Commission engaged a consultant to assist the Commission to prepare the
2009-10 Review by providing expert advice on power system and distribution planning,
and reliability performance.
Role of expert advisor
2.7 The Commission engaged Evans & Peck2 to assist in development of the information
request to electricity industry participants, collecting relevant information, and providing
1 The activities of electricity industry participants and customers in the market systems are regulated under the Electricity Reform Act, Electricity Networks (Third Party Access) Act and Code and associated legislation.
2 Evans & Peck <www.evanspeck.com> is an infrastructure focused advisory company with over 350 employees,
and experience in economic regulation and pricing, and the planning, construction and operation of energy, water and resources projects and facilities. E&P is a subsidiary of the WorleyParsons Group.

8
March 2011
an assessment of the performance and capacity of the Territory’s power systems and
distribution networks. The advice provided by Evans & Peck to the Commission covers
four main areas:
• assessment of electricity demand and energy forecasts prepared by industry
participants;
• assessment of future capacity and reliability of the power systems and distribution
network;
• assessment of the performance of the Territory’s power systems and distribution
network; and
• advice on electricity supply industry practice.
2.8 In addition to the work of Evans & Peck, the 2009-10 Review draws on reports
prepared for the Commission during 2010.
Availability of information
2.9 The Commission requested Evans & Peck to develop an information request template
that detailed the information required from system participants for preparing the
2009-10 Review. The data specification was based on arrangements for reporting on
system and distribution network health in place elsewhere in Australia.
2.10 Regular and comprehensive reporting on power system and distribution network
performance and health is a feature of the electricity supply industry elsewhere in
Australia.
2.11 The Australian Energy Market Regulator (AER) publishes an annual State of the
Energy Market report to provide a high level overview of energy market activity in
Australia, and supplement the AER’s extensive technical reporting on the energy
sector. The Australian Energy Market Operator (AEMO) publishes detailed reports on
system planning and the operation of energy markets, notably the National
Transmission Network Development Plan, Electricity Statement of Opportunities report
and Power System Adequacy report. At the distribution network level, distribution
network service providers are generally required under jurisdiction specific obligations
to report on distribution planning and performance.
2.12 These reporting arrangements have developed over the past decade or more, during
which time industry participants have built their capacity to provide relevant
information.
2.13 The Commission is aware that electricity businesses operating elsewhere in Australia
have taken some time to establish the systems and processes required to meet
reporting requirements. Consequently, the Commission acknowledged from the outset
that not all the information requested from electricity industry participants in the
Territory, primarily the Power and Water Corporation (PWC), would be available for the
2009-10 Review.
2.14 The Commission expects PWC to provide a more comprehensive data set for the next
Review. In particular, the Commission notes that the PWC is instituting information
technology systems and business processes that are intended to provide more
complete asset performance information.

9
March 2011
Structure and scope of Review
2.15 The structure and scope of this Review is:
• Chapter Three provides some details of the Territory’s electricity industry;
• Chapter Four provides an assessment of the adequacy of electricity generation
supplies relative to forecast peak demand and an assessment of fuel supply
adequacy for the medium term (next three years to 2012-13) and long-term (next
10 years to 2019-20);
• Chapter Five provides an assessment of the adequacy of the electricity
transmission/sub-transmission and distribution networks capacity relative to
forecast peak demand for the period to 2013-14; and
• Chapter Six reports on customer service performance and reliability of supply.

10
March 2011
CHAPTER 3
Electricity supply in the Territory
Introduction
3.1 This chapter provides details of the Territory electricity industry, noteworthy industry
developments and events in 2009-10.
Figure 3.1: Northern Territory energy supply infrastructure

11
March 2011
Electricity industry participants
3.2 Electricity industry participants licensed to operate in the Darwin-Katherine, Alice
Springs and Tennant Creek power systems at 30 June 2010 are listed in Table 3.1.
Table 3.1: Electricity licence holders at 30 June 2010
Licensees Darwin-Katherine Alice Springs Tennant Creek
Generation
PWC Generation
NGD (NT) P/L
Cosmo Power P/L
LMS Generation P/L
PWC Generation
Central Energy Power
PWC Generation
Network PWC Networks PWC Networks PWC Networks
Retail PWC Retail PWC Retail PWC Retail
Source: Utilities Commission.
3.3 PWC generates most electricity for household and business use, operates the
electricity distribution networks and provides retail services to all customers in the
Darwin-Katherine, Alice Springs and Tennant Creek power systems.
3.4 PWC is a vertically integrated electricity supplier which also provides water supply and
sewerage services. The PWC generation, network and retail units operate as separate
businesses with internal transactions between units subject to oversight by the
Commission. PWC is owned by the Territory Government and is subject to oversight by
a shareholding Minister under the Government Owned Corporations Act.
3.5 The remaining industry participants are three generation businesses operating in the
Darwin-Katherine system, and one generation business operating in the Alice Springs
system. These four businesses generate electricity under power purchase agreements
with PWC.
Market statistics
3.6 Table 3.2 provides some key market statistics for the Darwin-Katherine, Alice Springs
and Tennant Creek power systems.
Table 3.2: Key market statistics at 30 June 2010
Darwin-Katherine Alice Springs Tennant Creek
Customers (connections) 59 355 11 876 1485
Generation capacity (MW) 404 72 17
Peak demand (MW) 273 55 7
Electricity sent out (GWh) 1516 229 30
Network length (km) 4829 607 385
Source: Power and Water Corporation. Figures rounded to nearest whole number.
12
March 2011
Industry developments and key events
3.7 Industry developments and key events for 2009-10 are detailed below.
Priority work program
3.8 In August 2009, the Northern Territory Government requested the Commission
undertake a priority work program to increase the efficiency of PWC, improve customer
standards of service and reliability, and where possible, align the Territory electricity
industry with national electricity market practice.
3.9 The work program required the Commission to undertake a series of reviews under
terms of reference approved by the Treasurer. At the time of writing, four reviews are
complete, one is underway and one is yet to start:
• A Review of Full Retail Contestability for Northern Territory Electricity Customers
was started in August 2009. The final report for this Review was provided to the
Treasurer in December 2009 and released publicly in February 2010.
• A Review of Options for Implementation of a Customer Service Incentive Scheme
for Electricity Customers was started in March 2010. The final report was provided
to the Treasurer in July 2010 and released publicly in August 2010.
• A Review of Options for the Development of a Retail Price Monitoring Regime for
Contestable Electricity Customers started in March 2010. The final report was sent
to the Treasurer in October 2010, and released publicly in October 2010.
• A Review of Electricity Standards of Service was started in May 2010. The final
report sent to the Treasurer in November 2010, and released publicly in December
2010.
• A Review of System Planning, Monitoring and Reporting started in December
2010. The final report is to be provided to the Treasurer in mid 2011.
• A Review of Electricity System Planning and Market Operation Roles and
Structures is to start in April 2011. A final report is to be provided to the Treasurer
in mid 2011.
3.10 Each review has involved extensive analysis and consultation with electricity industry
participants, consumers and interest groups.
Natural gas supply
3.11 Natural gas from the Blacktip field in the Bonaparte Gulf was to be used for electricity
generation in the Territory from January 2009. However, construction delays attributed
to difficulties sourcing components and bad weather meant that gas was not available
until late 2009. Full specification gas was available from mid January 2010 in sufficient
quantities to meet electricity generation requirements.
Darwin-Katherine system black on 30 January 2010
3.12 On 30 January 2010, a lightning strike to the 132 kV transmission lines linking the
Channel Island power station and Hudson Creek zone substation led to a black out of
the entire Darwin-Katherine power system – a system black.
3.13 A system black is the most significant and disruptive event that can affect a power
system, and warrants a detailed analysis of the causes and response to identify
implications for system reliability and security.

13
March 2011
3.14 The system black was investigated by the System Controller. The Commission
subsequently provided a separate report to industry participants and the Territory
Government, with an independent assessment of the event.
3.15 The Commission’s main observations about the event and the subsequent response
are:
• the system black was initiated by a lightning strike, but the customer related
impacts were made significantly worse by avoidable errors, such as equipment
failure, inadequate operating procedures and switching errors;
• the event resulted in all customers in the Darwin-Katherine system losing power.
Power was restored in Katherine within 30 minutes, with the rest of the system
gradually restored within 10 hours. The average customer interruption was about
five hours;
• if not for switching errors, Katherine and Pine Creek customers would probably not
have lost power, and Darwin customers would probably have been without power
for a much shorter period; and
• PWC is addressing the issues identified through the incident investigation,
including improving operating procedures and training.
Generation investment program
3.16 PWC Generation announced a major generation investment program in March 2010,
involving the installation at Channel Island power station of two 45 MW dual fuel
turbines. The new generation plant was to provide additional capacity to meet
increasing peak demand and to provide additional reserve capacity to allow major
maintenance on existing generation plant.3
3.17 The new generation plant was initially planned to be operating for the 2010-11 wet
season, but is now expected to be operating from April 2011.
Subsequent developments
3.18 The Commission notes that subsequent developments since July 2010 that will be
addressed in more detail in the 2010-11 Review:
• QEnergy Pty Ltd was granted an Electricity Retail Licence in February 2011.
QEnergy is a retailer in the National Electricity Market (NEM) with customers in
Queensland. The entry of QEnergy into the Territory’s electricity retail market
provides customers with a choice of retailer for the first time since 2002; and
• Alice Springs system black on 7 October 2010 when a generation related outage
caused all Alice Springs customers to lose power. The System Controller provided
the Commission with an investigation report on the incident.
3 Power and Water Corporation, media release, 31 March 2010, <www.powerwater.com.au>,
http://www.powerwater.com.au/newsroom/news_item/2010/rolls_royce_power_for_channel_island.

14
March 2011
CHAPTER 4
Electricity generation
4.1 This chapter examines the capacity and adequacy of electricity generation in the
Darwin-Katherine, Alice Springs and Tennant Creek systems, and reports:
• generation capacity at 30 June 2010;
• system demand forecasts for the medium term (to 2012-13) and long term (to
2019-20);
• the supply-demand balance for the system to 2012-13 and to 2019-20 (a projected
assessment of system adequacy), and actual and potential system constraints
related to generation capacity;
• the adequacy of generation capacity and the reserve margin to 2012-13 and
potential capacity to 2019-20, based on available, committed and proposed
generating capacity; and
• the adequacy of fuel supplies for electricity generation.
Generation capacity
4.2 Electricity supplied in the Darwin-Katherine, Alice Springs and Tennant Creek systems
is generated by PWC Generation and four other licensed generation suppliers with
agreements to supply PWC Generation.
4.3 Table 4.1 presents generation capacity figures as at 30 June 2010. The capacity
reported is the sustainable installed capacity figure for generation plant (i.e. the
capacity available under normal operating conditions).
Table 4.1: Generation capacity in the Darwin-Katherine, Alice Springs and Tennant Creek systems
Darwin Katherine Operator Capacity (MW) Fuel
Channel Island PWC 232 Natural gas/liquid fuel
Weddell PWC 86 Natural gas
Berrimah PWC 30 Liquid fuel
Katherine PWC 21 Natural gas/liquid fuel
Pine Creek NGD(NT)
Cosmo Power 34 Natural gas/liquid fuel
LMS Shoal Bay LMS Generation 1 Landfill gas
Total 404

15
March 2011
Alice Springs Operator Capacity (MW) Fuel
Ron Goodin PWC 59 Natural gas/liquid fuel
Owen Springs PWC 4 Natural gas/liquid fuel
Brewer Central Energy Power 9 Natural gas/liquid fuel
Total 72
Tennant Creek Operator Capacity (MW) Fuel
Tennant Creek PWC 17 Natural gas/liquid fuel
Total 17
Source: Power and Water Corporation. Figures are rounded to the nearest whole number.
Darwin-Katherine – 2009-10
4.4 Just over 82 per cent of total generation capacity is located in the Darwin-Katherine
system, with over 47 per cent at the Channel Island power station. The next most
significant power station in the market systems is the Weddell power station (also in
the Darwin-Katherine system), with about 17 per cent of capacity. About 15 per cent of
total generation capacity is located in the Alice Springs system and 3 per cent in the
Tennant Creek system.
4.5 The Channel Island power station has five dual fuel (gas and diesel) combustion
turbines (sets 1-5) with a capacity of 31.6 MW each, one gas fuelled combustion
turbine (set 7) with a capacity of 42 MW, and one steam turbine (set 6) which operates
as part of a combined cycle block, using the waste heat from sets 4 and 5, to provide
32 MW capacity.
4.6 Each of the sets at Channel Island represents almost 8 per cent of capacity in the
Darwin-Katherine system. The combined cycle block formed by sets 4, 5 and 6 can
produce 95 MW, representing about 23 per cent of capacity in the system.
4.7 Weddell power station has a capacity of 86 MW, comprising two gas fuelled turbines,
each with a capacity of 43 MW. Each set represents about 9 per cent of total capacity
in the Darwin-Katherine system.
4.8 Pine Creek power station, operated by NGD (NT) Pty Ltd and Cosmo Power Pty Ltd
(subsidiaries of Energy Developments Ltd), has 34 MW from three gas fuelled
combustion turbines and three dual fuel combustion turbines. The Pine Creek power
station supplies electricity to PWC Generation under a power purchase agreement.
4.9 Also supplying PWC Generation with electricity under a power purchase agreement in
the Darwin-Katherine system is LMS Generation Pty Ltd, which operates a 1.1 MW
land fill gas generation facility at the Darwin City Council Shoal Bay rubbish dump.
Alice Springs – 2009-10
4.10 Ron Goodin power station in Alice Springs has a capacity of 72 MW comprising three
diesel engines (sets 1, 2 and J) with a combined capacity of 4.7 MW, six dual fuel
engines (sets 3-8) with a combined capacity of 29.1 MW and four gas turbines (sets 9,
10, F and G) with a combined capacity of 25.8 MW.

16
March 2011
4.11 There was a minor change to generation capacity in the Alice Springs system in
2009-10. Capacity at the Ron Goodin power station increased from 58.7 MW to
59.6 MW with the commissioning of a 0.9 MW diesel fuelled engine (set J).
4.12 Owen Springs power station in Alice Springs has a capacity of 3.9 MW, being a dual
fuel combustion turbine that was relocated from Ron Goodin in June 2009. Three dual
fuel combustion turbines, each with 10.9 MW of capacity were installed at the Owen
Springs power station during 2010, and are expected to begin supplying electricity in
the first quarter of 2011.
4.13 Once operating, the Owen Springs power station is intended to replace Ron Goodin
power station, where generating units will be retired gradually over the period to
2018-19.4
4.14 Brewer power station, operated by Central Energy Power Pty Ltd, has 8.5 MW from
four spark fired reciprocating engines. Brewer operates under a power purchase
agreement with PWC Generation.
4.15 Not mentioned in the 2008-09 Review, generation capacity in Alice Springs increased
in 2009 with a 0.3 MW photovoltaic system installed at the Crowne Plaza Alice Springs
as part of the Alice Springs Solar Cities program.5
4.16 This PV system is not included in calculations of system capacity because the
electricity is generated for use on site only. During optimal operating conditions, the
Crowne Plaza system is expected to reduce total system load by about 0.5 per cent.
Tennant Creek – 2009-10
4.17 The Tennant Creek power station has a capacity of 16.7 MW, comprising seven diesel
engines (sets 1-5 and 16) with a combined capacity of 8 MW, five gas engines (sets
10-14) with a combined capacity of 4.8 MW and a dual fuel turbine (set 15) with a
capacity of 3.9 MW.
Power purchase agreements
4.18 PWC Generation was supplied electricity during 2009-10 by four businesses licensed
to operate as independent power producers:
• in the Darwin-Katherine system, NGD (NT) Pty Ltd and Cosmo Power Pty Ltd
(subsidiaries of Energy Developments Ltd) operate Pine Creek power station;
• in the Darwin-Katherine system, LMS Generation Pty Ltd operates a land fill gas
generation facility at the Darwin City Council Shoal Bay rubbish dump; and
• in the Alice Springs system, Central Energy Power Pty Ltd operates Brewer Estate
power station.
4.19 These four firms currently operate generation equipment with a total capacity of about
44 MW, or potentially about 9 per cent of total generation capacity of the market
systems.
4 Power and Water Corporation website <www.powerwater.com.au>, viewed 10 February 2011,
http://www.powerwater.com.au/about_us/major_projects/owen_springs_power_station.
5 Alice Solar City website <www.alicesolarcity.com.au>, viewed 2 March 2011,
http://www.alicesolarcity.com.au/iconic-projects.

17
March 2011
Generation supply-demand balance
4.20 The generation supply-demand balance is an assessment of whether available
generation capacity is adequate to meet forecast electricity demand. To make this
assessment the Commission has used:
• generation capacity projections for 2010-11 to 2012-13, and advice of generation
investment plans for 2013-14 to 2019-20; and
• electricity demand forecast scenarios for 2010-11 to 2019-20.
Projected available generation capacity
4.21 Generation capacity projections for the Darwin-Katherine, Alice Springs and Tennant
Creek systems for 2010-11 to 2012-13 are provided in the tables below.
4.22 The capacity projections are based on advice by industry participants to the
Commission of available capacity, planned generation additions and retirements in the
period 2010-11 to 2019-20. Capacity projections for the period 2013-14 to 2019-20 are
not reported due to uncertainty about outcomes versus plans. The Commission
cautions that the timing of additions and retirements of capacity may vary in response
to commercial priorities of electricity industry participants, construction or
commissioning delays and changing electricity peak demand forecasts.
4.23 The Commission will be seeking more specific estimates of generation commitments
and future generation capacity for the next Review. The information available for the
2009-10 Review on the timing of new capacity was generally limited to the estimated
year of commissioning. This is not sufficient to allow an informed assessment of the
within year supply-demand balance. Consequently, the Commission has made
assumptions about the likely month that new capacity will become available based on
available information and good industry practice.
Darwin-Katherine system
4.24 Table 4.2 provides the Commission’s assessment of generation capacity in the
Darwin-Katherine system for 2010-11 to 2012-13. The starting capacity of the
Darwin-Katherine system for 2010-11 is 404 MW.
Table 4.2: Darwin-Katherine capacity projections (MW) 2010-11 to 2012-13
Year (30 June) Retirements New capacity Total Capacity Comment
2010-11 37.5 86 452.5
Less Berrimah
Less Pine Creek B
Plus Channel Island sets 8&9
2011-12 - 54.1 506.6 Plus Weddell set 3
Plus Katherine set 4
2012-13 - - 506.6
Source: Power and Water Corporation and Utilities Commission.
4.25 PWC has advised that Berrimah power station will be removed from regular service in
2010-11, reducing the system capacity by 30 MW. The Commission has excluded
Berrimah power station from the calculation of available generation capacity for
2010-11 on the understanding that the equipment is aged, in poor condition and may

18
March 2011
not be available for service, even in an emergency situation. PWC advises that the
expiry of the Pine Creek B power purchase agreement in April 2011 will reduce
available capacity by a further 7.5 MW.
4.26 New capacity of 86 MW is expected to become available during 2010-11 with the
planned commissioning of Channel Island power station sets 8 and 9 from April 2011
with each providing 43 MW of capacity. The new plant was initially to be commissioned
by October 2010.6 PWC advises the Commission that the plant is to be commissioned
from April 2011.
4.27 New capacity of 54.1 MW is expected to become available in 2011-12 with the
commissioning of:
• Katherine power station set 4 in September 2011, adding 12 MW of capacity. This
timeframe is a Commission estimate. PWC advises that this set is to be relocated
from Ron Goodin power station (where it is currently designated as set 10) during
2011, but has not advised the timing of the set being decommissioned at Ron
Goodin or recommissioned at Katherine. The Commission has assumed the set will
be decommissioned once new capacity is available from Owen Springs power
station (March 2011), and that the relocation and upgrading will take four months;
and
• Weddell power station set 3 (42 MW) in early 2012. No definite advice is available
from PWC on the month of commissioning. The Commission has assumed set 3
will be available from January 2012.
Alice Springs system
4.28 The starting capacity of the Alice Springs system for 2010-11 is 72 MW.
Table 4.3: Alice Springs capacity projection (MW) 2010-11 to 2012-13
Year (30 June) Retirements New capacity Total Capacity Comment
2010-11 14.1 33.7 91.6
Plus Owen Springs sets 1,2&3
Plus Uterne solar power station
Less Ron Goodin sets 10, F&G
2011-12 - - 91.6
2012-13 4.2 - 87.3 Less Ron Goodin set 3
Source: Power and Water Corporation and Utilities Commission.
4.29 New capacity of 32.7 MW is expected to become available in 2010-11 with the
commissioning of Owen Springs power station sets 1, 2 and 3 from March 2011, each
with 10.9 MW of capacity. PWC advises that electricity should be available from this
new plant in the first quarter 2011.7
4.30 As part of the Alice Springs Solar Cities program a 0.96 MW solar power station is
scheduled to be operating in Alice Springs from May 2011. The facility is owned by
6 Power and Water Corporation website, viewed 17 February 2011,
http://www.powerwater.com.au/newsroom/news_item/2010/rolls_royce_power_for_channel_island.
7 Power and Water Corporation website, viewed 17 February 2011,
http://www.powerwater.com.au/about_us/major_projects/owen_springs_power_station.

19
March 2011
Uterne Power Plant Pty Ltd, and all production is to be sold to PWC Generation under
a power purchase agreement.8
4.31 Also as part of the Solar Cities program a 0.2 MW photovoltaic system at the Alice
Springs Airport was commissioned in September 2010. This PV system is not included
in calculations of system capacity because the electricity is generated for use on site
only. Under optimal operating conditions the Alice Springs Airport system is estimated
to supply about 25 per cent of the airport electricity demand. 9
4.32 The new capacity becoming available in 2011 will offset a 14.1 MW reduction in
capacity from the planned retirement of Ron Goodin power station sets F (2 MW) and
G (2 MW), and the planned relocation of Ron Goodin power station set 10 (10 MW) to
the Katherine power station from April 2011. PWC has advised that the plant at Ron
Goodin will be decommissioned in 2010-11, but has not advised the month of
decommissioning. The Commission has assumed the set will be decommissioned once
new capacity is available from Owen Springs power station.
4.33 PWC advises that Ron Goodin set 3 (4.2 MW) is to be retired in 2012-13. The
Commission has assumed that the set will be decommissioned in January 2013. All
generation at Ron Goodin is to be gradually removed from service between 2010-11
and 2018-19.
Tennant Creek system
4.34 The reported starting capacity of the Tennant Creek system for 2010-11 is 16.7 MW.
Table 4.4: Tennant Creek capacity projection (MW) 2010-11 to 2012-13
Year (30 June) Retirements New capacity Total Capacity Comment
2010-11 - - 16.7
2011-12 - 1.5 18.2 Plus set 17
2012-13 - - 18.2
Source: Power and Water Corporation and Utilities Commission.
4.35 PWC advises that 1.5 MW of new capacity will be commissioned at the Tennant Creek
power station from July 2011.
System demand forecasts
4.36 Electricity system demand is the generation capacity (in megawatts) required to meet
the electricity consumption (in megawatt hours) of customers at a point in time.
4.37 System demand is determined by household, business and industrial electricity
consumption patterns, which are influenced by weather, population growth and
household formation, economic growth and the development of energy intensive
industrial projects.
8 Alice Solar City website <www.alicesolarcity.com.au>, viewed 17 February 2011,
http://www.alicesolarcity.com.au/sites/default/files/Media%20Release%20-%20Uterne%20Solar%20Power%20Station%20announcement%2015%20Dec%202010.pdf.
9 Alice Solar City website <www.alicesolarcity.com.au>, viewed 17 February 2011,
http://www.alicesolarcity.com.au/iconic-projects.

20
March 2011
4.38 The focus of a system demand forecast is the expectation of maximum or ‘peak’
demand. Forecasts of peak demand are used to inform decisions about the
supply-demand balance and the management of the electricity system to ensure a
reliable and secure electricity supply:
• the system operator (the System Controller in the Territory) will use peak demand
forecasts to determine the generation capacity operating and in reserve that must
be available in the short term (e.g. in the next half hour and over the day) to meet
customer energy use; and
• system participants will use peak demand forecasts to develop their maintenance
program and to identify potential generation investment opportunities in the longer
term (e.g. in three years time).
Development of system demand forecast scenarios
4.39 System demand forecasts for Territory power systems are produced by:
• PWC, through its System Controller role, will develop demand forecasts to use to
ensure there is sufficient generation capacity available to meet demand as part of
the day to day operation of the power systems; and
• the Commission, which is required under the Electricity Reform Act [s45(1)(a)] to
develop forecasts of overall electricity load and generating capacity in consultation
with participants in the electricity supply industry.
4.40 PWC Generation, PWC Networks and PWC Retail (and any other generator and
retailer operating in the Territory) would also require system demand forecasts to
schedule maintenance, to identify potential generation investment opportunities,
potential network constraints and to inform estimates of energy sales.
4.41 PWC has been the sole market generator and sole retailer operating in the Territory,
which puts it in a unique situation for Australia of having access to comprehensive
information on historical and prospective peak demand and energy consumption.
4.42 For example, a new customer wanting to establish an energy intensive business
activity would necessarily approach PWC Retail to negotiate an electricity supply
contract. These negotiations would in some way involve PWC Generation and PWC
Networks, informing their understanding and expectations of future peak demand and
energy consumption in the power system, and decisions about the timing and location
of new generation investment.
4.43 In contrast, there is no longer any vertically integrated electricity business in the NEM
or the Western Australia south west interconnected system (SWIS). In these systems,
the independent market and system operator is responsible for developing a
coordinated and independent system demand forecast, based on information from all
market participants.10
10
The Australian Energy Market Operator prepares the Electricity Statement of Opportunities and Power System Adequacy documents for the NEM, available from <www.aemo.com.au>. The Independent Market Operator prepares an Electricity Statement of Opportunities document for the Western Australian SWIS, available from <www.imowa.com.au >.

21
March 2011
PWC system demand forecasts
4.44 For the 2009-10 Review, the Commission started with PWC system demand forecast
scenarios for the period 2010-11 to 2019-20 (prepared in late 2010) to develop
forecasts of demand for the period 2010-11 to 2019-20 for the Darwin-Katherine, Alice
Springs and Tennant Creek systems.
4.45 A range of quantitative and qualitative data was reviewed to determine if the PWC
forecasts represent credible system demand scenarios. The Commission has identified
a number of areas for continuous improvement, but notes that PWC is taking steps to
address some of the deficiencies in the forecasting process. The findings include:
• the information underpinning the system demand forecasts was not of the standard
that could be expected in support of the associated infrastructure investment
program;
• inconsistencies between top down and bottom up forecasts – that is, the overall
system demand forecast and the localised zone substation forecast;
• the forecasting process was poorly documented with the assumptions underpinning
forecasts not always apparent or specified; and
• the forecasting process lacked key elements considered routine according to good
industry practice, particularly weather correction of data and use of econometric
modelling.
4.46 Evans & Peck found that the PWC system demand forecasts for the purposes of
testing system adequacy for the period 2010-11 to 2019-20 are probably too low.
However, a conclusive opinion of system demand growth over the period requires a
comprehensive analysis using the elements common to the preparation of robust
demand forecasts.
4.47 The Commission expects that PWC will in the future develop a consolidated system
demand forecast that is sufficiently robust for the purposes of accurately assessing the
supply-demand balance, including by adopting forecasts that are management
sanctioned and confirmed by external review.
Forecast system demand scenarios
4.48 The Commission is adopting the Evans & Peck Medium system demand growth
scenario for assessing system adequacy in the Darwin-Katherine, Alice Springs and
Tennant Creek systems for the period 2010-11 to 2019-20. Table 4.5 compares the
Evans & Peck Medium scenario with the PWC Medium and High scenarios for the
period to 2010-11 to 2019-20.
Table 4.5: System demand growth scenarios for 2010-11 to 2019-20
Forecast demand growth
(% per annum) Medium (E&P) Medium (PWC) High (PWC)
Darwin-Katherine 2.8 2.2 2.6
Alice Springs 1.7 1.2 1.6
Tennant Creek 2.0 0.6 1.1
Source: Evans & Peck and Power and Water Corporation.
4.49 The Commission considers that the PWC demand forecast scenarios may be too low
for the purposes of assessing system adequacy, particularly for the period from

22
March 2011
2015-16. However, the period 2015-16 to 2019-20 is outside the critical period for
identifying a shortfall in the supply-demand balance, and there remains sufficient time
to reconsider potential peak demand for that period and for system participants to
adjust future generation investment programs.
4.50 The Commission is aware that PWC is developing more effective forecasting
techniques and capability to improve the reliability of longer term demand forecasts.
4.51 The Evans & Peck Medium (the Commission’s baseline scenario), PWC Medium and
PWC High forecast system demand scenarios for the Darwin-Katherine, Tennant
Creek and Alice Springs systems are presented in charts 4.2, 4.3 and 4.4. Tables A.1,
A.2 and A.3 in Appendix A provide the forecast maximum demand for 2010-11 to
2019-20.
Chart 4.2: Forecast Darwin-Katherine annual maximum system demand 2010-11 to 2019-2020
Source: Evans & Peck and Power and Water Corporation.

23
March 2011
Chart 4.3: Forecast Alice Springs annual maximum system demand for 2010-11 to 2019-20
Source: Evans & Peck and Power and Water Corporation.
Chart 4.4: Forecast Tennant Creek annual maximum system demand for 2010-11 to 2019-20
Source: Evans & Peck and Power and Water Corporation.
4.52 The Evans & Peck Medium system demand growth scenario for Tennant Creek is
signficantly higher than the PWC High scenario. A reason could be that Evans & Peck

24
March 2011
does not have forward looking information about factors that might influence demand
growth in the small Tennant Creek system, such as building approvals and local
industry development. The Commission notes that the Evans & Peck projection is in
line with average annual demand growth for 2005-06 to 2009-10.
Major projects
4.53 Consistent with the methodology adopted by PWC, the Commission considers that
major energy using projects should be excluded from the forecasting process and
treated on a case by case ‘contingent’ project basis. The Commission considers that:
• major projects have varying impacts on energy infrastructure, depending on energy
intensity, onshore or offshore locations and the multiplier effects in the local
community;
• the Territory’s electricity system and distribution networks are relatively small, and
a major project can represent a significant percentage of generation capacity;
• these projects may have their own generation capacity, and may not require
electricity from the system; and
• there is considerable uncertainty about the timing of projects, due to factors such
as global markets, availability of finance and timing of local and national approvals
processes.
4.54 No major projects are factored into the PWC demand forecast scenarios for 2010-11 to
2012-13.
Generation supply-demand balance
4.55 The generation supply-demand balance provides an assessment of generation
adequacy relative to forecast electricity demand in the Darwin-Katherine, Alice Springs
and Tennant Creek systems for:
• the short to medium term – 2010-11 to 2012-13; and
• the medium to long term – 2014-15 to 2019-20.
4.56 The Commission has used two techniques to assess the generation supply-demand
balance:
• an N-X analysis of generation adequacy, which tests whether generation capacity
is adequate to meet peak system demand under the medium growth scenario at
N-X. This is the approach adopted by the Commission for previous Power System
Reviews; and
• for the Darwin-Katherine system only, a probabilistic analysis, which establishes a
loss of load probability (LOLP) to identify the likelihood of generation constraints
occurring over the assessment period. This is the approach most commonly
adopted for generation planning purposes in Australia.
N-X analysis of generation adequacy
4.57 An N-X analysis of generation adequacy involves progressively subtracting the largest
unit of capacity from total installed capacity. For example:
• N is the system capacity regarded as available for service;
• N-1 is the system capacity minus the largest unit of generation in the system; and
• N-2 is the system capacity minus the two largest units in the system.
25
March 2011
4.58 The N-X approach is a straightforward method for assessing the level of reserve
capacity and identifying actual or potential generation constraints at a point in time at a
given level of demand.
4.59 The Commission notes that the PWC Statement of Corporate Intent (SCI), which is a
contract between the shareholding Minister and PWC about technical and financial
performance, has used the N-2 criterion to establish the level of reserve capacity
required for each power system.
4.60 The Commission has identified the N-X capacity for the Darwin-Katherine, Alice
Springs and Tennant Creek systems for the period 2010-11 to 2019-20, based on
advice from system participants about future generation capacity. Table 4.6 provides
the capacity available in each system at N-1 and N-2 as at 31 December 2010.
Table 4.6: N-X capacity for 2010-11
N-X capacity (MW) N N-1 N-2
Darwin-Katherine 374.0 326.4 278.8
Alice Springs 71.1 59.4 49.3
Tennant Creek 16.7 12.8 11.3
Source: Utilities Commission. Note: the N-X capacities change over time as generation sets are added and replaced.
4.61 In the Darwin-Katherine system:
• N-1 is 47.6 MW, which represents the loss of 50 per cent of the capacity of the combined cycle block at Channel Island power station (i.e. the loss of one dual fuel turbine and 50 per cent of the steam turbine); and
• N-2 is 95.2 MW, which represents the loss of the combined cycle block at Channel Island power station.
4.62 In the Alice Springs system:
• N-1 is 11.7 MW, which represents the loss of set 9 at Ron Goodin power station; and
• N-2 is 21.8 MW, which represents the loss of set 9, and set 10 (10.1 MW) at Ron Goodin power station.
4.63 In the Tennant Creek system:
• N-1 is 3.9 MW, which represents the loss of set 15 at Tennant Creek power station; and
• N-2 is 5.4 MW, which represents the loss of sets 15 and 16 (1.5 MW) at Tennant Creek power station.
Loss of load probability
4.64 The LOLP is an indicator of generation reliability commonly used in Australia for
assessing system adequacy and generation planning purposes. The LOLP indicates
the probability that generation capacity will be insufficient to meet demand at some
point over some specific period. It is considered a more useful measure for planning
purposes than the N-X methodology.
4.65 A probabilistic analysis of the adequacy of generation capacity, such as the LOLP, has
not been previously applied by the Commission. PWC Generation does not currently
undertake any probabilistic analysis.

26
March 2011
Generation supply-demand balance – Darwin-Katherine system
4.66 The Darwin-Katherine system is expected to have sufficient generation capacity to
meet forecast peak demand under any credible demand growth scenario in the
medium and long term.
4.67 In the short term, there is a credible risk of generation capacity constraints and poor
generation reliability during 2011. The key risk period is prior to April 2011 and the
commissioning of Channel Island sets 8 and 9. There is the potential for ongoing
capacity constraints the expected commissioning date if the new Channel Island plant
experiences teething problems or from forced outages of existing plant.
4.68 For the period 2012 to 2019-20, there appears to be sufficient generation capacity
available to provide an estimated average reserve margin of 60 per cent. In the period,
January 2012 to April 2016, the average reserve plant margin is estimated at 73 per
cent. The minimum reserve plant margin in the period is 57 per cent in late 2015 when
forecast peak demand reaches 323 MW against capacity of 508 MW (representing
reserve capacity of 185 MW). This comfortably exceeds the N-2 criterion of 95.2 MW.
4.69 The supply-demand balance and generation adequacy is influenced by the current
maintenance program for 2010 to 2016 for generation plant in the Darwin-Katherine
system.11
4.70 Accounting for planned maintenance in the period January 2012 to April 2016 the
average reserve plant margin is estimated at 61 per cent. The minimum reserve plant
margin experienced in the period is 43 per cent in November 2015 when forecast peak
demand reaches 323 MW against available capacity of 461 MW (representing reserve
capacity of 138 MW). This exceeds the N-2 criterion of 95.2 MW.
4.71 The reserve plant margin being maintained in the Darwin-Katherine system for the
period 2012 to 2016 may be greater than what is reasonably necessary to maintain
reliability of supply depending on factors such as plant condition, maintenance
requirements and operating practices. The Commission considers that further work is
necessary to identify an optimum level of generation capacity to balance reliability
performance and cost objectives.
4.72 For example, if the Weddell set 3 (42 MW) planned for commissioning in early 2012 is
excluded from the supply-demand balance calculation (including accounting for
planned maintenance), the average reserve plant margin for January 2012 to
April 2016 is estimated at 47 per cent, with a minimum reserve plant margin of
30 per cent in late 2015 (representing reserve capacity of 96 MW). This just exceeds
the N-2 criterion of 95.2 MW.
4.73 The need for the planned level of generation capacity and reserves could be prompted
by doubts about the condition and reliability of existing generation plant, particularly at
Channel Island. If so, the Commission considers that these doubts should be reflected
in the generation maintenance program to recognise the availability and reliability of
generation plant and to support the generation capital investment program.
11
The PWC Generation, Generation North Five Year Maintenance Program for 2010-2016 was provided to Evans & Peck.
27
March 2011
N-X analysis – Darwin-Katherine
4.74 An N-X analysis of the supply-demand balance for the Darwin-Katherine system is
presented in Chart 4.5. The analysis assumes that peak demand increases according
to the Evans & Peck Medium scenario (2.8 per cent a year),12 that all capacity is
available (i.e. without accounting for planned maintenance), and that no capacity
additions are made after 30 June 2013. The key points are:
• there is sufficient capacity to meet an N-2 event only until April 2011;
• the commissioning of Channel Island sets 8 and 9 from April 2011 provides
sufficient capacity to meet in excess of an N-2 event until 2019-20; and
• the commissioning of Weddell set 3 from January 2012 provides sufficient capacity
to meet in excess of an N-2 event (between January 2012 to April 2016) or the loss
of 181.2 MW.
Chart 4.5: Darwin-Katherine system supply-demand balance for 2010-11 to 2019-20
Source: Evans & Peck and Utilities Commission.
4.75 The potential for capacity constraints to cause adverse reliability outcomes during 2011
will remain a concern until the successful commissioning of sets 8 and 9, including
resolving any commissioning problems that may occur with new plant. The effect on
reliability associated with new plant is exampled by the reliability problems experienced
when PWC generation was bringing Weddell power station into service in 2008-09.
12
The Commission performed a sensitivity test of the implications for the supply-demand balance of demand growth of 3.5 per cent a year, finding that the higher demand growth scenario had no appreciable adverse affect on generation adequacy relative to the chosen demand growth scenario until about 2016.

28
March 2011
4.76 Subject to industry standard operation and maintenance practices being followed,
generation capacity should be sufficient to provide spare capacity above the N-2
criterion from January 2012 to 2019-20 under credible demand forecast scenarios.
Reserve plant margin
4.77 An alternative indicator of system adequacy is the reserve plant margin, which is
calculated as the total system capacity available less the actual maximum demand for
electricity in a particular year, expressed as a percentage of maximum demand.
4.78 The Commission does not yet have a view on an appropriate benchmark reserve plant
margin for each Territory power system. Evans & Peck advised that a starting point
benchmark for a small power system is upwards of 20 per cent, subject to factors
including the size of individual plant relative to total system load.
4.79 The Darwin-Katherine system (accounting for planned outages) has an estimated
average reserve plant margin of 65 per cent for the period July 2011 to June 2013, and
of 50 per cent for the period July 2011 to June 2020. The reserve plant margin reaches
a minimum of 21 per cent in late 2019, and is above 50 per cent until July 2011 to
March 2015.
4.80 Chart 4.6 presents the estimated probability of the Darwin-Katherine reserve plant
margin falling below 20 per cent in the period 2010-11 to 2019-20.
Chart 4.6: Probability of a Darwin-Katherine system reserve plant margin of below 20 per cent 2010-11 to
2019-20
Source: Evans & Peck.
Darwin-Katherine system LOLP
4.81 To supplement the N-X analysis of adequacy in the Darwin-Katherine system, the
Commission has assessed the LOLP, using a LOLP of a one day loss in 10 years (or
0.027 per cent) as the benchmark of a reliable system. A LOLP greater than 0.027 per
cent is indicative of an unreliable system.

29
March 2011
4.82 Evans & Peck developed a simple probabilistic model for the Darwin-Katherine system
to complement the N-X analysis of generation adequacy. The Commission stresses
that this LOLP assessment has limitations, with additional information required to
reflect good industry practice, and provide a robust planning tool. However, the
Commission seeks to encourage participants in the Territory’s electricity sector to use
probabilistic analysis as the primary tool for assessing system adequacy and
generation planning purposes.
4.83 Chart 4.6 shows that the LOLP for the Darwin-Katherine system for the period 2010-11
to 2019-20 is generally at an acceptable level, except for the period to July 2011 prior
to Channel Island sets 8 and 9 entering service, and towards 2020 as load growth
erodes the reserve plant margin.
Chart 4.7: Darwin-Katherine system loss of load probability (LOLP) 2010-11 to 2019-20
Source: Evans & Peck.
4.84 The annual average LOLP are presented in Table 4.7. Years where the average is
greater than the benchmark of 0.027 per cent are shaded.
Table 4.7: Darwin-Katherine system average annual LOLP for 2010-11 to 2019-20
Period LOLP (%) Period LOLP (%)
2011 0.15 2016 0.00
2012 0.00 2017 0.04
2013 0.00 2018 0.025
2014 0.00 2019 0.06
2015 0.00 2020 0.008
Source: Evans & Peck.

30
March 2011
4.85 Table 4.7 (with charts 4.6 and 4.7) highlight that the most critical period for potential
poor generation reliability in the Darwin-Katherine system is the first three months of
2011 or until Channel Island sets 8 and 9 are operating, and then from 2017.
Implications of generation plant condition and the maintenance program
4.86 Planned and unplanned outages could have a significant influence on the incidence of
generation constraints and poor reliability performance until Channel Island sets 8 and
9 are in service.
4.87 Historical generation reliability performance suggests that maintaining a reliable system
under N-2 conditions is not guaranteed. As noted in the PWC 2010-11 Statement of
Corporate Intent:13
…ongoing investigations have found that the previous estimates of the residual life of
many assets may have been optimistic and that additional urgent refurbishment or
replacement of key assets is needed….Because of increasing reliability issues with
generation assets, a revised Generation capital investment strategy was developed
and approved in February 2010.
4.88 Chart 4.8 presents the generation supply-demand balance for the Darwin-Katherine
system, with capacity adjusted to exclude generation plant not available due to
scheduled maintenance.
Chart 4.8: Darwin-Katherine supply-demand balance for 2010-11 to 2019-20 (with planned maintenance)
Source: Evans & Peck and Utilities Commission.
13
Power and Water Corporation, 2010-11 Statement of Corporate Intent, page 24.

31
March 2011
4.89 The maintenance schedule used by Evans & Peck to determine available capacity in
each month was provided by PWC Generation. The Commission cannot comment on
the detail of the maintenance program, but notes that variation to the timing and
duration of planned maintenance could have implications for generation constraints
and reliability performance, particularly during 2011.
4.90 Similarly, unplanned outages due to plant failure could have adverse implications for
generation reliability performance during 2011. The Commission notes that new plant
can experience initial teething problems in construction or commissioning, which could
delay the new capacity (Channel Island sets 8 and 9, Weddell set 3) becoming
available for service. Consequently, the Commission considers there is an ongoing
credible risk of generation capacity constraints during 2011, and potentially into 2012.
Concluding comments – Darwin-Katherine system adequacy
4.91 A central concern of the Commission is that the generation capital and maintenance
programs may not be aligned. It is understood that the capital program is intended to
provide additional capacity to meet increasing demand, but also in case of higher
failure rates and extended outages for maintenance due to the not completely known
(but expected to be poor) condition of generation plant at Channel Island.
4.92 There seems to be a perceived risk of these assets failing or not being available for
extended periods due to extended maintenance, but this assumption is not explicitly
recognised in PWC Generation planning. It should be reflected in planning
assumptions for the timing and duration of planned outages or by de-rating of existing
capacity. If the apparent, but not clearly documented, concerns about the reliability and
availability of the older Channel Island sets prove warranted, the reserve margin may
be less for extended periods because plant is off-line for maintenance.
Generation supply demand balance – Alice Springs
4.93 The Alice Springs system is expected to have sufficient generation capacity in the
medium and long term to meet forecast peak demand under any reasonable demand
growth scenario.
4.94 In the short term there is a credible risk of generation capacity constraints and poor
generation reliability during 2011. The key risk period is prior to the commissioning of
Owen Springs sets 1-3, expected in March 2011. There is the potential for ongoing
capacity constraints after March 2011 if the new Owen Springs plant experiences
teething problems from forced outages of existing plant.
4.95 For the period 2012 to 2019-20 there appears to be sufficient generation capacity
available to provide an estimated average reserve plant margin of 77 per cent, with a
minimum reserve plant margin of 42 per cent in late 2017 when forecast peak demand
reaches 63 MW against capacity of 90 MW (representing reserve capacity of 27 MW).
This exceeds the N-2 criterion of 22.6 MW.
4.96 The level of the reserve plant margin for the Alice Springs system is influenced by the
timing of commissioning new capacity at Owen Springs and decommissioning of
capacity at Ron Goodin. PWC Generation has not provided a clear timetable (month
and year) for commissioning/decommissioning of plant. The timing of the installation of
new plant should be kept under review to optimise the amount of plant installed on a
yearly basis.
4.97 PWC Generation has not provided the Commission with a maintenance program for
generation plant in the Alice Springs system. The number and duration of planned

32
March 2011
outages may have an effect on the supply-demand balance and the assessment of
generation adequacy.
N-X analysis – Alice Springs system
4.98 An N-X analysis of the supply-demand balance for the Alice Springs system is
presented in Chart 4.9. The analysis assumes that peak demand increases according
to the Evans & Peck Medium demand growth scenario (1.7 per cent a year) and that all
capacity is available (i.e. without accounting for planned maintenance). The key points
are:
• there is sufficient capacity to meet an N-1 event only until March 2011; and
• after the commissioning of Owen Springs sets 1-3 from March 2011, there is
sufficient capacity to meet an N-2 event until 2019-20, subject to the timing of
commissioning/decommissioning of plant.
Chart 4.9: Alice Springs system supply-demand balance for 2010-11 to 2019-20
Source: Evans & Peck and Utilities Commission.
4.99 The average reserve plant margin for the Alice Springs system for July 2011 to
December 2020 is 77 per cent. The average reserve plant margin for July 2011 to June
2013 is 78 per cent. The estimated minimum reserve plant margin is 27 per cent in the
January to March 2011, and then 42 per cent in late 2017.
Concluding comments – Alice Springs system adequacy
4.100 There is a potential for capacity constraints and adverse generation reliability during
2011, especially if the new plant at Owen Springs experiences teething problems.
4.101 The period 2012-2013 to 2015-16 requires monitoring to ensure that generation
constraints do not occur. Such constraints, if they appear likely, could be managed

33
March 2011
through maintaining plant in service at Ron Goodin, or advancing commissioning of
plant at Owen Springs.
4.102 The supply-demand balance for the period 2010-11 to 2019-20 is subject to the
scheduled commissioning/decommissioning program for plant at Owen Springs and
Ron Goodin, and the generation plant maintenance program. The Commission
requires more detailed information about these programs to confidently comment on
generation adequacy over the review period.
Generation supply demand balance – Tennant Creek
4.103 The generation supply-demand balance in the Tennant Creek system is adequate for
the period to 2019-20.
N-X analysis – Tennant Creek system
4.104 An N-X analysis of the supply-demand balance for the Tennant Creek system is
presented in Chart 4.10. The analysis assumes that peak demand increases according
to the Evans & Peck Medium demand growth scenario (2.0 per cent a year) and that all
capacity is available (i.e. without accounting for planned maintenance).
4.105 The key points are:
• new capacity of 1.5 MW is expected to be commissioned in mid 2011; and
• there is sufficient capacity to meet an N-2 situation for the period 2010-11 to
2019-20.
Chart 4.10: Tennant Creek system supply-demand balance for 2010-11 to 2019-20
Source: Evans & Peck and Utilities Commission.
4.106 The estimated average reserve plant margin for the Tennant Creek system for the
period January 2011 to June 2013 is 161 per cent, with an estimated minimum reserve
margin of 122 per cent in the period January to May 2011.

34
March 2011
4.107 The estimated average reserve plant margin for the period January 2011 to June 2020
is 149 per cent, with a minimum of 102 per cent in early 2020.
Concluding comments – Tennant Creek system adequacy
4.108 Subject to industry standard operation and maintenance practices being followed,
generation capacity is sufficient to meet forecast demand, with a significant reserve
margin for the period January 2011 to June 2020.
Fuel supplies
4.109 Natural gas is the main fuel for electricity generation in the Darwin-Katherine, Alice
Springs and Tennant Creek systems. However, a number of generation sets are dual
fuel, and able to use liquid fuels (i.e. diesel) as an alternative fuel source.
Natural gas supply
Amadeus Basin gas fields
4.110 Natural gas originally from the Palm Valley field and subsequently from the Mereenie
field in the Amadeus Basin in central Australia has been the main fuel for electricity
generation in the Territory for many years, starting with Alice Springs in 1983. Gas has
been used for electricity generation in the Darwin-Katherine and Tennant Creek
systems since 1987 following the commissioning of the Amadeus Basin to Darwin gas
pipeline (now termed the Amadeus gas pipeline or AGP) in December 1986.
4.111 The Palm Valley and Mereenie fields have declining reserves, and have not been able
to supply sufficient gas since late 2008 for all electricity generation requirements in the
Darwin-Katherine system in addition to supplying the smaller Alice Springs and
Tennant Creek systems.
4.112 The Palm Valley field is operated by Magellan Petroleum Australia Ltd and the
Mereenie field by Santos Ltd. Together these companies own both fields outright.
4.113 Under gas supply contracts between Magellan and Santos, and PWC (through Gasgo
Pty Ltd, a PWC subsidiary), supply from the Mereenie field ceased generation from
December 2009, while supply from the Palm Valley field will cease in January 2012.
Blacktip gas field
4.114 The Blacktip gas field is located in the Bonaparte Gulf about 100 km west of Wadeye,
and is owned and operated by Eni Australia B.V. (Eni). The field has been developed
to supply gas to PWC for electricity generation to replace the Amadeus Basin fields.
PWC and Eni entered a 25 year gas supply arrangement in 2006 for the supply of 740
petajoules of gas from Blacktip field plus additional gas if required and available.
4.115 The first gas from Blacktip was supplied in October 2009. The gas comes onshore to
Eni’s gas processing plant near Wadeye, and is transported by APA Group’s 286 km
Bonaparte gas pipeline (BGP) to join the AGP at Ban Ban Springs.
4.116 For the period to 2019-20, the volumes of gas available under the PWC/Eni gas supply
contracts are considered sufficient to meet forecast electricity demand.
Alternative fuel sources
4.117 Leaving aside any remaining uncontracted reserves in the Amadeus Basin fields, there
are two alternative fuel sources for electricity generation – natural gas from the Darwin

35
March 2011
liquefied natural gas (DLNG) facility at Wickham Point on Darwin harbour and liquid
fuels (i.e. diesel).
Contingency gas supply
4.118 PWC agreed a contingency gas supply arrangement with DLNG in 2009 involving the
supply of a quantity of gas from the DLNG plant to the Darwin city gate gas hub in
certain defined circumstances. This arrangement operated successfully in 2009-10 to
assist PWC Generation to make up some of the shortfall in gas supply from the
declining Amadeus Basin fields.
4.119 The DLNG plant and Blacktip production and processing systems are geographically
separate, thereby reducing the risk of both supply sources being impacted
simultaneously by cyclonic activity or other natural disaster.
Contingency diesel supply
4.120 PWC Generation maintains a portfolio of generation plant able to use diesel as a last
resort contingency if gas is not available, and has significant diesel storage facilities at
Channel Island, Katherine and Tennant Creek power stations, and in Alice Springs.
4.121 Based on advice from PWC Generation, the diesel only capacity of each system is:
• 211.3 MW for the Darwin-Katherine system, against a peak demand of 273.4 MW
in 2009-10;
• 63.5 MW for the Alice Springs system, against a peak demand of 54.9 MW in
2009-10; and
• 11.9 MW for the Tennant Creek system, against a peak demand of 7.4 MW in
2009-10.
4.122 PWC Generation advises that the diesel stocks at Channel Island are sufficient to meet
two days of diesel only operation. Diesel stocks in Alice Springs and Tennant Creek
are sufficient to meet four days of diesel only operation.
Adequacy of fuel supplies
4.123 PWC has advised the Commission that its maximum daily requirement for 2009-10
was about 79 terajoules (TJ), compared to an average daily requirement of 61 TJ
(which translates into approximately 22 PJ a year).14 The annual quantity of gas to be
supplied from the Blacktip field over the 25 year term of the contract ranges from 23 PJ
to 37 PJ per year.15
4.124 The gas volumes available from the Blacktip field are projected to be sufficient to meet
gas demand to well beyond the review period to 2019-20.
4.125 In particular, the commissioning of more efficient generation plant in the
Darwin-Katherine and Alice Springs systems should result in significant improvements
in thermal efficiency and a decrease in the quantity of fuel consumed per unit of
electrical output. PWC expects the average heat rate to decrease by 16 per cent for
Darwin-Katherine and 24 per cent for Alice Springs between 2009-10 and 2014-15.
This should offset any increase in gas demand resulting from increased electricity
14
1000 terajoules equal 1 petajoule.
15 Press article, Blacktip gas feed in pipeline soon, Northern Territory News, 18 August 2008.

36
March 2011
demand in the period to 2014-15, and provide a continuing fuel efficiency benefit to
2019-20.
Adequacy of contingency arrangements
4.126 PWC has a range of contingency arrangements to maintain electricity supply in the
event of the partial or complete loss of the primary gas supply from Blacktip:
• DLNG gas. The DLNG contingency gas supply arrangement does not represent a
complete replacement supply to Blacktip. However, the DLNG gas would provide a
second gas supply in the event of pipeline rupture or temporary
production/processing problems that should reduce or eliminate the need to use
diesel for electricity generation;
• linepack gas, which is gas stored in the pipeline. Linepack gas may be sufficient to
provide a short term (i.e. possibly a few days) source of supply if there is a
disruption to the primary supply, particularly if there is forewarning so the pipeline
can be brought to its maximum operating pressure. The Commission understands
that the volume of linepack that can be made available from the AGP is being
assessed by the pipeline operator; and
• diesel stocks held by PWC provide a last resort fuel source for dual fuel or diesel
burning sets.
4.127 These alternate fuel sources should provide access to a continued fuel supply to power
stations, even in the circumstances of partial or complete loss of gas from Blacktip due
to production or processing equipment failure or cyclonic activity or a pipeline rupture.
4.128 The critical risk to the adequacy of fuel supplies is an extended gas outage due to a
pipeline rupture or production problems requiring PWC to rely solely on diesel. In this
situation, transport and storage constraints (at power stations, bulk fuel terminals in the
Territory and available road tankers) could lead to a gradual decline in diesel stocks as
they may not be able to be replenished at the same rate as they are used.
4.129 However, the availability of Blacktip, DLNG gas and linepack gas are considered to
provide sufficient diversity of supply to ensure adequate fuel supplies are available to
avoid prolonged use of diesel.
4.130 Under the extreme and unlikely scenario of a double event, the rupture of the Amadeus
Basin-Darwin pipeline close to the Channel Island power station cutting off gas supply
to the generation plant and supply from Blacktip being unavailable, gas should be
available from DLNG to Weddell, Katherine and Pine Creek power stations. In such a
case, gas fired capacity would be about 140 MW (increasing to 180 MW with the
proposed additional unit at Weddell in 2011-12). From April 2011, the Channel Island
power station will have 235 MW of dual fuel (diesel) capacity at N-1 contingency and
280 MW at full capacity.
4.131 The most disruptive (and quite unlikely) event for Alice Springs and Tennant Creek
would be a rupture of the supply pipeline near the power stations. It is expected that
the four day diesel fuel stocks would in almost all circumstances be sufficient to cover
the duration of repairs to the pipeline. Moreover, diesel fuel supply could be
supplemented by road from local terminals.

37
March 2011
Pipeline transportation
4.132 Firm gas transportation entitlements in both the AGP, the spur pipeline from DLNG and
BGP are understood to match the PWC gas purchase entitlements, which exceed
current and projected peak flow rates for the period of this review.

38
March 2011
CHAPTER 5
Electricity networks
5.1 This chapter examines the capacity and adequacy of the Darwin-Katherine, Alice
Springs and Tennant Creek transmission and distribution networks:
• network capacity (firm delivery capacity and demand) at 30 June 2010;
• network demand forecasts for 2010-11 to 2014-15, and forecast capacity and firm
delivery capacity at the sub-transmission and zone substation level;
• the supply-demand balance and supply-demand outlook at the sub-transmission
and zone substation level to 2013-14, and actual and potential constraints related
to sub-transmission assets and zone substations; and
• feeders that have exceeded in 2009-10, or are expected to exceed in 2010-11,
their normal operating conditions.
Scope of assessment and availability of data
5.2 For the 2009-10 Review, the Commission has expanded the scope of the assessment
of the network by requesting PWC Networks business unit (as owner/operator of the
Darwin-Katherine, Alice Springs and Tennant Creek networks) to provide equivalent
information to that routinely reported by transmission and distribution network
operators in the NEM.
5.3 Although routinely provided by network operators elsewhere in Australia, this is the first
time that PWC Networks has been requested to provide equivalent information. In
responding to the request, PWC Networks found that not all the information sought is
yet available.
5.4 This is not unexpected given the experience of network operators elsewhere in
Australia, and the Commission anticipates that PWC Networks will take two or three
years to establish the systems and processes necessary to routinely record the
relevant information.
5.5 The Commission expects that the implementation across each PWC business unit in
2011 of new information technology systems and business processes through the
PWC Asset Management Capability project will expedite the availability of the
comprehensive and detailed network asset information required for an effective
assessment of network capacity and adequacy.
Transmission and distribution networks in the Territory
5.6 The Darwin-Katherine, Alice Springs and Tennant Creek networks are subject to the
third party access regime established by the Territory’s Electricity Networks (Third

39
March 2011
Party Access) Act and Code, which provides a framework for setting the conditions of
service and charges for transporting electricity over the network.16
5.7 The Commission is responsible for determining the network conditions and charges,
and monitoring and enforcing compliance with the determination. The arrangements for
the period 1 July 2009 to 30 June 2014 were determined in March 2009.17
Network infrastructure
5.8 The PWC Networks business unit operates the Darwin-Katherine, Alice Springs and
Tennant Creek transmission and distribution networks, which comprise the poles,
wires, substations, transformers, switching, monitoring and signalling equipment
involved in transporting electricity from the generator to the customer.
5.9 The transmission and distribution network control function is undertaken by the System
Controller, and the PWC System Control business unit which is a part of PWC
Networks. The System Controller has statutory responsibilities for monitoring and
controlling the operation of the system and network to ensure a reliable, safe and
secure electricity supply.18
5.10 Table 5.1 provides some key details of the Territory’s transmission and distribution
network infrastructure, and operating characteristics.
Table 5.1: Transmission and distribution network characteristics
System/network Darwin-Katherine Alice Springs Tennant Creek
Connections (customers at 30 June 2010)
Household 50 589 9956 1193
Government 471 95 27
Business 8295 1825 265
Energy use (GWh for 2009-10) 1516 229 30
Transmission/sub-transmission network (km
at 30 June 2010) 666 0 0
Distribution network (km at 30 June 2010) 4164 607 385
Zone substations (number at 30 June 2010) 24 3 1
Distribution substations (number at 30 June
2010) 4037
Source: Power and Water Corporation. Note: the transmission/sub-transmission network is defined as 66 kV and above.
16
The Territory’s regional and remote networks are not subject to the third party access framework and the Commission has no role in setting conditions of service and charges. These networks transport electricity to customers in the 72 communities and 82 outstations where essential services are provided through the Territory Government Indigenous Essential Services program; eight remote townships and three mining townships.
17 Utilities Commission, March 2009, Final Determination Networks Pricing: 2009 Regulatory Reset.
18 Electricity Reform Act, s38. The functions and duties of the System Controller are detailed in the System
Control Technical Code and Network Connection Technical Code.

40
March 2011
5.11 A transmission/sub-transmission network overlay exists in the Darwin region to
transport electricity produced at three power station locations (Channel Island, Weddell
and Berrimah) to primary load centres via two 132 kV transmission lines and seven
66 kV zone substations. This transmission network is also connected with power
stations and loads at Pine Creek and Katherine via a 132 kV line from the Channel
Island power station.
5.12 A schematic of the Darwin-Katherine transmission and distribution network is
presented in Figure 5.1.
Figure 5.1: Darwin-Katherine transmission and distribution network
Source: Utilities Commission and Power and Water Corporation.
5.13 Electricity generated in the Alice Springs and Tennant Creek systems has been
supplied directly into the distribution network. However, a transmission network overlay
is being developed in Alice Springs, with electricity produced at the Owen Springs
power station to be supplied into the distribution network via a 66 kV transmission line
and two 66 kV zone substations (Owen Springs and Lovegrove).
Hudson Creek 66 kV
Snell Street
City Zone
Francis Bay
Berrimah
Casuarina
Archer
Weddell
Power Station McMinn
Palmerston
Marrakai
Humpty Doo
Mary River
Batchelor
Manton
Katherine
Power Station
Hudson Creek 132 kV
Channel Island
Power Station
Pine Creek
Power Station
132 kV 66 kV
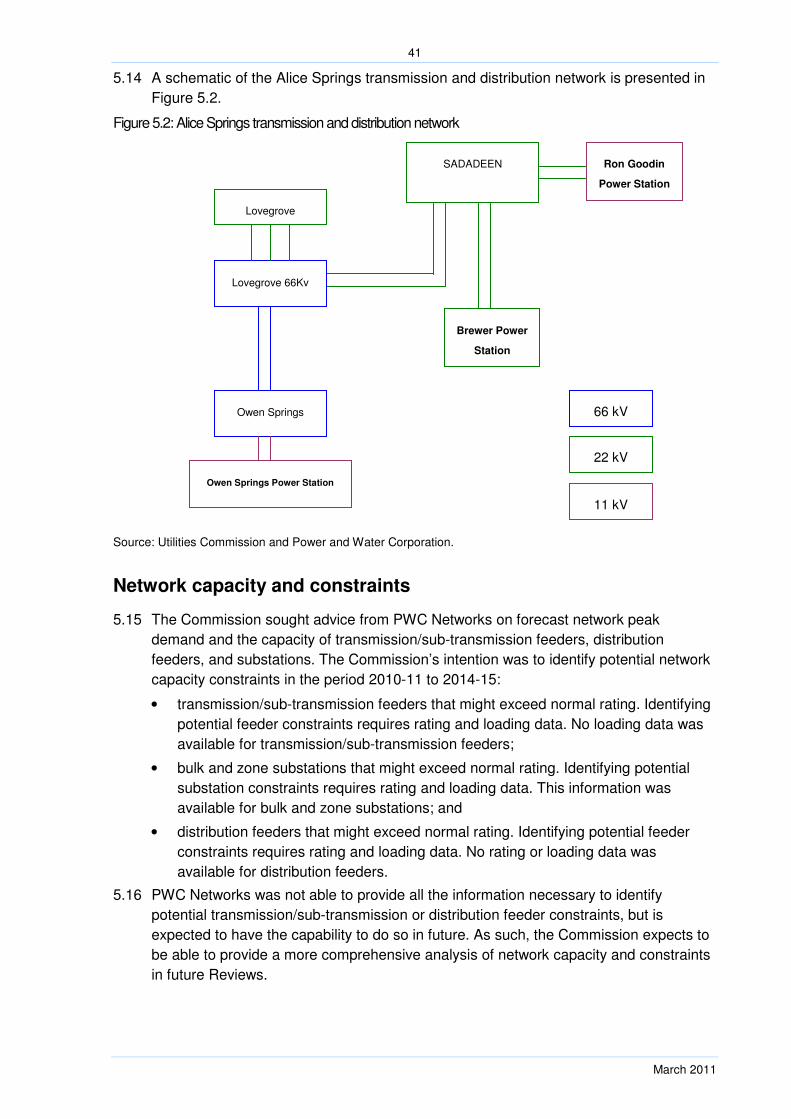
41
March 2011
SADADEEN Ron Goodin
Power Station
Brewer Power
Station
Lovegrove 66Kv
Lovegrove
Owen Springs
Owen Springs Power Station
5.14 A schematic of the Alice Springs transmission and distribution network is presented in
Figure 5.2.
Figure 5.2: Alice Springs transmission and distribution network
Source: Utilities Commission and Power and Water Corporation.
Network capacity and constraints
5.15 The Commission sought advice from PWC Networks on forecast network peak
demand and the capacity of transmission/sub-transmission feeders, distribution
feeders, and substations. The Commission’s intention was to identify potential network
capacity constraints in the period 2010-11 to 2014-15:
• transmission/sub-transmission feeders that might exceed normal rating. Identifying
potential feeder constraints requires rating and loading data. No loading data was
available for transmission/sub-transmission feeders;
• bulk and zone substations that might exceed normal rating. Identifying potential
substation constraints requires rating and loading data. This information was
available for bulk and zone substations; and
• distribution feeders that might exceed normal rating. Identifying potential feeder
constraints requires rating and loading data. No rating or loading data was
available for distribution feeders.
5.16 PWC Networks was not able to provide all the information necessary to identify
potential transmission/sub-transmission or distribution feeder constraints, but is
expected to have the capability to do so in future. As such, the Commission expects to
be able to provide a more comprehensive analysis of network capacity and constraints
in future Reviews.
22 kV
11 kV
66 kV

42
March 2011
Network peak demand forecasts
5.17 Network demand forecasts are influenced by energy consumption patterns in the
substation service area. Therefore, a whole of network demand forecast is the
aggregate of forecast loading/demand for individual substations, which is determined
by factors including household and business energy use patterns, and residential and
commercial developments.
5.18 Appendix B presents information from PWC Networks on actual and forecast zone
substation demand and capacity for 2007-08 to 2015-16.
5.19 The aggregate Darwin-Katherine network demand growth for 2011-12 to 2014-15 is
presented in Table 5.2.
Table 5.2: Annual average network peak demand for the Darwin-Katherine system
Aggregate substation load 2011-12 2012-13 2013-14 2014-15
MVA 335.8 346.6 358.1 369.9
Maximum demand growth (%) 3.29 3.22 3.30 3.30
Source: Evans & Peck.
5.20 This forecast of network demand growth for the Darwin-Katherine system was derived
from the demand forecasts developed by PWC Networks for each bulk and zone
substation. A forecast is not presented for 2010-11 due to some uncertainty about the
transfer of demand between substations.
5.21 A network demand forecast could not be developed for the Alice Springs and Tennant
Creek networks as loading information for the Sadadeen, Ron Goodin and Tennant
Creek substations was not available. The loading of these substations depends on
generation dispatch patterns. The Commission expects that loading information for
these substations will be available for future Reviews.
Energy use forecasts and load factor
5.22 The energy use forecasts developed by PWC Generation have been used to determine
the load factor for each network. The load factor is the ratio of average demand over a
year to maximum demand and represents the rate of change in energy use relative to
maximum demand. The load factor indicates if maximum demand is likely to be more
or less “peaky”. The load factors for the Darwin-Katherine, Alice Springs and Tennant
Creek networks indicate:
• energy use is forecast to increase at a marginally higher rate than maximum
demand in the Darwin-Katherine system; and
• energy use is forecast to increase at a lower rate than maximum demand in the
Alice Springs and Tennant Creek systems.
5.23 The implication is that peak demand in the Alice Springs and Tennant Creek networks
will increase at a faster rate than energy use, raising the prospect of network
constraints in the medium term. Energy use in the Darwin-Katherine network is not
considered likely to present as great an influence on peak demand in the medium term.
Transmission/sub-transmission network capacity and constraints
5.24 The Commission considers that the transmission/sub-transmission network comprises:
• all 66 kV and above feeders;

43
March 2011
• bulk and zone substations with a highest voltage of 66kV or above; and
• distribution substations (e.g. with a voltage of 11/22kV) that perform a
sub-transmission role.
5.25 The Commission acknowledges that transmission/sub-transmission assets are not
currently specifically identified as such, but considers that these assets play a critical
role in network reliability and security due to the radial design of the network and
limited number of alternative flow paths. Hence, the Commission will continue to place
a specific focus on the components of the transmission/sub-transmission network.
Feeders
5.26 PWC Networks was not able to provide loading information for the
transmission/sub-transmission feeders, preventing a complete assessment of feeder
utilisation and adequacy (i.e. the ratio of maximum demand to the allocated rated
capacity of the equipment).
5.27 However, a high level assessment of capacity and constraints in the Darwin-Katherine
system has been undertaken due to the criticality of the transmission/sub-transmission
network to security of supply. The assessment was undertaken by Evans & Peck by
inferring feeder loadings under peak demand conditions using zone substation loading
data for the following sub-systems of the Darwin-Katherine system:
• the Berrimah sub-system, consisting of the Hudson Creek-Berrimah-Hudson Creek
loop;
• the City sub-system, consisting of City Zone, Snell Street, Casuarina, Frances Bay
and Leanyer substation service areas;
• the Palmerston sub-system, consisting of Archer, Weddell, Palmerston, McMinn’s,
Humpty Doo, Marrakai and Mary River substation service areas; and
• the Manton sub-system, consisting of Manton, Batchelor, Pine Creek, Katherine,
Edith River, Cosmo, Brock’s Creek and Union Reef substation service areas.
5.28 The analysis indicates a potential capacity constraint in the Palmerston sub-system,
with potential overloading of the Hudson Creek-Palmerston and Hudson
Creek-McMinn’s 66 kV network under first contingency conditions (N-1) in 2012-13 and
2013-14. However, this constraint is expected to be relieved on the completion of
Archer zone substation in early 2011. The potential for overloading may also be
managed by using the low voltage distribution network to transfer load.
5.29 The Commission cautions that the assessment relies on a number of simplifying
assumptions and is presented to provide a high level indication of capacity and
potential capacity constraints. The Commission expects to provide a more authoritative
assessment in future Reviews as the necessary data becomes available.

44
March 2011
Bulk and zone substations
5.30 There are 28 bulk and zone substations across the Darwin-Katherine, Alice Springs
and Tennant Creek systems, with an assessment of substation utilisation possible for
25 substations.19 Substation capacity and potential constraints have been measured by
examining the substation utilisation:
• with all network elements (i.e. transformers) in service (an N rating); and
• with one network element out of service (an N-1 rating).
5.31 With all transformers in service, all zone substations should have sufficient capacity to
meet forecast load for 2010-11 except for the Snell Street zone substation which faces
an emerging capacity constraint.
5.32 Chart 5.1 presents zone substation utilisation under N-1 conditions (one transformer
out of service) in 2010-11 and 2013-14, based on forecast loads and system
configuration in 2010-11 and 2013-14.
Chart 5.1: Projected substation utilisation in 2010-11 and 2013-14 (N-1 conditions)
Source: Evans & Peck.
5.33 Under N-1 conditions, five substations face capacity constraints in 2010-11 and
2013-14:
• Berrimah 66/11 kV, with 99 per cent utilisation in 2010-11 and 2013-14. PWC
Networks is planning construction of a new East Arm substation (operating from
circa 2015-16) to support the Berrimah substation;
19
Loading information is not available for the Sadadeen, Ron Goodin and Tennant Creek zone substations.

45
March 2011
• Centre Yard 66/11 kV, with 100 per cent utilisation in 2010-11 and 120 per cent
utilisation in 2013-14. Centre Yard is a small (0.5 MVA) substation where PWC
Networks is considering supplementing capacity by relocating spare transformers;
• Palmerston 66/11 kV, with 115 per cent utilisation in 2010-11 and 97.5 per cent
utilisation in 2013-14. The Palmerston substation will be supported by the new
Archer zone substation (expected to be operational in 2011) and load transfer
through the low voltage distribution network;
• Katherine 132/22 kV, with 107 per cent utilisation in 2010-11 and 109.6 per cent
utilisation in 2013-14. The Katherine substation is supported by Pine Creek and
Katherine generation. Accounting for this generation should resolve the apparent
constraint; and
• Snell Street 66/11 kV, with 106.6 per cent utilisation in 2010-11 and 116.4 per cent
utilisation in 2013-14. Snell Street represents the most critical constraint due to its
role supplying the Darwin CBD. PWC Networks intends a replacement substation
to be operating from circa 2011-12.
5.34 Based on the information available to the Commission the PWC Networks network
planning policy requires only Berrimah, Katherine and Snell Street substations to meet
an N-1 event.
5.35 Additionally, under N-1 conditions, the Weddell, McMinns and Lovegrove substations
utilisation rates exceed 80 per cent in 2013-14 (88 per cent, 86 per cent and 82 per
cent respectively), indicating the potential for capacity constraints in the future.
5.36 Although industry practice for assessing potential network constraints focuses on the
implications of the first contingency event (i.e. an N-1 event), Evans & Peck advised
the Commission that the poor condition of network infrastructure20 means that there is
a credible risk that multiple contingency events could arise.
5.37 In particular, the Commission notes that the poor condition of equipment at the City
Zone and Snell Street substations makes a multiple contingency event a possibility
which warrants a continued priority being given to the capital program associated with
the development of Frances Bay substation, upgrade of Snell Street substation and
replacement of City Zone substation.
Distribution network capacity and constraints
5.38 PWC Networks was not able to provide the load flow studies or measurements on the
low voltage (11/22 kV) distribution network necessary for an assessment of loading
and capacity.
5.39 Similarly, PWC Networks was not able to provide loading or capacity information for
distribution substations. Consequently, the Commission is unable to identify if there are
any actual or potential constraints in the distribution network.
20
As identified through the Independent Enquiry into Casuarina Substation Events and Substation Maintenance Across Darwin (the Davies Enquiry) and being addressed through the PWC Remedial Asset Management Program.

46
March 2011
5.40 Monitoring of distribution substation loading and capacity is currently based on the
incidence of voltage complaints or overloads which activate protection schemes. This
has been a common approach across the industry, but emerging industry practice is to:
• integrate information technology into distribution substations to record and report
loading, quality of supply, status and fault indication data in real time; and
• integrate geographic information systems with network topology and customer
billing information to determine the energy use through individual assets, which can
then be combined with standard load profiles to determine substation utilisation.
47
March 2011
CHAPTER 6
Customer service and reliability performance
6.1 This chapter reports on customer service performance and reliability of supply
outcomes in 2009-10 in the Darwin-Katherine, Alice Springs and Tennant Creek
systems.
6.2 Customer service performance and reliability of supply information is reported by PWC
Generation, PWC Networks and PWC Retail as a requirement of the Territory’s
Electricity Standards of Service Code. The 2009-10 Standards of Service: Key Service
Performance Indicators Report covers:
• network and generation reliability performance, and network feeder performance; and
• customer service performance, such as network reconnections/new connections, the time taken to answer telephone calls, and customer complaints about quality of supply and service (e.g. billing).
Reliability performance
6.3 Reliability performance is measured by calculating:
• the system average interruption duration index (SAIDI), which indicates the average duration of network and generation related outages experienced by a customer; and
• the system average interruption frequency index (SAIFI), which indicates the average number of network and generation related outages experienced by a customer.
6.4 The Commission has examined reliability performance for:
• generation and network performance in the Darwin region and Katherine region (of the Darwin-Katherine system), Alice Springs and Tennant Creek systems for 2005-06 to 2009-10, using a weighted total average of reliability outcomes for each system; and
• central business district (CBD), urban, short rural and long rural feeders for 2009-10 only, using a weighted total average of feeder reliability for each system.
Overall reliability performance
6.5 Chart 6.1 shows the average total minutes off supply for a customer in the Darwin,
Katherine, Alice Springs and Tennant Creek (combined) systems for 2005-06 to
2009-10.
6.6 The key points highlighted by chart 6.1 are:
• the lack of clear trend in the underlying network reliability performance (SAIDI) over the five year period 2005-06 to 2009-10; and
• the significant contribution of “exclusions” to the weighted total average minutes off supply for 2007-08, 2008-09 and 2009-10.

48
March 2011
Chart 6.1: PWC Networks weighted total average minutes off supply (SAIDI) for 2005-06 to 2009-10
Source: Utilities Commission and Power and Water Corporation.
6.7 Chart 6.2 shows the average total frequency of outages for a customer (SAIFI) in the
Darwin, Katherine, Alice Springs and Tennant Creek (combined) systems for 2005-06
to 2009-10.
6.8 The key points highlighted by chart 6.2 are:
• the high frequency of generation related outages compared to the experience of customers elsewhere in Australia;
• the lack of a clear trend in the underlying network reliability performance (SAIFI) over the five year period 2005-06 to 2009-10;
• a smaller contribution of “exclusions’ to the weighted total average frequency of outages than for SAIDI, indicating a small number of events with a large impact.

49
March 2011
Chart 6.2: PWC Networks weighted total average frequency of outages (SAIFI) for 2005-06 to 2009-10
Source: Utilities Commission and Power and Water Corporation.
Generation performance trend
6.9 Territory customers experienced an average of 2.7 generation related outages a year
(SAIFI) between 2005-06 and 2009-10. This is significantly more than observed in the
NEM connected systems (e.g. for the 12 months ended 31 March 2010, Ergon Energy
reported a SAIFI of 0.02).
6.10 So as to develop an improved understanding of generation reliability performance,
Evans & Peck examined under frequency loss of supply (UFLS) events for the period
2005-06 to 2009-10 (to 28 November 2010). For the Darwin-Katherine system:
• there was an average of 28 UFLS events over the five year period, which represents an average of over one UFLS event each fortnight;
• the number of UFLS events peaked in 2008 with 49 events, but has fallen to 20 in 2010.
6.11 The analysis identified a number of possible causes for the high number of generation
related outages, but could not identify the specific cause(s) from the range of
possibilities, including operating practice, spinning reserve policy and asset condition
and maintenance. The Commission expects generation reliability performance to
improve in the coming years with the commissioning of new generation plant
(especially Channel Island sets 8 and 9) and the major maintenance to existing
generation plant.

50
March 2011
6.12 The Commission will continue to monitor generation performance through regular
performance reporting and an incident reporting framework now being finalised. The
Commission will report on progress in future Reviews.
Network performance trend
6.13 There is no clear trend in network reliability performance in the SAIDI and SAIFI
outcomes for 2005-06 to 2009-10.
6.14 The Commission requested PWC Networks to report reliability performance for
2009-10 based on feeder type, consistent with the approach adopted across
Australia:21
• CBD – a feeder predominantly supplying commercial, high-rise buildings, supplied
by a predominantly underground distribution network containing significant
interconnection and redundancy when compared to urban areas. PWC Networks
had 34 CBD feeders at 30 June 2010;
• Urban – a feeder, which is not a CBD feeder, with actual maximum demand over
the reporting period per total feeder route length greater than 0.3 MVA/km. PWC
Networks had 30 urban feeders at 30 June 2010;
• Short Rural – a feeder which is not a CBD or urban feeder, with a total feeder route
length less than 200km. Rural short feeders may include feeders in urban areas
with low load densities. PWC Networks had 105 short rural feeders at 30 June
2010; and
• Long Rural – a feeder which is not a CBD or urban feeder with a total feeder route
length greater than 200km. PWC Networks had 2 rural long feeders at 30 June
2010.
6.15 Examining feeder performance to identify network performance trend is the accepted
approach in Australia. As 2009-10 is the first year this data has been reported for the
Territory, there is no time series data to compare reliability performance in the Territory
over time. The Commission will report reliability performance by feeder type in future
Reviews.
6.16 Charts 6.3 and 6.4 present the relative performance of each feeder category for the
(combined) Darwin-Katherine, Alice Springs and Tennant Creek systems for 2009-10.
21
Feeder performance is most commonly reported based on feeder type. The approach is documented in the Utility Regulator’s Forum, 2002, National Regulatory Reporting for Electricity Distribution and Retailing Businesses.

51
March 2011
Chart 6.3: PWC Networks average outage duration (SAIDI) by feeder category for 2009-10
Source: Evans & Peck.
Chart 6.4: PWC Networks average frequency of outages (SAIFI) by feeder category for 2009-10
Source: Evans & Peck.

52
March 2011
6.17 To assess relative performance of PWC Networks with regulatory expectations
elsewhere in Australia, the Commission has compared PWC Network “normalised”22
performance with the minimum service standards applicable in Queensland. The
Commission considers the two Queensland electricity networks to provide a
reasonable point of comparison to PWC Networks (particularly Ergon Energy).
6.18 Charts 6.5 and 6.6 present a comparison of feeder performance in the Territory with
the Queensland minimum service standards.23
Chart 6.5: Feeder performance (SAIDI) 2009-10 – PWC Networks (actual) and Queensland (minimum
service standard
Source: Evans & Peck
6.19 The Commission has the following observations about the comparison of SAIDI
performance:
• the PWC Networks CBD feeder performance is marginally worse than the Energex
CBD minimum standard (Energex CBD performance for 2009-10 was 1.2 SAIDI
minutes). CBD feeder performance is variable across Australia and volatile
between years. A single event can have a significant influence on performance.
22
Normalised means planned and unplanned outages excluding major event days.
23 2009-10 Ergon Energy urban, short rural and long rural standards and the Energex CBD standard (Ergon
Energy has no CBD feeders). Refer Queensland Competition Authority, October 2010, Report on performance against minimum service standards and compliance with guaranteed service levels by Energex and Ergon Energy for the 2009-10 financial year.

53
March 2011
The PWC Network CBD feeder performance is considered to be consistent with
outcomes Australia wide;
• PWC Networks urban and short rural performance is better than the Ergon Energy
minimum standards (Ergon performance for 2009-10 was 221.7 SAIDI minutes for
urban and 542.9 SAIDI minutes for short rural); and
• PWC Network long rural performance is worse than the Ergon Energy minimum
standard (Ergon performance for 2009-10 was 995.2 SAIDI minutes). However, the
small number of long rural feeders in the Territory could cause high statistical
variation. The individual feeder performances should be judged on relative length
and technical configuration.
Chart 6.6: Feeder performance (SAIFI) 2009-10 – PWC Networks (actual) and Queensland (minimum
service standards
Source: Evans & Peck
6.20 The Commission has the following observations about the comparison of SAIFI
performance:
• PWC Networks CBD, urban and short rural SAIFI performance is marginally worse
than the Energex/Ergon Energy minimum standards (Energex performance for
2009-10 was 0.08 outages for CBD, and Ergon performance for 2009-10 was 2.3
outages for urban and 4.6 outages for short rural). This is considered generally
consistent with regulatory expectations across Australia; and
• PWC Networks long rural SAIFI performance is much worse than the Ergon Energy
standard (Ergon performance for 2009-10 was 7.2 outages).
6.21 In future Reviews the Commission intends to compare feeder performance in the
Territory over time and with that of like network service providers elsewhere in
Australia.

54
March 2011
Exclusions
6.22 Exclusions are events that have been identified using the 2.5 Beta method, which is a
methodology developed by the Institute of Electrical and Electronic Engineers (IEEE) to
statistically identify reliability events that may not represent business as usual and
distort the underlying reliability trend. This is the method commonly used in Australia.
6.23 Notwithstanding that the terminology used is “exclusions” or excluded events, this does
not mean that the cause or consequences of the event should be ignored. Each
excluded event should be the subject of a review so as to provide a detailed
understanding of the event.
6.24 Although the 2.5 Beta method removes some statistical variability, reliability
performance is still probabilistic and influenced by weather, equipment failure, actions
by third parties and animals. However, a review of trends gives some insight as to
whether reliability performance is stable, improving or deteriorating.
Darwin region reliability performance
6.25 Darwin region reliability performance for each quarter for 2007-08 to 2009-10 is
presented in Charts 6.7 and 6.8.
6.26 The SAIDI performance in 2009-10 was 494.9 minutes off supply, comprising 61.2
minutes due to generation, 196.2 minutes due to networks and 237.6 minutes due to a
major event (when a lightning strike to the two transmission lines from the Channel
Island power station on 30 January 2010 led to the Darwin-Katherine system black).
Chart 6.7: Average outage duration for a Darwin customer 2007-08 to 2009-10 (quarterly)
Source: Utilities Commission.

55
March 2011
6.27 The average frequency of outages experienced by a customer (SAIFI performance) in
2009-10 was 7.1, comprising 2.3 outages due to generation, 4.0 outages due to
networks and 0.8 outages due to the system black.
Chart 6.8: Average frequency of outages for a Darwin customer 2007-08 to 2009-10 (quarterly)
Source: Utilities Commission.
Katherine region reliability performance
6.28 Katherine region reliability performance for each quarter for 2007-08 to 2009-10 is
presented in Charts 6.9 and 6.10.
6.29 SAIDI performance in 2009-10 was 211.9, comprising 10.4 minutes due to generation
and 201.5 minutes due to networks.

56
March 2011
Chart 6.9: Average outage duration for a Katherine customer 2007-08 to 2009-10 (quarterly)
Source: Utilities Commission.
6.30 SAIFI performance in 2009-10 was 6.6, with 1.0 outage due to generation and 5.5
outages due to networks.
Chart 6.10: Average frequency of outages for a Katherine customer 2007-08 to 2009-10 (quarterly)
Source: Utilities Commission.

57
March 2011
Alice Springs region reliability performance
6.31 Alice Springs reliability performance for each quarter for 2007-08 to 2009-10 is
presented in Charts 6.11 and 6.12.
6.32 SAIDI performance in 2009-10 was 231.9, with 23.4 minutes due to generation and
208.5 minutes due to networks.
Chart 6.11: Average frequency of outages for an Alice Springs customer 2007-08 to 2009-10 (quarterly)
Source: Utilities Commission.
6.33 SAIFI performance in 2009-10 was 5.5, with 1.8 outages due to generation and 3.7
outages due to networks.

58
March 2011
Chart 6.12: Average frequency of outages for an Alice Springs customer 2007-08 to 2009-10 (quarterly)
Source: Utilities Commission.
Tennant Creek reliability performance
6.34 Tennant Creek reliability performance for each quarter for 2007-08 to 2009-10 is
presented in Charts 6.12 and 6.13.
6.35 SAIDI performance in 2009-10 was 188.7, with 31.2 minutes due to generation and
157.5 minutes due to networks.

59
March 2011
Chart 6.12: Average frequency of outages for a Tennant Creek customer 2007-08 to 2009-10 (quarterly)
Source: Utilities Commission.
6.36 SAIFI performance in 2009-10 was 7.5, with 1.0 outage due to generation and 6.5
outages due to networks.
Chart 6.13: Average frequency of outages for a Tennant Creek customer 2007-08 to 2009-10 (quarterly)
Source: Utilities Commission.
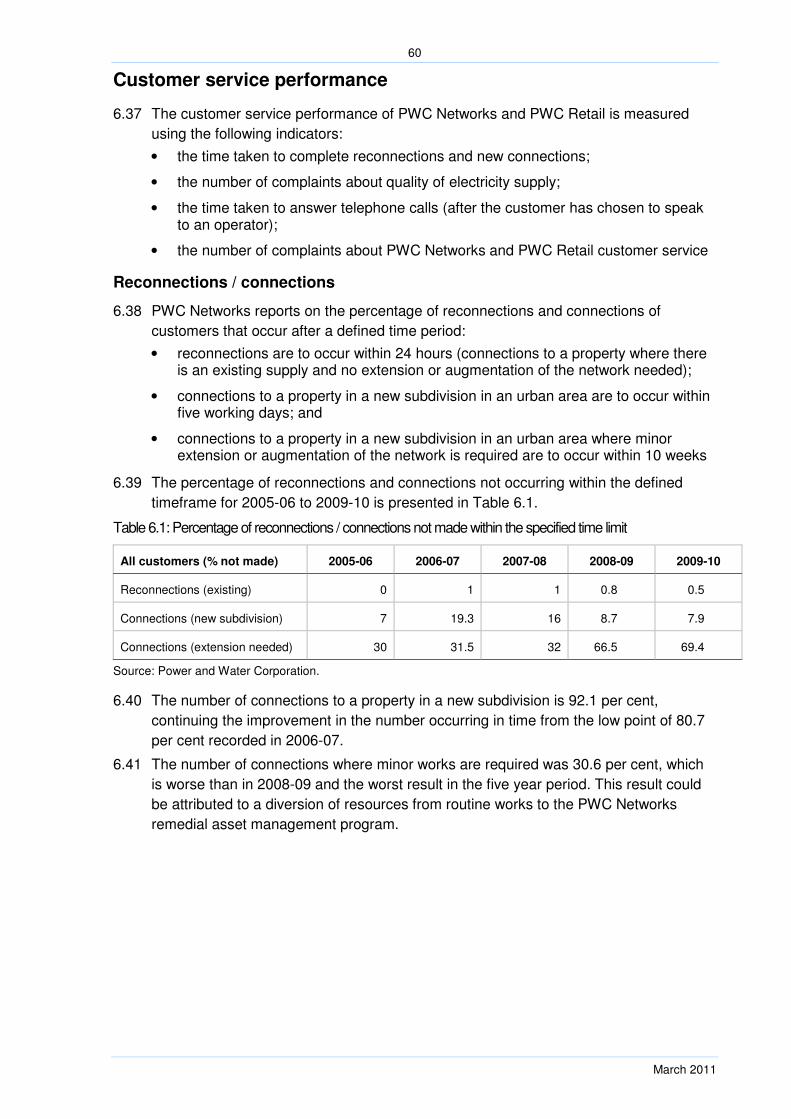
60
March 2011
Customer service performance
6.37 The customer service performance of PWC Networks and PWC Retail is measured
using the following indicators:
• the time taken to complete reconnections and new connections;
• the number of complaints about quality of electricity supply;
• the time taken to answer telephone calls (after the customer has chosen to speak to an operator);
• the number of complaints about PWC Networks and PWC Retail customer service
Reconnections / connections
6.38 PWC Networks reports on the percentage of reconnections and connections of
customers that occur after a defined time period:
• reconnections are to occur within 24 hours (connections to a property where there is an existing supply and no extension or augmentation of the network needed);
• connections to a property in a new subdivision in an urban area are to occur within five working days; and
• connections to a property in a new subdivision in an urban area where minor extension or augmentation of the network is required are to occur within 10 weeks
6.39 The percentage of reconnections and connections not occurring within the defined
timeframe for 2005-06 to 2009-10 is presented in Table 6.1.
Table 6.1: Percentage of reconnections / connections not made within the specified time limit
All customers (% not made) 2005-06 2006-07 2007-08 2008-09 2009-10
Reconnections (existing) 0 1 1 0.8 0.5
Connections (new subdivision) 7 19.3 16 8.7 7.9
Connections (extension needed) 30 31.5 32 66.5 69.4
Source: Power and Water Corporation.
6.40 The number of connections to a property in a new subdivision is 92.1 per cent,
continuing the improvement in the number occurring in time from the low point of 80.7
per cent recorded in 2006-07.
6.41 The number of connections where minor works are required was 30.6 per cent, which
is worse than in 2008-09 and the worst result in the five year period. This result could
be attributed to a diversion of resources from routine works to the PWC Networks
remedial asset management program.

61
March 2011
Quality of supply complaints
6.42 PWC Networks reports the number of complaints received in relation to quality of
supply (e.g. voltage dips, swells and spikes). Table 6.2 presents the number of quality
of supply complaints for 2006-07 to 2009-10. No data was reported for 2005-06.
Table 6.2: Quality of supply complaints
Number of complaints 2005-06 2006-07 2007-08 2008-09 2009-10
Northern (Darwin) NA NA 801 792 776
Katherine NA NA 194 109 317
Southern (Alice Springs) NA NA 96 139 114
Tennant Creek NA NA 26 21 77
Total NA 1029 1117 1061 1284
Source: Power and Water Corporation.
6.43 The data show a significant increase in complaints in Katherine and Alice Springs
between 2008-09 and 2009-10. No reason has been given by PWC.
Telephone call response
6.44 PWC (Networks and Retail) report the number and percentage of telephone calls
responded to within 20 seconds of the customer selecting to speak to a human
operator.
6.45 Table 6.3 presents the percentage and number of telephone calls answered within 20
seconds of the customer choosing to speak to a human operator for 2005-06 to
2009-10.
Table 6.3: Percentage and number of telephone calls answered within timeframe
Telephone calls answered 2005-06 2006-07 2007-08 2008-09 2009-10
Percentage 76 69 58 62 63
Number 113 871 96 562 78 453 87 013 91 614
Source: Power and Water Corporation.
6.46 The 2009-10 result represents an improvement from 2008-09, but is below the 76 per
cent achieved in 2005-06.
Customer complaints
6.47 PWC (Networks and Retail) report the number of complaints received from
customers.24
6.48 Table 6.4 gives the number of customer complaints received by PWC Networks and
PWC Retail for the period 2005-06 to 2006-07.
24
A complaint is (as defined in the Australian Standard ISO10002-2006) ‘an expression of dissatisfaction made to an organisation, related to its products, or the complaint handling process itself, where a response or resolution is explicitly or implicitly expected’.

62
March 2011
Table 6.4: Number of customer complaints
Number of complaints 2005-06 2006-07 2007-08 2008-09 2009-10
Darwin NA NA 1778 1718 1830
Katherine NA NA 121 160 160
Alice Springs NA NA 391 318 417
Tennant Creek NA NA 42 39 70
Total 2907 1917 2332 2235 2477
Source: Power and Water Corporation.
6.49 PWC received 2477 electricity service related complaints during 2009-10, the highest
number received since 2005-06.

63
March 2011
APPENDIX A
System maximum demand forecasts 2010-11 to 2019-20
Table A.1: Forecast Darwin-Katherine annual maximum system demand for 2010-11 to 2019-20
MW per annum E&P (medium – 2.8%) PWC (medium – 2.2%) PWC (high – 2.6%)
2009-10 (actual) 273.4 273.4 273.4
2010-11 281.1 279.4 280.5
2011-12 288.9 285.6 287.8
2012-13 297.0 291.9 295.3
2013-14 305.3 298.3 303.0
2014-15 313.9 304.8 310.9
2015-16 322.7 311.5 318.9
2016-17 331.7 318.4 327.2
2017-18 341.0 325.4 335.7
2018-19 350.5 332.6 344.5
2019-20 360.4 339.9 353.4
Source: Evans & Peck and Power and Water Corporation.
Table A.2: Forecast Alice Springs annual maximum system demand for 2010-11 to 2019-20
MW per annum E&P (medium – 1.7%) PWC (medium – 1.2%) PWC (high – 1.6%)
2009-10 (actual) 54.9 54.9 54.9
2010-11 55.9 55.6 55.8
2011-12 56.8 56.3 56.7
2012-13 57.8 57.0 57.6
2013-14 58.8 57.6 58.6
2014-15 59.8 58.3 59.5
2015-16 60.8 59.0 60.4
2016-17 61.8 59.7 61.4
2017-18 62.9 60.5 62.4
2018-19 64.0 61.2 63.4
2019-20 65.0 61.9 64.4
Source: Evans & Peck and Power and Water Corporation.

64
March 2011
Table A.3: Forecast Tennant Creek annual maximum system demand for 2010-11 to 2019-20
MW per annum E&P (medium – 2.0%) PWC (medium–0.64%) PWC (high – 1.1%)
2009-10 (actual) 7.4 7.4 7.4
2010-11 7.5 7.4 7.5
2011-12 7.7 7.5 7.5
2012-13 7.8 7.5 7.6
2013-14 8.0 7.6 7.7
2014-15 8.1 7.6 7.8
2015-16 8.3 7.7 7.9
2016-17 8.5 7.7 8.0
2017-18 8.6 7.8 8.0
2018-19 8.8 7.8 8.1
2019-20 9.0 7.9 8.2
Source: Evans & Peck and Power and Water Corporation.

65
March 2011
Zone Substations - Number Max. Min. Max. Firm Min. Firm
Northern & Southern Regions of Capacity Capacity Capacity Capacity Demand Demand Demand Demand Demand Demand Demand Demand Demand
Transformers MVA1
MVA1
MVA2
MVA2 MVA MVA MVA MVA MVA MVA MVA MVA MVA
Palmerston 11/22kV 1 7.5 7.5 0.0 0.0 5.0 5.3 5.6 5.7 5.9 6.0 6.2 6.3 6.5
McMinns 66/22kV 3 40.5 30.0 27.0 20.0 21.1 20.4 20.7 21.3 21.9 22.6 23.2 23.9 24.6
Weddell 66/22kV 2 10.0 10.0 5.0 5.0 - 6.0 6.0 6.2 6.3 6.5 6.6 6.8 7.0
Humpty Doo 66/22kV 3 7.5 7.5 5.0 5.0 1.5 1.5 1.6 1.6 1.7 1.7 1.8 1.8 1.9
Mary River 66/22kV 1 5.0 5.0 0.0 0.0 1.3 1.3 1.3 1.3 1.4 1.4 1.4 1.5 1.5
Marrakai 66/22kV 2 5.0 5.0 2.5 2.5 - - - 1.5 1.5 1.5 1.6 1.6 1.7
Manton 132/22kV 1 27.0 20.0 0.0 0.0 6.0 5.6 5.7 5.8 6.0 6.1 6.3 6.4 6.6
Batchelor 132/22kV 1 27.0 20.0 0.0 0.0 11.0 0.2 0.2 0.2 0.2 0.2 0.2 0.2 0.2
Pine Creek 11/66kV 2 40.0 40.0 20.0 20.0 3.7 3.8 3.9 4.0 4.1 4.2 4.3 4.4 4.5
Katherine 132/22kV 2 54.0 40.0 27.0 20.0 25.6 28.6 28.8 29.0 29.2 29.4 29.6 29.8 30.0
Berrimah 66/11kV 2 76.0 50.0 38.0 25.0 35.6 36.1 36.1 37.7 34.4 36.0 37.6 39.3 41.0Leanyer 66/11kV
32 54.0 40.0 27.0 20.0 - - - - 15.0 15.5 16.0 16.5 17.0
Casuarina 66/11kV 3 114.0 75.0 76.0 50.0 47.9 44.6 32.3 52.2 43.9 45.3 46.7 48.2 49.8
Snell Street 66/11kV 4 47.0 40.0 35.0 30.0 41.1 36.7 36.2 37.3 38.4 39.6 40.7 42.0 43.2
City Zone 66/11kV 3 120.0 90.0 80.0 60.0 61.3 62.1 61.3 42.6 43.6 44.5 45.5 46.5 47.6Frances Bay 66/11kV
31 40.0 30.0 0.0 0.0 - - - 20.0 20.4 20.9 21.3 21.8 22.3
Centre Yard 66/11kV 2 1.0 1.0 0.5 0.5 0.5 0.5 0.5 0.5 0.5 0.5 0.6 0.6 0.6
Palmerston 66/11kV 2 80.0 60.0 40.0 30.0 43.3 42.6 43.1 46.0 34.2 36.5 39.0 41.6 44.4Archer 66/11kV
32 54.0 40.0 27.0 20.0 - - - - 15.0 16.0 17.1 18.3 19.5
Pine Creek 11/22kV 4 10.0 10.0 7.5 7.5 0.7 0.7 0.7 0.7 0.7 0.8 0.8 0.8 0.8
Union Reef 66/11kV 1 12.5 10.0 0.0 0.0 11.1 11.1 11.1 11.1 11.1 11.1 11.1 11.1 11.1
Brocks Creek 66/11kV 2 7.0 7.0 3.5 3.5 0.1 0.1 0.1 0.1 0.1 0.1 0.1 0.1 0.1
Cosmo Howley 66/11kV 2 15.0 15.0 7.5 7.5 0.2 0.2 0.2 0.3 0.3 0.3 0.3 0.3 0.3
Alice Springs - Lovegrove 22/11kV 3 35.0 25.0 20.0 15.0 15.1 15.1 15.5 15.9 16.3 16.7 17.1 17.5 18.0
Alice Springs - Sadadeen 22/11kV4
2 38.0 30.0 19.0 15.0 n/a n/a n/a n/a n/a n/a n/a n/a n/a Alice Springs - Ron Goodin
4n/a n/a n/a n/a n/a n/a n/a n/a n/a n/a n/a n/a n/a n/a
Tennant Creek4
2 15.0 15.0 7.5 7.5 n/a n/a n/a n/a n/a n/a n/a n/a n/a
Network - Substation Totals 55 942.0 723.0 475.0 364.0 332.1 322.5 310.9 341.2 352.1 363.4 375.2 387.4 400.2
Notes:
1. Maximum and minimum capacity are based on the ratings of the substation transformers.
2. Based on N-1 contingency criteria (i.e. the loss of one transformer). Example: Pine Creek Zone Substation consists of 2 transformers rated at 20 MVA; if one transformer fails the minimum firm capacity is 20 MVA.
3. Actual and forecast demand commences from completion of construction of the zone substation.
4. Sadadeen, Ron Goodin and Tennant Creek are stations with generators. Loading on the transformers depends on the generators dispatched.
5. Load will be shared between adjacent zone substations in the cases where the minimum firm capacity is less than demand to avoid potential load shedding.
2013-14 2014-152007-08 2008-09 2009-10 2010-11 2011-12 2012-13 2015-16
APPENDIX B Zone substation demand for 2007-08 to 2015-16
Source: Power and Water Corporation.