Embed Size (px)
Citation preview

LOS ANGELES DEPARTMENT OF WATER AND POWER
POWER SYSTEM RATE ACTION REPORTChapter 5: Power Rate Design
July 2015
I -
A ■-

Los Angeles Department of Water and PowerPower System Rate Action Report Chapter 5: Power Rate Design
CONTENTS
5.1 SUMMARY 5
5.1.1 Introduction 5
5.1.2 Legal Considerations
General Rate Structure
6
5.1.3 6
5.1.4 Industry Trends
Residential Customer Rate Design and Rates
Commercial and Industrial Customer Rate Design
Business Promotion Service Rider
7
5.1.5 10
5.1.6 12
5.1.7 13
5.1.8 Summary of Proposed Rate Design 13
5.2 RATE DESIGN OBJECTIVES 14
5.2.1 Phased in Rate Change
Legal Considerations
Marginal Cost Based Pricing
14
5.2.2 15
5.2.3 16
5.3 RATE STRUCTURE OVERVIEW 17
5.3.1 Current Rate Structure 18
5.3.2 Proposed Rate Structure
Decoupling
Incremental Reliability Cost Adjustment Factor
Net Energy Metering
19
5.3.3 20
5.3.4 21
5.3.5 22
5.4 RESIDENTIAL (R1A)
5.4.1 Residential Customer Current Rate Design Components
5.4.2 Proposed Changes to LADWP Residential Rate Design
5.4.3 Proposed Residential Rates
5.4.4 Residential Customer Bill Impacts
5.4.5 Residential Comparative Analysis
22
22
23
26
27
30
5.5 COMMERCIAL AND INDUSTRIAL (A1A, A2B, A3A)
5.5.1 Commercial and Industrial Proposed Rates
5.5.2 Commercial and Industrial Customer Rate Impacts
5.5.3 Commercial and Industrial Customer Comparative Rate Analysis
34
35
37
44
5.6 BUSINESS PROMOTION SERVICE RIDER 46
5.7 SUMMARY OF ELECTRIC RATE DESIGN 46
2

Los Angeles Department of Water and PowerPower System Rate Action Report Chapter 5: Power Rate Design
FIGURES AND TABLES
FIGURESFigure 1: Proposed Average Electric Rates and Annual Percentage Increase by Customer
Class 6
Figure 2: Proposed Electric Rates Structure
Figure 3: Comparison of California Utility System Average Rate Levels
Figure 4: Comparison of Electric Utility Residential Fixed and or Minimum Bill Charges (Planned for 2016)
Figure 5: Proposed Thresholds for Residential Tiered Fixed Charge
Figure 6: Proposed Residential Monthly Tiered Fixed Charge
Figure 7: Proposed Residential Customer Rates
Figure 8: Major Elements of LADWP Electric Commercial and Industrial Rate Design
Figure 9: Business Promotion Bill Credit by Year
Figure 10: Past and Proposed Electric Rate Increases and new Rate Impositions of California Utilities
7
8
9
10
11
11
12
13
15
Figure 11: Proposed Average Electric Rates and Annual Percentage Increase by Customer Class 15
Figure 12: Comparison of Marginal Cost Revenue Requirement and Current Revenue Percent by Customer Class
Figure 13: LADWP Current Electric Rate Structure (Detail)
Figure 14: LADWP Proposed Electric Rate Structure (Detail)
Figure 15: Proposed Residential Monthly Tiered Fixed Charge by Year
Figure 16: Residential Customer Proposed Energy Rate Compared to the True NEM Value
Figure 17: Proposed Thresholds for Residential Tiered Fixed Charge
Figure 18: Proposed Residential Rate Design Components
Figure 19: Residential (R1A) Customer Annual Rate Impact by Usage Distribution
Figure 20: Residential (R1A) Customer Bill Impacts by kWh Usage (Detail)
Figure 21: Comparison of LADWP and California IOU Residential Tier Structure
Figure 22: Comparison of Electric Utility Residential Fixed and Minimum bill Charges (Planned for 2016)
Figure 23: Residential Customer Peer Rate Comparison by Consumption Level ($/kWh)
Figure 24: Residential Customer Average Monthly Electric Bill Comparison (Total Bill)
Figure 25: Major Elements of LADWP Electric Commercial and Industrial Rate Design
Figure 26: Proposed Small Commercial Rates (Small General Service A1A)
Figure 27: Proposed Medium Commercial Rates (Primary Service A2B)
17
18
20
24
25
25
26
28
29
30
32
33
34
35
36
36
3

Los Angeles Department of Water and PowerPower System Rate Action Report Chapter 5: Power Rate Design
Figure 28: Proposed Large Commercial Rates (Sub-transmission A3A)
Figure 29: Small Commercial Customer (Small General Service A1A) Annual Rate Impact by Usage Distribution
Figure 30: Small Commercial Customer (Small General Service A1A) Bill Impacts by Load Factor (Detail)
Figure 31: Medium Commercial Customer (Primary Service A2B) Annual Rate Impact by Usage Distribution
37
38
39
40
Figure 32: Medium Commercial Customer (Primary Service A2B) Annual Bill Impacts by Load Factor (Detail)
Figure 33: Large Commercial and Industrial Customer (Sub-transmission A3A) Annual Rate Impact by Usage Distribution
Figure 34: Large Commercial and Industrial Customer (Sub-transmission A3A) Bill Impacts by Load Factor (Detail)
Figure 35: Small Commercial Customer Peer Rate Comparison ($/kWh by Load Factor)
Figure 36: Medium Commercial Customer Peer Rate Comparison
Figure 37: Large Commercial and Industrial Customer Peer Rate Comparison
Figure 38: Business Promotion Bill Credit by Year
41
42
43
44
45
45
46
4

Los Angeles Department of Water and PowerPower System Rate Action Report Chapter 5: Power Rate Design
POWER RATE DESIGN
SUMMARY5.1
This chapter discusses the methodology utilized in designing LADWP’s electric rates, changes to LADWP’s overall rate structure, rates for each major customer class, and trends in the industry.
Rates in this chapter are designed to achieve the following major objectives:
• Affordability;
• Business development;
• Encourage conservation and sustainable customer resources;
• Meet legal requirements;
• Assist in the transformation to a distribution oriented utility;
• Assure financial stability; and
• Utilize marginal cost of service in the rate design.
5.1.1 IntroductionLADWP proposes changes in electric rate design to be implemented for the period beginning late 2015 through June 2020. LADWP proposes three major changes to the rate design:
1. Phased five-year rate change averaging 4.7% per year on a system wide basis1;
2. Addition of a tiered fixed charge2 to the Residential (R1A) customer rate structure;and
3. Design of energy charges for all customer classes to encourage distributed generation such as customer-owned solar.
The overall rate structure and rate changes will be phased in over a five-year period to moderate the effect on customers, while continuing to meet financial metric requirements as outlined in Chapter 2. Figure 1 provides a summary of the proposed average customer class rate changes by each fiscal year for the proposed rate period.
1 All proposed rates are developed based on Financial Plan Case Number 19.
LADWP will present this charge on customer bills as a consumption-based service charge.2
5

Los Angeles Department of Water and PowerPower System Rate Action Report Chapter 5: Power Rate Design
Figure 1: Proposed Average Electric Rates and Annual Percentage Increase by Customer Class
Five-YearAverageClass FY 2014-15 FY 2015-16 FY 2016-17 FY 2017-18 FY 2018-19 FY 2019-20
$/kWh $/kWh $/kWh $/kWh $/kWh $/kWhAnnual % Annual % Annual % Annual % Annual % Annual %$0.1515 $0.1595 $0.1656 $0.1767 $0.1849 $0.1953R1A 5.3% 3.8% 6.7% 4.7% 5.6% 5.2%$0.1753 $0.1814 $0.1862 $0.1958 $0.2025 $0.2112A1A 3.5% 2.6% 5.2% 3.4% 4.3% 3.8%$0.1556 $0.1622 $0.1676 $0.1777 $0.1850 $0.1943A2B 4.2% 3.3% 6.1% 4.1% 5.0% 4.5%$0.1391 $0.1447 $0.1498 $0.1595 $0.1662 $0.1748A3A 4.1% 3.5% 6.5% 4.2% 5.2% 4.7%
SystemAverage
$0.1506 $0.1573 $0.1627 $0.1730 $0.1803 $0.18964.4% 3.4% 6.3% 4.2% 5.2% 4.7%
Changes to the Residential customer rate structure are designed to provide a transition to an enhanced combination of fixed and variable charges that better match costs, while continuing to encourage solar and other distributed generation solutions. Energy rates for most Commercial and Residential classes for peak periods will reach levels that continue to provide incentives to install solar for customers. However, even after the proposed changes, LADWP will continue to have some of the lowest electricity rates in California.
5.1.2 Legal ConsiderationsWhile there may be a desire to undertake a modification of the current rate structure to provide a simpler rate framework, several lawsuits have recently been filed asserting that Proposition 26 does not permit LADWP’s annual transfer of monies, financial conditions allowing, from the Power Revenue Fund ultimately to the City’s General Fund. The City disputes the merits of those lawsuits. While the transfer is being contested, the City will continue to adopt an electrical rate structure that preserves the rates in effect on November 3, 2010, and layers incremental charges on top of them. Therefore, for purposes of the current rate action, LADWP proposes that the results of the cost of service studies and the impact of the new revenue requirements for power service be applied to only the Incremental Electric Rate Ordinance.
5.1.3 General Rate StructureThe rate structure includes a combination of the electric rate ordinance in effect as of November 3, 2010, No. 168436, as amended (Electric Rate Ordinance), including billing of base rates and pass-through adjustment factors capped at their levels as of November 3, 2010, and an incremental electric rate ordinance, No. 182273 (Incremental Electric Rate Ordinance), with both incremental base rate and incremental pass-through adjustment factors as outlined in Figure 2. LADWP’s power rate structure has historically included base rates and pass-through adjustment factors tied to specific costs in combination with some form of a “decoupling” mechanism. Pass-through adjustment factors often reflect costs that LADWP does not control such as fuel costs or regulatory mandates on renewable generation resources. The use of these mechanisms is standard utility practice for both publicly-owned utilities and investor-owned utilities (IOUs).
For LADWP, billing of the base rate and pass-through factors of the Electric Rate Ordinance is limited to their levels as of November 3, 2010. Base and pass-through rates due to the increased revenue requirement since November 3, 2010 are established in the Incremental Electric Rate Ordinance. The incremental structure includes a decoupling mechanism that helps to provide incentives for conservation and expansion of customer-owned solar and
6

Los Angeles Department of Water and PowerPower System Rate Action Report Chapter 5: Power Rate Design
other forms of distributed generation by allowing recovery of fixed costs. LADWP proposes to continue this rate structure with some minor adjustments to the adjustment factors.
Figure 2: Proposed Electric Rates Structure
Decoupling Mechanism
Incremental Pass-Through Adjustment Factors
Incremental Electric Rate Ordinance
Incremental Base Rates
Capped Pass-Through Factors“Capped” Ordinance as of November 3, 2010Capped Base Rates
5.1.4 Industry TrendsIn preparing the rate design proposal, LADWP noted industry trends including, but not limited to the following three major trends:
1. Increasing overall rate levels in California;
2. Implementing fixed charges for residential customers; and
3. Setting higher energy charges during peak periods and promoting net energy metering policies that provide economic incentives for customer-installed solar power generation.
Increasing California Electric Rates
Rate increases have been common for electric utilities in California; this is a trend that is expected to continue in future years. Figure 3 compares LADWP system average rates (total system retail revenue divided by total retail sales) to the system average rates for several other California Utilities. LADWP’s system average rates are presently lower than its peers.
7

TRENDS IN ANNUAL AVERAGE SYSTEM RATES*
Extrapolated*!
------Glendale
-5CE
------ PGE
------ SOGE
LADWP
♦Computed on an annual fiscal year system wide sasis for all customer classes from EIA Form 826 data, based on available informatio 1.
Extrapolated based on approved rate increase? for FY 2014-15• •
FY 2006 FY 2007 FY2008 FY2009 FY2010 FY2011 FY2012 FY2013 FY2014 FY2015** FY2016**
The three major California IOUs have all increased rates recently and have announced intentions to continue this trend. These utilities have experienced significant cost increases for similar reasons as LADWP, such as compliance with the California renewable energy targets.
Most publicly-owned utilities are facing the same cost pressures and increasing rates accordingly. For example, Glendale Water and Power has received approval for a five-year phased in rate change of about 25.4% in total (5.1% on average per year). LADWP proposes a system average rate increase of 4.7% over the next five years. IOU rate trends have recently averaged around the same level and would be expected to continue. Therefore, LADWP is expected to retain its favorable rate levels relative to peer utilities.
Fixed Charges for Residential Customers
The major structural change in LADWP’s proposed rate design is the addition of a new monthly tiered fixed charge for Residential customers. LADWP is proposing to implement a monthly tiered fixed charge which increases based on historical usage in conjunction with the existing minimum charge. This approach is developed to lessen the effect of fixed charges on low usage customers.
Several publicly-owned utilities are also implementing or increasing the level of monthly fixed charges. All three major California IOUs are planning to implement substantial increases to their fixed monthly charges or minimum bill charges; however, at the time of this report, the California Public Utilities Commission (CPUC) is still determining the final nature of the changes (proceeding R-12-06-013). A fixed monthly charge bill component applies a set amount to the customer monthly bill. A minimum base bill amount is charged to the customer unless other charges exceed the minimum bill amount. Both types of charges
8
Los Angeles Department of Water and PowerPower System Rate Action Report Chapter 5: Power Rate Design
Figure 3: Comparison of California Utility System Average Rate Levels
Cl
-nVI
iO
OO
OP
O
C
Aver
age
Syst
em R
ate

Los Angeles Department of Water and PowerPower System Rate Action Report Chapter 5: Power Rate Design
provide a fixed amount of revenue irrespective of consumption. Fixed monthly charges as well as minimum bill charges are being considered as part of the CPUC process and point toward a growing trend of introducing fixed type charges in the customer bill.
Figure 4 provides an analysis of fixed charges and or minimum bill charges for residential customers in place or announced for a variety of California electric utilities. proposed fixed charge for the average residential customer will be the lowest among the peer utilities.
3 LADWP’s
Figure 4: Comparison of Electric Utility Residential Fixed and or Minimum Bill Charges (Planned for 2016)
$30
oi $25tuo(TJU ■ 2016 Proposed Fixed or
Minimum Bill ChargeE3E $20e ■ Current Fixed Charge£o-Oai $15X
LADWP Proposed Tier 2 Access Charget/it/iOl$10.00
Minimumuu<
$10>■
00 Prposed I cess Charge
co1
$5
$3Ac
$0PG&E Burbank Pasadena Glendale Rosevile RiversideLADWP SDGE SCE SMUD
UTILITY
Energy Charges and Net Energy Metering Policies to Encourage Solar Installation
The three major California IOUs have developed specific rate structures approved by the CPUC to encourage customer-installed solar facilities in the last year. All California utilities, both publicly-owned utilities and IOUs, have some form of net energy metering (NEM). Recent legislation and CPUC rulings have required NEM for most utilities and tightened the NEM requirements.
NEM allows the retail electric rate to be used as a direct incentive for solar generation installation by the customer with some limitations. LADWP’s NEM policy and the level of peak period energy rates in this proposal are sufficient to encourage customer-installed solar generation.
3 The analysis was based on LADWP’s proposed tier 2 fixed charge and other utility planned fixed charges or minimum charges proposed for 2016.
9

Los Angeles Department of Water and PowerPower System Rate Action Report Chapter 5: Power Rate Design
5.1.5 Residential Customer Rate Design and RatesAs discussed earlier, the major proposed change to the Residential rate is the implementation of a tiered fixed charge. The proposed rates are designed to recover costs in a manner that allows LADWP to transition to a distribution based utility with back-up generation support that will be indifferent to the use or types of new customer generation. These changes are intended to provide the correct price signals for conservation and sustainable technology adoption. The results of the marginal cost study were used to guide the development of tier thresholds, rates and fixed charges.
The new Residential monthly tiered fixed charge will be tied to the level of consumption in a similar manner as existing energy charges. Three tiers are proposed with the specific amount based on the customer’s highest monthly consumption level (or amount of energy dispatched to the grid for NEM customers) in the prior year. The kWh tier thresholds are the same as the levels currently in place for energy usage. The amount of the fixed charge will vary by tier allotment, which in turn varies based on temperature zones, as shown in Figure5.
Figure 5: Proposed Thresholds for Residential Tiered Fixed Charge
Zone 1 Monthly Usage (kWh) Zone 2 Monthly Usage (kWh)
Tier 1 0 < and < 350 0 < and < 500
Tier 2 350 < and < 1050 500 < and < 1500
Tier 3 > 1050 > 1500
The implementation of a tiered fixed charge recognizes that a significant amount of a power utility’s cost is fixed and that sole reliance on usage based energy charges does not adequately align rates with costs. The new tiered fixed charge will be phased in over five years to provide a gradual transition of rates, as customers adapt their usage patterns to the new structure. This proposed rate design is also designed to ensure lower usage customers do not experience a significant increase in overall rates at any one time. As shown in Figure 6, the level of the tiered fixed charge is minimal for customers with small amounts of energy consumption.
10

Los Angeles Department of Water and PowerPower System Rate Action Report Chapter 5: Power Rate Design
Figure 6: Proposed Residential Monthly Tiered Fixed Charge
$25
m$20
O. $152?<TJ
<L>XLL- $10
$5
$0FV 2015-16 FY 2016-17 FY 2017-18 FY 2018-19 FY 2019-20
$0.55 $0.85 $1.30 $1.75 $2.30■ Tier 1■ Tier 2 $2.00 $3.00 $4.90 $6.25 $7.90
$6.00 $9.00 $15.00 $18.50 $22.70Tier 3
The proposed energy charges based on the proposed rate design for the Residential (Schedule R1A) class are provided in Figure 7 for the five-year rate period. The proposed class average annual rate increase over the next five years is 5.2%.
Figure 7: Proposed Residential Customer Rates
SummerEnergyCharge($/kWh)
WinterEnergyCharge($/kWh)
Monthly Zone 1 Energy Allocation
(kWh)
Monthly Zone 2 Energy Allocation
(kWh)
Monthly Tiered Fixed Charge ($)
Tier
FY 2015-16
Tier 1 $0.55 $0.1494 $0.14940 < and < 350 0 < and < 500
Tier 2 $2.00 $0.1816 $0.1816350 < and <1050 500 < and <1500
Tier 3 $6.00 $0.2305 $0.1816> 1050 > 1500
FY 2016-17
Tier 1 $0.85 $0.1524 $0.15240 < and < 350 0 < and < 500
Tier 2 $3.00 $0.1877 $0.1877350 < and <1050 500 < and <1500
Tier 3 $9.00 $0.2435 $0.1877> 1050 > 1500
FY 2017-18
Tier 1 $1.30 $0.1577 $0.15770 < and < 350 0 < and < 500
Tier 2 $4.90 $0.1980 $0.1980350 < and <1050 500 < and <1500
Tier 3 $15.00 $0.2659 $0.1980> 1050 > 1500
FY 2018-19
Tier 1 $1.75 $0.1606 $0.16060 < and < 350 0 < and < 500
Tier 2 $6.25 $0.2089 $0.2089350 < and <1050 500 < and <1500
11

Los Angeles Department of Water and PowerPower System Rate Action Report Chapter 5: Power Rate Design
Tier 3 $18.5 $0.2850 $0.2089> 1050 > 1500
FY 2019-20
Tier 1 $2.30 $0.1640 $0.16400 < and < 350 0 < and < 500
Tier 2 $7.90 $0.2226 $0.2226350 < and <1050 500 < and <1500
Tier 3 $22.70 $0.3096 $0.2226> 1050 > 1500
As discussed above, the energy rate, in conjunction with NEM, provides substantial incentives for customer-installed solar facilities. The average annual rate increases proposed for each tier are: 2.4% for tier 1, 5.1% for tier 2 and 7.5% for tier 3 (for summer), respectively for the five-year rate period. For instance, as Figure 7 above depicts, tier 3 rates for summer increase from $0.2305/kWh in FY 2015-16 to $0.3096/kWh in FY 2019-20. This approach facilitates minimizing the bill impact on low usage and/or low-income customers. This progression of rate increases by tier levels is also consistent with the Department’s rate design objectives of promoting conservation, as well as encouraging solar and other distributed generation, in a gradual, sustainable manner. This structure and rate change methodology will allow LADWP to transition to a distribution utility that is indifferent to either utility or customer generation.
5.1.6 Commercial and Industrial Customer Rate DesignThe general proposed rate structure for Commercial and Industrial Customers will not change; however, the rates will increase to reflect the higher costs associated with operating the Power System. The marginal cost of service study was utilized in designing the incremental portion of rates (Chapter 4). In addition, a higher percentage of the incremental revenue requirement will be allocated to the energy charge component over time to provide incentives for customer-installed solar and other distributed generation.
Similar to the Residential customer rate design, the proposed Commercial and Industrial customer rate design is developed in a manner that allows LADWP to transition to a distribution based utility that is indifferent to the use or types of new customer generation.
Figure 8 provides a summary of the major rate design elements for Commercial and Industrial customers. The customer classes considered are Small Commercial (Small General Service A1A), Medium Commercial (Primary Service A2B), and Large Commercial and Industrial (Sub-transmission A3A). The proposed rates can be found in Section 5.5.
Figure 8: Major Elements of LADWP Electric Commercial and Industrial Rate Design
Large Commercial and Industrial (Sub
transmission A3A)
Small Commercial (Small General Service A1A)
Medium Commercial (Primary Service A2B)
Fixed Charges Service charge Service charge Service charge
Capacity Charge ($/KW)
Facilities charge and monthly demand charge
Facilities charge and monthly demand charge
Facilities charge
Energy (Usage) Charges ($/kWh)
Based on season and Time of Use (TOU)
Based on season and TOUBased on season
12

Los Angeles Department of Water and PowerPower System Rate Action Report Chapter 5: Power Rate Design
Large Commercial and Industrial (Sub
transmission A3A)
Small Commercial (Small General Service A1A)
Medium Commercial (Primary Service A2B)
Voltage by Class < 4.8 kV 4.8 kV 34.5 kV
45.1.7 Business Promotion Service Rider4To encourage businesses to locate in the City of Los Angeles, a cost based business promotion service rider has been developed by LADWP to better use generation capacity. Over the next ten years, generation capacity in the Power System is expected to be available to serve new commercial customer load growth. To attract new customers to come to Los Angeles, qualifying new commercial businesses that locate in the City and receive service under General Service Schedule A2, A3, or A4 will be eligible to receive bill credit amounts that will be phased out over three years based on the marginal value of this capacity. The service rider is limited to a total of 80MW of customer load. Qualification and applicability will be developed and communicated by LADWP before the service rider is available sometime in 2016. The available bill credit, as a percent of total, for those that qualify is outlined in Figure 9.
Figure 9: Business Promotion Bill Credit by Year
Year of Location Credit Amount
1st Year 7.6%
2nd Year 5.0%
3rd Year 2.5%
This approach is designed to encourage and promote business and optimize the utilization of LADWP’s generation.
5.1.8 Summary of Proposed Rate DesignLADWP’s proposed rate design balances the gradual collection of increased revenue with mechanisms to encourage the use of renewable energy by customers. The main characteristics of LADWP’s proposed rate design changes include:
• Strong energy rate incentive in combination with NEM to provide a gradual transition to a distribution based utility where LADWP is indifferent to customer generation;
• Phased in rate change over five years with a system average of 4.7% per year to moderate cost change;
• A realignment of the relevant revenue requirement among the customer classes based on the results of the marginal cost of service study;
• Continued and expanded decoupling and pass-through adjustment factors to better align actual costs and rates while maintaining financial stability;
4 A service rider works in conjunction with a customer’s otherwise applicable rate.
13

Los Angeles Department of Water and PowerPower System Rate Action Report Chapter 5: Power Rate Design
Addition of a monthly tiered fixed charge for Residential customers similar to other utilities. Unlike the proposed flat fixed charge proposed by IOUs, LADWP is proposing a tiered fixed charge based on usage levels;
Continued current Commercial and Industrial customer rate structure with an increase in the percentage of revenue requirement allocated to energy charges over time to provide increased incentives for the use of customer-installed renewable generation and energy conservation; and
Continued Incremental Electric Rate Ordinance approach based on legal considerations.
To assist and encourage business promotion in the LADWP service area, a new service rider was developed.
5.2 RATE DESIGN OBJECTIVES
The proposed rates are designed to provide a gradual transition to a distribution based utility where LADWP is indifferent to the use or types of customer generation. In addition, the proposed rates are designed to achieve the following major objectives:
• Promote energy conservation, demand response, consistent load usage, and load shifting away from the high peak period;
• Reflect marginal costs;
• Ensure incremental charges to each customer class are proportionate to the cost of providing electric service to that class;
• Maintain rate competitiveness in the region;
• Comply with all applicable legal guidance;
• Provide rate stability;
• Achieve full recovery of costs;
• Minimize individual customer bill impacts, especially for customers who proactively conserve energy; and
• Simplify where possible.
Phased in Rate ChangeThe overall rate changes required to cover the increased cost of operating the Power System in a sustainable manner while also meeting financial metrics will be phased in over a five-year period to moderate the effect of the cost increases on customers.
5.2.1
Most California utilities are facing cost pressures, resulting in pronounced rate increases. Many municipal utilities have received approval for multiyear rate increases. The large IOUs have recently increased rates and are planning higher rates in the future. Figure 10 below illustrates rate changes approved or proposed at other major California electric utilities in recent years.
14

Los Angeles Department of Water and PowerPower System Rate Action Report Chapter 5: Power Rate Design
Figure 10: Past and Proposed Electric Rate Increases and new Rate Impositions of California Utilities
Utility FY 2012-13 FY 2013-14 FY 2014-15 FY 2015-16 FY 2016-17
LADWP 4.9%* 6.0% 4.4% 3.4%
Pacific Gas & Electric (PGE) 2.9% 1% 4.6% 5%
Southern California Edison (SCE) 5% 6.3% 8% 1.5%
San Diego Gas & Electric (SDGE)
50% 12.2% 11% 0% 7%
Glendale 0% 8% 7.7% 5.5% 2.2%
Pasadena 2.3% 0% 8.3% 2.4% 2.2%
Burbank 1.75% 1.75% 2.9%
Sacramento Municipal Utility District (SMUD) 1% 2.5% 2.5% 2.5% 2.5%
*Colors designate the status of the rate increases or impositions: Actual/Approved/Proposed
Changes to the rate design and the allocation of cost recovery among customer classes are consistent with the results of the new marginal cost of service study. These are required to maintain reasonable and cost based rates for all customers. Figure 11 provides the average annual rates and percentage change by customer class for each year of the proposed rate period.
Figure 11: Proposed Average Electric Rates and Annual Percentage Increase by Customer Class
Five-YearAverageClass FY2014-15 FY 2015-16 FY 2016-17 FY 2017-18 FY 2018-19 FY 2019-20
$/kWh $/kWh $/kWh $/kWh $/kWh $/kWhAnnual % Annual % Annual % Annual % Annual % Annual %
R1A $0.1515 $0.1595 $0.1656 $0.1767 $0.1849 $0.19535.3% 3.8% 6.7% 4.7% 5.6% 5.2%
A1A $0.1753 $0.1814 $0.1862 $0.1958 $0.2025 $0.21123.5% 2.6% 5.2% 3.4% 4.3% 3.8%
A2B $0.1556 $0.1622 $0.1676 $0.1777 $0.1850 $0.19434.2% 3.3% 6.1% 4.1% 5.0% 4.5%
A3A $0.1391 $0.1447 $0.1498 $0.1595 $0.1662 $0.17484.1% 3.5% 6.5% 4.2% 5.2% 4.7%
SystemAverage $0.1506 $0.1573 $0.1627 $0.1730 $0.1803 $0.18964.4% 3.4% 6.3% 4.2% 5.2% 4.7%
5.2.2 Legal ConsiderationsLADWP must consider applicable legal guidance in developing proposed rates for power service. Potentially applicable guidance includes:
City Charter Section 676, Rate Setting, which states: "rates shall be of uniform operation for customers of similar circumstances..., as near as may be, and shall be fair and reasonable, taking into consideration, among other things: (1) the nature of the uses; (2) the quantity supplied; and (3) the value of the service”; and
5 Represents a retrospective increase in September 2013, to cover 2012.
15

Los Angeles Department of Water and PowerPower System Rate Action Report Chapter 5: Power Rate Design
• Proposition 26, which declares that "a charge imposed for a specific government service or product provided directly to the payor shall not exceed the reasonable costs of providing the service or product to the payor.”
In its report on the last Power System rate action, the Ratepayer Advocate (RPA) proposed that LADWP reevaluate and consider replacing the surcharge-based restructuring approach with fully restructured permanent rates. The City Council made the same recommendation when it approved the 2012 rate action. Consequently, LADWP has evaluated the current approach to the ordinance structure.
While there may be a desire to undertake a modification of the current rate structure to provide a simpler rate framework, several lawsuits have recently been filed asserting that Proposition 26 does not permit LADWP’s annual transfer of monies, financial conditions allowing, from the Power Revenue Fund ultimately to the City’s General Fund. The City disputes the merits of those lawsuits. While the transfer is being contested, the City will continue to adopt an electrical rate structure that preserves the rates in effect on November 3, 2010, and layers incremental charges on top of them. Therefore, for purposes of the current rate action, LADWP proposes that the results of the cost of service studies and the impact of the new revenue requirements for power service be applied to only the Incremental Electric Rate Ordinance.
5.2.3 Marginal Cost Based PricingIn October 2012, the Los Angeles City Council approved LADWP’s Incremental Electric Rate Ordinance No. 182273 to provide incremental rate adjustments for FY 2012-13 and FY 2013-14, resulting in total revenue increase over two years of $328.4 million. In its action to approve LADWP’s power rates, the Council, along with other recommendations, recommended that LADWP "conduct a new formal cost of service study in order to prepare for future power rate restructuring.” In response to this recommendation, LADWP has completed a marginal cost of service study to evaluate costs of service and ensure that its rates are cost based for each major customer class.
Cost of service analysis constitutes standard utility industry practice for setting power rates. LADWP has utilized the marginal cost study approach to evaluate the cost of providing service to various customer classes and provide guidance for rate design, including rate levels. Marginal cost principles are an accepted methodology for guiding both the allocation of costs to customer classes and the development of power rates. All the major California IOUs and many publicly-owned utilities utilize marginal cost principles for rate design, particularly in the tier design for the residential customer class.
Marginal cost of service study principles and methodologies are discussed in more detail in Chapter 4.
The results of LADWP’s new cost of service study indicate that a realignment of the total revenue requirement among the customer classes is warranted. Figure 12 below illustrates the differences between the marginal cost revenue ratios and the current revenue ratios for the various customer classes.
16

Los Angeles Department of Water and PowerPower System Rate Action Report Chapter 5: Power Rate Design
Figure 12: Comparison of Marginal Cost Revenue Requirement and Current Revenue Percent by Customer Class6
45%
39.9%40%
37.1%
35%32.9%
31,5%
30%
25%
■ MC Revenue
■ Current Revenue20%
15.1%14.4%14,0%15% 13.7%
10%
5%
0.8% 0.5%
0% R1* Al* A2* A3* Other
The results indicate that by applying marginal costs to allocate the total Power System retail revenue requirement, the Residential (R1) customers would be allocated 39.9% of the revenue requirement instead of the current level of 32.9%. Conversely, the Large Commercial and Industrial (A3) customer class would be allocated a lower revenue requirement of 31.5% instead of the current level of 37.1%.
To better align revenues and costs, the base rates in the Incremental Electric Rate Ordinance will be established based on marginal cost results for the major customer classes. The alignment of revenues and costs will be applied to only the Incremental Electric Rate Ordinance in order to preserve the rates in the Electric Rate Ordinance in effect on November 3, 2010. This alignment with the cost study results will be phased in over a five- year period to moderate the impact on the customer classes.
5.3 RATE STRUCTURE OVERVIEW
The primary objectives of this rate proposal are to provide the additional funding necessary for LADWP to increase power reliability program investments, continue the power supply transformation to a more environmentally-friendly generation portfolio while meeting regulatory mandates and expand customer opportunities programs such as energy efficiency and distributed generation. On October 23, 2012, LADWP implemented a new Incremental Electric Rate Ordinance to provide additional revenues for FY 2012-13 and FY 2013-14. In addition, the charges of the Electric Rate Ordinance were capped, and that ordinance
6 For the LADWP marginal cost study, some customer classes listed here have been combined to maintain consistency for rate design purposes. For instance, the Residential class includes low-income and lifeline customers. The asterisk indicates that multiple classes are included in a listed customer class (e.g., A1 includes A1A and A1B).
17

Incremental > Electric
Rates Ordinance
Los Angeles Department of Water and PowerPower System Rate Action Report Chapter 5: Power Rate Design
continues to be in effect. The proposed rates for FY 2015-16 through FY 2019-20 will require changes to the Incremental Electric Rate Ordinance, but the Electric Rate Ordinance will remain unchanged. The overall rates structure is comprised of the following major components:
• Base Rates: Base rates, the portion of rates other than the adjustments, in both the Electric Rate Ordinance and Incremental Electric Rate Ordinance following a tiered/TOU structure based on consumption and/or demand.
Like many other utilities, LADWP has pass-through adjustment factors in addition to the "base” rates. The amounts of these factors are tied to specific costs. More details on these adjustment factors can be found in Chapter 5 - Appendix A.
• Incremental Electric Rate Ordinance Pass-Through Adjustment Factors: The specific adjustment factors in the Incremental Electric Rate Ordinance include the Variable Energy Adjustment (VEA), Variable Renewable Portfolio Standard Energy Adjustment (VRPSEA), and Capped Renewable Portfolio Standard Energy Adjustment (CRPSEA).
• November 3, 2010 Pass-Through Adjustment Factors: Total amount of the passthrough adjustments in the Electric Rate Ordinance.
The total customer rates for almost all customers are determined as the sum of the base and pass-through components in the Electric Rate Ordinance and Incremental Electric Rate Ordinance. Proposed changes to the rate structure and rates pertain only to the incremental base rate and incremental reliability cost adjustment components.
5.3.1 Current Rate StructureThe current rate structure and rates were implemented in October 2012 after review with the RPA and approval by the Board of Water and Power Commissioners (Board) and City Council (Council). At that time, LADWP implemented several changes to the rate design to address industry trends and past Council recommendations to more clearly match rate factors with costs and reflect the uncontrollable nature of some of the costs. Figure 13 shows the current overall rate structure, which includes both the components of the Incremental Electric Rate Ordinance and the Electric Rate Ordinance.Figure 13: LADWP Current Electric Rate Structure (Detail)
“Capped” Ordinance
as ofNovember
3, 2010Pass-through factors in the Incremental Electric Rate Ordinance adjusted on a quarterly basis
18
I • hue costs (natural gas. coal, nuclear hydro)I • Non-RPS Purchase Power Agreements J • Includes funds for "Base Rate Target Adjustment"_______
I • Above minimum RPS purchases & market purchases for regulatory requirements
Yes Variable Energy Adjustment (VEA)
Variable Renewable Portfolio Standard Energy Adjustment
(VRPSEA)Capped Renewable Portfolio Standard
Energy Adjustment (CRPSEA)
Capped Incremental Reliability Cost Adjustment (IRCA)
Yes
RPS O&M, RPS debt services & energy efficiency annual revenue requirement (regulatory asset)Yes
• Additional funds to support the replacement/upgrade of Power System infrastructure (PSRP)Yes
Rebuilding of in-basin power plants Base level of distribution/transmission costs
• ASG costsYes Incremental Base
* Energy Cost Adjustment (Fuel, RPS, DSM/EE, Revenue Transfer)• Base Rate• Reliability Cost Adjustment* Electric Subsidy Adjustment
Ove
r/Und
er C
olle
ctio
n

Los Angeles Department of Water and PowerPower System Rate Action Report Chapter 5: Power Rate Design
An important aspect of the current rate structure is the decoupling mechanism built into the Variable Energy Adjustment (VEA) to ensure that shifts in customer usage patterns outside of LADWP’s control do not impair base rate recovery of the largely fixed costs designed to be recovered by base rates. As discussed in Chapter 3, LADWP is aggressively pursuing energy efficiency programs. While an estimate of the usage impact of these programs has been built into the financial plan and proposed rates, the actual impact of some of these programs, especially the newer ones, is hard to predict accurately. Therefore, to allow LADWP to continue providing reliable service, the decoupling mechanism ensures base rate revenue will be relatively consistent. This mechanism ensures that base rates recover the designated revenue requirement while protecting customers from over recovery of costs. LADWP proposes to continue this decoupling mechanism.
A complete description of each of the rate components is provided in Chapter 5 - AppendixA.
5.3.2 Proposed Rate StructureLADWP proposes to retain the overall rate structure implemented in 2012 with only one significant change. As discussed throughout this report, a major component of LADWP’s capital improvement program is an increased investment in reliability programs to reduce the frequency and severity of outages and ensure continued system reliability. Over the past two-three years, spending on these programs has been reduced as significant investments have been required to meet regulatory and legal mandates largely associated with renewable energy resources, greenhouse gas reduction and elimination of Once-Through Cooling for LADWP in-basin generation facilities. New revenue has disproportionately been directed to these types of programs in recent years. As a result, LADWP faces a renewed need to invest in reliability improvements through the Power System Reliability Program (PSRP).
The PSRP is a comprehensive program focused completely on infrastructure improvements and designed to continue for many years. While specific projects have been developed to help establish the overall PSRP budget and timing of such projects is based on currently available information, all of the required contracts have not been negotiated. In addition, as has been the situation in the past, LADWP cannot fully predict whether unforeseen outages or other emergency repairs will require a reallocation of resources.
Many of the PSRP projects are long-term in nature requiring LADWP to establish contracts for construction services and materials for items such as poles or transformers covering multiple years. To ensure LADWP receives the best possible terms, larger multiyear contracts are preferred; however, the procurement process for these types of contracts can take six to nine months. Once contracts are in place, if projects are reprioritized and funding is reallocated among projects, significant delays, cost increases or even contract cancellations are possible. In 2011 and 2012, Board approved power reliability program contracts representing $173.5 million were suspended or expired, leaving $95.1 million unspent. LADWP had incurred several unexpected outages, including four major vault failures, largely due to unexpected weather or aging infrastructure failures that required immediate repairs. Since rates in 2012 were set with a two-year period in mind, no alternate
19
Incremental > Electric
Rates Ordinance
Los Angeles Department of Water and PowerPower System Rate Action Report Chapter 5: Power Rate Design
sources of funding for these emergency repairs was available, and LADWP had to cancel infrastructure improvement contracts and reallocate resources accordingly.
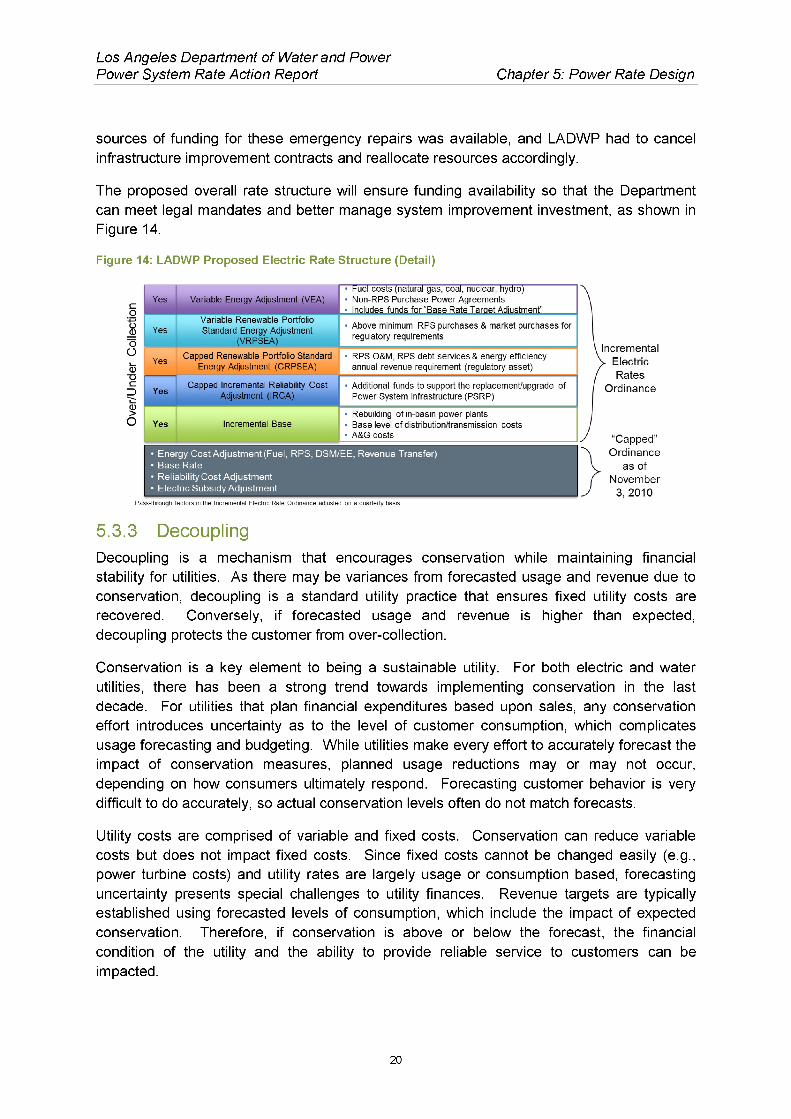
The proposed overall rate structure will ensure funding availability so that the Department can meet legal mandates and better manage system improvement investment, as shown in Figure 14.
Figure 14: LADWP Proposed Electric Rate Structure (Detail)
5.3.3 DecouplingDecoupling is a mechanism that encourages conservation while maintaining financial stability for utilities. As there may be variances from forecasted usage and revenue due toconservation, decoupling is a standard utility practice that ensures fixed utility costs are recovered. Conversely, if forecasted usage and revenue is higher than expected, decoupling protects the customer from over-collection.
Conservation is a key element to being a sustainable utility. For both electric and water utilities, there has been a strong trend towards implementing conservation in the last decade. For utilities that plan financial expenditures based upon sales, any conservation effort introduces uncertainty as to the level of customer consumption, which complicates usage forecasting and budgeting. While utilities make every effort to accurately forecast the impact of conservation measures, planned usage reductions may or may not occur, depending on how consumers ultimately respond. Forecasting customer behavior is very difficult to do accurately, so actual conservation levels often do not match forecasts.
Utility costs are comprised of variable and fixed costs. Conservation can reduce variable costs but does not impact fixed costs. Since fixed costs cannot be changed easily (e.g., power turbine costs) and utility rates are largely usage or consumption based, forecasting uncertainty presents special challenges to utility finances. Revenue targets are typically established using forecasted levels of consumption, which include the impact of expected conservation. Therefore, if conservation is above or below the forecast, the financial condition of the utility and the ability to provide reliable service to customers can be impacted.
20
“Capped" Ordinance
as ofNovember
3, 2010Pass-through factors in the Incremental Electric Rate Ordinance adjusted on a quarterly basis
I • Kiel costs (natural gas, coal, nuclear, hydro)• Non-RPS Purchase Power Agreements
Includes funds for‘ Base Rate Target Adjustment"
• Above minimum RPS purchases & market purchases for regulatory requirements
Yes Variable Energy Adjustment (VEA)
Variable Renewable Portfolio Standard Energy Adjustment
(VRPSEA)
Capped Renewable Portfolio Standard Energy Adjustment (CRPSEA)
Capped Incremental Reliability Cost Adjustment (IRCA)
Yes
• RPS O&M, RPS debt services & energy efficiency annual revenue requirement (regulatory asset)Yes
• Additional funds to support the replacement/upgrade of Power System infrastructure (PSRP)Yes
• Rebuilding of in-basin power plants• Base level of distribution/transmission costs• A&G costs
Yes Incremental Base
• Energy Cost Adjustment (Fuel, RPS, DSM/EE, Revenue Transfer)• Base Rate• Reliability Cost Adjustment• Electric Subsidy Adjustment
Ove
r/Und
er Co
llect
ion

Los Angeles Department of Water and PowerPower System Rate Action Report Chapter 5: Power Rate Design
Decoupling is the standard utility solution to fixed cost recovery. Decoupling separates fixed cost recovery from the calculated overall rate. If, after accounting for actual usage and revenue, fixed costs are under-recovered, the decoupling mechanism adjusts rates to fully recover fixed costs. This type of adjustment works for over-collection as well. If usage exceeds forecasts, resulting in an over-recovery of fixed costs, customers receive a reduced charge through lower future rates.
5.3.4 Incremental Reliability Cost Adjustment FactorTo ensure that adequate revenue is available for LADWP to implement and maintain the PSRP, LADWP proposes to change the structure of the IRCA to be similar to the current Capped Renewable Portfolio Standard Energy Adjustment (CRPSEA). The revised IRCA will provide the flexibility to reallocate funds between proximate years and within strict dollar limits to allow projects to continue uninterrupted while emergency or other unforeseen repairs are implemented. This approach will not increase the overall amount of funding for the PSRP program over time above the levels in the proposed rate plan. The new IRCA will have the following characteristics.
• Annual changes based on the level of spending for the PSRP.
• For years one (FY 2015-16) through year three (FY 2017-18), caps will be designed to allow unused funds to be applied to the second and/or third year of that range.
• Starting in year four, the increase cannot exceed $0.002 per kWh annually.
• Separate Residential and General Service balancing accounts will be established. Projects (and associated spending) can be reallocated and reprioritized within fiscal years and between proximate fiscal years within the caps and subject to the following reporting requirements:
- If the projected under-collection is greater than $25.0 million and less than $50.0 million, LADWP will report to the Board and Council to communicate the projected under-collection; and
- If the projected under-collection is $50.0 million or greater, modified rates shall, if deemed necessary, be fixed by the Board and then approved by an ordinance change.
• General Service IRCA’ factor will have both a kW and kWh component.
This approach balances rate certainty for customers with LADWP’s flexibility to manage the contracts and other aspects of the PSRP which can be impacted by uncertain weather, material costs or infrastructure maintenance requirements. Combined with a multiyear rate plan, the flexibility inherent in this approach will allow LADWP to plan projects, contracts and investments over several years with a much higher degree of certainty and better economic terms for LADWP’s ratepayers. The need for short-term spending reductions merely to manage the Power System’s net income will also be reduced. The IRCA will have the same level of transparency as the CRPSEA7; if the capped factor does not fully fund the PSRP
7 LADWP proposes to maintain the current reporting levels for the CRPSEA. Quarterly reports will be provided to the Board and Council to show the projected amount in the balancing account for the next five years if the projected balance for any of
21

Los Angeles Department of Water and PowerPower System Rate Action Report Chapter 5: Power Rate Design
projects (delaying system maintenance), the Board and Council will be made aware of these financial shortfalls in a timely manner.
LADWP’s approach will provide the flexibility to pursue longer term projects and contracts with more certainty of funding and give customers a level of certainty about future rate levels associated with the PSRP and infrastructure maintenance.
5.3.5 Net Energy MeteringNet Energy Metering (NEM) is a rate design mechanism that provides an incentive for distributed generation, particularly solar, for retail customers. NEM was conceived in the 1990’s as a mechanism to encourage solar and other forms of distributed generation when penetration rates were low for those technologies.
Both LADWP and non-LADWP programs allow customers an offset to their bill for energy generated. For LADWP, the offset is typically based on the value of the energy generated. LADWP has a generous NEM program. Like many other utilities, including the major California IOUs, LADWP’s NEM program allows the distributed generation customer’s load to be offset by the energy delivered by the customer to the grid at the full retail rate for the energy.
The most important aspect of the LADWP NEM is that, in conjunction with the rate amounts and design, LADWP customers have substantial incentives to install customer-owned solar generation. This aspect of the rate design will help LADWP to move to a distribution based utility, indifferent to the type or cost of customer generation. In addition, by phasing in the changes to rates, this transition is achieved in a gradual, sustainable way.
5.4 RESIDENTIAL (R1A)
Specific modifications proposed for the Residential customer class (R1A) rate design and the impact on rates are discussed in this section.
5.4.1 Residential Customer Current Rate Design ComponentsThe current rate design is comprised of the following components:
• Two geographical areas: Zone 1 (cooler temperature zone) and Zone 2 (hotter zone);8
• For each zone, LADWP has a three-tier tariff system with varying tier sizes:
- Zone 1 customers in the first tier receive a 350kWh baseline usage allocation, representing the minimum level of electricity used by a typical household, that is charged at the lowest tariff rate;
the five years is greater than $50 million and less than $100 million. If the balancing account is projected to be $100 million or greater, the Board can fix rates, as required, and submit to Council within 180 days.
The LADWP Residential service area has been divided into two temperature zones as supported by a CEC study and using zip codes as a means of granularity. An LADWP 2013 study confirms the previous study. A table showing the current temperature zones by zip codes is in Chapter 5 - Appendix B.
8
22

Los Angeles Department of Water and PowerPower System Rate Action Report Chapter 5: Power Rate Design
- Zone 2 customers in the first tier receive a 500kWh baseline usage allocation, representing the minimum level of electricity used by a typical household, that is charged at the lowest tariff rate;
• Tier 2 usage up to 300% of the tier 1 baseline allocation charged at the higher tier 2 rate;
• Usage above 300% of the baseline allocation is billed at the highest tier 3 rate;
• Two seasons:
- Summer (high season): June - September; and
- Winter (low season): October - May;
• Constant tier 1 rate for both seasons; and
• Tier 2 and 3 winter season rates equal to the tier 2 summer season rate.
5.4.2 Proposed Changes to LADWP Residential Rate DesignLADWP proposes to implement a tiered fixed charge for Residential customers. Recognizing that significant portions of the cost of delivering electricity are fixed, many electric utilities across the country have traditionally included both fixed charges and usage- based charges in their tariffs. LADWP has had a minimum charge in its Residential customer rate design for many years to partially reflect fixed costs, such as customer service and billing. However, this minimum charge will apply only when the monthly bill is less than ten dollars a month. The proposed fixed charge would be tied to the customer’s usage, based on the higher of maximum monthly usage from the grid in the prior year or maximum monthly usage of electricity delivered to the grid in the prior year, as the capacity of the grid is designed based on the peak or maximum expected usage level.
Recently, electric utilities in California have more aggressively been pursuing the use of fixed charges for all customer classes. Several California IOUs and publicly-owned utilities are pursuing new or increased fixed rate infrastructure for Residential customers. A fixed charge component is more appropriate for utilities to recover the often fixed costs of maintaining the distribution infrastructure that enables reliable power delivery through the entire electric grid at all times of the day.
Therefore, while customer usage will always vary, all customers should bear some of the burden of the distribution infrastructure costs.
As more customers generate a portion of their energy needs, a utility’s financial survival requires rate design mechanisms to change to ensure all customers continue to contribute to the basic fixed costs of providing electric service. These costs include those of billing, metering, customer care, and part of the distribution infrastructure. As depicted in Figure 15 below, LADWP is proposing a tiered fixed charge that increases gradually to $2.30 for tier 1, $7.90 for tier 2, and $22.70 for tier 3 in FY 2019-20.
23

Los Angeles Department of Water and PowerPower System Rate Action Report Chapter 5: Power Rate Design
Figure 15: Proposed Residential Monthly Tiered Fixed Charge by Year
Residential Monthly Tiered Fixed Charge per Customer
$25
$20
$15Q>QJOru
UTSa*
.SC
“■ $10
$5
$0FY 2015-16 FY 2016-17 FY 2017-18 FY 2018-19 FY 2019-20
■ Tier 1 $0.55 $0.85 $1.30 $1.75 $2.30
■ Tier 2 $2.00 $3.00 $4.90 $6.25 $7.90■ Tier 3 $6.00 $9.00 $15.00 $18.50 $22.70
The tiered fixed charge approach has several benefits, including, but not limited to:
• Ensuring the continuation of the same level of reliability for all customers;
• Encouraging increased energy efficiency measures by linking the three-tiered fixed charge to customer usage levels, as opposed to a single rate for all customers;
• Better matching of cost recovery and cost causation as determined through the new marginal cost of service study;
• Movement toward matching the level of fixed and variable costs with revenue from fixed and usage based rate elements; and
• Minimizing the percentage rate increase for low usage customers or eliminating the impact on low usage customers as the fixed charge is not expected to exceed the current minimum usage charge.
LADWP’s Proposal is Balanced
LADWP’s proposed monthly tiered fixed charge coupled with increases in the energy rate by tier is equitable and balanced. By assigning a proportionally higher fixed charge to higher usage customers, low usage customers who may not benefit from or be able to afford customer-owned solar are not unduly impacted. LADWP’s tiered fixed charge comprises a lower percentage of customers’ monthly bills at lower usage levels than if a single fixed charge across all customers was used.
The higher fixed charge for tier 3 customers as a percentage of the total bill is still relatively small. Without fixed charges, energy charges would need to be set higher to recover the full
24

Proposed Energy Rate Versus True NEM Value
Tier 3Tier 1 - Energy Rate
--------Tier 1 - True NEM Value
Tier 2 - Energy Rate
Tier 2 - True NEM Value
-------Tier 3 - Energy Rate
Tier 3 - True NEM ValueTier 2
Tier 1
FY 2015-16 FY 2016-17 FY 2017-18 FY 2018-19 FY 2019-20
Structure of LADWP’s Proposed Tiered Fixed Charge
Figure 17 provides LADWP’s proposed tier usage thresholds for the fixed charge which mirror the levels for energy usage charges.
Figure 17: Proposed Thresholds for Residential Tiered Fixed Charge
Zone 1 Monthly Usage (kWh) Zone 2 Monthly Usage (kWh)
9 Results calculated using summer rates; however, winter rates show similar results.
25
Los Angeles Department of Water and PowerPower System Rate Action Report Chapter 5: Power Rate Design
LADWP’s proposed balance of fixed charges and energy charges is competitive, but still provides an incentive for customer-installed generation. Whether or not a customer installs solar or other generation depends on the "true NEM value” of energy compared to the cost of customer-installed generation. The true NEM value is calculated as the energy rate less the fixed charge for the tier of consumption divided by the kWh of consumption as shown below.
cost of service.
Fixed Charge at Tier (given specific kWh Usage)True NEM Value = Proposed Energy Rate -
kWh Usage
Figure 16 presents the proposed Residential energy rate by tier by year compared to the true NEM value for customer-installed generation. The proposed rate by tier is very close to the true NEM value, demonstrating that the fixed charge is a fairly small percent of the total bill. Therefore, the monthly tiered fix charge would not be a deterrent for installation of customer-owned generation.
9Figure 16: Residential Customer Proposed Energy Rate Compared to the True NEM Value
Cl
o
cn
33
3
33
-3
(A
<AV
</>
-----
---
-----
<A
Ener
gy C
harg
e Pe
r kW
h

Los Angeles Department of Water and PowerPower System Rate Action Report Chapter 5: Power Rate Design
Tier 1 0 < and < 350 0 < and < 500
Tier 2 350 < and <1050 500 < and <1500
Tier 3 > 1050 > 1500
LADWP’s Residential customer fixed charge proposal will help balance cost recovery among customers, while recognizing the fixed cost of portions of the electric service delivery infrastructure. This approach is similar to the fixed charges and demand charges for commercial customers. Utility equipment must be on standby for the highest level of energy needs for each customer and all customers collectively to protect against electric outages. Customers with solar and other distributed generation facilities also benefit from the "always” available nature of the utility’s service.
5.4.3 Proposed Residential RatesThe components of the proposed LADWP residential rate design are summarized in Figure 18 below:
Figure 18: Proposed Residential Rate Design Components
Monthly Zone 1 Usage
Allocation (kWh)
Monthly Zone 2 Usage
Allocation (kWh)
Monthly Tiered Fixed Charge ($)
Summer Energy Charge ($/kWh)
Winter Energy Charge ($/kWh)Tiers
FY 2015-16
Tier 1 $0.55 $0.1494 $0.14940 < and < 350 0 < and < 500
Tier 2 $2.00 $0.1816 $0.1816350 < and <1050 500 < and <1500
Tier 3 $6.00 $0.2305 $0.1816> 1050 > 1500
FY 2016-17
Tier 1 $0.85 $0.1524 $0.15240 < and < 350 0 < and < 500
Tier 2 $3.00 $0.1877 $0.1877350 < and <1050 500 < and <1500
Tier 3 $9.00 $0.2435 $0.1877> 1050 > 1500
FY 2017-18
Tier 1 $1.30 $0.1577 $0.15770 < and < 350 0 < and < 500
Tier 2 $4.90 $0.1980 $0.1980350 < and <1050 500 < and <1500
Tier 3 $15.00 $0.2659 $0.1980> 1050 > 1500
FY 2018-19
Tier 1 $1.75 $0.1606 $0.16060 < and < 350 0 < and < 500
Tier 2 $6.25 $0.2089 $0.2089350 < and <1050 500 < and <1500
Tier 3 $18.50 $0.2850 $0.2089> 1050 > 1500
FY 2019-20
Tier 1 $2.30 $0.1640 $0.16400 < and < 350 0 < and < 500
26

Los Angeles Department of Water and PowerPower System Rate Action Report Chapter 5: Power Rate Design
Monthly Zone 1 Usage
Allocation (kWh)
Monthly Zone 2 Usage
Allocation (kWh)
Monthly Tiered Fixed Charge ($)
Summer Energy Charge ($/kWh)
Winter Energy Charge ($/kWh)Tiers
Tier 2 $7.90 $0.2226 $0.2226350 < and <1050 500 < and <1500
Tier 3 $22.70 $0.3096 $0.2226> 1050 > 1500
In general, proposed increases to tier 2 and 3 prices are higher than proposed increases to tier 1 prices to reflect marginal costs and send a conservation price signal. In addition, the tiered fixed charge increases for higher usage levels. The average annual five-year rate increases proposed for each tier are: 2.4% for tier 1, 5.1% for tier 2 and 7.5% for tier 3 (for summer), respectively. As Figure 18 above depicts, tier 3 rates for summer increase from $0.2305/kWh in FY 2015-16 to $0.3096/kWh in FY 2019-20. This approach facilitates minimizing the bill impact on low usage, low-income customers. Therefore, while the implementation of the fixed charge will impact all customers, generally a larger portion of the proposed revenue increase for the five years will be recovered from customers with higher consumption levels of over 1,000kWh per month. This progression of rate increases by tier levels is consistent with LADWP’s rate design objectives of promoting conservation, as well as encouraging solar and other distributed generation. The energy rate levels, in conjunction with NEM, will, therefore, provide economic incentives for customer-installed solar.
5.4.4 Residential Customer Bill ImpactsLADWP’s rate design encourages energy conservation. In order to send the proper conservation price signals to customers, electricity rates increase as consumption increases. This approach is consistent with the marginal costs to serve these customers, as well. Therefore, the proposed rate design allocates more of the rate increase to customers that consume higher levels of electricity, and customers at lower consumption levels receive lower relative rate increases.
With respect to customer bill impacts, due to the nature of a fixed charge, when the fixed charge is spread over the relatively low level of usage, lower usage customers will experience a higher percentage increase than other customers, especially in the year the fixed charge is implemented. However, the actual dollar amount of the fixed charge will be significantly more for higher usage customers.
As a result, roughly 80% of all residential customers will see an annual average rate increase below the class average rate increase of approximately 5.3% over the five-year proposed rate period. However, Residential customers with usage of greater than 1,000kWh per month will see an average rate increase greater than the class average to encourage energy conservation measures and behaviors.
As shown in Figure 19, in general, residential customers with lower usage will receive a lower rate increase than customers with a higher usage.
27

80th percentile
Class Avg. Increase 5.3%
50,0001.0%
iii l~l i n i n □ I □ I □ -■-I- 0.0%0
Average Monthly Consumption (kWh)
czm Frequency ^^»Avg. Annual % Inc.
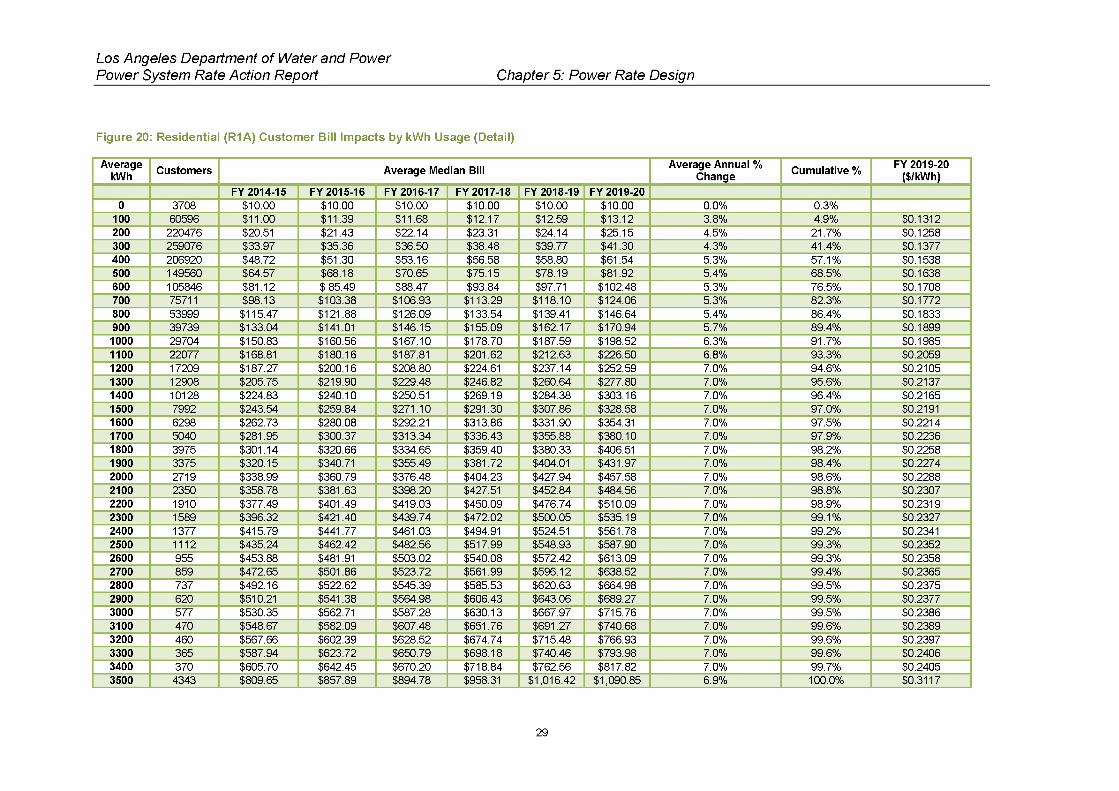
Figure 20 is a tabular representation of Figure 19 that shows the number of customers in each usage band, their proposed average median bill for each of the five years, and the five- year average annual rate increase. The table also includes the cumulative percentage of customers in each customer usage band. For example, at the 500kWh band (which covers all usage above 400 and up to 500kWh), there are 149,560 customers, with a current median bill for FY 2014-15 of $64.57 and a proposed FY 2015-16 bill of $68.18. The five- year average annual increase for this band is 5.4%, and 68.5% of all residential customers have a usage level less than or equal to 500kWh.
28
Los Angeles Department of Water and PowerPower System Rate Action Report Chapter 5: Power Rate Design
Figure 19: Residential (R1A) Customer Annual Rate Impact by Usage Distribution
Residential (R1A) Customers Usage Distribution Annual Rate Impact
300,000 8.0%
oo
oo
oo
oo
oo
oo
oo
oo
Ol
oin
o
to
CM
Num
ber o
f Cus
tom
ers
Perc
ent I
ncre
ase
oo
oo
oo
CO
Ol
w
CM+
Los Angeles Department of Water and PowerPower System Rate Action Report Chapter 5: Power Rate Design
Figure 20: Residential (R1A) Customer Bill Impacts by kWh Usage (Detail)
AveragekWh
Average Annual % Change
FY 2019-20 ($/kWh)Customers Average Median Bill Cumulative %
FY 2014-15 FY 2015-16 FY 2016-17 FY 2017-18 FY 2018-19 FY 2019-200 $10.00 $10.00 $10.00 $10.00 $10.00 $10.003708 0.0% 0.3%
$11.00 $11.39 $11.68 $12.17 $12.59 $13.12 $0.1312100 60596 3.8% 4.9%200 $20.51 $21.43 $22.14 $23.31 $24.14 $25.15 $0.1258220476 4.5% 21.7%
$33.97 $35.36 $36.50 $38.48 $39.77 $41.30 $0.1377300 259076 4.3% 41.4%400 $48.72 $51.30 $53.16 $56.58 $58.80 $61.54 $0.1538206920 5.3% 57.1%
$64.57 $68.18 $70.65 $75.15 $78.19 $81.92 $0.1638500 149560 5.4% 68.5%600 $81.12 $ 85.49 $88.47 $93.84 $97.71 $102.48 $0.1708105846 5.3% 76.5%
$98.13 $103.38 $106.93 $113.29 $118.10 $124.06 $0.1772700 75711 5.3% 82.3%800 $115.47 $121.88 $126.09 $133.54 $139.41 $146.64 $0.183353999 5.4% 86.4%
$133.04 $141.01 $146.15 $155.09 $162.17 $170.94 $0.1899900 39739 5.7% 89.4%1000 $150.83 $160.56 $167.10 $178.70 $187.59 $198.52 $0.198529704 6.3% 91.7%
$168.81 $180.16 $187.81 $201.62 $212.63 $226.50 $0.20591100 22077 6.8% 93.3%1200 $187.27 $200.16 $208.80 $224.61 $237.14 $252.59 $0.210517209 7.0% 94.6%
$205.75 $219.90 $229.48 $246.82 $260.64 $277.80 $0.21371300 12908 7.0% 95.6%1400 $224.83 $240.10 $250.51 $269.19 $284.38 $303.16 $0.216510128 7.0% 96.4%
$243.54 $259.84 $271.10 $291.30 $307.86 $328.58 $0.21911500 7992 7.0% 97.0%1600 $262.73 $280.08 $292.21 $313.86 $331.90 $354.31 $0.22146298 7.0% 97.5%
$281.95 $300.37 $313.34 $336.43 $355.88 $380.10 $0.22361700 5040 7.0% 97.9%1800 $301.14 $320.66 $334.65 $359.40 $380.33 $406.51 $0.22583975 7.0% 98.2%
$320.15 $340.71 $355.49 $381.72 $404.01 $431.97 $0.22741900 3375 7.0% 98.4%2000 $338.99 $360.79 $376.48 $404.23 $427.94 $457.58 $0.22882719 7.0% 98.6%
$358.78 $381.63 $398.20 $427.51 $452.84 $484.56 $0.23072100 2350 7.0% 98.8%2200 $377.49 $401.49 $419.03 $450.09 $476.74 $510.09 $0.23191910 7.0% 98.9%
$396.32 $421.40 $439.74 $472.02 $500.05 $535.19 $0.23272300 1589 7.0% 99.1%2400 $415.79 $441.77 $461.03 $494.91 $524.51 $561.78 $0.23411377 7.0% 99.2%
$435.24 $462.42 $482.56 $517.99 $548.93 $587.90 $0.23522500 1112 7.0% 99.3%2600 $453.88 $481.91 $503.02 $540.08 $572.42 $613.09 $0.2358955 7.0% 99.3%
$472.65 $501.86 $523.72 $561.99 $596.12 $638.52 $0.23652700 859 7.0% 99.4%2800 $492.16 $522.62 $545.39 $585.53 $620.63 $664.98 $0.2375737 7.0% 99.5%
$510.21 $541.38 $564.98 $606.43 $643.06 $689.27 $0.23772900 620 7.0% 99.5%3000 $530.35 $562.71 $587.28 $630.13 $667.97 $715.76 $0.2386577 7.0% 99.5%
$548.67 $582.09 $607.48 $651.76 $691.27 $740.68 $0.23893100 470 7.0% 99.6%3200 $567.66 $602.39 $628.52 $674.74 $715.48 $766.93 $0.2397460 7.0% 99.6%
$587.94 $623.72 $650.79 $698.18 $740.46 $793.98 $0.24063300 365 7.0% 99.6%3400 $605.70 $642.45 $670.20 $718.84 $762.56 $817.82 $0.2405370 7.0% 99.7%
$809.65 $857.89 $894.78 $958.31 $1,016.42 $1,090.85 $0.31173500 4343 6.9% 100.0%
29

Los Angeles Department of Water and PowerPower System Rate Action Report Chapter 5: Power Rate Design
5.4.5 Residential Comparative AnalysisA comparative analysis of the LADWP rate design with the three large California IOUs and several major California publicly-owned utilities determined that these peer utilities have rate structures similar to LADWP’s proposed rate design.
Residential Rate Structure Comparison
Utilities in California have established inverted tier rate designs to promote energy conservation, whereby tier 1 rates are priced lower than other tiers. In addition, tier rates have been guided by marginal costs. Under this approach, tier structures and rates have been largely based on typical consumption and load profiles for Residential customers. The three tier approach also mirrors the high peak, low peak, and base Time of Use (TOU) period concept and provides customers a significant level of control over the cost of electricity. LADWP proposes to continue with this approach, with the addition of a tiered fixed charge. With this change, the revenue requirement for the Residential customer class will be recovered through a combination of the new fixed charge and usage measured on a kWh basis.
Number of Tier Thresholds
In general, IOUs have four tiers and publicly-owned utilities have two to three tiers. However, the IOUs have indicated plans to reduce the number of tiers. Tier sizes vary by utility; the median allotment for the first tier among the utilities studied was 350kWh. Only two California publicly-owned utilities studied (Pasadena and Redding) have one tier and, hence, only one tariff rate.
Usage allocation levels are used to establish the tier thresholds. LADWP’s baseline allocations for each tier are more generous than the CPUC mandated baseline allocations for the three major California IOUs, as shown in Figure 21.
Figure 21: Comparison of LADWP and California IOU Residential Tier Structure
Tier LADWP California IOUs
1 0% < and < 100% of Baseline 0% < and < 100% of Baseline
2 100% < and < 300% of Baseline 100% < and < 130% of Baseline
3 > 300% of Baseline 130% < and < 200% of Baseline
4 N/A >200% of Baseline
This comparison illustrates that LADWP has larger tier sizes than the IOUs; for LADWP, the top tier tariff is assessed to any load that is over 300% of the baseline allocation, while for the IOUs, the top tier (tier 4) tariff is assessed to any load over 200% of the baseline. These large tier
30

Los Angeles Department of Water and PowerPower System Rate Action Report Chapter 5: Power Rate Design
sizes accommodate a rate structure that results in a more gradual progression of tariffs within tiers for LADWP.
As a result of these features, a relatively small proportion of residential customers are assessed the higher tier 3 tariffs. In aggregate, only 6.4% of Zone 1 customers (or 28% of Residential load) and 2.9% of Zone 2 customers (or 13% of Residential load) are assessed the higher tier 3 summer rate. This feature is conducive to supporting conservation and facilitating revenue stability.
In its Residential Rate Reform Proceeding, (R-12-06-013) the CPUC had circulated a draft decision, dated April 21, 2015, that would modify the rate structures of SCE, PG&E and SDG&E (California IOUs) as follows:
• Substantial increases in minimum bill charges to a level of $10 per month by 2016 and possible introduction of fixed monthly charges later;
• Reduction in the number of tiers from the current level of four to two by 2018; and
• Compression of tier rates, such that rate increases are much higher for lower tiers as compared to higher tiers.
At this time, this draft decision is still being reviewed by the Commission. In addition, an alternative proposal has been submitted by a CPUC commissioner, dated May 22, 2015, that will also need to be considered. However, the main trend of higher fixed or minimum bill monthly charges is occurring for the IOUs no matter which proposal is adopted.
In June 2014, IOUs received CPUC approval to implement larger rate increases for the lower two tiers, as an interim step toward flattening of tier rates over four years. These recent developments illustrate the IOU trend toward compression of both the number of tiers and tier rates, which is likely to reduce incentives for conservation.
In contrast, LADWP’s proposed rate design will retain the current three tier structure. This methodology is consistent with LADWP’s balanced approach to promote conservation measures, while at the same time encouraging customer solar generation through an inverted tier rate structure with progressively higher tier 3 rates.
Seasonal Rates
The majority of the utilities have seasonal tariff configuration with winter rates for each tier slightly lower than the corresponding rates in summer.
Fixed Charges
Over 50% of the utilities studied have a fixed monthly infrastructure charge in their rates (currently ranging from $1.00 to $28.00). As discussed earlier, Figure 22 provides a comparison
31
Los Angeles Department of Water and PowerPower System Rate Action Report Chapter 5: Power Rate Design
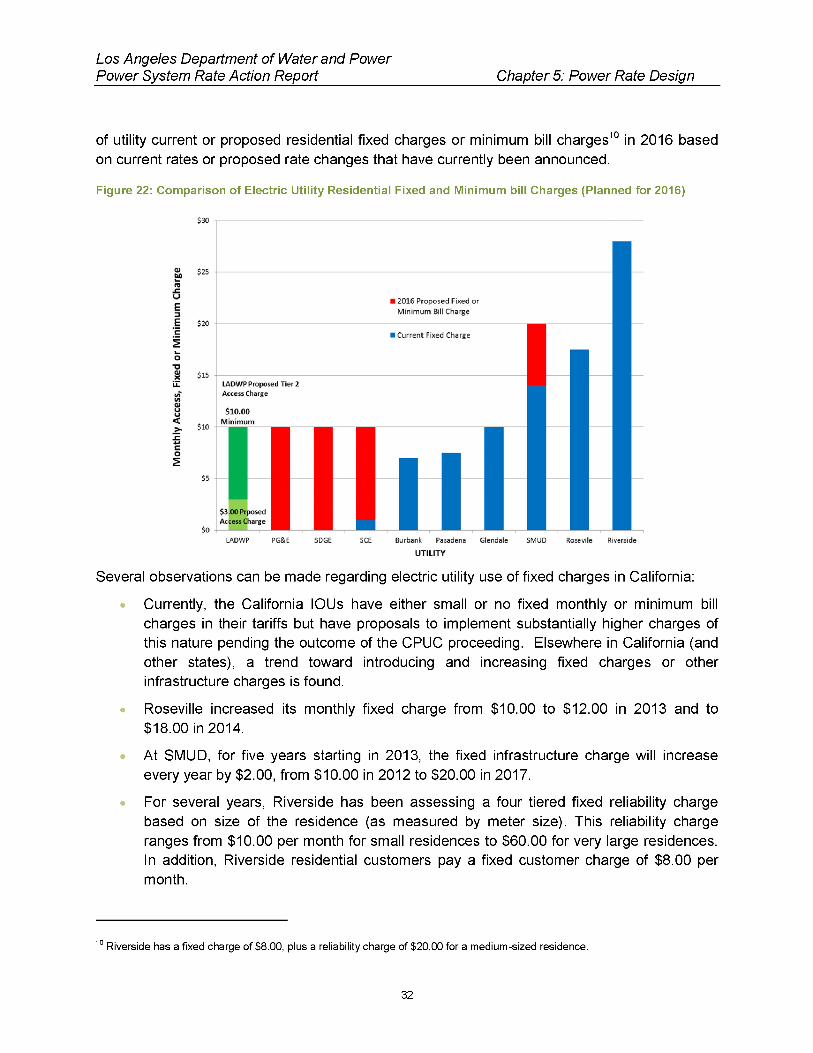
of utility current or proposed residential fixed charges or minimum bill charges10 in 2016 based on current rates or proposed rate changes that have currently been announced.
Figure 22: Comparison of Electric Utility Residential Fixed and Minimum bill Charges (Planned for 2016)
$30
<D $25ClO
U ■ 2016 Proposed Fixed or Minimum Bill ChargeE3
E $20
■ Current Fixed Charge£o-O(LI $15X
LADWP Proposed Tier 2 Access Charge
C/1a)$10.00
Minimum
uu<
$10>*CO5
$5
$3 posedAC harge
$0PG&E Burbank Pasadena Glendale Rosevile RiversideLADWP SDGE SCE SM LID
UTILITY
Several observations can be made regarding electric utility use of fixed charges in California:
• Currently, the California IOUs have either small or no fixed monthly or minimum bill charges in their tariffs but have proposals to implement substantially higher charges of this nature pending the outcome of the CPUC proceeding. Elsewhere in California (and other states), a trend toward introducing and increasing fixed charges or other infrastructure charges is found.
• Roseville increased its monthly fixed charge from $10.00 to $12.00 in 2013 and to $18.00 in 2014.
• At SMUD, for five years starting in 2013, the fixed infrastructure charge will increase every year by $2.00, from $10.00 in 2012 to $20.00 in 2017.
• For several years, Riverside has been assessing a four tiered fixed reliability charge based on size of the residence (as measured by meter size). This reliability charge ranges from $10.00 per month for small residences to $60.00 for very large residences. In addition, Riverside residential customers pay a fixed customer charge of $8.00 per month.
10 Riverside has a fixed charge of $8.00, plus a reliability charge of $20.00 for a medium-sized residence.
32

Los Angeles Department of Water and PowerPower System Rate Action Report Chapter 5: Power Rate Design
In October 2014, Pasadena split its residential Distribution and Customer charge into two components: a monthly fixed Customer Charge of $7.80 and a Distribution Charge per kWh based on three usage tiers.
Residential Rate Comparison
LADWP’s proposed FY 2015-16 Residential rates for the typical Residential consumption level of 500kWh are less than 15 cents per kWh. As shown in Figure 23, LADWP’s proposed Residential rates are competitive at all usage levels when compared to the vast majority of peer utilities and are significantly lower than IOU rates. In addition, these comparisons do not include the impact of rate increases being implemented by other utilities, so the LADWP price favorability is likely to continue and even increase.
Figure 23: Residential Customer Peer Rate Comparison by Consumption Level ($/kWh)
Residential (R1 A) Electric Rate Comparison
$0.30
$0.25LADWP FY 1415 (Current) LADWP FY 1516 (Proposed)
------SCE
** $0.20 ------PGE
------SDGE
------ BURBANK
------GLENDALE$0.15
PASADENA
$0.10100 300 500 700 900 1100 1300 1500 1700 1900 2100 2300 2500
Monthly Consumption (kWh)
LADWP’s proposed FY 2015-16 typical Residential customer electric bill (based on 500kWh of monthly usage) is the lowest among the peer group, as shown in Figure 24 below. The balanced approach to rate design promotes conservation and encourages distributed generation at the same time. Consequently, LADWP has assigned a larger proportion of the rate increase to higher usage customers. This approach is depicted by the steeper gradient of the LADWP FY 2015-16 proposed residential bill amounts (red line) as compared to current LADWP bills (blue line).
33

Residential (R1 A) Electric Bill Comparison
-LADWP FY 1415 (Current)
-LADWP FY 1516 (Proposed)
SCE
------PGE
------SDGE
BURBANK
------GLENDALE
PASADENA
500 600 700 800 900 1,000 1,100 1,200 1,300 1,400 1,500Monthly Consumption (kWh)
5.5 COMMERCIAL AND INDUSTRIAL (A1A, A2B, A3A)
No significant changes are proposed to the rate structure for Commercial and Industrial customers. These tariffs include Small Commercial (A1A), Medium Commercial (A2B), and Large Commercial and Industrial (A3A). The proposed rate increase is assigned across the facilities demand charge, monthly demand charge, and energy charge to align the rate design with cost of service rate design considerations. Due to the variety of load characteristics for commercial and industrial customers, the rate design had to maintain a balance between the energy and capacity characteristics of these customers.
As mentioned earlier in this report, Figure 25 provides a summary of the major rate design elements for LADWP Commercial and Industrial customers.
34
Los Angeles Department of Water and PowerPower System Rate Action Report Chapter 5: Power Rate Design
Current and proposed LADWP customer bills are quite similar at lower usage levels; however, proposed LADWP bills are higher than current bills at usage levels above 1,000kWh. Despite this approach, LADWP’s bills for customers with higher usage are still much lower than corresponding bills for the IOUs, and also lower than most peer publicly-owned utilities.
Figure 24: Residential Customer Average Monthly Electric Bill Comparison (Total Bill)
oo
-t-
ooco
cncn
cncn
cncn
cn
LOun
CM
CM
CM
CM
CM
s
GJ
CO
CM
CM
C/3
CO
C/J
CO
CO
■ify
ifi
Mon
thly
Bill
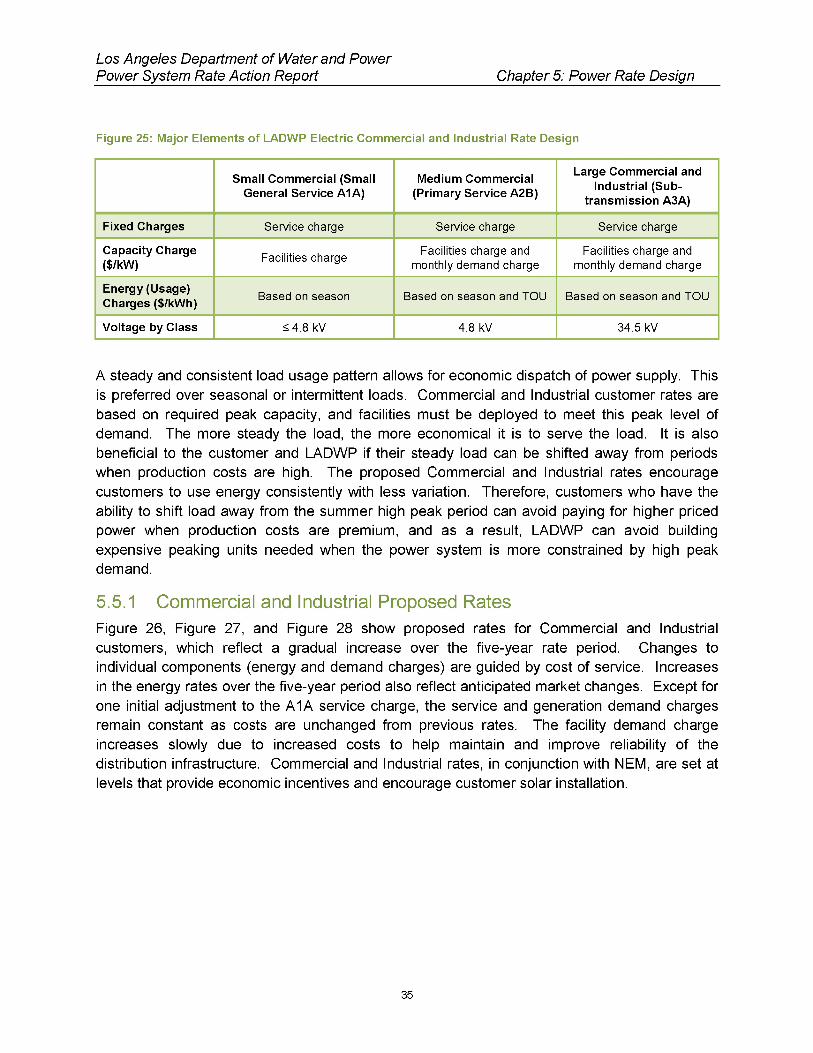
Los Angeles Department of Water and PowerPower System Rate Action Report Chapter 5: Power Rate Design
Figure 25: Major Elements of LADWP Electric Commercial and Industrial Rate Design
Large Commercial and Industrial (Sub
transmission A3A)
Small Commercial (Small General Service A1A)
Medium Commercial (Primary Service A2B)
Fixed Charges Service charge Service charge Service charge
Capacity Charge ($/kW)
Facilities charge and monthly demand charge
Facilities charge and monthly demand charge
Facilities charge
Energy (Usage) Charges ($/kWh) Based on season Based on season and TOU Based on season and TOU
Voltage by Class < 4.8 kV 4.8 kV 34.5 kV
A steady and consistent load usage pattern allows for economic dispatch of power supply. This is preferred over seasonal or intermittent loads. Commercial and Industrial customer rates are based on required peak capacity, and facilities must be deployed to meet this peak level of demand. The more steady the load, the more economical it is to serve the load. It is also beneficial to the customer and LADWP if their steady load can be shifted away from periods when production costs are high. The proposed Commercial and Industrial rates encourage customers to use energy consistently with less variation. Therefore, customers who have the ability to shift load away from the summer high peak period can avoid paying for higher priced power when production costs are premium, and as a result, LADWP can avoid building expensive peaking units needed when the power system is more constrained by high peak demand.
5.5.1 Commercial and Industrial Proposed RatesFigure 26, Figure 27, and Figure 28 show proposed rates for Commercial and Industrial customers, which reflect a gradual increase over the five-year rate period. Changes to individual components (energy and demand charges) are guided by cost of service. Increases in the energy rates over the five-year period also reflect anticipated market changes. Except for one initial adjustment to the A1A service charge, the service and generation demand charges remain constant as costs are unchanged from previous rates. The facility demand charge increases slowly due to increased costs to help maintain and improve reliability of the distribution infrastructure. Commercial and Industrial rates, in conjunction with NEM, are set at levels that provide economic incentives and encourage customer solar installation.
35
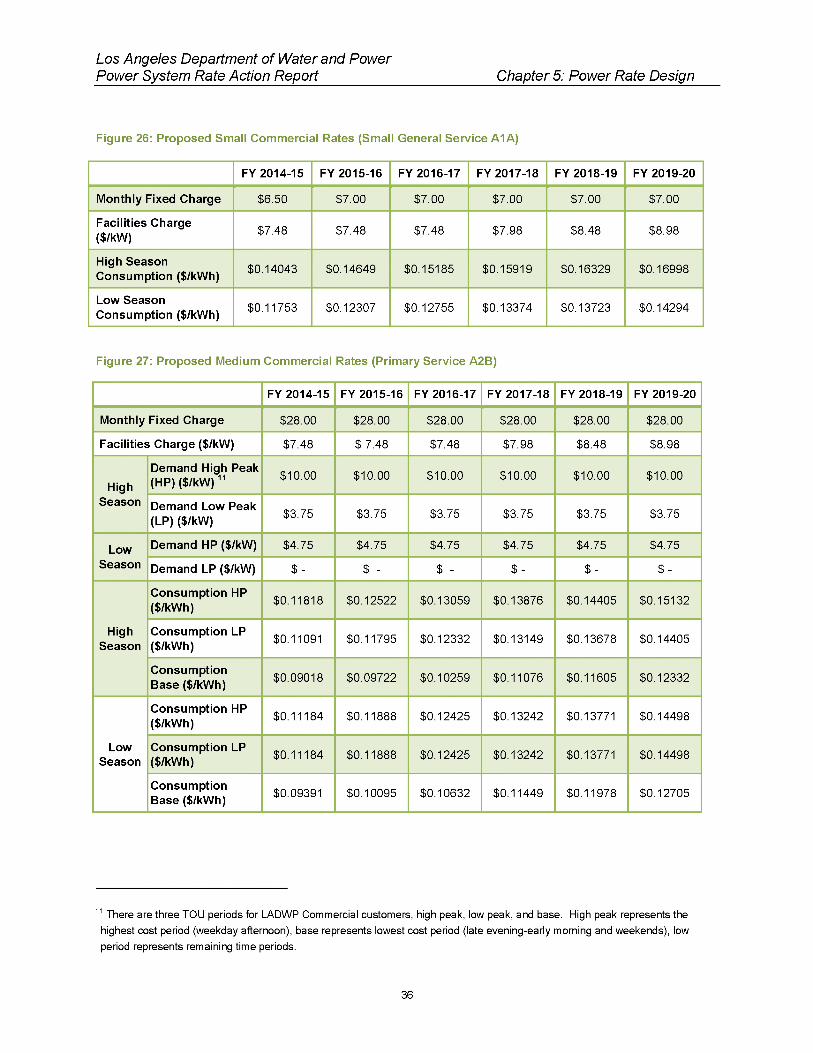
Los Angeles Department of Water and PowerPower System Rate Action Report Chapter 5: Power Rate Design
Figure 26: Proposed Small Commercial Rates (Small General Service A1A)
FY 2014-15 FY 2015-16 FY 2016-17 FY 2017-18 FY 2018-19 FY 2019-20
Monthly Fixed Charge $6.50 $7.00 $7.00 $7.00 $7.00 $7.00
Facilities Charge ($/kW) $7.48 $7.48 $7.48 $7.98 $8.48 $8.98
High Season Consumption ($/kWh) $0.14043 $0.14649 $0.15185 $0.15919 $0.16329 $0.16998
Low Season Consumption ($/kWh) $0.11753 $0.12307 $0.12755 $0.13374 $0.13723 $0.14294
Figure 27: Proposed Medium Commercial Rates (Primary Service A2B)
FY 2014-15 FY 2015-16 FY 2016-17 FY 2017-18 FY 2018-19 FY 2019-20
Monthly Fixed Charge $28.00 $28.00 $28.00 $28.00 $28.00 $28.00
Facilities Charge ($/kW) $7.48 $ 7.48 $7.48 $7.98 $8.48 $8.98
Demand High Peak (HP) ($/kW) $10.00 $10.00 $10.00 $10.00 $10.00 $10.0011
HighSeason Demand Low Peak
(LP) ($/kW) $3.75 $3.75 $3.75 $3.75 $3.75 $3.75
Demand HP ($/kW) $4.75 $4.75 $4.75 $4.75 $4.75 $4.75LowSeason Demand LP ($/kW) $ - $ - $ - $ - $ - $ -
Consumption HP ($/kWh) $0.11818 $0.12522 $0.13059 $0.13876 $0.14405 $0.15132
HighSeason
Consumption LP ($/kWh) $0.11091 $0.11795 $0.12332 $0.13149 $0.13678 $0.14405
Consumption Base ($/kWh) $0.09018 $0.09722 $0.10259 $0.11076 $0.11605 $0.12332
Consumption HP ($/kWh) $0.11184 $0.11888 $0.12425 $0.13242 $0.13771 $0.14498
LowSeason
Consumption LP ($/kWh) $0.11184 $0.11888 $0.12425 $0.13242 $0.13771 $0.14498
Consumption Base ($/kWh) $0.09391 $0.10095 $0.10632 $0.11449 $0.11978 $0.12705
11 There are three TOU periods for LADWP Commercial customers, high peak, low peak, and base. High peak represents the highest cost period (weekday afternoon), base represents lowest cost period (late evening-early morning and weekends), low period represents remaining time periods.
36

Los Angeles Department of Water and PowerPower System Rate Action Report Chapter 5: Power Rate Design
Figure 28: Proposed Large Commercial Rates (Sub-transmission A3A)
FY 2014-15 FY 2015-16 FY 2016-17 FY 2017-18 FY 2018-19 FY 2019-20
Monthly Fixed Charge $75.00 $75.00 $75.00 $75.00 $75.00 $75.00
Facilities Charge ($/kW) $6.68 $6.68 $7.18 $7.68 $8.186.68
Demand HP Summer ($/kW) $9.70 $9.70 $9.70 $9.70 $9.70 $9.70
Demand LP Summer ($/kW) $3.30 $3.30 $3.30 $3.30 $3.30 $3.30
Demand HP Winter ($/kW) $4.30 $4.30 $4.30 $4.30 $4.30 $4.30
Demand LP Winter ($/kW) $ - $ - $ - $ - $ - $ -
Consumption HP Summer ($/kWh) $0.11577 $0.12252 $0.12757 $0.13571 $0.14093 $0.14801
Consumption LP Summer ($/kWh) $0.10951 $0.11626 $0.12131 $0.12945 $0.13467 $0.14175
Consumption Base Summer ($/kWh)
$0.08942 $0.09617 $0.10122 $0.10936 $0.11430 $0.12166
Consumption HP Winter ($/kWh) $0.11050 $0.11725 $0.12230 $0.13044 $0.13566 $0.14274
Consumption LP Winter ($/kWh) $0.11050 $0.11725 $0.12230 $0.13044 $0.13566 $0.14274
Consumption Base Winter ($/kWh)
$0.09384 $0.10059 $0.10564 $0.11378 $0.11900 $0.12608
5.5.2 Commercial and Industrial Customer Rate ImpactsSmall Commercial Customer (Small General Service A1A)
The proposed rate design encourages Small Commercial customers to use energy consistently with less variation (improve/increase their load factor)12. The 3.8% to 4.1% range of annual rate changes for this class is small. Figure 29 provides a graphical representation, and Figure 30 provides a tabular representation of the average annual distribution of bills with proposed rates based on load.
12 Load Factor is defined as: Total Monthly Average kWh/ (Max High Peak kW for Month * Hours in the Month).
37

2.0%10,000
-■ 1.0%5,000
■ ■— 0.0%
ft ft ft ftft ft ft ft ft a ^ if0: o- o- o- «&• Or C»-<5- O’ O’ 0;Average Load Factor
Frequency Avg. Annual % Inc.
38
Figure 29: Small Commercial Customer (Small General Service A1A) Annual Rate Impact by Usage Distribution
Small Commercial (Small General Service A1A) Customers UsageDistribution
Annual Rate Impact
40,000 7.0%
35,000 67th percentile 6.0%
Los Angeles Department of Water and PowerPower System Rate Action Report Chapter 5: Power Rate Design
Perc
ent I
ncre
ase
oo
o
cn-P
*
cO
ii .■<t> >
<cn
incn
nj3 Q <r> mc
OO
oo
oo
oo
oo
oo
oo
LO
GJ
CM
CM
Num
ber o
f Cus
tom
ers

Los Angeles Department of Water and PowerPower System Rate Action Report Chapter 5: Power Rate Design
Figure 30: Small Commercial Customer (Small General Service A1A) Bill Impacts by Load Factor (Detail)
AverageAnnualIncrease
FY 2019-20 $/kWhLoad Factor Customers Average Median Bill Cumulative %
FY 2014-15 FY 2015-16 FY 2016-17 FY 2017-18 FY 2018-19 FY 2019-20
0.05 $44.68 $45.55 $45.86 $48.30 $50.55 $52.95 $0.79034,780 3.7% 22.8%
0.10 $67.09 $68.97 $70.12 $73.74 $76.66 $80.15 $0.34629,376 3.9% 39.7%
0.15 $96.74 $99.69 $101.74 $107.02 $111.05 $116.06 $0.26625,947 4.0% 54.7%
0.20 $147.95 $152.83 $156.52 $164.57 $170.43 $178.11 $0.23320,867 4.1% 66.7%
0.25 $199.95 $206.92 $212.32 $223.23 $230.86 $241.11 $0.21414,665 4.1% 75.1%
0.30 $256.47 $265.61 $272.85 $286.83 $296.46 $309.61 $0.20310,372 4.1% 81.1%
0.35 $324.23 $336.23 $345.86 $363.48 $375.28 $391.85 $0.1947,960 4.2% 85.7%
0.40 $402.03 $417.39 $429.74 $451.51 $465.92 $486.36 $0.1886,768 4.2% 89.6%
0.50 $526.08 $546.50 $563.22 $591.67 $610.03 $636.62 $0.1829,816 4.2% 95.3%
0.60 $627.44 $652.74 $673.34 $707.12 $728.38 $759.72 $0.1774,891 4.2% 98.1%
0.70 $604.28 $629.01 $649.22 $681.59 $701.76 $731.86 $0.1731,862 4.2% 99.2%
0.80 $426.69 $444.45 $458.90 $481.54 $495.51 $516.57 $0.171642 4.2% 99.5%
0.90 $367.61 $383.12 $395.75 $415.13 $426.90 $444.85 $0.169266 4.2% 99.7%
1.00 $386.58 $403.03 $416.38 $436.77 $449.10 $467.98 $0.168115 4.2% 99.7%
2.00 $480.66 $501.39 $518.33 $543.66 $558.76 $582.17 $0.165361 4.2% 100.0%
39

0.0%
0 i\Q nQ nSi [S \- \- 0° 0s'5Q-o- Q- 0- Q- \- V<y \-
Average Load Factor
Frequency •Avg. Annual % Inc.
Medium Commercial Customer (Primary Service A2B) Rate Impacts
Similar to the Small Commercial customer class, the proposed rate and rate design encourage Medium Commercial customers to improve their load factor and shift load outside of peak hours. The level of annual rate changes is relatively small for this class; the average annual increase for the vast majority of Medium Commercial customers will range from 2.4% to 6.4%.
Figure 31 and Figure 32 provide graphical and tabular depictions respectively of the average annual distribution of the rate increase based on load factor for the five-year rate period.
Figure 31: Medium Commercial Customer (Primary Service A2B) Annual Rate Impact by Usage Distribution
Medium Commercial (Primary Service A2B) Customers Usage Distribution
Annual Rate Impact
3,000 7.0%
6.0%2,600
40
61th percentile
Class Avg. Increase 5.0%
L
Los Angeles Department of Water and PowerPower System Rate Action Report Chapter 5: Power Rate Design
Perc
ent I
ncre
ase
pp
po
oLO
CO
csi
O
o
O
oo
oo
oo
too
tocm'
Num
ber o
f Cus
tom
ers

Los Angeles Department of Water and PowerPower System Rate Action Report Chapter 5: Power Rate Design
Figure 32: Medium Commercial Customer (Primary Service A2B) Annual Bill Impacts by Load Factor (Detail)
LoadFactor
Average Annual Increase
FY 2019-20 $/kWhCustomers Average Median Bill Cumulative %
FY 2014-15 FY 2015-16 FY 2016-17 FY 2017-18 FY 2018-19 FY 2019-20$248.48 $249.27 $250.39 $265.54 $279.75 $294.6159 3.7% 0.4%
0.02 $736.07 $737.81 $739.13 $777.32 $814.80 $850.95 $2.50012 3.1% 0.5%0.03 $927.22 $932.58 $936.66 $971.72 $1,004.58 $1,038.95 $1.35012 2.4% 0.6%0.04 $686.56 $692.28 $696.64 $726.81 $754.65 $784.09 $1.29217 2.8% 0.7%0.05 $602.04 $605.87 $608.79 $639.01 $667.65 $697.37 $0.83017 3.2% 0.9%0.06 $805.23 $814.47 $821.52 $858.81 $890.71 $924.08 $0.78034 3.0% 1.1%0.07 $731.33 $742.14 $750.39 $782.92 $811.04 $842.19 $0.63228 3.0% 1.3%0.08 $725.20 $737.03 $746.06 $779.98 $809.05 $ 841.46 $0.55427 3.2% 1.5%0.09 $956.78 $971.16 $982.14 $1,028.26 $1,068.51 $1,112.80 $0.53643 3.3% 1.8%0.10 $815.02 $830.38 $842.10 $879.63 $910.87 $946.44 $0.46739 3.2% 2.1%0.20 $1,019.09 $1,044.32 $1,064.61 $1,115.66 $1,157.14 $1,206.31 $0.3341,056 3.7% 9.4%0.30 $1,412.43 $1,459.87 $1,497.82 $1,578.45 $1,639.10 $1,713.41 $0.2542,274 4.3% 26.2%0.40 $1,720.61 $1,790.62 $1,844.77 $1,950.31 $2,026.82 $2,123.29 $0.2172,441 4.7% 44.1%0.50 $2,147.49 $2,243.47 $2,319.67 $2,456.53 $2,554.54 $2,679.10 $0.1962,331 5.0% 61.3%0.60 $2,434.06 $2,551.64 $2,642.10 $2,805.25 $2,920.28 $3,069.76 $0.1831,919 5.2% 75.4%0.70 $2,882.67 $3,031.09 $3,147.38 $3,348.01 $3,487.49 $3,668.19 $0.1751,431 5.4% 85.9%0.80 $2,910.16 $3,060.96 $3,177.63 $3,383.61 $3,525.78 $3,711.89 $0.1681,234 5.5% 95.0%0.90 $3,039.72 $3,206.03 $3,332.88 $3,552.62 $3,704.33 $3,902.81 $0.165482 5.7% 98.5%1.00 $3,491.39 $3,691.39 $3,843.95 $4,098.47 $4,271.18 $4,500.13 $0.16172 5.8% 99.0%1.10 $2,118.08 $2,232.67 $2,320.08 $2,475.72 $2,584.49 $2,725.49 $0.16617 5.7% 99.2%1.20 $1,352.72 $1,419.08 $1,471.83 $1,571.34 $1,641.74 $1,732.16 $0.16916 5.6% 99.3%1.30 $2,889.58 $3,037.14 $3,149.70 $3,364.27 $3,518.48 $3,714.20 $0.1676 5.7% 99.3%1.40 $1,404.48 $1,480.41 $1,538.33 $1,642.75 $1,716.11 $1,810.82 $0.1827 5.8% 99.4%1.50 $1,172.42 $1,224.45 $1,264.14 $1,349.91 $1,414.40 $1,493.52 $0.2272 5.5% 99.4%1.60 $1,756.52 $1,852.52 $1,925.74 $2,057.55 $2,150.09 $2,269.63 $0.1682 5.8% 99.4%1.70 $1,714.96 $1,800.95 $1,866.53 $1,995.84 $2,089.98 $2,208.29 $0.2042 5.8% 99.4%1.80 $1,531.83 $1,618.48 $1,684.57 $1,801.58 $1,883.16 $1,989.10 $0.1685 6.0% 99.5%1.90 $2,896.84 $3,058.43 $3,181.68 $3,403.46 $3,559.15 $3,760.28 $0.1643 6.0% 99.5%2.00 $2,236.65 $2,368.29 $2,468.70 $2,652.40 $2,782.25 $2,949.13 $0.18511 6.4% 99.6%
41

Los Angeles Department of Water and PowerPower System Rate Action Report Chapter 5: Power Rate Design
Large Commercial and Industrial Customer (Sub-transmission A3A) Rate Impacts
Similar to the Small and Medium Commercial customers, the proposed rates and rate design encourage Large Commercial and Industrial customers to improve their load factor and shift load outside of peak hours. The range of annual rate changes is also relatively small for this class with increase for the vast majority of customers to range from 4% to 6%.
Figure 33 and Figure 34 provide graphical and tabular depictions respectively of the average annual distribution of the rate increase based on load factor for the five-year rate period.
Figure 33: Large Commercial and Industrial Customer (Sub-transmission A3A) Annual Rate Impact by Usage Distribution
Large Commercial and Industrial (Subtransmission A3A) CustomersUsage Distribution
Annual Rate Impact
1000 T 7.0%52th percentile
9006.0%
800 --
5.0%700
E Class Avg. Increase 5.0%
600o -- 4.0% <u3 oO c500o c
3.0% o-C 400 --£ CL3z
300 -■ 2.0%
200
1.0%100
M I M I — ■0^ ^ ^ of ^ 5? ^ vP .5?V vQ*‘ V V' V
Average Load Factor
i i Frequency Avg. Annual % Inc.
42

Los Angeles Department of Water and PowerPower System Rate Action Report Chapter 5: Power Rate Design
Figure 34: Large Commercial and Industrial Customer (Sub-transmission A3A) Bill Impacts by Load Factor (Detail)
LoadFactor
Average Annual Increase
FY 2019-20 $/kWhCustomers Average Median Bill Cumulative %
FY 2014-15 FY 2015-16 FY 2016-17 FY 2017-18 FY 2018-19 FY 2019-200.00 $898.27 $ 956.00 $999.35 $1,069.08 $1,113.61 $1,175.04 $0.138482 6.2% 8.9%0.01 $1,520.80 $1,521.57 $1,522.14 $1,580.06 $1,637.65 $1,695.46 $8.0824 2.3% 9.0%0.02 $359.12 $360.63 $361.77 $375.55 $388.64 $402.21 $2.1672 2.4% 9.0%0.03 $2,278.97 $2,293.60 $2,304.54 $2,397.67 $2,484.40 $2,575.33 $1.2174 2.6% 9.1%0.04 $212.26 $213.85 $215.03 $222.54 $229.32 $236.62 $1.1724 2.3% 9.2%0.05 $1,410.85 $1,426.32 $1,437.89 $1,497.94 $1,551.18 $1,608.93 $0.7025 2.8% 9.3%0.06 $161.34 $162.95 $164.15 $169.99 $175.09 $180.72 $0.7195 2.4% 9.4%0.07 $995.11 $1,009.74 $1,020.69 $1,064.94 $1,102.76 $1,144.80 $0.58512 3.0% 9.6%0.08 $1,322.53 $1,343.84 $1,359.78 $1,424.64 $1,480.15 $1,541.82 $0.5594 3.3% 9.7%0.09 $1,799.24 $1,821.81 $1,838.69 $1,952.64 $2,056.77 $2,167.23 $0.4595 4.1% 9.8%0.10 $1,986.91 $2,008.87 $2,025.30 $2,145.11 $2,255.29 $2,371.80 $0.40311 3.9% 10.0%0.20 $2,201.65 $2,267.93 $2,317.53 $2,438.01 $2,527.18 $2,632.68 $0.309151 3.9% 12.8%0.30 $3,159.70 $3,278.87 $3,368.03 $3,560.58 $3,699.09 $3,870.36 $0.234445 4.5% 21.0%0.40 $4,170.95 $4,343.04 $4,471.78 $4,742.10 $4,933.24 $5,173.58 $0.206749 4.8% 34.9%0.50 $6,133.61 $6,396.31 $6,592.84 $7,003.48 $7,298.29 $7,669.86 $0.188914 5.0% 51.8%0.60 $7,475.75 $7,834.27 $8,102.50 $8,619.00 $8,975.04 $9,443.41 $0.177813 5.3% 66.8%0.70 $10,432.78 $10,966.32 $11,365.48 $12,110.09 $12,618.28 $13,284.71 $0.169641 5.5% 78.7%0.80 $14,088.77 $14,830.15 $15,384.82 $16,408.17 $17,103.15 $18,017.73 $0.163548 5.6% 88.9%0.90 $10,806.46 $11,379.97 $11,809.04 $12,599.05 $13,135.21 $13,840.91 $0.160343 5.6% 95.2%1.00 $8,351.72 $8,812.06 $9,156.47 $9,775.22 $10,190.18 $10,741.27 $0.159134 5.7% 97.7%1.10 $7,126.57 $7,527.69 $7,827.78 $8,355.70 $8,706.36 $9,175.03 $0.15936 5.7% 98.4%1.20 $4,772.67 $5,029.82 $5,182.40 $5,529.14 $5,785.88 $6,102.38 $0.15717 5.6% 98.7%1.30 $5,274.29 $5,480.58 $5,634.91 $6,027.92 $6,329.51 $6,692.32 $0.15912 5.4% 98.9%1.40 $8,252.33 $8,707.92 $9,048.77 $9,683.08 $10,115.61 $10,683.07 $0.15210 5.9% 99.1%1.50 $3,992.02 $4,221.00 $4,392.32 $4,693.66 $4,893.67 $5,161.32 $0.1523 5.9% 99.1%1.60 $3,003.38 $3,165.44 $3,286.69 $3,514.53 $3,670.53 $3,874.64 $0.1647 5.8% 99.3%1.70 $14,915.77 $15,807.16 $16,474.05 $17,631.20 $18,393.60 $19,419.90 $0.1613 6.0% 99.3%1.80 $1,522.26 $1,602.73 $1,662.94 $1,776.78 $1,854.90 $1,957.01 $0.1641 5.7% 99.3%1.90 $4,521.76 $4,729.25 $4,884.49 $5,235.46 $5,494.22 $5,815.06 $0.2014 5.7% 99.4%2.00 $2,270.63 $2,390.05 $2,479.39 $2,655.02 $2,777.86 $2,935.87 $0.16132 5.9% 100.0%
43

Small Commercial (A1A) Power Rate Comparison as of January 2015
■LADWP FY 14-15 (Current)
■LADWP FY 15-16 (Proposed)
-------SCE
------ PGE
-------SDGE
------ BURBANK
------ GLENDALE
------PASADENA
0.05 0.10 0.15 0.20 0.25 0,30 0.35 0.40 0.50 0.60 0.70 0,80 0.90 1,00 2.00Load Factor Calculated Using High Peak Demand
5.5.3 Commercial and Industrial Customer Comparative Rate AnalysisSmall Commercial (Small General Service A1A) Comparative Rate Analysis
As discussed earlier, Small Commercial customers with higher load factors use energy more efficiently, resulting in a lower average cost of service. Therefore, Small Commercial customers with high load factors should benefit from lower rates. LADWP’s rates for Small Commercial customers are designed to encourage customers with high load factors. Consequently, LADWP’s rates for this customer class are lower than most peers at load factors greater than 30%. For Small Commercial customers with a load factor above 50%, LADWP rates are the lowest of the peer utilities as depicted in Figure 35.
Figure 35: Small Commercial Customer Peer Rate Comparison ($/kWh by Load Factor)
Medium Commercial (Primary Service A2B) Comparative Rate Analysis
LADWP’s Medium Commercial customer rates are competitive with the majority of California utilities. In particular, over 70% of LADWP’s Medium Commercial customers have a load factor greater than 30%; at these load factor levels, the Department’s Medium Commercial customers have rates among the lowest in the peer group, as shown in Figure 36.
44
Los Angeles Department of Water and PowerPower System Rate Action Report Chapter 5: Power Rate Design
8
B8
5
S8
8
8
in
-r-
CM
Ifl(fl
tfitfl
ifl
So
$/kW
h

$0,700
►LADWP FY 14-15 (Current:)
►LADWP FY 15-16 (Proposed)
$0,600
-------SCE
-------PGE$0,500
-------SDGE
-------BURBANK$0,400
-------GLENDALE
-------PASADENA$0,300
$0,200
$0,1000.10 0.20 0.30 0,40 0.50 0.60 0.70 0.80 0.90 1.00 1.10 1.20 1.30 1.40 1.50
Load Factor Calculated Using High Peak Demand
Large Commercial and Industrial (A3A) Electric Rate Comparison as of January 2015
$0,800
Figure 36: Medium Commercial Customer Peer Rate Comparison
Medium Commercial and Industrial (A2B) Electric Rate Comparison as of January 2015
$0,800
$0,700
$0,600 LADWP FY 14-15 (Current)
LADWP FY 15-16 (Proposed)
$0,500 ------- SCE
§ ------- PGEw
$0,400 ------- SDGE
-------BURBANK
$0,300 -------GLENDALE
— PASADENA
$0,200
$0,1000.10 0.20 0.30 0.40 0.50 0.60 0.70 0.80 0.90 1.00 1.10 1.20 1.30
Load Factor Calculated Using High Peak Demand
Large Commercial and Industrial (Sub-transmission A3A) Comparative Rate Analysis
For Large Commercial and Industrial customers, LADWP’s rates are competitive among other California utilities, as shown in Figure 37.
Figure 37: Large Commercial and Industrial Customer Peer Rate Comparison
45
Los Angeles Department of Water and PowerPower System Rate Action Report Chapter 5: Power Rate Design
$/kW
h

Los Angeles Department of Water and PowerPower System Rate Action Report Chapter 5: Power Rate Design
135.6 BUSINESS PROMOTION SERVICE RIDER
The City of Los Angeles has actively developed policies to attract new business to the area. One of the five overarching outcomes in the Mayor’s FY 2015-16 "Budget Policy and Goals” is to "Promote good jobs for Angelenos all across Los Angeles.” Reasonable electricity rates are an important tool to attract new businesses, making it "easier to do business in Los Angeles” and "promote equity, affordability and upward economic mobility”, which are additional Mayoral outcomes.
Generally, LADWP’s electric commercial rates are competitive. However, as an additional incentive to encourage businesses to locate in the City of Los Angeles, a cost based business promotion service rider has been developed to better use LADWP generation capacity. Over the next ten years, generation capacity in the Power System is expected to be available to serve new commercial customer load growth. To attract new customers to come to Los Angeles qualifying new commercial businesses that locate in the City and receive service under General Service Schedule A2, A3, or A4 will be eligible to receive bill credit amounts that will be phased out over three years based on the marginal value of this capacity. The service rider is limited to a total of 80MW of customer load. Qualification rules will be developed and communicated by LADWP before the service rider is available sometime in 2016. The bill credits, as a percent of total, for those that qualify are outlined in Figure 38.
Figure 38: Business Promotion Bill Credit by Year
Year of Location Credit Amount
1st Year 7.6%
2nd Year 5.0%
3rd Year 2.5%
5.7 SUMMARY OF ELECTRIC RATE DESIGN
In summary, the main changes to LADWP’s electric rate design include a fixed charge for Residential customers, and a phased in system rate change averaging 4.7% per year over five years. Phasing in the proposed changes to the rate structure and rates will moderate the impact on customers, and allow LADWP to achieve its rate objectives (affordability; business development; encourage conservation and sustainable customer resources; meet legal requirements; assist in the transformation to a distribution oriented utility; assure financial stability; and utilize marginal cost of service in the rate design), while allowing LADWP to continue to provide electric service to the citizens of Los Angeles at affordable and competitive prices.
13 A service rider works in conjunction with a customer’s otherwise applicable rate.
46