Embed Size (px)
Citation preview
PowerPoint ManualRobin A. Stewart
The Basics of a Good Presentation

Keeping it Brief
• 1 slide/minute– This is the maximum number of slides you should
present
• Bullets are for statements– A bullet point should be brief, try to be succinct and
summarise what you are saying– Don’t use your presentation as a teleprompter
• Highlight your Data – Summarise data and identify clearly what is being
discussed– Don’t present more data than you can describe
• Subtle Animations– Use simple fades and wipes, other animations can be
distracting

Slide Masters and Guides
Viewing the Slide Master
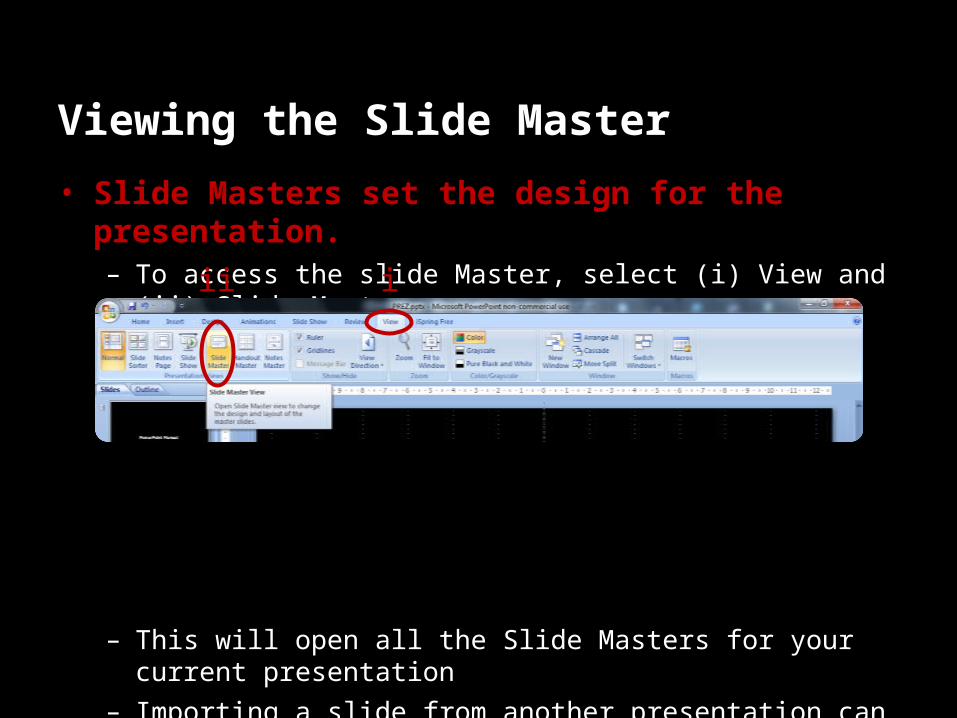
• Slide Masters set the design for the presentation.– To access the slide Master, select (i) View and (ii) Slide
Master
– This will open all the Slide Masters for your current presentation
– Importing a slide from another presentation can result in you importing that presentation’s Slide Master
• Try to limit your presentation to as few Masters as you can, as these can often be difficult to manage
iii

Editing the Slide Master
• The Slide Masters are divided into sets– The Lead Slide defines
the design of the set– The Template Slides
(indented from the Lead) define the custom layouts
– Deleting the Lead Slide will delete the entire set
• You can copy and paste Masters between presentations
i

Slide Masters – Overview
• Edit the Lead Slide to modify all your slides– Including background graphic, font colour and size– Changes are translated into the following Template
Slides– Modifying a Template Slide individually will not affect the
master
• Edit the Slide Templates to define different layouts– Once a layout has been defined, it can be selected in
your presentation. Simply right click your mouse to the side of the slide and select ‘Layout’
Slide Masters – Useful Notes
• Predefined Master – Often, an event will have a predefined Slide Master. You
should implement the Master as soon as possible to avoid difficulties later
• Importing Masters– When pasting a slide from another deck if you ‘Keep
source formatting’ you will retain that slide’s Master, if you ‘Use destination theme’ you will use the new presentation’s Master
• Updating slides– When changing a Master, be aware that you will need to
review your presentation thoroughly as a Master can change many facets of your presentation

Slide Masters – Useful Notes
• Reset slide– When you change a Master, specific slide modifications
might not be recognised. Right click to the side of your slide and select ‘Reset Slide’. If this doesn’t update the slide, you may need to tidy it up manually.
– Be aware that the reset will remove formatting such as superscript, bold, or italic
• Masking a template– Often, people will not know how to change a master, and
will resort to pasting an image as a background on the slide. If a slide doesn’t change when you change the master, this might be the reason why

Slide Masters – Useful Notes
• Template Use– When in the Slide Master view, if you place your mouse
over a template, you can see which slide the template has been used on.
• 2007/2003– Be aware that Slide Masters are handled differently in
earlier versions of the software, and may not transfer exactly
• Specific Objects– Only objects that are defined in a template are effected
by changes to the template, in so much as additional pictures or text boxes added to the slide will not be changed

Viewing Guides
• Right click to the side of your slides and select ‘Grids and Guides’– Tick the check box ‘Display drawing guides on screen’
– Guides can be used to align text elements and images to make your slide tidy, as these objects ‘snap’ to the guides

Setting-up Guides
• By pressing Ctrl and moving a guide-line you can create a new guide-line– By creating a series of guide-lines, you can define the
active working area
• Make note of the location of your guides– When you click a guideline it will show a number which
reflects is location from the centre of the slide in either the vertical or horizontal plane
• Your guides are also visible in the Slide Master view if you need them
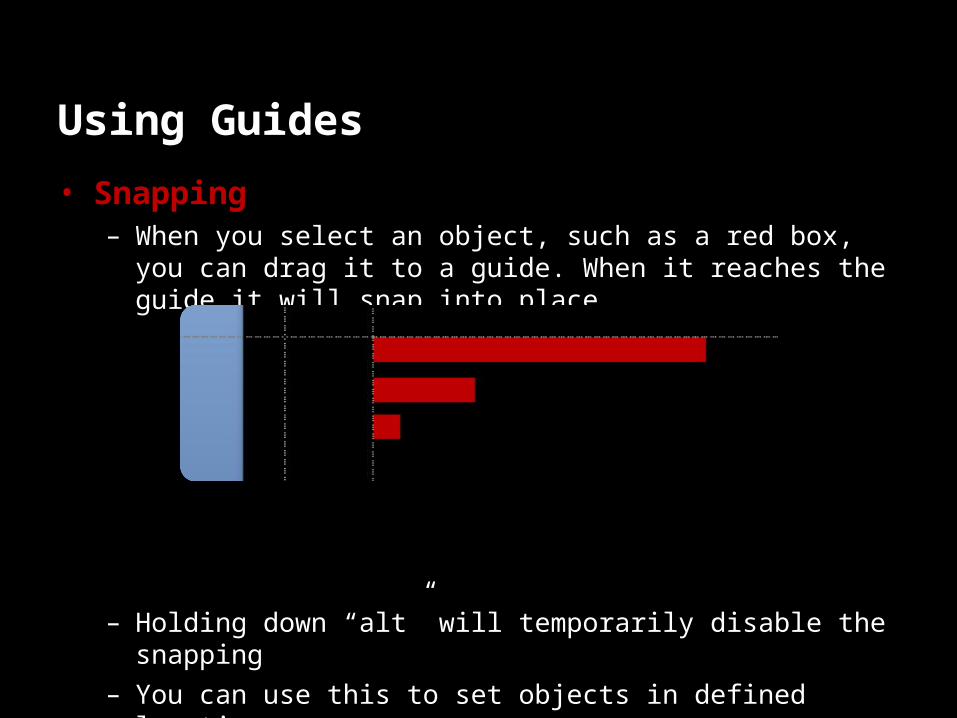
Using Guides
• Snapping– When you select an object, such as a red box, you can
drag it to a guide. When it reaches the guide it will snap into place
– Holding down “alt” will temporarily disable the snapping – You can use this to set objects in defined locations – This is particularly useful for removing ‘chatter’ between
slides, where objects jump slightly on subsequent slides

Guides – Useful Notes
• Small changes– To move a guide by small increments, you may need to
zoom in.
• Only when required– Only switch the guides on when you need them,
otherwise you may find that they hinder your ability to move objects around, or to draw straight lines
• Location information– If you move a guide, you cannot undo the move by
clicking ctrl+z, so make note of the location data
Modifying Slides

Moving Things
• Simple movements– Holding shift will allow you to move an object in a
straight line with your mouse– Holding ctrl and moving with your cursor allows you to
move only 1 pixel at a time (for fine tuning)
• Alignment tools– Elements that have been grouped will not align
individually– Select the objects you wish to align, then select (i)
‘Format’ from the ribbon menu, and select (ii) ‘Align’i ii

Moving things
• Distribute evenly– Select (i) Format from the
ribbon menu, then (ii) Align, and then choose either (iii) Distribute horizontally, or Distribute Vertically
– This is especially useful for drawing graphs and charts
• Grouping objects– To group objects together,
select all of them, right click on one, and choose Group.
iii
iii

Objects
• Resizing objects– An object can be resized by right clicking it and selecting
size and position – Tick aspect ratio to keep height and width size changes
linear
• Object fill– Where possible, avoid using gradient or textured fill
• Selection Pane– You can use the (i) ‘Selection Pane’ to select
objects within the slide. Select Home in the ribbon menu, and ‘Arrange’
i

Drawing Lines
• Horizontal and vertical– To make a line horizontal, select it, right click and open
the ‘Size and Position’ menu. Change the height setting to “0” and the line will appear flat
– Be aware that the line may ‘Snap’ to other objects. To switch this off open the ‘Grids and Guides’ menu and switch off ‘Snap’

Drawing Lines
• Non-uniform lines– If you want to draw a
bespoke line (e.g. a graph) then use the (i) ‘Freeform’ tool in the shapes menu
– Right click a ‘Freeform’ line to (ii) edit the points• To create curves (iii)
• Delete points
• Make new points
i
ii
iii

Drawing Tables
• Use preset tables– Where possible, use the
preset table from the ‘Insert’ menu in the ribbon
– Never use tabs to move text into lines, as this is very difficult to modifye.g.Column 1 Column2 Column 3
Text 1 Text 2 Text 3
Column 1 Column 2
Change the colour of a cell in the ‘Design’ section of the Ribbon Menu
You can merge cells in the ‘Layout’ section of the ribbon menuLeft align columns unless the only contain numbers e.g.
123
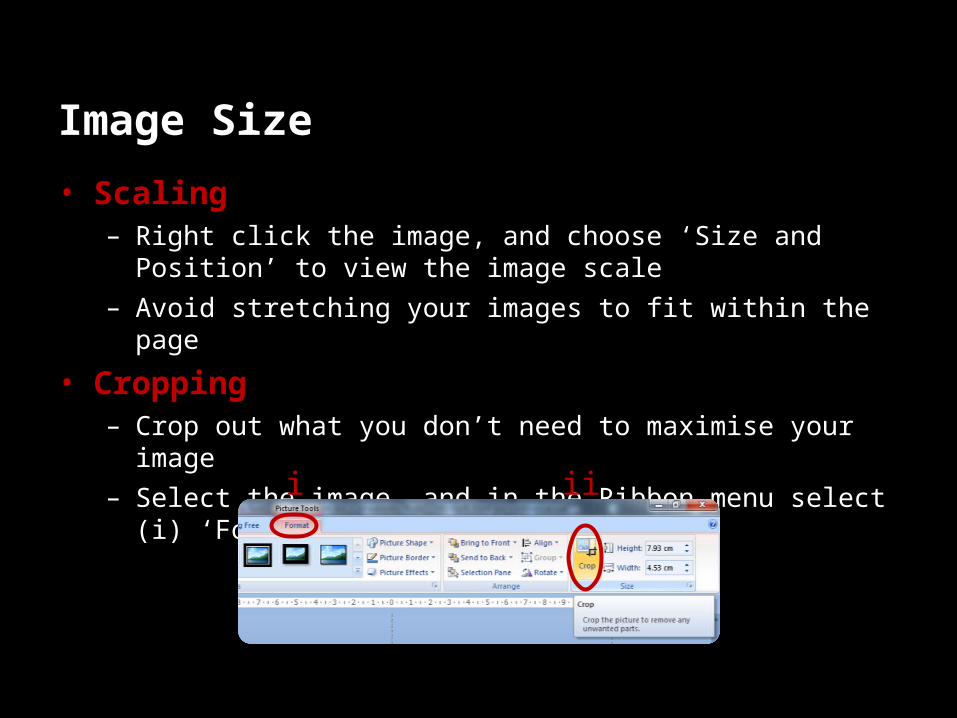
Image Size
• Scaling– Right click the image, and choose ‘Size and Position’ to
view the image scale– Avoid stretching your images to fit within the page
• Cropping– Crop out what you don’t need to maximise your image– Select the image, and in the Ribbon menu select (i)
‘Format’ and (ii) Crop i ii
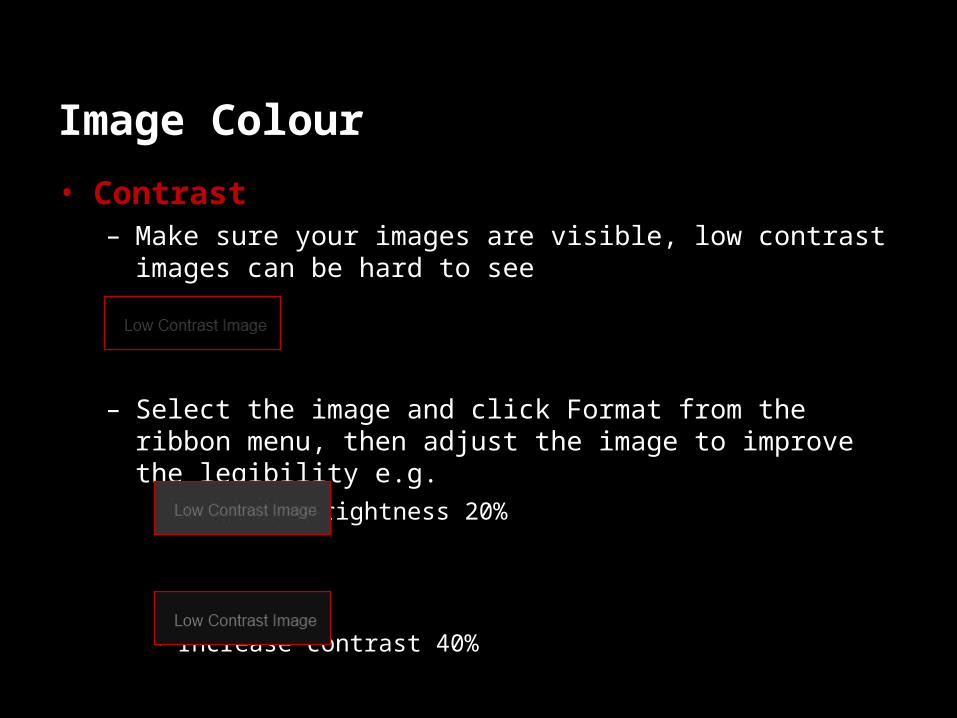
Image Colour
• Contrast– Make sure your images are visible, low contrast images
can be hard to see
– Select the image and click Format from the ribbon menu, then adjust the image to improve the legibility e.g.• Increase brightness 20%
• Increase contrast 40%

Image Colour
• Making the background disappear– Select the image and click Format from the ribbon menu,
below the contrast option you will find the recolour option
– Use the Set Transparent Colour option to hide the background e.g.• Before
• After
• There are various other recolouring options

Image quality
• Resolution Matters– Avoid using low resolution images where possible– To find a higher resolution version of your image try using
TinEye: http://www.tineye.com/– Be aware, very high resolution images will slow down your
computer. If your presentation is running too slowly select the image, click (i) ‘Format’ in the ribbon menu, and (ii) ‘Compress Pictures’.
– Choose ‘Options’ to fine tune the compression
iii
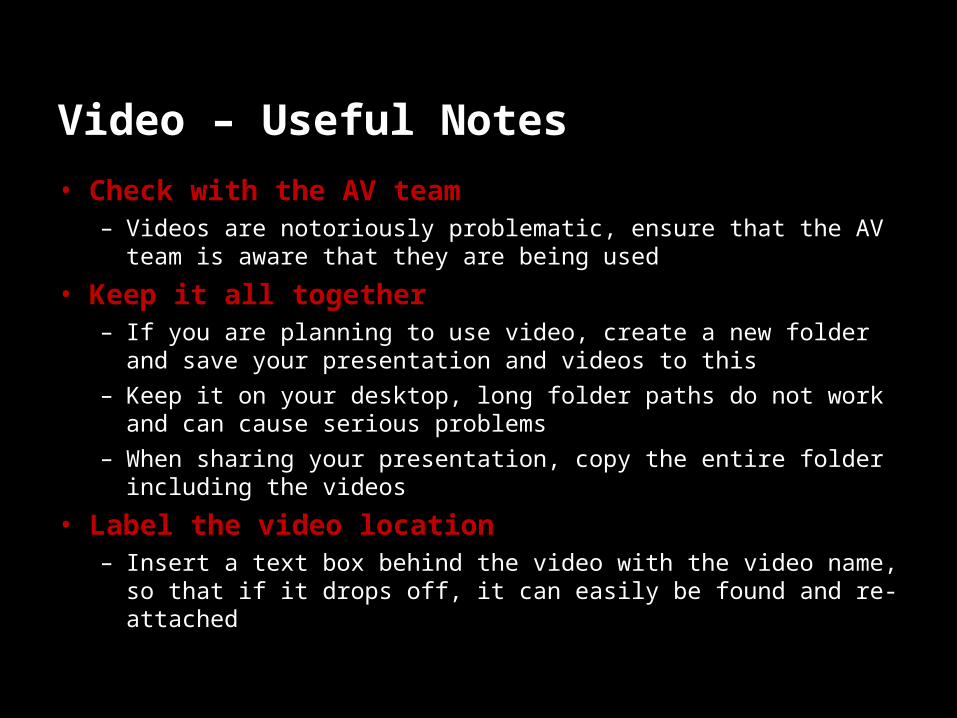
Video – Useful Notes
• Check with the AV team– Videos are notoriously problematic, ensure that the AV team
is aware that they are being used
• Keep it all together– If you are planning to use video, create a new folder and
save your presentation and videos to this– Keep it on your desktop, long folder paths do not work and
can cause serious problems– When sharing your presentation, copy the entire folder
including the videos
• Label the video location– Insert a text box behind the video with the video name, so
that if it drops off, it can easily be found and re-attached

Animations – Overview
• Keep animations simple– Simple animations are better:
• Fades
• ..............Wipes.................
• Only when required– Only use animations when you want to make a point– Such as hiding something that you don’t want to give
away
• Keep them quick– When up on stage, you don’t want to be waiting very
long for something to appear. Keep your animations ‘Fast’ or ‘Very Fast’

• Timing the action– Select (i) ‘Start after
previous’ to have objects enter one after another
– Use (ii) ‘Effect Options’ to make minor changes
– (iii) ‘Show advanced timeline’, can give you much greater control
• Grouping– If you group or ungroup
objects, all animation associated with these items will be lost
Animating Objects
i
iiiii

Animation Templates

Scrolling Text
• This is a simple animation that is designed to look like a news ticker– 3 text blocks are timed to move left to right
• Block 1 moves to left and does not reappear
• Block 2 and 3 repeat to the end of the slide
• Suggest repeating text in Block 1 and 3 to mimic a constant loop
– The text should not exceed the length of the text box– Add a background and logo to finish the effect
Text Text Text Text Text Text Text Text Text Text Text Text Text Text Text Text Text Text Text Text Text Launch text.... This will only show once.... Suggest matching to red text to imitate a loop........... Text Text Text Text Text Text Text Text Text Text Text Text Text Text Text Text Text Text Text Text Text LOGO
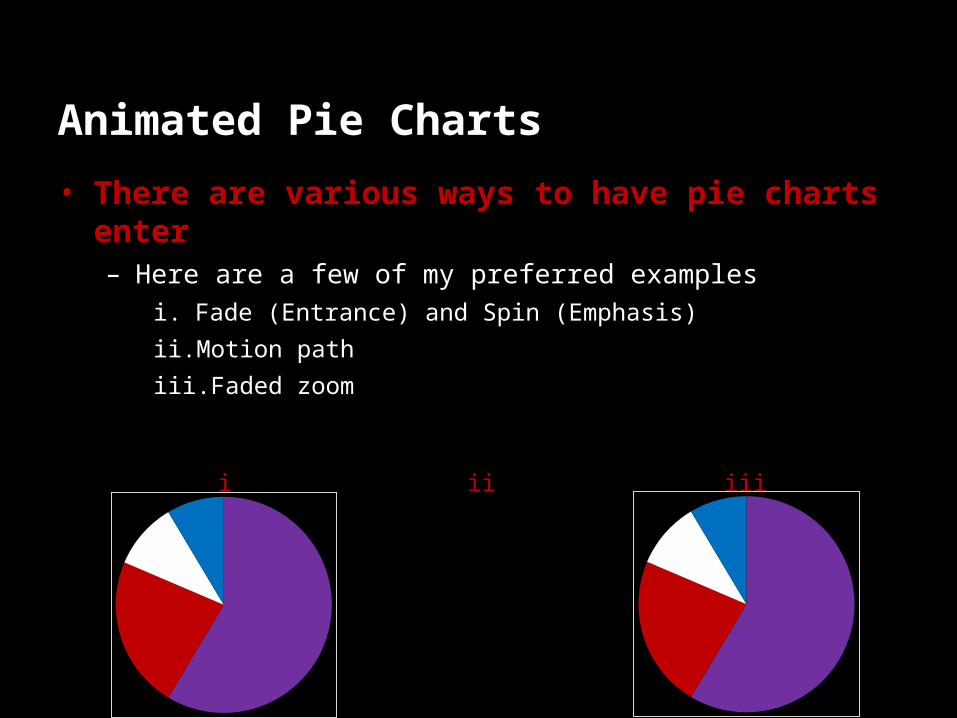
Animated Pie Charts
• There are various ways to have pie charts enter– Here are a few of my preferred examples
i. Fade (Entrance) and Spin (Emphasis)
ii. Motion path
iii. Faded zoom
i ii iii

Animated Graphs• Series wipe
Category 1 Category 2 Category 3 Category 40
1
2
3
4
5
6
• Category wipe
Category 1 Category 2 Category 3 Category 40
1
2
3
4
5
6

Animated Diagrams

Animated Diagrams
TEXT TEXT TEXT TEXT TEXT TEXT TEXT TEXT TEXT TEXT TEXT TEXT TEXT TEXT TEXT TEXT TEXT TEXT TEXT TEXT TEXT TEXT TEXT TEXT TEXT TEXT TEXT TEXT TEXT TEXT TEXT TEXT TEXT TEXT TEXT
TEXT TEXT TEXT TEXT TEXT TEXT TEXT TEXT TEXT TEXT TEXT TEXT TEXT TEXT TEXT TEXT TEXT TEXT TEXT TEXT TEXT TEXT TEXT TEXT TEXT TEXT TEXT TEXT TEXT TEXT TEXT TEXT TEXT TEXT TEXT
TEXT TEXT TEXT TEXT TEXT TEXT TEXT TEXT TEXT TEXT TEXT TEXT TEXT TEXT TEXT TEXT TEXT TEXT TEXT TEXT TEXT TEXT TEXT TEXT TEXT TEXT TEXT TEXT TEXT TEXT TEXT TEXT TEXT TEXT TEXT
TEXT TEXT TEXT TEXT TEXT TEXT TEXT TEXT TEXT TEXT TEXT TEXT TEXT TEXT TEXT TEXT TEXT TEXT TEXT TEXT TEXT TEXT TEXT TEXT TEXT TEXT TEXT TEXT TEXT TEXT TEXT TEXT TEXT TEXT TEXT
Animated Diagrams

Charts Templates
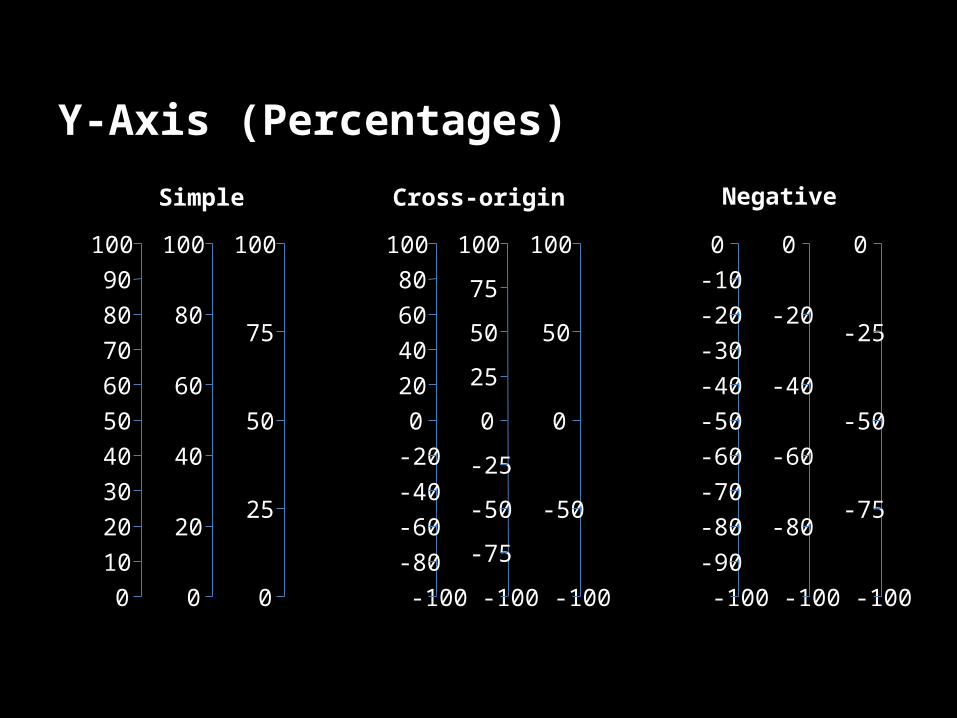
Y-Axis (Percentages)
908070605040302010
0
100
75
50
25
0
100
80
60
40
20
0
10080604020
0-20-40-60-80
-100
100
Simple Cross-origin
75
50
25
0
-25
-50
-75
-100
100
50
0
-50
-100
100-10-20-30-40-50-60-70-80-90
-100
0
-25
-50
-75
-100
0
-20
-40
-60
-80
-100
0
Negative

Y-Axis (Single Bars)
1
2
3
4
5
6
7
8
9
10
1
2
3
4
5
6
7
8
9
1
2
3
4
5
6
7
8
1
2
3
4
5
6
7
1
2
3
4
5
6
1
2
3
4
5
1
2
3
4
1
2
3
1
2

X-Axis (scales)
0 10 20 30 40 50 60 70 80 90 100
0 20 40 60 80 100
NovJan Feb Mar Apr May Jun Jul Aug Sep Oct Dec
NovJan
Feb
Mar
Apr
May
Jun
Jul
Aug
Sep
Oct
Dec
Nov
Jan Feb
Mar Apr
May Jun Jul
AugSe
pOct Dec
Q3Q1 Q2 Q3 Q4 Q1 Q2 Q3 Q4 Q1 Q2 Q4
2008 2009 2010
0 1 2 3 4 5 6 7 8 9 20131211 1614 15 17 191810
0 1 2 3 4 5 6 7 8 9 20131211 1614 15 17 191810

X-Axis (Single Columns)
1 2 3 4
1 2 3
1 2
1 2 3 4 5 6 7 8 9 10
1 2 3 4 5
1 2 3 4 5 6 7 8
1 2 3 4 5 6 7 8 9
1 2 3 4 5 6
1 2 3 4 5 6 7
1 2 3 4 5 6 7 8 9 10
1 2 3 4 5 6 7 8 9
1 2 3 4 5 6 7 8
1 2 3 4 5 6 7
1 2 3 4 5 6
1 2 3 4 5
1 2 3 4
1 2 3
1 2

X-Axis (Single Columns)
1 2 3 4 5 6 7 8
1 2 3 4 5 6 7 8 9
1 2 3 4 5 6 7 8 9 10
1 2 3 4 5 6 7
1 2 3 4 5 6
1 2 3 4 5
1 2 3 4
1 2 3
1 2 1 2 3 4 5 6 7 8 9 10
1 2 3 4 5 6 7 8 9
1 2 3 4 5 6 7 8
1 2 3 4 5 6 7
1 2 3 4 5 6
1 2 3 4 5
1 2 3 4
1 2 3
1 2