Embed Size (px)
Citation preview

Energy Vol. 13, No. 10, pp. 767-786, 1988 Printed in Great Britain. All rights reserved
0360-5442/88 $3.00 + 0.00 Copyright @ 1988 Pergamon Press plc
POWER-PLANT LIFE EXTENSION
STEW THOMAS
Energy Programme, Science Policy Research Unit, University of Sussex, Mantell Building, Falmer, Brighton, East Sussex, BNl 9RF, U.K.
(Received 1 March 1988)
Abstract-In this paper we examine the rationale for increased interest in extending the life of a power-plant well beyond its design lifetime. In particular, we examine the technical, economic and regulatory factors that have radically altered the attractiveness of retaining old plant compared to building new plant. The experience of refurbishment in
the U.S.A. and U.K. is reviewed and the major markets for the 1990s are identified. It is
concluded that for utilities, refurbishment represents a useful increase in the range of generating options open to them. The impact on the heavy electrical industry is likely to be less favourable, leading to a need for reductions in capacity and a continuation of the trend towards mergers and international collaborations that has been a feature of the past 20 yr.
1. INTRODUCTION
For most of its 1OOyr existence, the electricity supply industry worldwide has been characterized by consistent technological progress, rapid demand growth (typically doubling every 10 yr) and falling real costs. By almost every criterion, a continuation of such trends is unsustainable and the past two decades have seen the breakdown of these features. In addition, there are strong emerging pressures, particularly in the U.S.A. and Europe, to change existing structures to reduce the monopoly aspects of electricity generation and supply, to lower entry barriers for electricity generation and to reduce government involvement. This combination of factors has led to a multi-facetted, sometimes painful process of adjustment for the industry.
One aspect of this has been a reevaluation of the expected lifetime of steam electric generating plant with a view to substantially extending it, from previous expectations of perhaps 25-30 yr to double that or more. Under earlier conditions, the volume of plant reaching retirement age was inevitably small relative to total demand and its technical and economic performance so inferior to modern plant that such plant warranted little management attention.
In some respects, there is nothing new about power-plant life-extension. Plant has frequently been kept in service for far longer than its design life if retirement would have jeopardized the utility’s ability to meet peak load. Brechling and Surrey’ found that the average age on retirement of plant in England and Wales in the early 1960s was 53 yr. The theory of when it was economically optimal to scrap plant has also long been well understood. For example, Brown and Edwards2 published an article in 1961 detailing most of the major theoretical considerations. What has changed radically, however, is the relative balance between the economics of old plant vs new plant, and the volume of plant reaching the end of its design life.
We examine the scope for lifetime extension, the techniques used and its significance in utility strategies. In greater detail, the paper is divided into six main parts. In Sets. 2 and 3, the determinants of refurbishment and the factors that have brought about the increased importance of plant lifetime extension studies are explained. In Sec. 4, the determinants of plant lifetime and its relationship with design lifetime are discussed. Section 5 deals with economics and timing and plant lifetime extension. In Sec. 6, we review the experience to date and then identify in Sec. 7 the major future markets for plant life extension. In Sec. 8, the impact of these developments on the heavy electrical industry is examined.
We do not cover life-extension of hydro-electric or nuclear plants, although both are potentially important. For the former, because the running cost is almost zero, plant has always been expected to have a very long lifetime and has been built and maintained with this goal in
767

768 STEVE THOMAS
mind.3 Nuclear plant has usually been designed to have a 30-40 yr operating lifetime and, since little capacity was installed before 1975 life-extension is not yet a major issue. However, the low marginal generating cost of nuclear plant gives a strong incentive to maintain plant in service for as long as possible and many of the techniques and maintenance philosophies developed for conventional steam plant will be applicable to nuclear plant, although, as discussed below, the existence of life-limiting components in nuclear plant makes the arguments somewhat different.4,5
2. THE DECISION TO EXTEND POWER-PLANT LIFE
The possibility of extending the lifetime of power-plant arises because, in principle, every component of the station can be replaced. If the economic incentives are sufficiently high, almost any plant can be refurbished to its original standard or better. This fact is in contrast to equipment which has a life-limiting component. For example, for a pressurized water reactor, the pressure vessel is regarded as life-limiting, i.e., once the pressure vessel can no longer be guaranteed to be safe, the plant must be closed down since it is not considered to be feasible to replace this vessel.
In addition, the common assumption that old plant will become unreliable is also not necessarily valid. If, as in the past, power plant is used progressively less as newer, more efficient plants are used in preference, the expenditure that can be justified on maintenance will progressively diminish and, near the end of its life, plant is likely to become run down and expensive to return to good condition. However, if utilization remains high, maintenance should be sufficiently thorough to ensure that no significant deterioration takes place.
Since most power plants are unique in terms of their design (they comprise standard components, but the detailed layout and the “mix” of components are usually particular to a given station) and operating and maintenance history and because utilities’ situations with respect to factors such as plant supply/demand balances are so variable, it is difficult to generalize about life-extension. At one extreme, lifetime extension may require no more than enhancing maintenance schedules and monitoring of plant condition whilst, at the other extreme, it may entail replacement of major components such as the turbine generator and the boiler or even addition of a gas turbine to a steam plant to convert it to a combined cycle unit.
However, it is possible to identify a number of conditions which must be met if plant refurbishment is to be economically and technologically viable. These include the following: (i) can the plant be kept in a serviceable condition at a reasonable cost? This will be specific to the particular plant. Most components are replaceable, in principle, but if a large number require replacement or a major structural defect is found, repair may be uneconomic relative to replacement. (ii) Will the plant be required to meet demand in the following few years? Regardless of the physical condition of the plant, if the plant is expensive to operate, e.g., because it uses an expensive fuel, and there is little prospect that it will be required in the next few years, the costs of maintaining the plant in an operable condition may not be justified. (iii) Is the plant economic to operate by comparison with a possible new replacement plant? A new replacement plant is likely to have lower running costs than much existing plant which will mean that it will not only produce the power the old plant .would have done but will also displace some of the power that would have been produced by stations with lower costs than the retired station. If these savings accrued over the whole system are greater than the capital charges associated with a new plant, replacing the old plant, regardless of its physical condition, will be economically justified. (iv) Is the plant environmentally acceptable? If, for example, the emissions from the plant no longer meet the current standards, it may be more economic to replace the plant rather than modify it such that it meets the standards. This point mainly refers to emissions of acid gases (SOX and NOX), but may also include more conventional equipment such as electrostatic precipitators.
In some cases, refurbishment may simply retain plant at, or return it to, its design performance. However, if the refurbished plant can expect high utilization, more ambitious objectives can be adopted, including the following: (i) replacing existing parts (whether worn

Power-plant life extension 769
out or not) with new parts with better performance, perhaps leading to the plant operating above its design specification. (ii) Changing the fuel type, usually from an expensive fuel to a cheaper fuel, or changing from single fuel firing to multi-fuel firing increasing the utility’s flexibility in the face of changing fuel prices. (iii) Enhancing the instrumentation and control systems to improve the plants responsiveness to variable loads. (iv) Adding gas turbine units to convert the plant from single-cycle to combined cycle operation. This might improve the thermal efficiency by up to 10 percentage points,
Changing fuel type is a highly variable operation and, correspondingly, the amount of refurbishment that can be carried on in parallel is also variable. If the conversion is to coal-firing for a plant not designed to burn coal, this will usually require that the boiler be replaced, which is an operation which takes years rather than months and will give scope for considerable concurrent upgrading. However, if the existing boiler is used, the conversion may require little more than burner replacement, and the scope for upgrading correspondingly smaller, unless the shutdown is extended, which as is argued later, substantially raises the overall system costs. A very simple form of fuel-switching involves changing the source of fuel and this is particularly likely to be important for switches from indigenous coal to (cheaper) imported coal. Some adjustments may be required to take account of differences in coal quality, e.g., ash and sulphur content.
3. THE IMPORTANCE OF PLANT LIFETIME EXTENSION
Four main factors have brought about the increased importance of plant lifetime extension, viz. reduction in the rate of technical progress in electricity generation, a severe reduction and considerable uncertainty in the rate of electricity demand growth, an end to the long-term steady fall in the real cost of electricity, and the difficulty of obtaining new sites for power plant and uncertainty about their costs.
3.1. Technical progress
For steam fossil-fuel fired electric generating plant, there have been two important sources of technical progress, increased unit size and higher steam conditions. Larger grid sizes and improved fabrication methods have allowed the size of single electric generating units to rise from a maximum of about 100 MW after World War II to an average of about 600 MW and a maximum of about 1300 MW from 1970 onwards. This has allowed substantial economies in labour, capital and fuel. Since 1970 there has been little increase in unit size, partly because of intrinsic difficulties in fabricating items for larger units which would operate reliably and partly because of system reliability considerations. In order for an electricity supply system to be robust against plant breakdowns, plant has to be available in “hot” readiness to cover for the breakdown of the largest unit on the system. In this respect, larger units bring about diseconomies of scale which ultimately may more than counterbalance the economies of scale. From a system stability viewpoint it is thought desirable that no single unit should represent more than 10% of total installed capacity, although for systems with relatively weak interconnections, this percentage may be lower.
In parallel with these increases in unit sizes, steam pressures and temperatures have been raised leading to substantial improvements in thermal efficiencies and hence a reduction in fuel costs. These increases in steam conditions have been made possible by improved materials and fabrication methods. However, by the late 1950s the technology faced a major step, the increase in steam conditions from sub-critical to super-critical steam (super-critical steam is steam held at such a high pressure that the latent heat of vaporization is zero giving a significant improvement in thermal efficiency) and, with diminishing returns setting in for higher steam conditions, improvements in thermal efficiency were becoming increasingly small as the theoretical maximum of the thermal cycle was approached. The first experimental super-critical sets proved unreliable and expensive and these extra costs, in many cases, outweighed the gains in thermal efficiency, leading to many utilities abandoning, or at least postponing, the step towards super-critical units. In some countries such as Japan, the U.S.A.

110 STEVE THOMAS
and F.R.G., most units ordered now are super-critical whereas in others such as France, U.K. and Italy, the transition has still not been made.
3.2. Demand growth
There was considerable variability in the time at which electricity demand began to grow rapidly. Those countries with indigenous resources (e.g., hydro or coal) and a strong industrial base were the first to experience strong growth. However, by about 1950, electricity demands of almost all industrialized economies were growing, apparently exponentially with a doubling time of 10yr or less. For the countries which were the first to experience rapid electricity penetration, this rate of growth persisted for more than 50 yr and appeared a sound basis for future planning. However, by the mid-1960s there were signs, all too often ignored by electric utilities, that the growth rates were falling and this trend has since been confirmed. In the past 2-3 yr growth has accelerated and many utilities now expect future demand growth rates to be much higher than those experienced following the recession of 1979-1981. Even allowing for this, demand growth rates are not likely to exceed 3% on a long-term basis.
The three main reasons for this are the following: (i) saturation. Particularly for household use, many of the items which use most electricity such as televisions, fridges, and lighting are at saturation point and the electricity demand effects of any increased ownership of other appliances is being more than counterbalanced by improved efficiency of new vintages of equipment. (ii) Industrial restructuring. Growth in demand for many of the most electric intensive materials, such as steel and aluminium has declined, again often for reasons of saturation. Economic growth is increasingly concentrated in sectors of the economy such as services which have a much lower electric intensity (electric intensity is the amount of electricity required to produce a unit of added value to a product or service). (iii) Conservation. The first oil crisis drew attention to the large and increasing scope for cost-effective electricity conservation. All types of consumer found that they were able to make investments in the electricity using capital stocks which were rapidly repaid by electricity cost-savings. At first, this was seen as a “one-off” effect but developments in materials and micro-electronics are opening up continuing savings.
In addition to being lower, demand growth rates have also become less certain with recessions and recoveries causing large swings in short-term growth rates which may obscure long-term trends.
3.3. The real cost of electricity
The technical progress already referred to and the economies resulting from the construction of regional or national grids led to consistent reductions in the cost of electricity. In addition, electric utilities were able to reduce their fuel bill, sometimes by switching to cheaper fuels and sometimes by reductions in the cost of producing the fuel. The falling off in returns to further technical progress, increases in the real cost of power station construction and the rise in fossil fuel prices following the first oil crisis have meant that, barring a major technological breakthrough and notwithstanding the expectation of a continuing low oil price, the real cost of electricity is unlikely to fall substantially in the long term. This reinforces the trend to low electricity demand growth already referred to.
As with demand growth, the adverse trends in the direction of costs have been accompanied by increased uncertainty. Over the past 20 yr, in many countries, construction costs and times have become less predictable with a substantial number of units over-running in time and costs by a factor of 2 or more, and, in the case of nuclear power, the subsequent operating performance has varied widely. By contrast, the costs of refurbishment and the subsequent performance are much more predictable and will reduce the economic risk to the utility.
3.4. The difficulty of obtaining sites
Over the past two decades the difficulties of obtaining sites for new power plant have increased substantially for a combination of technical and political reasons. Larger power stations have more stringent requirements for aspects such as cooling water, fuel delivery, and geology of the subsoil, restricting the number of potential sites. This has meant that power

Power-plant life extension
Table 1. Hypothetical growth pattern for the electricity system.
Annual Plant reaching the end of design life, GW*
771
Year
1950 1960 1970 1980 1990 1995 2000
10.0 19.7 38.7 47.2 52.1 54.8 57.6
0.7 0.1 1.3 0.2 0.8 0.4 0.4 0.8 0.5 1.5 0.5 2.2 0.6 1.2
t The system size refers to the total amount of plant in the system. f The listed values are calculated as plant installed 30 years previously
to meet demand growth and to replace time-expired plant.
plant is now generally sited remote from population centres where visual intrusion, loss of tourist amenity and reduction in property values may bring about opposition. In addition, there is greater awareness of the wider environmental impact of power stations from emissions. These factors have aggravated resistance from local populations.
The overall impact of these four factors which have brought about the interest in refurbishment can best be illustrated by a simplified hypothetical example showing the plant requirements of a utility under varying demand growth conditions. We assume an electricity supply system with a total installed capacity of 10 GW in 1950. The utility experiences annual compound growth rates of 7% per annum for the 50yr from 1920 to 1970, 2% from 1970 to 1980 and 1% from 1980 onwards. We also assume that plant has a lifetime of 30yr (see Table 1).
In 1950, about 0.1 GW of plant (installed in 1920) would be due for retirement and 0.7 GW of plant would be required to meet growth. However, by 1980 with only 1% demand growth 0.4 GW of plant would be needed to meet growth and the 0.8 GW of plant installed in 1950 would be due for retirement. By 1995, the amount of plant due for retirement exceeds the amount required for growth by a factor of more than 4. After 2000, the plant becoming due for retirement reflects the lower growth rates experienced 30 yr previously and is much closer in quantity to that required to meet growth.
Whilst this hypothetical example reflects reasonably closely the historic pattern experienced by the CEGB (the utility serving England and Wales) such a picture, with some changes in the timing of the decline in demand growth applies to many other utilities in industralixed countries.
4. THE DETERMINANTS OF PLANT LIFETIME
At the time of planning and construction of a plant, the utility specifies to the designers the length of time that they require the plant to be operational-the design life. Large components which are difficult to replace or repair, so-called life-limiting components, are designed to survive this lifetime. Other smaller, more easily accessible, items may only require a shorter lifetime. Taking as an analogy a motor vehicle, the tyres are likely to be changed at least once over its lifetime, the gearbox and engine no more than once over the lifetime, whilst the body-structure is life-limiting. In practice, these definitions are not hard and fast and, retaining the car analogy, a failed gear-box may be the “final straw” for a car with low residual value whilst substantial body replacement may be economic if the car has a high enough value if returned to good condition.
For accounting purposes, the power station will also have an accounting lifetime which represents the period over which the capital costs of the station are recovered or amortized. However, these two measures, design and accounting lifetime, are of limited interest once the
772 STEVE THOMAS
plant is nearing the end of its lifetime and decisions need to be taken on what steps can be justified to maintain it in service. A plant is said to have reached the end of its economic lifetime when the costs of maintaining it in service exceed the benefits of its continued availability. As is noted later, this may be a self-fulfilling prophecy. If a new plant is ordered, over the 5-10 yr of its lead-time, the plant it is expected to replace will only be maintained sufficiently to ensure that it is available until the new station is commissioned. The design lifetime should give a reasonable clue to the economic lifetime but no plant is retired simply because it has reached a given age. The overall impact of the changes identified in the previous section has been to increase radically the value of old plant and thus increase the scope for cost-effective component repair and replacement.
In addition, the engineering calculations behind plant and a component lifetimes may prove inaccurate. This may be for a number of reasons. First, materials may be substandard or knowledge of materials behaviour may be limited at the time of design leading either to over- or under-specification of plant. Second, operating conditions may vary from those planned, e.g. the coal quality may vary from that expected. Third, operating and maintenance practice may fall short of requirements. However, of most importance, the operating regime may differ from that anticipated. For example the CEGB, in specifying the lifetime of many components as 100,000 h, equated this with a 30 yr life or an average lifetime load factor of 38%. This corresponded to a view that plant would be on “base load” at about 80% load factor for perhaps 10 yr and, after that, as modern new plant superceded it, would be used progressively less. In practice some plant with 20 yr service still remains on base load whilst other plant is no longer on base-load but is now operated in a “2-shift” mode, i.e., about 16 h/day, which may be even more wearing than continuous operation.
The wear imposed on the components of a power station is likely to be a function of the following: (i) the number of hours of actual operation; (ii) the number of “cold” starts--these impose thermal stresses; (iii) the number of hours of non-operation-components will still deteriorate even if not used. This function will differ between components and few, if any, such functions have been estimated. Thus, there are many good reasons for expecting actual physical lifetime in years to failure of a component to differ markedly from the design lifetime.
5. THE ECONOMICS AND TIMING OF LIFE-EXTENSION
In an ideal world of perfect knowledge and practice, plant lifetime extension should not be an issue. The cost-curve of keeping a plant in service should be known in advance, and innovation in plant design should produce more economic plant which will steadily reduce the required utilization of existing plant such that design lifetime and maintenance practice can be arranged so that at the time plant is no longer needed, the major components are effectively worn out. However, knowledge, maintenance practice and design skills are often far from perfect and, in current circumstances, utilities are increasingly facing the situation whereby a plant which, if in good condition or economically improved, would represent a major asset to the system, requires major repairs over and beyond standard maintenance.
In order to minimize the cost of supply, electricity supply systems operate in what is known as merit order such that, all things being equal, the utilization of plant is inversely related to its marginal generating cost. If a plant is removed from the system, all plant beneath it in the merit order not on base-load must be operated marginally more intensively to make up the electricity the removed unit would have supplied. The extra costs incurred by the increased use of more expensive plant are known as replacement power costs and, for example, for a base load nuclear power station may be of the order of $4 m/day and are usually by far the largest costs associated with a plant shutdown. This means that the main determinant of the scope and timing of the refurbishment work that it is economic to carry out on any plant is its position in the merit order with plant high in the merit order having the greatest incentive for work to be quickly carried out.
Clearly, if the alternative to doing the work is an unserviceable plant, then the repairs must
Power-plant life extension 773
be carried out as quickly as possible. If however the motive is performance improvement, the incentive to speed may be no less strong. For example, a 1000 MW coal-fired plant might burn
about 2.5 m tonnes of coal/yr. A 1 percentage point increase in thermal efficiency might reduce this by about 75,000 tonnes/yr or, at NO/tonne, $3 m. However, if the repairs take 1 yr and, on average, the replacement plant has a 5 percentage point lower thermal efficiency, using, as would be typical, a 10% discount rate, it would take more than 7 yr simply to recover the replacement power costs regardless of repair costs.
In fact, in most cases, since plant is typically taken out of serice every 2 yr during periods of relatively low demand for about 2 months for routine maintenance, any refurbishment that can be accomplished within the scheduled maintenance period will have zero net replacement power costs. For refurbishment that extends the maintenance period, the costs rise steeply especially if the plant is still out of service at annual peak demand time.
The picture of a merit order with plant slowly sinking down it as it ages applied well to large utilities. It is highly unlikely that refurbishment would radically affect a plant’s position in the merit order unless it involved a fuel change.
In addition, large utilities tend to standardize their plant to a certain extent and are likely to own several units of the same design. This results in a number of economies with respect to refurbishment. Spares’ holdings can be minimized, experience gained at one plant can be applied at other similar units and a part replaced at one plant can be repaired at leisure and re-used in a different unit. -However, for small utilities making up part of a large system such as many U.S. utilities, the
picture may be rather different. Such utilities often rely on neighbouring utilities for power in the event of plant breakdowns and may supply a substantial proportion of their demand from power “wheeled” from other utilities. In this situation, utilites can operate much larger plant than isolated utilities would be able to because it can use neighbouring utilities as a “spinning reserve”. For such utilities, the required utilization of plant could alter radically for a number of reasons, such as the following: (i) a disabling accident at a high merit order station; (ii) a substantial change in fuel availabilities or prices; (iii) the siting of a major electricity consumer within the catchment area; (iv) a substantial change in the price of “wheeled” power.
Smaller utilities may have little experience of the long-term management of large steam plant with the result that plant may deteriorate sufficiently to require major repairs. The costs of ordering plant for a small utility may be higher than for a large utility which routinely carries out this function and which is well-equipped to evaluate tenders and negotiate prices.
Thus, whilst for large utilities good maintenance practice should allow high merit order plant to avoid long refurbishment shutdowns, at least until major structural faults require attention, there is a much greater likelihood that small utilities will need to carry out fundamental plant refurbishment.
A different situation might apply if a change of ownership of the plant occurs. This might arise if a utility or an industrial producer no longer requires a plant. A new owner might be able to operate the plant economically if there is access to a cheaper fuel or if a new demand for electricity arises. Given that the plant has become surplus to the requirements of the original owner, it may be in poor condition if its recent utilization was low.
Whilst carrying out refurbishment seldom requires more than 2 yr, it must be seen in its long-term planning context. Since the total lead-time for new capacity including planning, ordering and construction is now about 10 yr, the broad decision on when a plant is expected to be retired must be taken at least 10 yr before retirement if replacement plant is to be available
in time. Also, particularly in the later part of its life, maintenance engineers must have a clear view of what the remaining lifetime and operating regime is expected of a plant if they are to maintain the plant in an appropriate condition. Clearly if a plant is only required for a few years, maintenance will be carried out on a very different basis to that which would apply to a plant with decades of service ahead of it. Thus given the increasing uncertainties about plant need, utilities may find it increasingly advantageous not to maintain plant on a narrowly cost-minimizing basis but to spend more money on plant in order to keep the option of life-time extension open.
EGY 13:10-D

114 STEVE THOMAS
6. THE EXPERIENCE OF REFURBISHMENT TO DATE
The U.S.A. and U.K. stand out as likely centres of market development. In 1956, 48% (95 GW) and 12% (24GW), respectively, of the world’s installed capacity of public supply steam electric generating plant was installed in these two countries. No other non-communist country exceeded 5% (10 GW) of installed capacity. These two countries are at opposite extremes in terms of utility structures, with the U.S.A. being served by several hundred utilities whilst the U.K. is dominated by the CEGB (supplying England and Wales). Three other utilities, the South of Scotland Electricity Board, the North of Scotland Hydro-Electric Board and Northern Ireland Electricity supply power in the U.K. but they are much smaller than the CEGB.
6.1. U.K.
As was noted earlier, the refurbishment of old plant for a large long-established utility will tend to be a less conspicuous process than for small utilities. It is likely to involve enhancement of maintenance and progressive replacement of systems rather than conspicuous plant rebuilding schemes taking a year or rnore.‘j The former model has applied to the U.K. where no plant at or near the end of its design life has yet been removed from service for a long period for refurbishment.
In order to understand the scope for refurbishment in the U.K., it is necessary to examine the procurement policy of the electricity supply authorities in the 1950s. Following World War II, set sizes were limited to either proven 30 or 60 MW designs with relatively low steam pressures and temperatures and hence thermal efficiences (see Table 2). The objective of this government-backed policy was to ensure that urgent capacity expansion was not hindered by having to solve problems with technologically advanced but unproven designs.
In 1950 this restriction was lifted and tranches of 100 and 120 MW units with much higher efficiencies were ordered, the first entering service in 1956. Such units often had a design life of 20 yr but the materials were specified conservatively and these units have long been expected to have a 30 yr life. A relatively small number of intermediate sized units of 200, 275 and 350 MW were ordered before the CEGB standardized on 500MW units supplied by four different vendors. Forty-seven units were ordered before the design was stretched to 660MW. The 500 and 600 MW units were specified to have a 30 yr lifetime. However, it has long been expected
Table 2. Main designs of turbine generators used by the CEGB?
set Size MW
Steam Pressure psi
30 600 60 900
100 1500 120+ 200+
1500
275+ 2350
500+ 2300
660+ 2300 2300
200* 3500 900+ n/a
Steam Temperature
OF
850 900
1050 1000/1000 1050/1000 1050/1050 1050/1050 1050/1050 1100/1050
n/a
First Order
n/a n/a
1950 1952 1955
1960 1966 1960 1988(?)
First Commissioning
1929 1950 1956 1958 1959 1962 1966 1974 1965 n/a
Thermal Efficiency
25.5 28.0 30.5 31.0 32.0
35.0 35.0
n/a
+ These sets use a steam re-heat cycle, which improves the thermal efficiency. The second figure in the steam temperature column represents the temperature to which the steam is reheated. *These sets use supercritical steam (using temperatures and pressures at
which water passes to steam without change of volume and with zero latent heat of vaporisation). This should allow higher thermal efficiency.

Power-plant life extension 775
that these units would be required to far exceed this lifetime and maintenance has been appropriately upgraded. The first of the 500 MW units entered service in 1966 and although consideration is now being given to extending their lifetime, none is likely to be retired this century.
Of these various tranches, the 30 and 60MW sets have not been considered worth life-extending in any systematic way and although some which have proved trouble-free or occupy a significant geographical position with respect to system security have been maintained in service beyond 30 yr, very few now remain in service. It is possible that some recently retired sets may be sold to new owners who anticipate that they can operate these units economically by using a cheaper fuel than the CEGB was using.
By contrast, of the 100/120 MW units, by and large, only those burning oil have been retired and some of those with good cheap coal supplies are still on base load. The value of such units is reflected in a recent decision to extend their expected life from 30 to 40 yr with the possibility of further extension to 45 yr.
6.2. U.S.A.
Much of the early publicity for refurbishment was generated in the U.S.A. with a number of utilities carrying out fundamental refurbishment including complete replacement of turbine generators or boilerssV9 and a common assumption amongst utilities now is that plant should be planned to be in service for up to 60yr. The general attractions of refurbishment to small utilities were noted earlier. In addition, there were a number of factors specific to the U.S.A. which also applied. These were mainly the result of the rising real cost of new plant and the operation of the regulatory system. In effect, it had become extremely uncertain how long it would take to build new plant, what the costs would be and whether the economic regulators would allow all the costs incurred to be recovered.
Whilst most U.S. generating plant, particularly the older plant, was of a “one-off’ design precluding the development of detailed replicable procedures, the refurbishment initiative has been substantially assisted by the existence of a powerful association of electric utilities, the Electric Power Research Institute (EPRI), which has carrried out much detailed research as well as collating and disseminating utilities’ experience throughout the electric supply industry.
As the importance of good maintenance is spread through utilities, the focus is shifting to the sort of phased replacement scheme favoured by the CEGB. In the U.S.A. this has the additional advantage of not opening the plant to requirements for retrofitting environmental control systems such as flue gas desulphurization that a more conspicuous scheme would.”
7. THE POTENTIAL MARKETS FOR LIFETIME EXTENSION
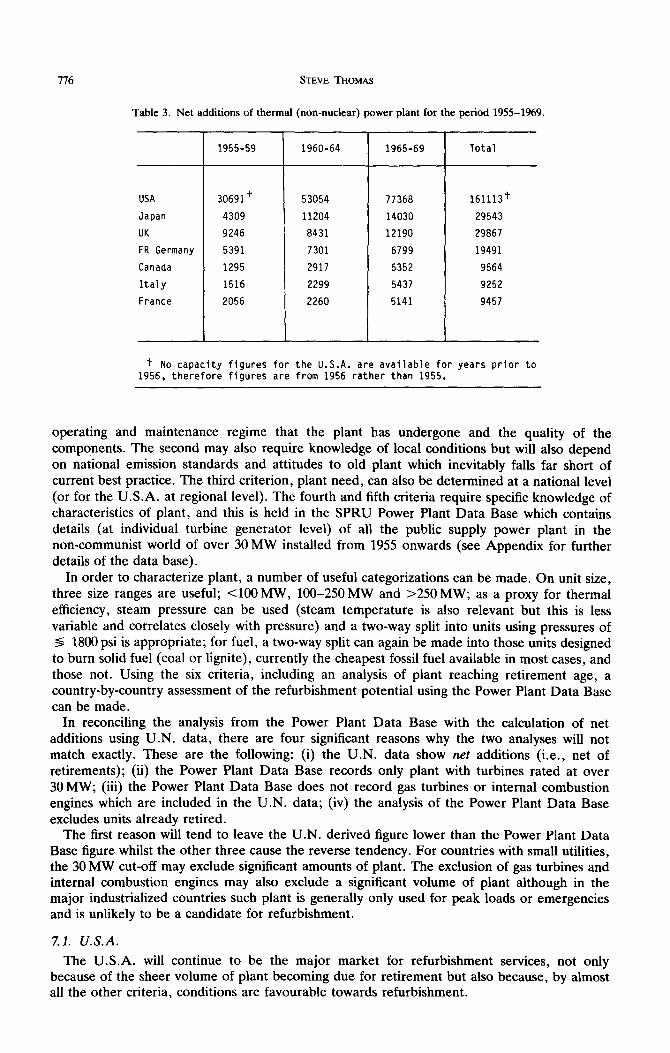
In the period 1956-1970, world installed capacity of public supply electricity generating equipment increased by a factor of 3.2 whereas in the next 14 yr, reflecting factors noted, earlier, the increase was only a factor of 2.2. The net increase in world capacity between 1956 and 1970 was 673 GW, representing 30% of total installed capacity in 1984. Of this 673 GW of total capacity, 40% is accounted for by net additions of thermal (non-nuclear) plant in just seven countries (see Table 3).
Clearly these seven countries are those which will need to develop strategies for evaluating plant that has reached the end of its design life. The U.N. data shown in Table 3 identify the potential size of the market (because they show net additions, i.e., net of retirements, they tend to underestimate the amount of plant installed). However they shed no light on whether the plant is appropriate for refurbishment. Five main criteria were set out previously for establishing this. Briefly, these were: (i) the physical condition of the plant; (ii) its environmental acceptability; (iii) the balance between supply capacity and demand; (iv) the technical characteristics of the plant, notably its thermal efficiency; (v) the cost of fuel used.
In addition, when considering individual countries, a sixth criterion, the prevailing climate towards building new plant must also be considered.
Of these six criteria, the first will be specific to the plant and it will depend mainly on the
716 STEVE THOMAS
Table 3. Net additions of thermal (non-nuclear) power plant for the period 1955-1969.
USA 30691+ 53054 77368 161113+
Japan 4309 11204 14030 29543
UK 9246 8431 12190 29867
FR Germany 5391 7301 6799 19491
Canada 1295 2917 5352 9564
Italy 1516 2299 5437 9252
France 2056 2260 5141 9457
1955-59 1960-64 1965-69 Total
+ No capacity figures for the U.S.A. are available for years prior to 1956, therefore figures are from 1956 rather than 1955.
operating and maintenance regime that the plant has undergone and the quality of the components. The second may also require knowledge of local conditions but will also depend on national emission standards and attitudes to old plant which inevitably falls far short of current best practice. The third criterion, plant need, can also be determined at a national level (or for the U.S.A. at regional level). The fourth and fifth criteria require specific knowledge of characteristics of plant, and this is held in the SPRU Power Plant Data Base which contains details (at individual turbine generator level) of all the public supply power plant in the non-communist world of over 30 MW installed from 1955 onwards (see Appendix for further details of the data base).
In order to characterize plant, a number of useful categorizations can be made. On unit size, three size ranges are useful; <lo0 MW, loo-250 MW and ~250 MW; as a proxy for thermal efficiency, steam pressure can be used (steam temperature is also relevant but this is less variable and correlates closely with pressure) and a two-way split into units using pressures of s 1800 psi is appropriate; for fuel, a two-way split can again be made into those units designed to burn solid fuel (coal or lignite), currently the cheapest fossil fuel available in most cases, and those not. Using the six criteria, including an analysis of plant reaching retirement age, a country-by-country assessment of the refurbishment potential using the Power Plant Data Base can be made.
In reconciling the analysis from the Power Plant Data Base with the calculation of net additions using U.N. data, there are four significant reasons why the two analyses will not match exactly. These are the following: (i) the U.N. data show net additions (i.e., net of retirements); (ii) the Power Plant Data Base records only plant with turbines rated at over 30MW; (iii) the Power Plant Data Base does not record gas turbines or internal combustion engines which are included in the U.N. data; (iv) the analysis of the Power Plant Data Base excludes units already retired.
The first reason will tend to leave the U.N. derived figure lower than the Power Plant Data Base figure whilst the other three cause the reverse tendency. For countries with small utilities, the 30 MW cut-off may exclude significant amounts of plant. The exclusion of gas turbines and internal combustion engines may also exclude a significant volume of plant although in the major industrialized countries such plant is generally only used for peak loads or emergencies and is unlikely to be a candidate for refurbishment.
7.1. U.S.A.
The U.S.A. will continue to be the major market for refurbishment services, not only because of the sheer volume of plant becoming due for retirement but also because, by almost all the other criteria, conditions are favourable towards refurbishment.

Power-plant life extension 777
The climate towards building new plant is uniquely bad and no major utility power station orders have been placed since 1981 and many previous orders have been cancelled. To place this in context, the U.S.A. has an installed capacity of 600 GW of public supply electricity generating plant and, if it is assumed that plant has a lifetime of 30yr, even if no demand growth occurs, of the order of 10 GW of plant a year must be ordered simply to replace old plant. The main factors lying behind this ordering famine are the following: (i) utilities grossly overordered plant in the 197Os, much of which has been cancelled or is only now entering service. (ii) The real cost of constructing plant of all types but particularly nuclear plant, has increased substantially as has the expected construction time. (iii) The economic regulators, the public utility commissions (PUCs), are being increasingly harsh on plant that does not meet the criteria of being “used and useful” and the costs of which were “prudently incurred”. Where plant has been overordered or where costs have overrun unjustifiably, PUCs are not allowing utilities to bring the full cost of plant into their rate base. United States economic regulation is based on utilities being allowed to make a given rate of return on their rate base. Plant not included in the rate base cannot make any return for the investors. (iv) Reflecting these previous factors, the financial markets perceive new plant investments as a serious risk and increase substantially the cost of borrowing of utilities raising money for new plant. (v) Against this background of high cost and risk of new plant, the scope for electricity conservation and utility purchases from cogenerators and private producers has proved considerable.
This combination of factors has meant that, despite the recent famine, there is little prospect in the next decade of a major boom in orders, although some new plant will have to be ordered. The major uncertainty is the future rate of commissioning of co-generating plant. If it continues at the current rate, as the plans for new facilities would indicate that it will, provided there is not a sustained surge in electricity demand growth, the volume of orders required for utilities may be very small. In this situation there will be a strong and increasing incentive to maintain as much existing capacity in service as possible even where doing so will require the fitting of pollution abatement equipment such as flue gas desulphurization (FGD).
This situation will, however, be uneven. Some utilities which own, or own a share of, the output of a new large unit justified on the grounds of an over-estimate of future demand may find that they can retire relatively modem efficient plant whilst other utilities which had to cancel plant may have little option but to keep expensive old plant in service. Whilst the increasing trade in electricity (“wheeling power”) will to some extent allow the cheapest available power to be used, in many cases, the plant supply-demand balance of the utility will determine whether refurbishment is appropriate rather than the economic and technical characteristics of the plant. An analysis of the Power Plant Data Base showing the size, firing and technical trends in U.S. generating equipment between 1955 to 1969 is given in Table 4.
71.3. 1955-1959. This period is difficult to reconcile with U.N. data as the earliest data for U.S. capacity is for year-end 1956 and therefore the net additions calculation excludes plant installed in 1955 and 1956. A crude calculation, however, can be made of capacity installed per year and this gives a result, consistent with the later period, that the Power Plant Data Base figure is about 85% of the U.N. derived figure. This suggests that small units, and gas turbines represented a significant proportion of plant additions. In terms of firing, about 60% is fired by solid fuels and the average size of these sets is somewhat higher than for the oil or gas fired units, although few sets over 25OMW were built. In terms of steam pressures, the units were very much more advanced than those being installed in most other countries at that time with over 90% of units using a steam pressure of over 1800 psi.
7.1.2. 1960-1964. For this period, the amount of plant installed and the relative proportions of coal to other fuel is about the same. The main differences are that nearly half the capacity installed is in units over 250MW using a steam pressure higher than 1800 psi and that the average size of the solid fuel units is about the same as for the oil and gas units.
7.1.3. 1965-1969. For this period, the amount of capacity installed is about 50% higher than either of the previous two periods, although the solid fuel to oil/gas proportions remained approximately the same. Over 80% of the capacity was installed in large (over 250 MW), high pressure ( > 1800 psi) units. Nevertheless, reflecting the small size of many U.S. utilities, small sets continued to be commissioned although, significantly, these generally used high steam conditions.

Time
Frame
1955-59
< 100 MU
loo-249
MU
> 250 MU
Total
1960-64
< 100 MU
iOO-249
MU
> 250 MU
Total
1965-69
< 100 MU
loo-249
MY
> 250 MU
Total
T T
able
4.
A
nal
ysis
of
tec
hn
ical
an
d f
irin
g ch
arac
teri
stic
s of
U.S
. el
ectr
ic
gen
erat
ing
pla
nt
for
1955
-196
9.
Solid
Fuel
: 18
00 psi
> 1800 psi
Total
< 1800 psi
> 1800 psi
Total
Total
1027 (17)
2396 (22)
3423 (39)
164
( 2)
17985
(104)
4403
( 15
)
1952
( 32)+
20593
(128)+
4403
( 15)+
3261
(
54)+
52
13
( 86
)+
1289
0 (
86)
1815
(
6)+
33
483
(214
)t
6218
(
21)t
22552
(121)
2694
8 (
1472
10734
12662
24868
175)+
1234
8 (7
5)
1796
6 (1
46)+
44
914
(321
)t
1230 (23)
838
( 7)
2068 (30)
9896
(
58)
1266
2 (
36)
27)+
65)
36)
390
( 5)
1487
( 24)+
2959
(
51)+
83
03
(45)
9368
( 55)
2010
2 (1
20)
8585
(2
6)
8585
( 26)
2124
7 (
62)
2255
8 (
94)
128)+
544
( 9)
768
( 6)
1312 (15)
150
( 2)
4958
( 28)
34988
( 74)
1124
5829
34988
40096
(104)
1984
(3
3)
3065
(2
7)
5049
(6
0)
881
(15)
10
65
(10)
1946
(2
5)
638
(11)
23
4 (
2)
872
(13)
1727
8 (7
6)
19440
(105)+
4430
8
17)+
35)+
231
( 3)
74)+
3812 (21)
18507
(41)
4194
1 ( 1
26)
+
22550
(65)
1284
(
21)+
41
95
( 24
)+
2408
10
024
1850
7 (
41)f
53
495
2398
6 (
86)+
65
927
(212
)+
T Other
Fossil Fuel
All
Fuels
+ These
totals include
a small
amount of plant
for which
the
steam
pressure is unknown.
233)
+
38)+
59
)+
115)
+

Power-plant life extension 779
7.2. Japan
Most public supply generating equipment in Japan is owned by nine investor-owned utilities which range from Tokyo Electric Power which currently owns 37GW of plant to Hokuriku Power which owns <4 GW. Electricity demand has grown faster than in most industrialized countries with total installed capacity trebling between 1955 and 1965 and again between 1965 and 1975, and increasing by 50% in the last decade. This means that old plant represents a very small proportion of total capacity and, thus, refurbishment is not likely to be a major issue in Japan for some time yet. Two other factors reinforce this situation. First, all the coal plant installed before 1981 burns indigenous coal. Given that most coal production in Japan will be phased out in the next few years, this means that, unless imported coal can readily be brought into these plants, they will be shut down. Second, emission standards for Japanese plants are the strictest in the world and old plant would need considerable retrofitting of emissions abatement equipment to remain in service. The detailed analysis of fossil-fired plant is shown in Table 5.
The analysis shows the remarkable rate of technological progress that occurred in Japan in generating plant over that period. Whereas in the period 1955-1959, no plant over 250MW was installed and about 40% of plant used a steam pressure of <1800 psi, by 1965-1969, when over four times as much capacity was commissioned, very little plant used steam at <1800 psi (over 2 GW of plant used supercritical steam at 3500 psi and about 70% of capacity was in sets over 250 MW) .
In terms of firing, coal represented only about 20% of installed capacity with the rest being mostly oil-fired. This oil-fired capacity has been operated fairly intensively and, for the future, the later sets may be worth some refurbishment to enable them to be used mainly for peak demands since base load is now almost fully taken up by nuclear, coal and gas-fired plant.
The environment for building new plant is reasonable. Whilst there is often considerable delay in obtaining all the necessary consents for new sites-generally longer than the time taken to build the plant-the situation is fully integrated into utility planning and site consents have generally been won before plant construction is required. Construction times are very short-usually <5 yr-and costs are predictable. In addition the existence of a large volume of oil-fired plant still operated fairly intensively means that the systems savings a new nuclear, coal or even gas-fired (combined cyle) plant can make are very substantial.
Overall therefore, the option for refurbishment in Japan is not likely to become important until the units installed in the late 1960s near the end of their design life.
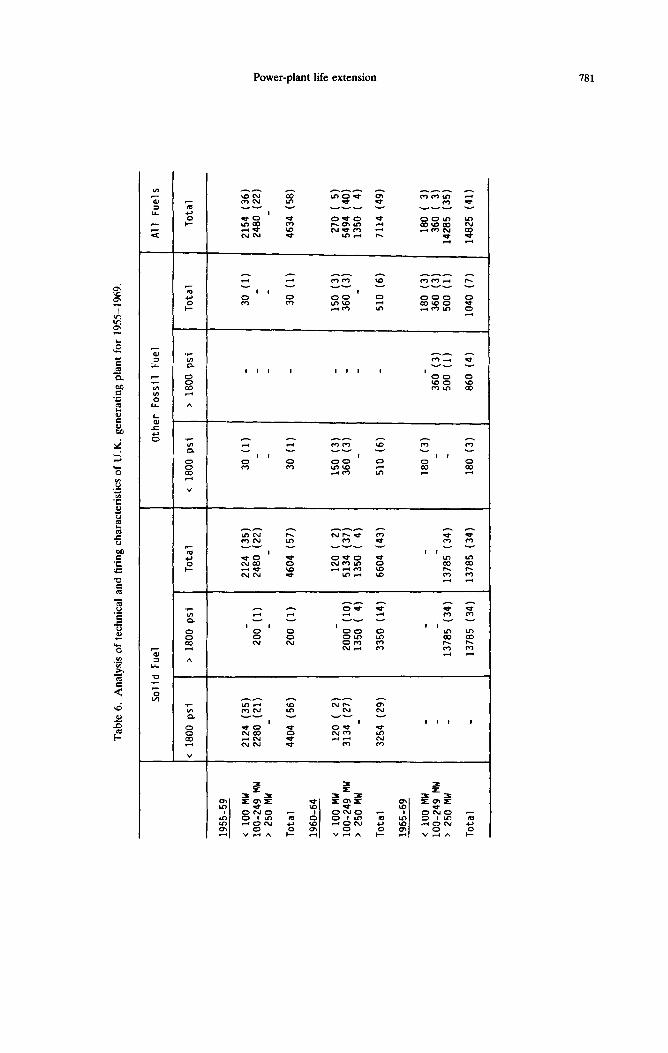
7.3. U.K. The market for life-extension in the U.K. is complicated by the commitment of the present
Government to privatize the electricity supply industry. How this will effect the electricity supply industry is not yet clear but a number of features of the system are robust to most scenarios. These include the following: (i) private industry will require a higher rate of return on capital than the nationalized industries making new investments seem less attractive. (ii) Nuclear power will appear a considerable economic risk to a privately owned industry. (iii) New fossil-fired plant will require SO, equipment, raising their costs significantly.
All three of the above factors increase the attractiveness of maintaining old plant in service, although the relatively backward technical characteristics of the plant reaching retirement age, described in an earlier section, may restrict the scope somewhat. However, whilst the 30 and 60 MW sets are unlikely to be attractive to larger integrated utilities, if the chosen system encourages new entrants owning perhaps one or two power stations, these old units may prove a useful entry route particularly if a supply of cheap coal can be arranged.
Table 6 shows the plant that will be reaching the end of its expected life in the next decade. The 30 and 60 MW sets have low steam conditions (<lOOO psi) and were not capable of 30% thermal efficiency. Much of the capacity of this vintage has already been retired and little of the remaining stock is expected to survive more than 1 or 2 yr more. However, the 100/120 MW sets have much better prospects.
They are capable of exceeding 30% thermal efficiency and in general have proved very

1955
-59
< 1
00
MW
10
0-24
9 M
W
> 2
50
NW
Total
1960-64
< 100 NW
100-249 MW
> 250 MW
Total
1965-69
< 100 MW
100-249 MW
> 250 MW
Total
Tab
le
5.
An
alys
is
of t
ech
nic
al
and
fir
ing
char
acte
rist
ics
of J
apan
ese
elec
tric
ge
ner
atin
g p
lan
t fo
r 19
55-1
969.
T Solid
Fuel
< 1800 psi
370
( 6)
370
( 6)
600
( 8)
600
( 8)
> 1800 psi
175_(
1)
175
( 1)
1068_( 7)
530
( 2)
1598 ( 9)
1165-( 7)
1280
( 5)
2445 (12)
Total
3iO
( 6)
175
( 1)
545
( 7)
600
( 8)
1068
( 7)
530
( 2)
2198 (17)
1165-( 7)
1280
( 5)
2445 (12)
T Other
Fossil Fuel
< 1800 psi
824
(12)
824
(12)
150
( 2)
150
( 2)
351
( 5)
125
( 1)
476
( 6)
>
1800
psi
1663-(H)
1663
(11)
6018
-(
36)
2480
(
8)
8498
(4
4)
75
( 1)
21
96
(13)
86
80
(26)
1095
1 (4
0)
T
Total
824
(12)
1663
(11)
2487
(2
3)
150
( 2)
z:
I’:;
8648
(4
4)
426
( 6)
23
21
(14)
86
80
(26)
1142
2 (4
6)
All
Fuels
Total
1194
(1
8)
1838
(1
2)
3032
(3
0)
750
(10)
70
86
(43)
30
10
(10)
1084
6 (6
3)
426
( 6)
34
86
(21)
99
60
(31)
1386
7 (5
8)
1955
-59
<
100
MW
10
0-24
9 MW
> 250
MW
2124 (35)
2280 (21)
200_
(l)
2124
(3
5)
2480
(2
2)
Total
4404 (56)
200
(1)
4604
(5
7)
1960-64
< 100
MW
100-249
MW
> 250
MW
Total
3254
2:;
29)
2000
-(10
) 13
50
( 4)
3350
(1
4)
120
( 2)
5134 (37)
1350
( 4)
6604 (43)
1965-69
< 100 MW
loo-249
MW
> 250
MW
1378
5-(3
4)
13785-(34)
Total
1378
5 (3
4)
13785
(34)
T Table 6. A
nal
ysis
of
tec
hn
ical
an
d f
irin
g ch
arac
teri
stic
s of
U.K
. ge
ner
atin
g p
lan
t fo
r 19
55-1
969.
I Solid
Fuel
: 18
00 psi
> 1800 psi
Total
c 1800 psi
> 1800 psi
Total
Total
30
(1)
30
(1)
30
(1)
30
(1)
150
(3)
360
(3)
510
(6)
180
(3)
360
(3)
500
(1)
1040
(7
)
2154 (36)
2480 (22)
4634 (58)
Other
Fossil Fuel
All
Fuels
150
(3)
360
(3)
510
(6)
180
(3)
360-(3)
500
(1)
180
(3)
860
(4)
-r
270
5494
13
50
7114
4!/
49)
180
3)
360
3)
14285
35)
14825
(41)

782

Power-plant life extension 783
reliable. Materials specification was conservative and with existing stocks of spares and parts “cannibalized” from a few oil fired sets already retired, maintaining many of these units in service for a further 10 or more years may prove very attractive.
Beyond the 120 MW sets, many of the largest sets still have very high utilizations and it is likely that any utility structure would see these units as a continuing mainstay of the system, and therefore worthy of substantial further investment.
7.4. F.R.G.
In some respects, the utility structure and general environment in F.R.G. lies between the U.S. and Japanese models. The country is divided into eight territories served by eight investor-owned utilities (similar to Japan), but in addition there are a large number of smaller utilities including municipal companies and coal producers. As in the U.S.A., nuclear plant is probably not an option for future orders at least in the next decade. However, recently imposed controls have created incentives to install new plants and construction times are reasonably short and predictable. As in Japan and the U.S.A., there exists in the F.R.G. a strong and innovative heavy electrical industry.
The small size of most utilities and the strength of the heavy electrical industry is reflected in the power station stock (see Table 7). The average size of units is smaller than the U.K., U.S.A and Japan but, even in the period 19551959, more than 60% of the capacity installed used steam at pressure over 1800 psi. The existence of a large indigenous mining industry meant that over 90% of capacity is coal or lignite fired.
7.5. Canada
Canada’s electric utilities are organized on a provincial basis and are publicly owned. The electricity supply system was founded on low-cost hydro-electricity and, as Table 3 shows, steam plant only became a significant factor in the late 1960s. The strong grid built up to serve the hydra-plats meant that large, technologically advanced plant could then be installed (see Table 8). Whilst most provinces now have surplus capacity, plant that can supply power-short regions of the U.S.A. such as New England, may be worth life-extending. In particular, Ontario Hydro which accounts for 200 MW of the coal plant ordered between 1965 and 1969, is likely to have a continuing surplus of plant which may allow it to operate some of the coal plant for export purposes.
7.6. Italy
The Italian electricity supply industry is publicly owned (by ENEL) and, like Canada, was based on hydra-electric power until the late 1960s. Having negligible indigenous coal reserves, Italy’s power stations generally burn oil although some have recently been converted to coal or natural gas (see Table 9). The latter fuel has recently greatly increased its share of electricity generation and is likely to continue to be a significant fuel. Unlike most utilities, ENEL did not accumulate a surplus of plant following the first oil crisis partly due to lack of financial resources to finish plant under construction and partly because of the difficulty of obtaining sites (due to opposition to new stations). It is only since 1982 that ENEL has been able to meet peak demand without power cuts. For the future the cash and siting difficulties appear, if anything to be getting worse and, if as seems likely now, nuclear power is phased out [Italy has three units in service with a capacity of 1.3 GW, two units under construction (1.9 GW) and two units ordered but not yet under construction (2.0 GW)], ENEL will have no option but to maintain in service any plant it can, almost irrespective of the economics.
7.7. France
The prospects for refurbishment in France are by far the poorest of the seven countries considered. There is a substantial and growing over-capacity in generating plant and the French commitment to its nuclear industry is such that further plant orders will continue to be placed to maintain that industry despite the lack of need for the capacity. In addition, siting nuclear plants appears to offer few problems whilst construction times and costs are low and controllable.

784 STEW THOMAS

Power-plant life extension 785
The extent of over-capacity is such that in 1985/1986, peak demand was 58 GW, whilst installed capacity was 86.6 GW of which 37.5 GW was nuclear plant and 21.8 GW was hydro-electric. Since then, nuclear capacity has risen to nearly 50 GW. Conventional thermal capacity dropped from 30.3 to 27.2 GW during the year due to retirements and with a further 20 GW of plant, primarily nuclear, due to enter service in the next 5 yr, there is likely to be a sharp drop in the intalled capacity of conventional thermal plant. The capacity still in service in 5 yr time is likely to be modem and only lightly used and so there will be little need for substantial refurbishment.
8. IMPACT ON THE HEAVY ELECTRICAL INDUSTRY
The growing importance of life-extension will require some substantial adjustments in the strategies of utilities and power plant manufacturers. Foregoing opportunities to construct technologically challenging state-of-the-art plant will be deeply felt on both sides. Nevertheless, for the utilities the growing importance of life-extension increases the options available to them and, on balance, must be seen as a welcome development. However, for the heavy electrical industry, the outlook is much less attractive.
On the debit side, every 1 GW of plant refurbished instead of being retired is 1 GW of replacement capacity not ordered. The major fabrication shops of turbine generator suppliers will be less fully loaded and the costs of developing innovative designs which will give the company an advantage over its competitors will be harder to recover.
However, a refurbishment strategy will result in a worthwhile volume of work for companies supplying, for example, replacement turbine blades, boiler tubes etc., as well as specialist on-site craft-work. It will also provide valuable information on the performance of designs and materials which can be fedback into new designs. The original supplier of the equipment will have a substantial advantage in this field having an intimate knowledge of the design and, particularly if the utility is a valued customer, a great deal of post-sales feedback, which will give the supplier early warning of any problems and personal contacts within the utility. Conversely, it may disrupt the system of close ties between utilities and suppliers. Utilities are likely to be less conservative in their choice of suppliers and a specialist company that offers an advantage in terms of speed of repair, performance or cost may be given an opportunity to prove itself. Equally, this new flexibility may give companies a chance to develop contacts with utilities which they had not previously supplied.
Overall, the adjustments to the heavy electrical industry are likely to result in an increase in the importance of craft labour skills, increased requirement for small-scale production facilities and a decrease in RD&D expenditures and major factory fabrication shops. In an era of declining demand and overcapacity in plant supply, the change in strategies may prompt further restructuring of the heavy electrical industry either through mergers or diversification into niche companies.
9. CONCLUSIONS
In perhaps lo-20 yr, the current interest in refurbishment may be seen as a transitional phase with planning on plant retirements oriented much more towards the economic characteristics of plant rather than the physical age. This will require more careful and thorough maintenance, and further development of techniques for monitoring wear on components and their on-ate replacement. For the utility, the existence of such techniques will increase their range of options in meeting uncertain demand projections and will decrease the uncertainties on the electricity supply side by reducing the volume of new plant ordered.
For the heavy electrical industry, the outlook is less rosy. Refurbishment may reduce the volume of new orders sufficiently to encourage further mergers and take-overs, and, given the extent of earlier mergers, the future may see more international collaborations such as that between Asea and Brown Boveri. A substantial volume of work will arise from refurbishment

786 STEVE THOMAS
but it will be highly competitive. In addition, whilst the sale of a turbine generator, for example, was a highly prestigious event, perhaps opening the way for sales of other plant or, for exports, sales of other goods supplied by the vendor, refurbishment will offer no such advantages.
Overall, the time for refurbishment has come. Like all such developments however, it may prove to be a mixed blessing.
Acknowledgement-The author gratefully acknowledges the financial support of the U.K. Economic and Social Research Council in carrying out this work. He alone, however, is responsible for any errors and omissions.
REFERENCES
1. F. P. R. Brechling and A. J. Surrey, Natn. Inst. Econ. Rev. 34, 30 (1966). 2. F. H. S. Brown and R. S. Edwards, Economica 28, 297 (1961). 3. R. C. Rittenhouse, Power Engng 90, 18 (1986). 4. L. P. Williams, Publ. Utilities Fortnightly 118, 24 (1986). 5. H. W. Massie, Nucl. Engng Znt. 32, 38 (1987). 6. Proceedings of the Institute of Mechanical Engineering, Refurbishment and Life Extension of Steam
Plant, London (14-15 October 1987). 7. L. Hannah, Engineers, Managers and Politicans: The First Fifteen Years of Nationalised Electricity
Supply in Britain, Macmillan, London (1982). 8. N. Lihach, EPRZZ. 8,6 (1983). 9. R. Smock, Power Engng 91, 18 (1987).
10. J. DeMocker, J. Greenwald, and P. Schwengels, Pub. Utilities Fortnightly 117, 30 (1986). 11. World Energy Supplies 1950-1974, United Nations, New York, NY (1976).
APPENDIX
The SPRU Power Plant Data Base
The SPRU Power Plant Data Base is a computer register of public supply power plant in the WOCA covering all equipment of over 30MW(e) net output installed since January 1955 including plant on order or firmly committed. A separate record exists for each turbine generator and covers the following information: (i) plant name and unit number. (ii) Country of installation. (iii) Utility. (iv) Date of order and commissioning. (v) Firing type (24 categories-including dual firing and nuclear by type). (vi) Electrical output and boiler output. (vii) Thermal efficiency. (viii) Turbine generator steam conditions and other technical parameters. (ix) Manufacturers of the major items of equipment. (x) Consulting engineers.
Currently the register contains information on about 10,000 units, with a total capacity of 2000 GW installed in 94 countries.
The register was set up in 1971 and has been the subject of a number of major updates and is now continuously updated as new information from journals, utilities, manufacturers and government agencies becomes available.