Embed Size (px)
Citation preview
8/10/2019 Power Plant Chemistry Measurement Advancements Orp
http://slidepdf.com/reader/full/power-plant-chemistry-measurement-advancements-orp 1/10
Power Plant ChemistryMeasurement Advancements:
Oxidation Reduction Potential Abst rac t
Measurements which show the potential for corrosion of a plant’s
metallurgy due to interaction with the system water have gained
in importance within the last two decades. Among the most
successful of these measurements are those which measure an
actual potential which is based upon the oxidation/reduction
reactions taking place. The measurement of Oxidation Reduction
Potential (ORP) has been used extensively in both nuclear and
fossil fuel power plants to show the potential for corrosion in asystem. Optimum ORP levels are dependent upon system
metallurgy and water chemistry treatment. The system reaction,
and thus the ORP response, will vary depending upon a number
of factors, such as oxygen, hydrogen and oxygen scavenger
concentrations. Comparison of the oxidation/reduction potential
at various points in the system is useful for observing total
system response to variations in chemical addition and system
transients which can lead to more corrosive conditions in the
water.
Corrosion PotentialWithin the last 15 to 20 years, extensive work has been done in
both the nuclear and fossil fuel power industries to determine the
response of system metallurgies to water chemistry conditions.
Perhaps the most successful type of measurement used for
determining the corrosivity of the water to the system metal has
been the measurement of corrosion potential. This potential has
been observed to be affected by a number of factors, including
the activity of the oxidizing species (oxygen, copper), activity of
the reducing species (oxygen scavenger, hydrogen), type of
oxide layers present, temperature, and flow rate. 1-11
This method for obtaining a measurement of the potential for
corrosion utilizes a reference electrode, typically a silver/silver
chloride (Ag/AgCl) half-cell, and a measuring electrode, typically
platinum or some form of metal which is similar or identical to the
system metallurgy (such as a steel alloy). The names given to
this particular measurement vary extensively – corrosion
potential, oxidation/reduction potential (ORP), electrochemical
potential (ECP), or redox (another name for ORP).
It is important to understand that these methods all measure the
oxidizing or reducing potential of the system with respect to the
water. However, each of the listed names above specify a
method of obtaining the oxidation/reduction potential in a slightly
different manner.
ORP, also called redox, utilizes a platinum measuring electrode
with a Ag/AgCl reference electrode to measure the potential.
Most fossil plants and the secondary side of some pressurizedwater reactor (PWR) nuclear plants make this measurement at
ambient temperature through a sampling system, similar to the
measurements of pH, dissolved oxygen, or conductivity. Other
nuclear plants, especially those with a boiling water reactor
(BWR), make this measurement either in-situ (directly in the
process) or in a high flow, at-temperature autoclave system
which provides a sample which is exactly representative of the
process water.
The ECP measurement typically utilizes a Ag/AgCl reference
electrode and the system metallurgy itself as the measuringelectrode. By doing this, the “actual” potential of the system itself
is determined. This measurement is utilized extensively within
the nuclear industry. BWR plants often use the ECP as a control
point for the addition of hydrogen, and as such have found that
this is a more accurate method for ensuring the correct dosage
into the system. 6,11 PWR plants often use the ECP on the
primary side to observe variations in the primary water during
startup, steady state, and shutdown conditions. 6
The measurement of corrosion potential utilizes a Ag/AgCl
reference electrode and a measurement electrode of the samemetallurgy as that of the system metal (usually some form of
steel alloy). In theory, utilizing a measuring electrode similar to
the system metal, rather than platinum, should produce a
potential more representative of the system metal itself.
However, many plants have found the platinum electrode to
actually be equally or even more responsive and sensitive to
system changes. 1,2,5,6,8
8/10/2019 Power Plant Chemistry Measurement Advancements Orp
http://slidepdf.com/reader/full/power-plant-chemistry-measurement-advancements-orp 2/10
Power Plant Chemistry Measurement Advancements: Oxidation Reduction Potential 2
In addition, the platinum electrode has been observed to maintain
its responsiveness to ORP variations longer than the other
electrode types.1 This measurement is typically used most by
the nuclear industry, and is usually measured in conjunction with
either the ECP or ORP measurements.
The focus of this paper will be primarily on the ORP (redox)
measurement, although the results obtained from ECP and
corrosion potential are mentioned, since these are usually seen
to be qualitatively, if not quantitatively, very similar. This
discussion will not address the obvious issues of differences in
results due to various sampling schemes, such as an ambient
temperature sampling system, an in-situ installation, or a high
flow, at-temperature autoclave.
In addition, the mV potentials in this paper will be reported in two
ways. The first method will be to show the units as milliVolts
(mV) followed by “SHE”, which stands for Standard Hydrogen
Electrode. This refers to a method of reporting the mV potential
with respect to a common standard, in this case the SHE. This
electrode is never used in industrial measurements, since it
requires a fixed partial pressure of hydrogen for its use. By
convention, its potential is usually defined as 0.00 V, regardless
of temperature. Since the Ag/AgCl is almost always used as the
reference electrode in the above measurements, a conversion
can be made which shows the actual potential measured (using
the Ag/AgCl) with respect to the SHE. The second method of
reporting used will not have any designation following the mV
value. This refers to a potential measured with respect to the Ag/AgCl electrode at sampling temperature, regardless of
whether the temperature was ambient or similar in temperature to
the process.
Oxidation-Reduction Potential
Whether the measurement is ORP, corrosion potential, or ECP,
the basic measurement principle is the same. Chemical
reactions which involve the transfer of electrons between
reactants are known as oxidation/reduction, or redox, reactions.
A species with lesser affinity for electrons in solution will lose
electrons, increasing its electrical charge. This species willbecome more positive in the oxidation reaction. This half-
reaction is termed the oxidation, because the initial reactions
studied during early investigations of oxidation/reduction involved
oxygen as the oxidizing species. A species with greater affinity
for electrons in solution will accept electrons, reducing its
electrical charge. This half-reaction is termed the reduction,
since the species becomes less positive. Equations 1 and 2
summarize the half reactions taking place.
Xm + pe - Xm-p (reduction -- gain of electrons) (1)
Yn Yn+q + q e- (oxidation -- loss of electrons) (2)
The X m represents the species which is reduced to X m-p by
gaining p electrons. The Y n represents the species which is
oxidized to Y n+q by losing q electrons. The species which gains
electrons is reduced, and acts as an oxidizing agent. The
species which loses electrons is oxidized, and acts as a reducing
agent.
In order for the whole oxidation-reduction reaction to occur, the
two half-reactions must occur simultaneously. If the example
above is simplified by assuming that both oxidation and reduction
reactions involve a single electron, Equation 3 can be written.
Xm + Y n Xm-1 + Y n+1 (standard redox equation) (3)
If a solution is strongly oxidizing, it has a deficiency of electrons
available and thus will attempt to acquire electrons. Likewise, if a
solution is strongly reducing, it has electrons available and will
attempt to give up electrons. The tendency for a solution to
donate or accept electrons can be sensed as an electrical
potential on an inert electrode.
If a solution is strongly oxidizing (electron accepting), it will
withdraw electrons from the measuring electrode’s metal surface,
creating a positive potential on the electrode surface. The ORP
will thus be more positive in solutions which have a higher activityof oxidizing reactants than reducing reactants. Likewise, in a
reducing solution, a more negative potential will exist since the
solution has electrons available which are donated to the surface
of the measuring electrode. The total potential measured is a
result of a multitude of redox reactions (some reversible and
some not), temperature variations, non-ideal electrode response,
and many other factors. It is therefore more useful to look at the
ORP reading from a comparison standpoint rather than a
theoretically accurate standpoint.
ORP in t he Power Plant Water/Steam Cycle
ORP can be used at various points within the water/steam cycle
to establish a baseline for determining the potential for corrosion
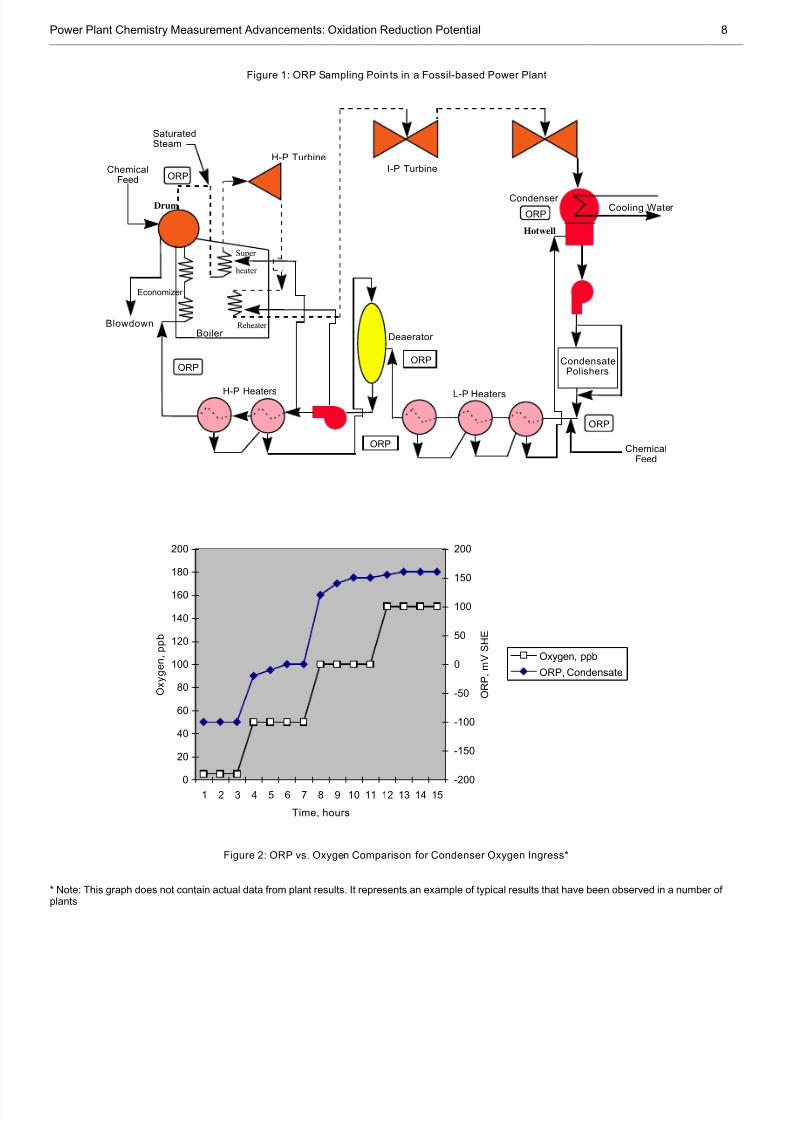
in the system. Figure 1 shows some of the common points
where ORP can be measured in a fossil-based plant. Sampling
points in a nuclear power plant would be similar. ORP testing at
various plants has shown the potential to vary most with changes
in dissolved oxygen and oxygen scavenger, since both affect the
oxidizing or reducing environment of the system.
8/10/2019 Power Plant Chemistry Measurement Advancements Orp
http://slidepdf.com/reader/full/power-plant-chemistry-measurement-advancements-orp 3/10
Power Plant Chemistry Measurement Advancements: Oxidation Reduction Potential 3
Testing at BWR plants employing hydrogen water chemistry have
shown a direct relation between hydrogen and the corrosion
potential as well. It is important to note that the complexity of the
reactions associated with these parameters is such that a change
in any of the concentrations can potentially cause a variation in
the concentration of another.
Dissolved Oxygen
Dissolved oxygen plays an important part of the corrosion
process on metal surfaces in power plants. Oxygen is an
oxidizing substance, so it will directly affect the ORP levels in the
system water. Control points of the oxygen concentration vary
among different water chemistry treatments, but can typically be
summed up in two methods. The first method attempts to
remove as much oxygen as possible (typically down to 5 ppb or
lower) through some form of mechanical and/or chemical means.
The second method maintains a higher level of oxygen (typically
50 to 200 ppb). The type of method chosen will determine theexpected potentials.
At one PWR nuclear plant, oxygen concentration was maintained
below 10 ppb in the main condensate. 6 Shutdown of two
condenser halves was done for cleaning purposes. This resulted
in an increase in condensate temperature which in turn caused
an increase in the oxygen content of the condensate. The initial
increase in oxygen was from about 10 ppb to as high as 50 ppb.
ORP measurements in the downcomer tube bundle were seen to
increase from -200 mV SHE to -100 mV SHE. ORP
measurements at the high pressure feed water heater were seento increase from around -50 mV SHE to as high as +100 mV
SHE. When the condenser was returned to normal operation,
the condensate oxygen concentration dropped back down to
about 20 ppb. The downcomer ORP dropped down to around -
150 mV SHE, and the high pressure feedwater heater ORP
dropped down to about +10 mV SHE. However, the measured
oxygen at the feedwater remained constant at 2 to 3 ppb, and the
measured feedwater hydrazine concentration was seen to remain
constant at 130 ppb. The ORP was thus much more sensitive to
system changes at the feedwater and downcomer area than the
oxygen or hydrazine measurements.
The relationship between ORP and oxygen concentration was
observed at one fossil fuel plant. 2 Oxygen excursions occurred
due to an air ingress, with the oxygen level spiking from 10 ppb
to around 1 ppm, and then leveling off to 150 ppb for about 4
hours. The feedwater ORP levels were seen to rise sharply two
and a half hours later. The ORP increased 200 mV within about
half an hour, and then slowly decreased over the next six hours.
Testing was done at this plant to observe the relationship
between higher oxygen levels and the ORP value. The ORP
value was relatively low (-300 mV SHE) during normal operation
of oxygen concentrations of less than 5 ppb. As the oxygen level
was increased, the ORP level quickly increased to almost +75
mV SHE by the time 25 ppb oxygen was present in the system.
At 100 ppb of oxygen, the ORP value had leveled off at around
+100 mV SHE. Further increases above 100 ppb showed little
increase in the ORP.
From the previous two examples it can be observed that oxygen
directly affects the ORP of a system, as would be expected since
oxygen by definition will increase the oxidizing activity of the
system. ORP will therefore become more positive at higher
levels of oxygen. Figure 2 shows a theoretical example of what
might be expected from ORP readings in the condensate when
oxygen is introduced into the condenser. Notice the direct
relationship between oxygen and ORP. Notice also that as
oxygen levels exceed 100 ppb, the ORP does not increase much
further. This graph does not represent actual data at a plant;
however, it does represent results of the oxygen vs. ORP
relationship that have been observed at numerous plants.
Oxygen Scavenger
Oxygen scavengers, such as hydrazine, serve a primary purpose
of chemically removing oxygen from the system. However, they
can also be useful for corrosion prevention since the presence of
most oxygen scavengers will create a more reducing
environment in the system. The results of testing performed at anumber of power plants, both nuclear and fossil based, show the
response of ORP to changing oxygen scavenger concentrations.
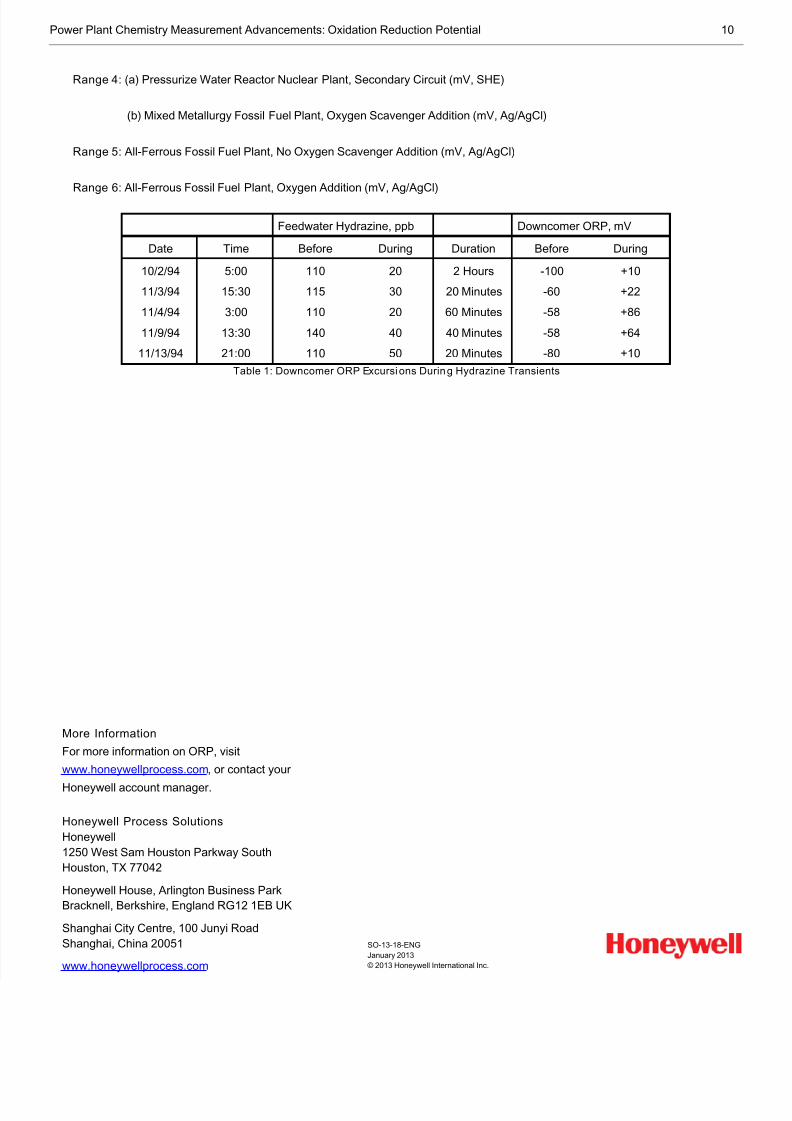
At one nuclear PWR plant, hydrazine transients were observed
when flow was lost from the injection pumps. 1,10 Hydrazine
injection took place in the feedwater system, immediately after
the point where the condensate demineralizers can be inserted
into the lineup. The highest levels of hydrazine were observed in
the feedwater system before there could be much reaction of
hydrazine with oxygen or other oxidizing contaminants, and
before there could be any appreciable thermal breakdown ofhydrazine. During this time, the ORP of the feedwater varied
only by 10 mV, while a large change was seen in the downcomer
portion of the steam generators (see Table 1). The effect that
hydrazine had on the ORP of the downcomer water was directly
related to the length of the excursion and the change in
hydrazine level. The relationship between more positive ORP
readings and lower hydrazine concentrations was obvious. Note
that the hydrazine levels are given for feedwater hydrazine.
8/10/2019 Power Plant Chemistry Measurement Advancements Orp
http://slidepdf.com/reader/full/power-plant-chemistry-measurement-advancements-orp 4/10
Power Plant Chemistry Measurement Advancements: Oxidation Reduction Potential 4
A previous check of hydrazine levels had given downcomer
hydrazine levels of 54 and 79 ppb where feedwater was 100 ppb.
It was noted at one fossil plant that sample locations with higher
hydrazine residuals experienced more reducing (more negative)
potentials. 4,12 The hydrazine concentration was initially 40 ppb
and was reduced over a period of time to zero. The ORP was
seen to have a direct correlation with the level of hydrazine.
While the level of hydrazine was at 40 ppb, the ORP reading was
approximately -340 mV. When the hydrazine feed was stopped
completely, the ORP was seen to rise to about +80 mV, where it
leveled off. Large step changes of the hydrazine concentration
correlated to large step changes in the ORP. At another fossil
plant, the ORP levels at the economizer inlet were recorded
before and after hydrazine feed was cycled on and off. An
excellent correlation of ORP vs. hydrazine was observed, with
ORP readings of around -80 mV with hydrazine and +60 mV
without hydrazine. 4
An interesting effect of the oxygen scavenger and ORP
relationship was noted at a few nuclear PWR plants. (Note:
Although reported as ECP, both plants tested ORP as well and
reported qualitatively similar results. As such, the actual
potentials were somewhat different in magnitude, but the
response was basically the same.) In the secondary side of one
plant, the ECP values were observed in the final feedwater for
various concentrations of hydrazine residual. 8 The ECP was
approximately -100 mV SHE when there was no hydrazine
present in the water. As the hydrazine residual increased, theECP value dropped exponentially until it leveled off at
approximately -500 mV SHE at 100 ppb of hydrazine. Increasing
the hydrazine concentration beyond 100 ppb did not serve to
reduce the ECP any further. A similar test was performed in the
secondary side of another plant. 5 At two of the sample points
(condensate pump discharge and low pressure feedwater pump
discharge), a similar effect to that seen at the other plant was
observed. The condensate sample point’s ECP did not vary from
around +200 mV SHE until the hydrazine concentration was
increased to above 15 ppb. When the hydrazine concentration
was increased above 15 ppb, the ECP began droppingexponentially until it leveled off around -50 mV at 100 ppb of
hydrazine. At the feedwater sample point, the ECP dropped
linearly from 0 mV SHE at 0 ppb hydrazine down to -350 mV
SHE at 15 ppb hydrazine. When the concentration was
increased above 15 ppb, the ECP actually was observed to
increase slightly, leveling off at about -300 mV SHE at
approximately 100 ppb hydrazine.
It should be noted that an increase in ORP with increasing
hydrazine dosage is not normal, and could possibly indicate
something other than hydrazine affecting the ORP reading.
It is important to understand that when no oxygen scavenger is
present, the ORP value of the water is largely dependent upon
the oxygen concentration in the water. However, when the
oxygen concentration drops much below 5 ppb due to oxygen
scavenger addition, the ORP value becomes more of a function
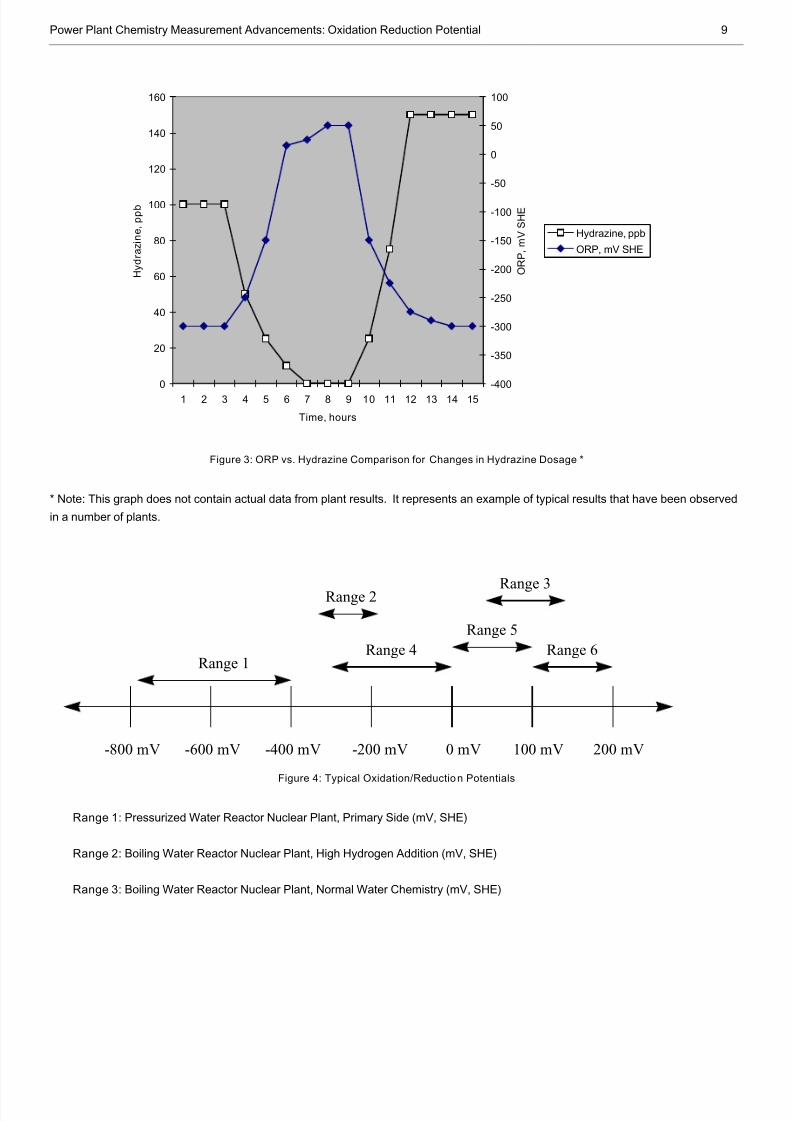
of the oxygen scavenger concentration. Figure 3 shows a
theoretical example of what might be expected from ORP
readings in the final feedwater when hydrazine concentration is
varied in the feedwater. Notice the inverse relationship between
hydrazine and the ORP value. Notice also that as hydrazine
levels exceed 100 ppb, the ORP does not decrease much
further. This graph does not represent actual data at a plant;
however, it does represent results of the hydrazine vs. ORP
relationship that have been observed at numerous plants.
Hydrogen Water Chemistr y
In BWR nuclear plants, hydrogen is often added to the feedwater
to avoid stress corrosion cracking of stainless steel piping. It has
been shown that the intergranular stress corrosion cracking
(IGSCC) of sensitized stainless steel can be minimized by
maintaining the ECP below the critical potential, typically -230
mV SHE in high purity water. 6,11,13 Hydrogen addition to the
feedwater decreases the amount of oxidizing species in the
reactor water by recombination in the downcomer, and thus
reduces the production of oxidizing species from the radiolysis ofwater in the core. 11,13 The addition of hydrogen to the feedwater
creates a more reducing potential (more negative) due to
decrease of oxidizing species which results from the increased
hydrogen concentration. The potential of BWR water with
“normal” hydrogen water chemistry has been observed to be
typically in the range of +50 to +200 mV SHE. 6,11 Only at
increased dosages of hydrogen will the potential be seen to drop
down to well below the -230 mV range. 6,11,14 It has been
observed that the potential can only be accurately measured in-
situ for proper hydrogen dosage control. 11
Location
Typical power plant water has different properties, such as pH,
oxygen / oxygen scavenger concentrations, or temperature,
depending upon the location in the system. Because of the
varying characteristics of the water, as well as different
metallurgy used throughout the system, the ORP response can
change significantly from one point to another.
8/10/2019 Power Plant Chemistry Measurement Advancements Orp
http://slidepdf.com/reader/full/power-plant-chemistry-measurement-advancements-orp 5/10
Power Plant Chemistry Measurement Advancements: Oxidation Reduction Potential 5
A change in chemistry in one portion of the system may cause no
change in the ORP at one point and drastically alter the readings
at another point. This has been observed at many plants.
Although the majority of the ORP measurements have been
made in the feedwater or economizer, other points in the process
are also important to monitor for better characterization of the
overall system response to varying changes, such as load
increases, leaks, or excursions.
At one nuclear plant utilizing a Pressurized Water Reactor
(PWR), readings were taken at various points on two redundant
systems on the secondary water. 1,10 These points included the
Feedwater, Downcomer, Hotleg, Coldleg, and Demineralizer
Influent. An example of varying system responses can be seen
by examining Table 1. Testing of ORP response of the system to
hydrazine excursions revealed an interesting system response
between the feedwater and the downcomer portions. As can be
seen from Table 1, feedwater hydrazine levels dropped
considerably during excursions. The ORP response at the
downcomer sample point was significant, typically rising by as
much as 100 mV during each excursion. However, the effect of
loss of hydrazine flow on ORP was minimal in the feedwater
system. ORP readings differed by no more than about 10 mV
each time.
Another PWR-based nuclear plant measured the ORP response
at the outlet of the condensate pumps (point #1), the outlet of the
feedwater pumps (point #2), and the outlet of the high pressure
heaters (point #3).5
During steady state conditions, the potentialafter the condensate pumps was typically -150 to -100 mV SHE.
The potential after the feedwater pumps was typically -350 to -
200 mV SHE. The potential at the outlet of the high pressure
heaters was typically -550 mV SHE.
At the same plant, some transient conditions were introduced to
observe the effects on the potential at the three sampling points. 5
The first transient was characterized by an increase in the
condensate oxygen concentration (typically 6 ppb) and a
decrease in the feedwater hydrazine concentration (typically 70
to 100 ppb). This effect was caused by leakage of oxygen intothe condenser or the steam itself. The redox potential at point #1
was observed to increase by about 20-100 mV, with the larger
increases seen with larger increases in oxygen concentration and
larger decreases in hydrazine concentration. Point #2 was
observed to increase in potential by about 10-50 mV,
characterized by the same situation as point #1. The third point
had no measurable increase in potential for any of the above
transient conditions.
The second transient was characterized by an inleakage of
oxygen from systems connected to the feedwater line after the
condensate pumps (and after the first point of ORP monitoring). 5
A decrease in hydrazine concentration was also noticed during
this type of transient. Each measuring point had a significant
increase in potential during the time of the transient, with the
second point showing the most noticeable increase. The
increase at points 1 and 3 were about the same. The same
effect was noticed at another plant. 8 In both plants, the dissolved
oxygen monitor for the feedwater showed no appreciable
increases, while the potential measurements were seen to
increase at multiple points.
Locational testing during changes of hydrazine dosage was also
performed at this plant. 5 The hydrazine was dosed from after the
condensate pump, at a location immediately after the first
sampling point. An immediate change was noticed in the second
sampling point, as the potential dropped linearly from
approximately 0 mV SHE down to -350 mV SHE as the hydrazine
concentration was increased from 0 to 15 ppb. As the hydrazine
concentration was continually increased to as high as 150 ppb,
the potential slowly increased from -350 mV SHE to about -300
mV SHE. The third sampling point remained at approximately -
400 mV throughout the range of 0 to 150 ppb hydrazine. The
first sampling began at approximately +200 mV SHE and
remained constant until about 15 ppb of hydrazine had been
introduced. At that dosage point, the potential began to drop in a
slow, exponential fashion to a final potential of around -50 mV
SHE at 150 ppb of hydrazine.
Another nuclear plant utilizing a Boiling Water Reactor (BWR)
experienced high potentials (typically between 0 to +200 mV
SHE) during normal hydrogen water chemistry conditions. 11
These potentials did not vary at different points in the system.
However, upon addition of hydrogen at what was considered to
be normal rates for hydrogen water chemistry, the potentials first
decreased at sample points distant from the core, while the
potentials near to the core remained relatively high. The
corrosion potential was thus seen to be considerably different at
various points. As hydrogen dosage was increased to muchhigher than the normal rate, the entire system eventually dropped
to a very low potential (typically less than -300 mV SHE), with
little variance among sample points, although some higher
corrosion potentials were still seen in the core.
An interesting phenomenon was observed in measuring different
sample points at one fossil fuel-based plant that converted from
All-Volatile Treatment to Oxygenated Treatment (OT).
8/10/2019 Power Plant Chemistry Measurement Advancements Orp
http://slidepdf.com/reader/full/power-plant-chemistry-measurement-advancements-orp 6/10
Power Plant Chemistry Measurement Advancements: Oxidation Reduction Potential 6
During AVT treatment, ORP readings were taken at the Hotwell (-
60 mV), Final Feedwater (-100 mV), Boiler Water (-80 mV) and
Main Steam (-80 mV). Readings differed by more than 100 mV
at various sample points in the plant, and it was observed that
the sample locations of more negative potentials had higher
hydrazine residuals. 4 Upon switching to OT, the readings were
about +100 to +120 mV at each point. 12 The resulting common
readings were expected, since the water chemistry would be
similar throughout the system.
It is obvious from the results seen in the previous examples that
the multiple location measurements can play an important part in
determining the overall cause and effect of various transients and
variations to water chemistry in the system. It is expected that
load variations on the system could also generate results that
vary from point to point. Regardless of the cause for the
variation, multiple points are useful for sensing overall system
response to process changes and upsets.
ORP And Corrosi on
ORP has a strong relation to corrosion within a system, since the
reactions associated with corrosion are oxidation/reduction
based. Any oxidants or reductants present in the system are
directly linked to corrosion production in a system. Optimal
concentration limits of oxidants and reductants vary depending
upon the type of metallurgy and the type of water chemistry
treatment being done at a plant. Figure 4 shows an example of
the optimal control ranges for ORP at the feedwater sampling
point in both nuclear and fossil plants for various water chemistrytreatments.
The trend in past years at most plants has been to remove as
much of the dissolved oxygen as possible, which almost always
requires addition of an oxygen scavenger such as hydrazine.
This can have a detrimental effect in all-ferrous plants, since
removing oxygen by oxygen scavenger will lead to a strongly
reducing environment (-300 mV or lower), which has actually
been seen to increase the erosion/corrosion of iron-based
materials as well as increasing the transported feedwater
corrosion products.3,4,9
It has been observed that high levels offlow-accelerated corrosion (FAC) occur in all-ferrous plants when
the ORP is less than -300 mV due to either an oxygen level of
less than 1 ppb or oxygen scavenger level of greater than 20
ppb, or both. 9
The primary oxidation reaction on steel surfaces is the oxidation
and dissolution of iron:
Fe Fe 2+ + 2e - (5)
The two primary reduction reactions on steel surfaces are the
reduction of hydrogen (Equation 6) and the reduction of oxygen
(Equation 7):
2H + + 2e - H2 (6)
O2 + 2H 2O + 4e - 4OH - (7)
The reduction of hydrogen is seen to be favored at more
reducing potentials while the reduction of oxygen is favored at
higher (more oxidizing) potentials. 15 The optimal ORP control
point appears to be somewhat dependent upon the pH of the
plant water. 2,7 It has been shown that providing a less reducing
environment in all-ferrous plants at the recommended pH levels
(typically 8-10 pH depending upon the specific water chemistry
treatment) will minimize corrosion product generation. 3,4,7,9 This
can be done by lowering oxygen scavenger levels or eliminating
the oxygen scavenger levels and adding oxygen. This process
converts the magnetite (Fe 3O 4) to ferric oxide hydrate (FeOOH),
which has a much lower solubility. 9
At one plant, the ORP increased from -340 mV to +100 mV when
the level of hydrazine was reduced from 40 ppb to zero. The
total iron decreased from 14 ppb to about 5 ppb.4
At anotherplant, which has an all-ferrous system, hydrazine feed was
discontinued to reduce iron transport. The ORP was observed to
increase from -125 mV to -50 mV when the hydrazine dosage
was dropped from 20 ppb to 0 ppb. The feedwater pH of 9.2 to
9.6 remained the same during the test period. Iron transport
through the feedwater cycle did decrease from an average of
about 3 ppb to less than 1 ppb within an 8 month time period
following the change in treatment. 10
Some plants with all-ferrous metallurgy have begun switching to
an Oxygenated Treatment (OT) in which a small concentration ofdissolved oxygen, typically 30-150 ppb, is maintained in order to
minimize corrosion. Conversion to OT will correspond to an
oxidizing environment typically on the order of +100 mV or
more. 3,4 This has been shown to eliminate flow accelerated
corrosion by forming a protective oxide layer on the material
surface. 9
8/10/2019 Power Plant Chemistry Measurement Advancements Orp
http://slidepdf.com/reader/full/power-plant-chemistry-measurement-advancements-orp 7/10
Power Plant Chemistry Measurement Advancements: Oxidation Reduction Potential 7
One plant experienced an increase of 500 mV during the
transition from reducing to oxidizing operating conditions, during
which the corrosion rates dropped to two to three times lower
than those experienced during reducing conditions.2 This highly
oxidizing environment is expected since no oxygen scavenger is
present and higher concentrations of dissolved oxygen are
present, both of which raise the ORP. All-ferrous plants
switching to OT and thus more positive ORP levels have
experienced significant drops in corrosion products.
Systems with mixed metallurgy have been found to have minimal
corrosion occurring when a more reducing (more negative)
potential is present. 3,16 While understanding of copper alloy
corrosion is not yet adequate, a relationship with ORP has been
established. Cuprous oxides (Cu 2O) and cupric oxides (CuO)
can form on copper base alloys. Formation of cuprous oxide
provides a protective barrier adjacent to the metal surface.
Cupric oxide can form by oxidation of the cuprous ions. Cuprous
oxide formation is thus preferred at lower reducing potentials,
while a more oxidizing environment will support the growth of the
cupric oxide. Reducing regimes are thus preferred in mixed
metallurgy environments. Even when dissolved oxygen levels
are kept below the 7 ppb limits typical of mechanical deaeration,
an oxygen scavenger such as hydrazine, which lowers the
reducing potential, should be maintained, or serious copper
deposition problems can occur. 3
This effect was observed at one plant which has a copper nickel
condenser and all-ferrous feedwater heaters.10
Hydrazineinjection had been terminated in an attempt to reduce the
potential for erosion/corrosion and iron transport through the
boiler cycle. A slow loss in turbine efficiency was observed after
the change. It was theorized that oxygen in the boiler water
converted copper in boiler deposits allowing it to volatize and
deposit on the first stages on the HP turbine. Hydrazine
injection was then re-established with a goal on maintaining a
more reducing environment in the feedwater and boiler water.
It has been observed at many plants that optimization of the
hydrazine level in copper-based systems can be done with theORP measurement in order to prevent copper attack by
excessive hydrazine levels.6 ORP monitoring has been used
while chemically cleaning boilers to ensure the proper
environment to dissolve iron oxide, insure passivation of clean
surfaces, and prevent precipitation of copper. Monitoring has
also been used in ammoniated EDTA cleanings to prevent
corrosion following the iron removal stage. 11
Conclusions
ORP has been seen to be useful in determining the response of
the system metallurgy to the water chemistry. The ORP has
been observed to be affected most by the activity of oxidizing
(oxygen) and reducing (oxygen scavenger, hydrogen) species in
the water. The ORP of a system has been observed to be
directly related to various types of corrosion, such as flowaccelerated corrosion (FAC) in all-ferrous plants, intergranular
stress corrosion cracking (IGSCC) in BWR nuclear plants, or
cupric oxide formation in mixed metallurgy plants. The optimum
ORP control point has been seen to vary somewhat from plant to
plant, largely depending upon type of water treatment,
concentration of oxidizing and reducing species, type of
metallurgy, and location of the measurement.
ORP has been observed to be equally or more sensitive to
system transients as traditional measurements of hydrazine and
oxygen concentration. It is expected that ORP will become astandard measurement at multiple points throughout a plant’s
water/steam cycle, and will be used along with measurements of
pH, oxygen and oxygen scavenger concentration in order to
optimize the water chemistry.
8/10/2019 Power Plant Chemistry Measurement Advancements Orp
http://slidepdf.com/reader/full/power-plant-chemistry-measurement-advancements-orp 8/10
Power Plant Chemistry Measurement Advancements: Oxidation Reduction Potential 8
Figure 1: ORP Sampling Poin ts in a Fossil-based Power Plant
Figure 2: ORP vs. Oxygen Comparison for Condenser Oxygen Ingress*
* Note: This graph does not contain actual data from plant results. It represents an example of typical results that have been observed in a number ofplants
Blowdown
ChemicalFeed
Condenser
H-P TurbineI-P Turbine
Boiler
H-P Heaters L-P Heaters
Deaerator
ORP
ORP
ORP
ORPChemical
Feed
Economizer
CondensatePolishers
SaturatedSteam
Cooling Water Drum
Super
Reheater
heater
Hotwell
ORP
ORP
0
20
40
60
80
100
120
140
160
180
200
1 2 3 4 5 6 7 8 9 10 11 12 13 14 15
Time, hours
O x y g e n ,
p p
b
-200
-150
-100
-50
0
50
100
150
200
O R P
, m
V S H E
Oxygen, ppb
ORP, Condensate
8/10/2019 Power Plant Chemistry Measurement Advancements Orp
http://slidepdf.com/reader/full/power-plant-chemistry-measurement-advancements-orp 9/10
Power Plant Chemistry Measurement Advancements: Oxidation Reduction Potential 9
Figure 3: ORP vs. Hydrazine Comparison for Changes in Hydrazine Dosage *
* Note: This graph does not contain actual data from plant results. It represents an example of typical results that have been observed
in a number of plants.
Figure 4: Typical Oxidation/Reductio n Potentials
Range 1: Pressurized Water Reactor Nuclear Plant, Primary Side (mV, SHE)
Range 2: Boiling Water Reactor Nuclear Plant, High Hydrogen Addition (mV, SHE)
Range 3: Boiling Water Reactor Nuclear Plant, Normal Water Chemistry (mV, SHE)
0
20
40
60
80
100
120
140
160
1 2 3 4 5 6 7 8 9 10 11 12 13 14 15
Time, hours
H y
d r a z
i n e ,
p p
b
-400
-350
-300
-250
-200
-150
-100
-50
0
50
100
O R P
, m
V S H E
Hydrazine, ppb
ORP, mV SHE
-800 mV -600 mV -400 mV -200 mV 0 mV 100 mV 200 mV
Range 4Range 5
Range 6Range 1
Range 2 Range 3
8/10/2019 Power Plant Chemistry Measurement Advancements Orp
http://slidepdf.com/reader/full/power-plant-chemistry-measurement-advancements-orp 10/10
Power Plant Chemistry Measurement Advancements: Oxidation Reduction Potential 10
More Information
For more information on ORP, visit
www.honeywellprocess.com , or contact your
Honeywell account manager.
Honeywell Process SolutionsHoneywell1250 West Sam Houston Parkway SouthHouston, TX 77042
Honeywell House, Arlington Business ParkBracknell, Berkshire, England RG12 1EB UK
Shanghai City Centre, 100 Junyi RoadShanghai, China 20051
www.honeywellprocess.com
Range 4: (a) Pressurize Water Reactor Nuclear Plant, Secondary Circuit (mV, SHE)
(b) Mixed Metallurgy Fossil Fuel Plant, Oxygen Scavenger Addition (mV, Ag/AgCl)
Range 5: All-Ferrous Fossil Fuel Plant, No Oxygen Scavenger Addition (mV, Ag/AgCl)
Range 6: All-Ferrous Fossil Fuel Plant, Oxygen Addition (mV, Ag/AgCl)
Feedwater Hydrazine, ppb Downcomer ORP, mV
Date Time Before During Duration Before During
10/2/94 5:00 110 20 2 Hours -100 +10
11/3/94 15:30 115 30 20 Minutes -60 +22
11/4/94 3:00 110 20 60 Minutes -58 +86
11/9/94 13:30 140 40 40 Minutes -58 +64
11/13/94 21:00 110 50 20 Minutes -80 +10Table 1: Downcomer ORP Excursi ons Durin g Hydrazine Transients
SO-13-18-ENGJanuary 2013© 2013 Honeywell International Inc.