Embed Size (px)
DESCRIPTION
Article related to the power outages and economic growth in Africa
Citation preview
Power Outages and Economic Growth in Africa
by
Thomas Barnebeck Andersen
and
Carl-Johan Dalgaard
Discussion Papers on Business and Economics No. 7/2012
FURTHER INFORMATION Department of Business and Economics
Faculty of Social Sciences University of Southern Denmark
Campusvej 55 DK-5230 Odense M
Denmark
Tel.: +45 6550 3271 Fax: +45 6550 3237
E-mail: [email protected] ISBN 978-87-91657-60-3 http://www.sdu.dk/ivoe
1
Power Outages and Economic Growth in Africa
Thomas Barnebeck Andersen
Department of Business and Economics, University of Southern Denmark
Campusvej 55, DK-5230 Odense M, Denmark
Email: [email protected]
Fax: (+45)65503237
Phone: (+45)65503257
Carl-Johan Dalgaard
Department of Economics, University of Copenhagen
Øster Farimagsgade 5, DK-1353, Copenhagen, K, Denmark
Email: [email protected]
Fax: (+45)35323000
Phone: (+45)35324407
February 2012
Abstract
This paper estimates the total effect of power outages on economic growth in Sub-Saharan
Africa over the period 1995-2007. Outages are instrumented using a satellite-based measure of
lightning density. As suggested by Henderson et al. (2011), we also combine Penn World Tables
GDP data with satellite-based data on nightlights to arrive at a more accurate measure of
economic growth. Our results suggest that the annual economic growth drag of a weak power
infrastructure is about 2 percentage points.
JEL Classification: H4, O1, O4
Keywords: economic growth; public utilities; electricity; earthlights; Africa

2
1. Introduction
Since the mid 1990s Sub-Saharan Africa has, for the first time in three decades, started growing
at about the same rate as the rest of the world (World Bank, 2008). There is even econometric
evidence that finds that a structural break in the rate of African GDP per capita growth occurred
in 1995 (Arbache and Page 2009). Average growth in per capita GDP, from 1995 until the
outbreak of the crisis, was about 3% per year (Penn World Tables, 7.0). Yet the observed
variation in growth performance is equally astonishing; across Sub-Saharan Africa the standard
deviation in growth is about 5%. What accounts for this variation?
Power problems could be a culprit, as it is widely acknowledged that Sub-Saharan Africa is in
the midst of a power crisis (Eberhard et al. 2008; UN 2007).1 Outages are not just frequent and
long but also erratic. According to the World Bank’s Enterprise Surveys, pertaining to the years
2006-2010, the average number of power outages during a typical month is 10.5, while the
average length of an outage is 6.6 hours. Unsurprisingly, more than 50% of African businesses
surveyed cite inadequate power supply as a major business constraint.2 Overall, there is no doubt
that a deficient power infrastructure dampens economic growth (Jones 2011; Eberhard et al.
2008; IMF 2008, Chapter IV). But how large is the effect? This paper provides an estimate.
Our paper is related to a large literature investigating the importance of infrastructure for growth
and development. In a recent contribution, Dinkelman (2011) estimates the impact of household
1 See “Toiling in the Dark: Africa’s Power Crisis” by Michael Vines in the New York Times (July 29, 2007) for a
vivid description of Africa’s ongoing power crisis. 2 http://enterprisesurveys.org/Data/ExploreTopics/infrastructure#--7

3
electrification on employment growth in rural communities by analyzing rural electrification
roll-out in post-apartheid South Africa. While Dinkelman contributes to what we know about the
microeconomic effects of the quantity of physical infrastructure in developing countries, we
focus on the macroeconomic effects of the quality of physical infrastructure. The 1994 version of
the World Development Report, which was devoted to “Infrastructure for Development”, also
made the distinction between the quantity and the quality of infrastructure services. The tradition
in the macroeconomics literature has been to estimate quantity effects of public infrastructure on
total factor productivity using time-series data, with Aschauer (1989) being a classic reference.
The World Bank (1994) and Jimenez (1995) provide overviews relevant for developing
countries. This paper departs from the macroeconomic tradition in three ways. First we focus
exclusively on the quality of infrastructure. Secondly, we estimate the total effect of
infrastructure as opposed to a partial effect. Thirdly, we pay more attention to the intricacies of
obtaining identification.
The remainder of this paper is organized as follows. The next section discusses the empirical
specification, identification and data. Section 3 presents and discusses the main results, while
Section 4 concludes.
2. Empirical Strategy
Consider the following parsimonious regression model:
0 1 log(OUTAGES ) ,i i ig (1)

4
where g is the average annual growth rate of real income per capita over the period 1995-2007;
the pre-crisis period in which Sub-Saharan Africa evidently witnessed something of a growth
revival. Since GDP is likely to be particularly plagued by non-random measurement error in
Africa, we follow Henderson et al. (2011, Section 2) in producing “adjusted” real GDP per capita
growth rates by employing satellite data on nightlights. Briefly, the growth observations used
below are a convex combination (weight: 0.5) of observed real (chained PPP) GDP per capita
growth (from Penn World Tables 7.0) and the fitted values from a regression of this variable on
growth in nigthlights 1995-2007. Our results are qualitatively the same if we employ the “raw”
GDP per capita numbers; quantitatively, however, our estimates are (numerically) smaller using
adjusted data. Accordingly, using adjusted growth rates provides more conservative estimates.
The OUTAGES variable refers to the (log) number of outages in a typical month and derives
from World Bank’s Enterprise Surveys 2011. Our final sample consists of 39 countries in Sub-
Saharan Africa. Interest centers on retrieving a consistent estimate of 1 .
Power supply is a general purpose technology, which affects the economy directly and/or
indirectly through multiple channels. This has important implications for the selection of control
variables. To see this, assume that power outages only have indirect effects on economic growth;
i.e., assume the following causal structure: OUTAGES → PROXIMATE FACTORS →
GROWTH. If we include all proximate factors, X , assumed to be a vector valued function of
power outages, OUTAGESX f , and estimate (2):
0 1 2log(OUTAGES ) ,i i i ig X α (2)
5
then 1plim 0 (Achen 2005) Adding all proximate factors may thus lead to a vanishing
estimate. More generally, since the potential proximate factors are too numerous to account for,
and since the total effect (= direct + indirect) is what should really interest us when dealing with
a general purpose technology, the parsimonious specification (1) is appropriate. Consequently,
1 in equation (1) is the total effect of power outages on economic growth.
The outages variable is endogenous in (1). It is both correlated with a number of economic
growth determinants, subject to reverse causal influence, and measured with error. An
appropriate identification strategy is thus called for. We adopt the strategy proposed by Andersen
et al. (2011a, b), which entails using lightning density as an exogenous determinant of power
disturbances. Lightning damage accounts for about 65% of all over-voltage damage to electrical
distribution networks in South Africa; over-voltage damage in turn is thought to account for one-
third of all outages.3 In Swaziland more than 50% of power outages on transmission lines are
attributed to lightning (Mswane and Gaunt 2005). These numbers are roughly in line with
(though somewhat bigger than) measurements reported for the U.S (McGranaghan et al. 2002;
Chisholm and Cumming 2006). For instance, Chisholm and Cummins argue that lightning is the
direct cause of one third of all U.S. power quality disturbances.4 In areas with greater lightning
density (strikes/km2/year) we should therefore expect to see more power outages, ceteris paribus.
3 See http://www.liveline.co.za/lightning-stats.php. 4 In 1997 that the Tennessee Valley Authority (TVA) implemented a system at TVA’s Chattanooga facility that
integrated lightning strike data with power quality data. TVA has about 17,000 miles of transmission lines spread
across 7 U.S. states, and lightning is found to be responsible for about 45% of all power quality disturbances
(McGranaghan et al. 2002).

6
Is lightning density a valid instrument? It is certainly external in the sense of Deaton (2010).
However, this does not imply that it fulfills the exclusion restriction required for instrument
validity: Cov lightning, 0 . In particular, it could correlate with geographical factors, say,
which themselves exert an effect on economic growth. In an African context, the most obvious
factor is natural resources. We therefore check the robustness of our results with respect to this
particular concern. We also check the robustness of our results to the inclusion of initial (or
predetermined) income per capita, a coastal dummy, precipitation, temperature, and absolute
latitude.
3. Results
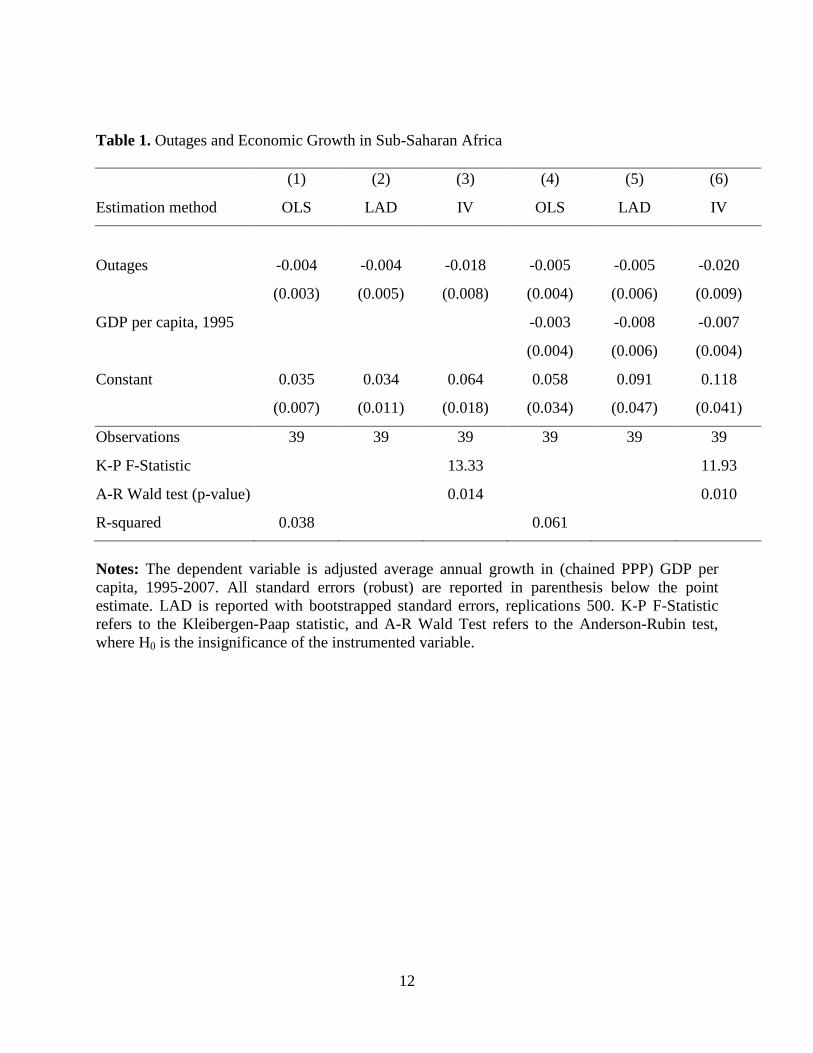
Table 1 reports regression output from estimation of equation (1). Column 1 reports OLS
estimates, which are expected to be biased. The OLS estimate implies that a one log point change
in the number of outages during a typical month is associated with on average 0.4 percentage
points lower growth in GDP per capita. The outlier robust LAD (median) estimator provides a
roughly similar estimate, cf. column 2. Turning to the IV estimate in column 3, where outages
are instrumented by lightning density, we find a considerably larger point estimate: a one log
point change in the number of outages during a typical month leads to a reduction in average
annual growth of GDP per capita of about two percentage points. Put differentially, an increase
in outages by one standard deviation (about 0.85 log points, or approximately 2.3 outages)
instigates a reduction in growth of about 1.5 percentage points, or slightly less than one standard
deviation in growth in our sample (std. dev. of adjusted growth is approximately 1.7%). Of

7
course, this is the total effect of outages, which may work through a number of more proximate
channels.
[Table 1 about here]
Figure 1 pictures the correlation between the exogenous component of outages and economic
growth. Inspection of the figure reveals that Congo (Democratic Republic) and Liberia are
potential outliers. Yet excluding them makes no difference to the IV estimate in column 3 of the
table (coeff. = -0.016, std. err. = 0.007).
[Insert Figure 1 about here]
So far we have said little about statistical significance. However, inspection of Table 1 reveals
that OLS and LAD estimates are insignificant at conventional levels, whereas IV estimates are
significant at five percent or better. This confirms that outages are endogenous in column 1 and 2
(column 4 and 5, respectively). Moreover, our IV estimates are not plagued by weak instrument
issues, as can be seen from the weak instrument statistics reported in the table.
As alluded to above, a potential concern with our identification strategy is that prices of natural
resources surged during the period 1995-2007. If lightning is correlated with the presence of
natural resources, the exclusion restriction is jeopardized. To explore this possibility we re-
estimate column 3 of Table 1 with two resource dummies, taken from Arbache and Page (2009).
The first is an oil exporter dummy, which is coded as one if net oil exports make up 30 percent

8
or more of total exports. The oil exporters are Angola, Cameroon, Chad, Congo (Rep.),
Equatorial Guinea, Gabon, Nigeria, and Sudan. Côte d’Ivoire is also producing oil, but its net
exports of oil are still low. The second dummy, which is a dummy indicating whether the
country is resource rich, takes the value one for Angola, Botswana, Cameroon, Chad, Congo
(Dem. Rep.), Congo (Rep.), Equatorial Guinea, Gabon, Guinea, Namibia, Nigeria, Sao Tome and
Principe, Sierra Leone, Sudan, and Zambia. As is evident from columns 1 and 2 of Table 2,
including these measures one at a time does not change any of our results. In the Appendix we
show that our IV results are robust to the inclusion of a list of alternative natural resource
variables.
[Table 2 about here]
Another potential concern is that lightning picks up influences from factors such as coastal
access, precipitation, temperature, and absolute latitude. To control for coastal access, we
employ a coastal dummy taken from Arbache and Page (2009). The other climatic variables are
from Yale University’s Geographically based Economic (G-Econ) data version 3.4.5 As is
evident from columns 4-7, including these measures one at a time does appear to change any of
our results. This conclusion, however, is premature. The lightning instrument turns weak in
columns 1-2, 4 and 6. We therefore turn to the Anderson-Rubin (AR) statistic, which is robust to
weak instruments. The AR statistic tests the null that the endogenous variable is zero, a null
5 Data are available at http://gecon.yale.edu. Absolute latitude is measured in degrees, temperature is average annual
level 1980‐2008, and precipitation is average annual level 1980‐2008.

9
which we always reject at the five percent level in all columns. Thus, our IV results are robust to
the inclusion of key geography variables.
4. Conclusion
In this paper we ask by how much power outages have affected Africa’s recent growth
experience. Our estimates suggest that if all African countries were to experience South Africa’s
power quality, the continent’s average annual rate of real GDP per capita growth would have
been increased by 2 percentage points and, measured by the coefficient of variation, the cross-
country variation in growth rates would have been reduced by around 20%. These numbers, we
believe, underscore the importance of solving the power crisis in Africa.
Acknowledgements: We thank Nikolaj Malchow-Møller and Peter Sandholt Jensen for useful
comments.
References
Achen, Christopher H., 2005. Let’s Put Garbage-Can Regressions and Garbage-Can Probits
Where They Belong, Conflict Management and Peace Science 22, 327-339
Andersen, T., Bentzen, J., Dalgaard, C.-J., Selaya, P., 2011a. Does the Internet Reduce
Corruption? Evidence from U.S. States and across Countries. World Bank Economic Review 25,
387-417
Andersen, T., Bentzen, J., Dalgaard, C.-J., Selaya, P., 2011b. Lightning, IT Diffusion and
Economic Growth across US States. Review of Economics and Statistics (Forthcoming)
Arbache, J., Page, J., 2009. How Fragile is Africa’s Recent Growth? Journal of African
Economies 19, 1-24

10
Aschauer, D., 1989. Is Public Expenditure Productive? Journal of Monetary Economics 23, 177–200
Chisholm, W., Cummins, K., 2006. On the Use of LIS/OTD Flash Density in Electric Utility
Reliability Analysis. Proceedings of the LIS International Workshop, MSFC, Huntsville, AL.
Sept.
Deaton, A., 2010. Instruments, Randomization and Learning about Development. Journal of
Economic Literature 48, 424-455
Dinkelman, T., 2011. The Effects of Rural Electrification on Employment: New Evidence from
South Africa, American Economic Review 101, 3078-3108
Eberhard, A., Foster, V., Briceño-Garmendia, C., Ouedraogo, F., Camos, D., Shkaratan, M.,
2008. Underpowered: The State of the Power Sector in Sub-Saharan Africa. AICD Background
Paper 6, World Bank
Henderson, V., Storeygard, A., Weil, D., 2011. Measuring Economic Growth from Outer Space.
American Economic Review (Forthcoming)
International Monetary Fund, 2008. Regional Economic Outlook: Sub-Saharan Africa. April,
Washington D.C.
Jimenez, E., 1995. Human and Physical Infrastructure: Public Investment and Pricing Policies in
Developing Countries. In Handbook of Development Economics. Vol.3B. ed. J. Behrman and T.
N. Srinivasan, 2773–2843. Amsterdam: Elsevier Science, North-Holland
Jones, C., 2011. Intermediate Goods and Weak Links in the Theory of Economic Development.
American Economic Journal: Macroeconomics 3, 1-28
McGragnaghan, M., Gunther, E., Laughner, T., 2002. Correlating PQ disturbances with lightning
strikes. Power Quality Magazine 67, 8-13
Mswane, L., Gaunt, C., 2005. Lightning performance improvement of the Swaziland electricity
board transmission system (66kV & 132kV lines) - results of the pilot project. Power
Engineering Society Inaugural Conference and Exposition in Africa 2005 IEEE, 364-370
World Bank, 2008. Africa Development Indicators 2007. International Bank for Reconstruction
and Development

11
Figure 1: Scatter plot of the regression corresponding to column 3, Table 1.
Cape Verde
Mauritius
Mauritania
NigerKenya
Senegal
Mali
Namibia
Chad
Gambia, The
Eritrea
Mozambique
Botswana
Tanzania
Malawi
Guinea-Bissau
Ethiopia
South Africa
Swaziland
Zambia
Burkina Faso
Madagascar
Benin
Nigeria
Cote d'Ivoire
Rwanda
Angola
Ghana
Burundi
Uganda
Togo
Lesotho
Guinea
Liberia
Sierra Leone
Cameroon
Gabon
Congo, Rep.
Congo, Dem. Rep.
-.03
-.01
.01
.03
.05
-.5 0 .5 1coef = -.01825316, (robust) se = .00764148, t = -2.39
The x-axis plots the exogenous component of power outages, while the y-axis plots growth in
real GDP per capita.
12
Table 1. Outages and Economic Growth in Sub-Saharan Africa
(1) (2) (3) (4) (5) (6)
Estimation method OLS LAD IV OLS LAD IV
Outages -0.004 -0.004 -0.018 -0.005 -0.005 -0.020
(0.003) (0.005) (0.008) (0.004) (0.006) (0.009)
GDP per capita, 1995
-0.003 -0.008 -0.007
(0.004) (0.006) (0.004)
Constant 0.035 0.034 0.064 0.058 0.091 0.118
(0.007) (0.011) (0.018) (0.034) (0.047) (0.041)
Observations 39 39 39 39 39 39
K-P F-Statistic
13.33
11.93
A-R Wald test (p-value)
0.014
0.010
R-squared 0.038
0.061
Notes: The dependent variable is adjusted average annual growth in (chained PPP) GDP per
capita, 1995-2007. All standard errors (robust) are reported in parenthesis below the point
estimate. LAD is reported with bootstrapped standard errors, replications 500. K-P F-Statistic
refers to the Kleibergen-Paap statistic, and A-R Wald Test refers to the Anderson-Rubin test,
where H0 is the insignificance of the instrumented variable.

13
Table 2. Robustness to natural resources and geography/climate variables
(1) (2) (3) (4) (5) (6)
Estimation method IV IV IV IV IV IV
Outages -0.031 -0.029 -0.021 -0.038 -0.018 -0.036
(0.010) (0.014) (0.008) (0.020) (0.008) (0.026)
Oil exporter 0.025
(0.012)
Resource rich
0.013
(0.013)
Coastal
-0.000
(0.007)
Precipitation
1.5x10⁻⁵
(1.3x10⁻⁵
)
Temperature
0.001
(0.001)
Absolute latitude
-0.002
(0.001)
Constant 0.085 0.082 0.069 0.091 0.028 0.119
(0.022) (0.027) (0.017) (0.035) (0.021) (0.071)
Observations 38 38 38 38 38 38
K-P F-Statistic 8.62 6.83 13.80 3.95 17.09 2.59
A-R Wald test (p-value) 0.000 0.000 0.001 0.024 0.024 0.039
Notes: The dependent variable is adjusted average annual growth in (chained PPP) GDP per
capita, 1995-2007. All standard errors (robust) are reported in parenthesis below the point
estimate. The dummies indicating whether a country is an oil exporter, resource rich, or a coastal
nation are taken from Arbache and Page (2009). Precipitation, temperature and absolute latitude
are from Yale University’s G-Econ database version 3.4. Data are available at
http://gecon.yale.edu.

14
Appendix
Table A. Robustness to natural resource rents
(1) (2) (3) (4) (5) (6)
Estimation method IV IV IV IV IV IV
Outages -0.019 -0.027 -0.019 -0.018 -0.025 -0.027
(0.009) (0.013) (0.008) (0.008) (0.011) (0.012)
Coal rents -0.573
(0.353)
Forest rents
0.191
(0.132)
Mineral rents
-0.033
(0.041)
Natural gas rents
0.002
(0.002)
Oil rents
0.037
(0.022)
Total resource rents
0.041
(0.024)
Constant 0.066 0.077 0.066 0.063 0.076 0.078
(0.019) (0.024) (0.018) (0.018) (0.021) (0.023)
Observations 39 39 38 39 39 39
K-P F-Statistic 12.21 6.78 12.23 12.72 8.03 7.68
A-R Wald test (p-value) 0.018 0.005 0.018 0.018 0.008 0.003
Notes: The dependent variable is adjusted average annual growth in (chained PPP) GDP per
capita, 1995-2007. All standard errors (robust) are reported in parenthesis below the point
estimate. Natural resource rents (in 2007) are the difference between the value of production at
world prices and their total costs of production, with rents expressed as a share of GDP. All
resource rent variables are taken from World Development Indicators (2011).