Embed Size (px)
Citation preview

© Siemens AG, 2010 All Rights Reserved
Power Management Solutions Exploring Hidden Cost Opportunities
Stephen BarkerHead Of Energy Efficiency & Environmental CareSiemens plc, Industry Sector UK
Agenda
Introduction to power quality
Financial implications of power management
Regulatory and standardisation issues
Application hints
Examples
Voltage optimisation – fact or fiction
Power management implementations
Joint Q&A session
Users are increasingly experiencing increased costs caused by “poor power quality” – often without realising!
Power quality issues can also put the facility at risk of spurious down time and systems failures – with their attendant costs
Correcting power quality issues can..Reduce direct energy costsImprove system reliability Reduce lost productivity caused by systems failureEliminate the risk of contravening UK regulations
Typical remedial measures often provide payback within 1 – 2 years with ongoing savings thereafter.
Rigorous assessment and design is essential…..
Introduction To “Power Quality”
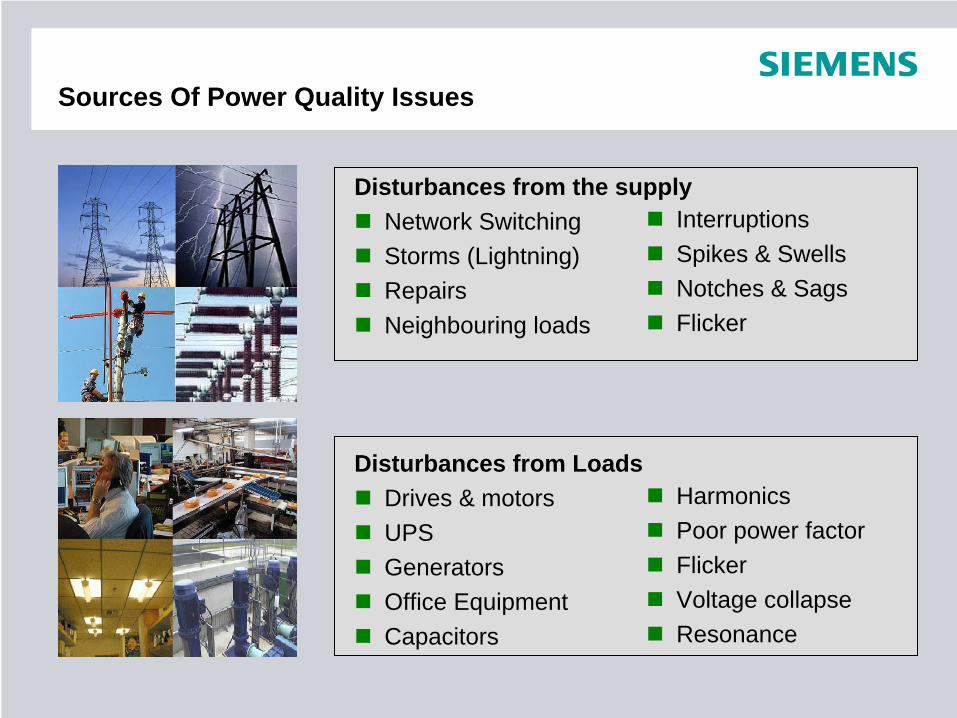
Disturbances from the supplyNetwork SwitchingStorms (Lightning)RepairsNeighbouring loads
Disturbances from LoadsDrives & motorsUPSGeneratorsOffice EquipmentCapacitors
InterruptionsSpikes & SwellsNotches & SagsFlicker
HarmonicsPoor power factorFlickerVoltage collapseResonance
Sources Of Power Quality Issues
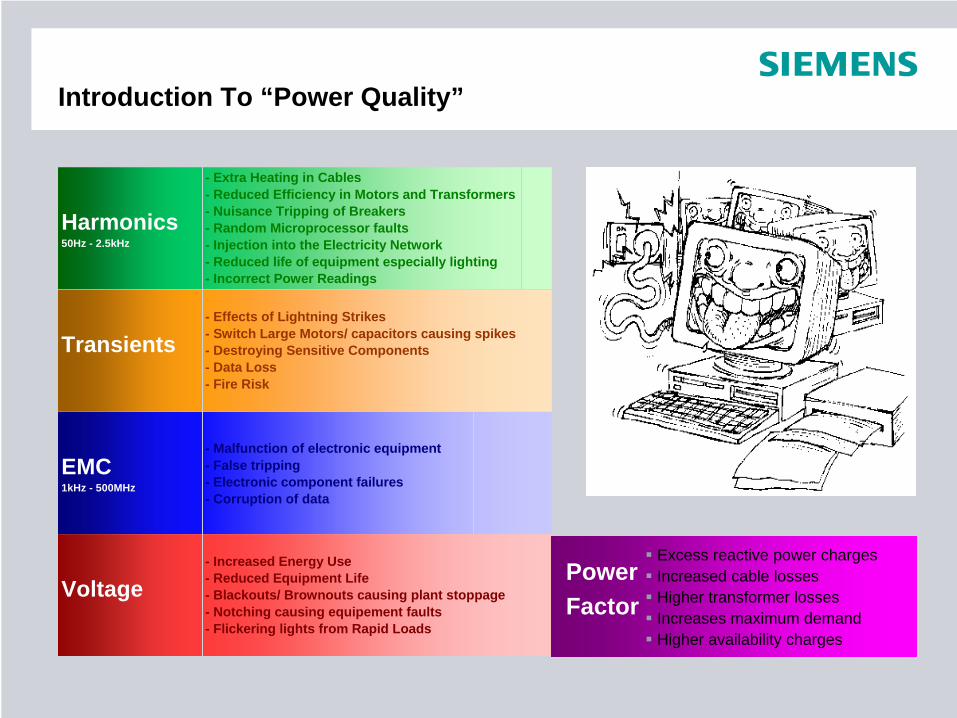
Harmonics50Hz - 2.5kHz
- Extra Heating in Cables- Reduced Efficiency in Motors and Transformers- Nuisance Tripping of Breakers- Random Microprocessor faults- Injection into the Electricity Network- Reduced life of equipment especially lighting- Incorrect Power Readings
Transients- Effects of Lightning Strikes- Switch Large Motors/ capacitors causing spikes- Destroying Sensitive Components- Data Loss- Fire Risk
Voltage- Increased Energy Use- Reduced Equipment Life- Blackouts/ Brownouts causing plant stoppage- Notching causing equipement faults- Flickering lights from Rapid Loads
EMC1kHz - 500MHz
- Malfunction of electronic equipment- False tripping- Electronic component failures- Corruption of data
Power Factor
Excess reactive power chargesIncreased cable lossesHigher transformer lossesIncreases maximum demand Higher availability charges
Introduction To “Power Quality”

HeatProduction
Downtime
Reduced
Component life
Increased Electricity
Consumption
Hidden costs of Power Quality

Power Factor
Power factor is a measure of how effectively the input current translates into active power (kW)
The supply and distribution equipment must be sized for the total (apparent) rating
low power factors waste energy, attract additional charges and waste equipment ratings
Many sites have neglected power factor correction in recent years
•
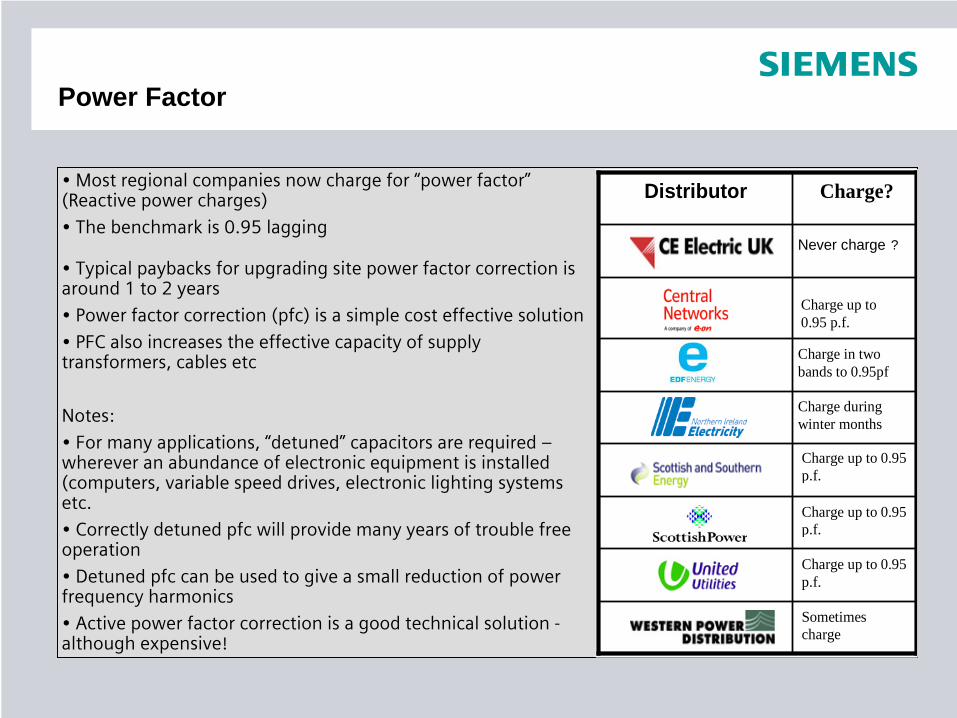
Most regional companies now charge for “power factor”
(Reactive power charges)
• The benchmark is 0.95 lagging
•
Typical paybacks for upgrading site power factor correction is around 1 to 2 years
• Power factor correction (pfc) is a simple cost effective solution
•
PFC also increases the effective capacity of supply transformers, cables etc
Notes:
•
For many applications, “detuned”
capacitors are required –
wherever an abundance of electronic equipment is installed (computers, variable speed drives, electronic lighting systems etc.
•
Correctly detuned pfc
will provide many years of trouble free operation
•
Detuned pfc
can be used to give a small reduction of power frequency harmonics
•
Active power factor correction is a good technical solution -
although expensive!
Power Factor
Sometimes charge
Charge up to 0.95 p.f.
Charge up to 0.95 p.f.
Charge up to 0.95 p.f.
Charge during winter months
Charge in two bands to 0.95pf
Charge up to 0.95 p.f.
Never charge
Charge? Distributor
?

A facility in the South East of England purchases their electricity from Southern Electric, but is connected to the local EDF network.
• The facility has a Maximum Demand (M.D.) of 3, 500kVA and is currently operating with a Power Factor of 0.79. Installing a 1, 500 kVAr PFC bank increased the power factor to 0.97, saved the company 670 kVA, and 217, 110 kVArh units per month. Based on their current tariff they realised over £16k p.a. total savings:
Reactive Power charge(charged at 0.62p per kVArh excess) - Saving 217, 110 kVArh x 0.0062 x 12 months= £16, 145 p.a.
Total cost of equipment including installationTotalled c. £20, 000
Payback Time = c. 14 months
Furthermore, increasing the pf from 0.79 to 0.97 yielded an increasing available power of an additional 630kW – based on the existing installed assets. This meant the client was able to defer the cost of new transformers and supplies necessary to meet the site requirements for increased power demand.
Power Factor – Example

Power Frequency Harmonics
7th Harmonic
Fundamental
5th Harmonic
Distorted supply current
7th Harmonic
Fundamental
5th Harmonic
Distorted supply currentDistorted supply current
•
Caused by all “non linear”
equipment
(especially electronics) –
such as:
• Televisions & domestic equipment
• Computer equipment
• DC & a.c. drives
• Industrial controls
• Transformers and rotating machines
• Prevalent across industry and commerce
• Create both practical & regulatory issues
• Can be an opportunity to reduce costs
• Consider as part of a systematic approach
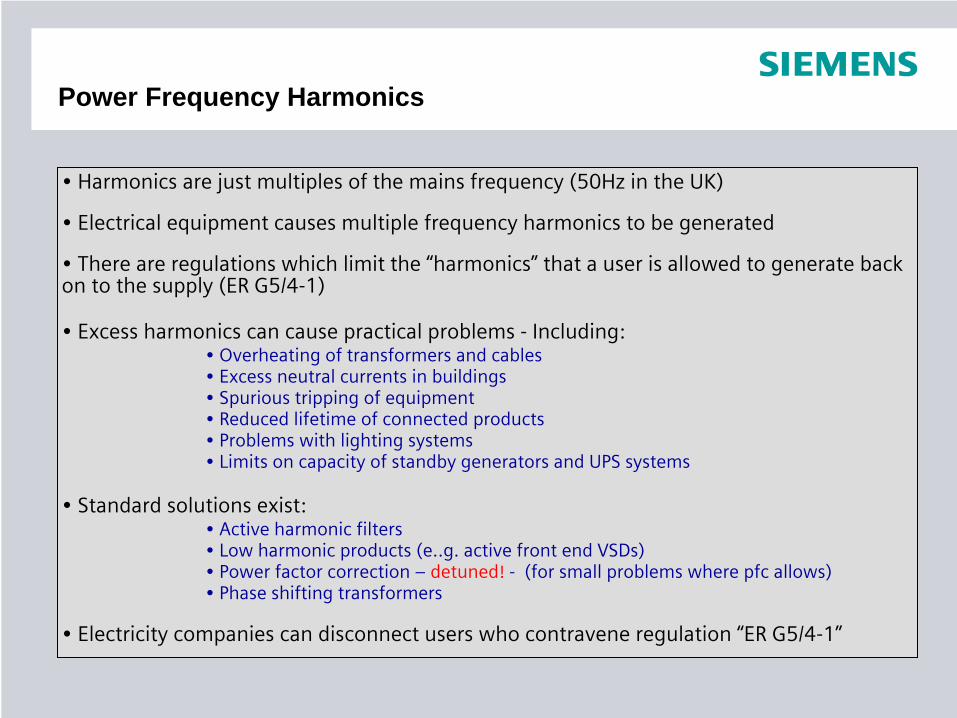
• Harmonics are just multiples of the mains frequency (50Hz in the UK)
• Electrical equipment causes multiple frequency harmonics to be generated
•
There are regulations which limit the “harmonics”
that a user is allowed to generate back on to the supply (ER G5/4-1)
• Excess harmonics can cause practical problems -
Including:• Overheating of transformers and cables• Excess neutral currents in buildings• Spurious tripping of equipment • Reduced lifetime of connected products • Problems with lighting systems• Limits on capacity of standby generators and UPS systems
• Standard solutions exist:• Active harmonic filters• Low harmonic products (e..g. active front end VSDs)• Power factor correction –
detuned!
-
(for small problems where pfc
allows)• Phase shifting transformers
• Electricity companies can disconnect users who contravene regulation “ER G5/4-1”
Power Frequency Harmonics
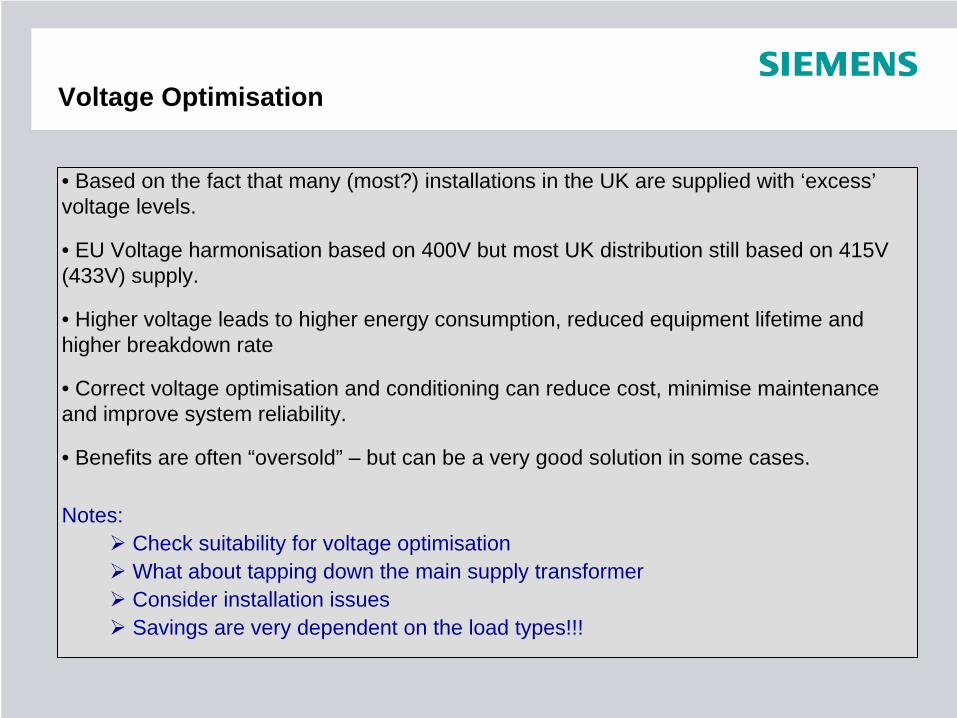
• Based on the fact that many (most?) installations in the UK are supplied with ‘excess’ voltage levels.
• EU Voltage harmonisation based on 400V but most UK distribution still based on 415V (433V) supply.
• Higher voltage leads to higher energy consumption, reduced equipment lifetime and higher breakdown rate
• Correct voltage optimisation and conditioning can reduce cost, minimise maintenance and improve system reliability.
• Benefits are often “oversold” – but can be a very good solution in some cases.
Notes:Check suitability for voltage optimisationWhat about tapping down the main supply transformerConsider installation issuesSavings are very dependent on the load types!!!
Voltage Optimisation

Integration of metering systems, intelligent software – aM&T, can provide:
• Accurate analysis of historical consumption data• Trending• Benchmarking • Energy management analysis tools such as regression etc• Compliance with building regulations metering requirements
Active power management can provide:• Intelligent load shedding for demand reduction• Tariff management – e.g. Triads and maximum demand• Integration of standby generator control • innovative energy reduction topologies with real time harmonic compensation
Power Management Solutions

• Flicker - fast changes electrical loads (e.g. arc welding, DC drives) can cause a problem known as “flicker” – the limits for this are specified in regulation “P28”. A number of companies have been instructed to carry out remedial work or be disconnected. Corrected by high speed reactive compensation.
• Voltages surges or dips can cause equipment outages or failures. Consider correct transient protection.
• Excessive frequency variations will also cause practical problems, nuisance tripping, speed variation of motors etc
• EMC – Electromagnetic compatibility (high frequency disturbances). Good basic equipment designs now but requires effective grounding and shielding techniques. Use correct EMC filtering selected for the environment.
Other issues

• Potential issues can be quickly and effectively identified by a professional site survey
• For regulatory purposes (ER G5/4-1), such surveys must be of 7 days duration and must be done in accordance with prescribed methodology using “compliant” instrumentation.
• Where local practical issues are suspected, “spot measurements” may be taken over a time period that covers typical operation of the building or plant
• A comprehensive report is provided which includes tabular and graphical results and also covers key recommendations and conclusions
• The survey provides a baseline for the optimisation of any necessary remedial measures and allows Siemens to guarantee the solution
Site Surveys – Starting Point For Power Solutions
© Siemens AG, 2010 All Rights Reserved
Stephen BarkerHead Of Energy Efficiency & Environmental CareSiemens plc, Industry Sector UK
Thank You
© Siemens AG, 2010 All Rights Reserved
Mark SmythBusiness Manager –Control Components & System EngineeringIndustry Sector
Princess RoadManchester M20 2UR
Phone: 0161 446 5947E-Mail: [email protected]
Q&A

© Siemens AG, 2010 All Rights Reserved
Dave HolcroftProduct Manager Global ComponentsIndustry Sector Building Technologies Low Voltage
Sharston RoadManchester M22 4RA
Phone: 0161 998 5454Fax: 0161 945 1587Mobile: 0780 882 2778E-Mail: [email protected]
Q&A
Q&A – Power Management Solutions

What are (not) Voltage Optimisers
NOT substitute for full power factor correction equipment. De-tuned required for certain applications
NOT a full harmonic filter solution to satisfy G5/4-1
They ARE effective way of optimising your local supply voltage
“A 230V linear appliance used on a 240V supply will take 4.3% more current and will consume almost 9% more energy …”and“…only achieve 55% of its rated life”Source: Extracts from IEE 16th edition guide BS7671
“A 230V linear appliance used on a 240V supply will take 4.3% more current and will consume almost 9% more energy …”and“…only achieve 55% of its rated life”Source: Extracts from IEE 16th edition guide BS7671
UK max. voltage
253VUK average voltage
242V
UK nominal voltage
230V
Optimum voltage
220V
UK min. voltage
207V
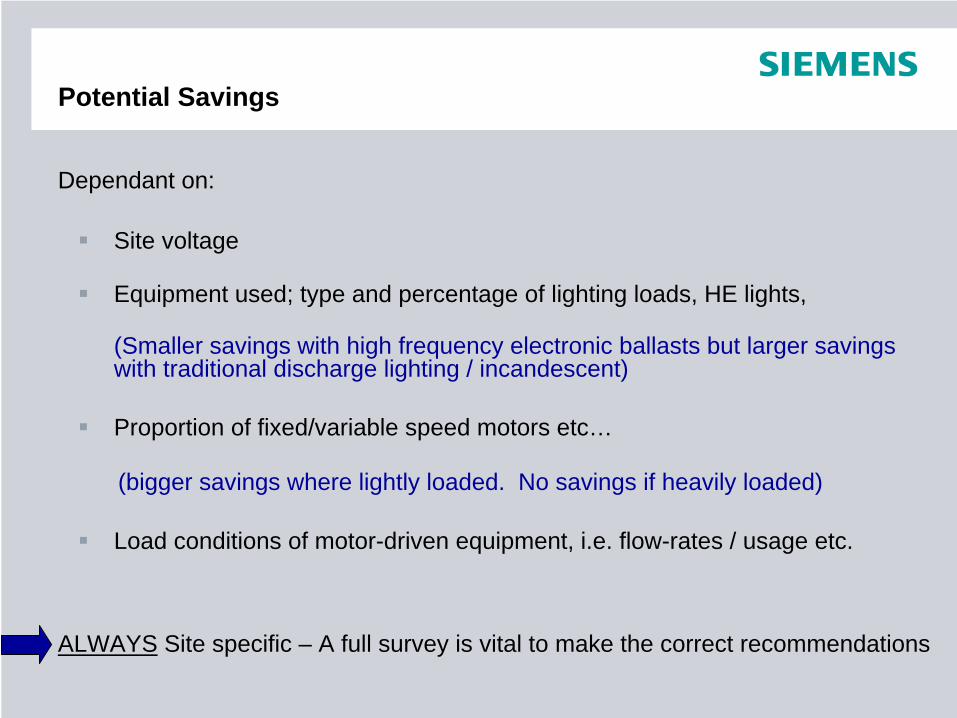
Potential Savings
Dependant on:
Site voltage
Equipment used; type and percentage of lighting loads, HE lights,
(Smaller savings with high frequency electronic ballasts but larger savings with traditional discharge lighting / incandescent)
Proportion of fixed/variable speed motors etc…
(bigger savings where lightly loaded. No savings if heavily loaded)
Load conditions of motor-driven equipment, i.e. flow-rates / usage etc.
ALWAYS Site specific – A full survey is vital to make the correct recommendations
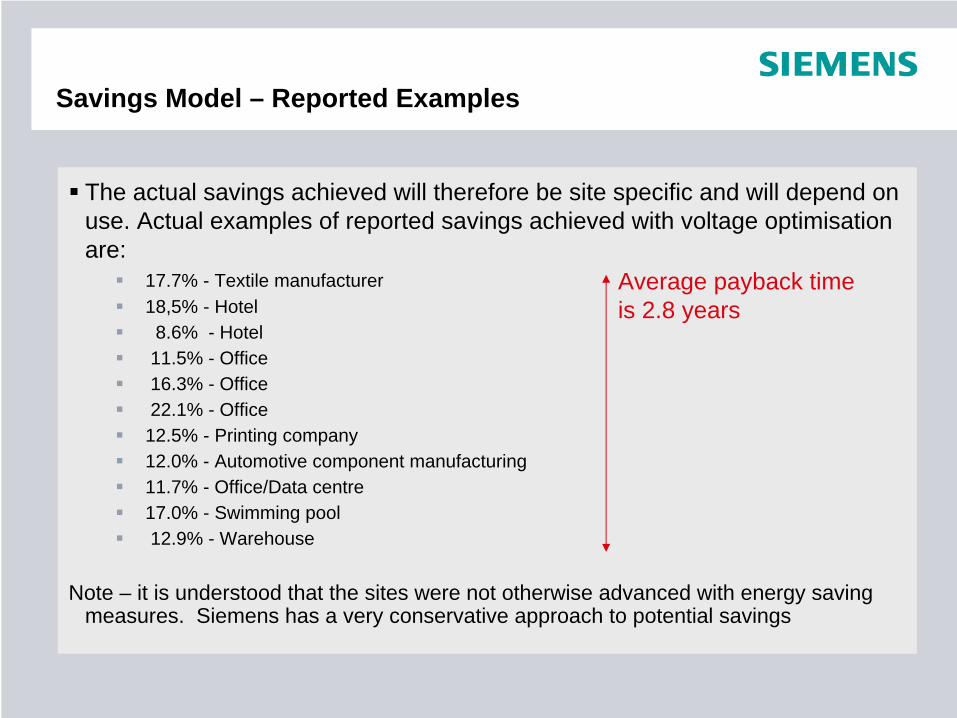
Savings Model – Reported Examples
The actual savings achieved will therefore be site specific and will depend on use. Actual examples of reported savings achieved with voltage optimisation are:
17.7% - Textile manufacturer18,5% - Hotel 8.6% - Hotel 11.5% - Office16.3% - Office22.1% - Office
12.5% - Printing company12.0% - Automotive component manufacturing11.7% - Office/Data centre17.0% - Swimming pool12.9% - Warehouse
Note – it is understood that the sites were not otherwise advanced with energy saving measures. Siemens has a very conservative approach to potential savings
Average payback time is 2.8 years
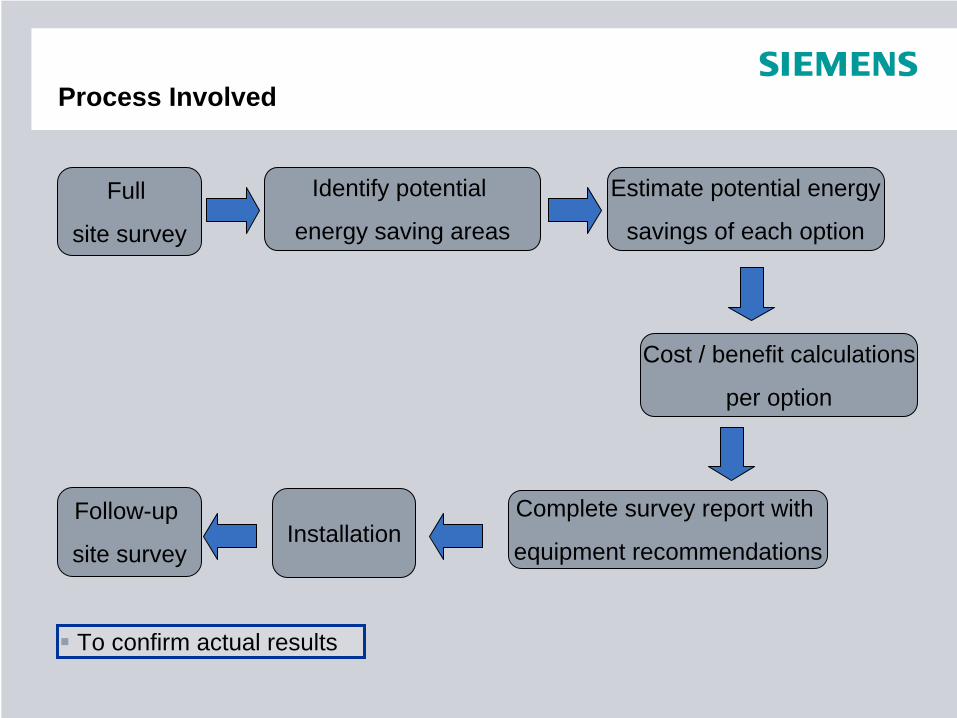
Process Involved
Full
site survey
Identify potential
energy saving areas
Estimate potential energy
savings of each option
7 day, full power quality survey
In line with regulations ER G5/4-1
Complete power data – kW / kVA /kVAr demand
Power factor measurements
Harmonic distortion (voltage and current to 50th and includes THD)
Voltage profiles over the seven days
Indications of the types of load connected
Initial feedback on feasibility of voltage optimisation
Cost / benefit calculations
per option
Complete survey report with
equipment recommendationsInstallation
Follow-up
site survey
To confirm actual results
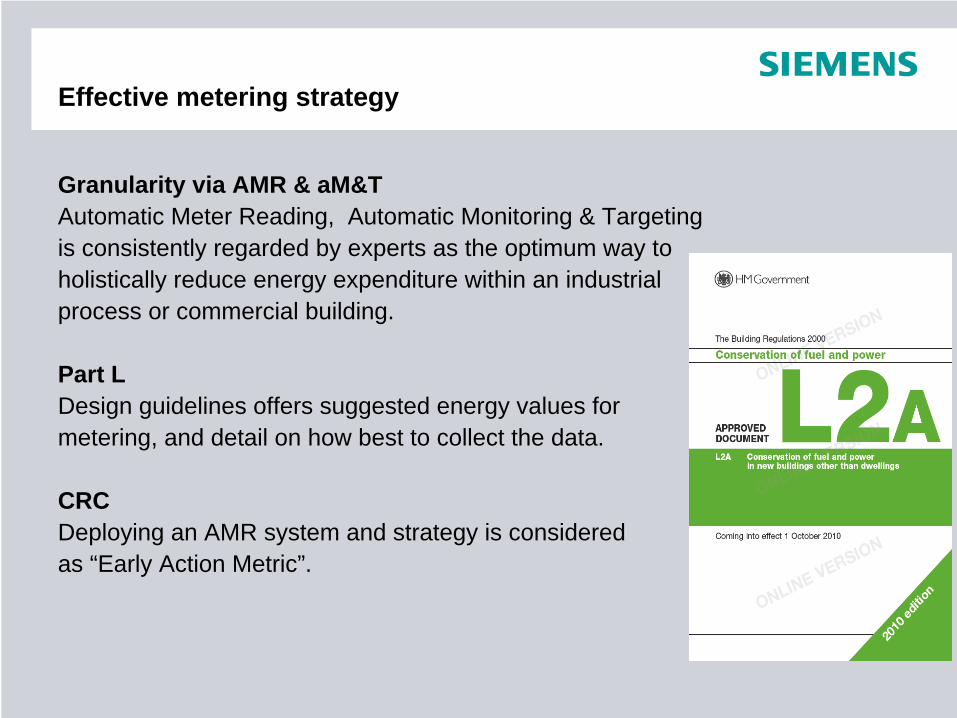
Effective metering strategy
Granularity via AMR & aM&T Automatic Meter Reading, Automatic Monitoring & Targeting is consistently regarded by experts as the optimum way to holistically reduce energy expenditure within an industrial process or commercial building.
Part L Design guidelines offers suggested energy values for metering, and detail on how best to collect the data.
CRC Deploying an AMR system and strategy is considered as “Early Action Metric”.

AMR Automatic meter reading is a passive simplex (half duplex) system, but will still identify areas for energy saving, and qualify as a CRC benefit.
However…A dynamic management system is based on duplex communications, thus adding a layer of control, therefore the following is possible:
Load shedding as a result of (excessive) peak loading.Switching in additional energy sources based on historical / system data.Minimal system downtime as a result of tripped devices (overload avoidance).
Monitoring or management

Options for energy management
PC Based Host / ManagedAutomation Based
Each scheme has both it’s merits and a position within the market place
has a solution for each requirement
Locally Embedded
Utilising existing installed automation architecture
Desire to correlateProcess & Energy data
SCADA & integration into ERP
One off procurement costs (amortisation)
Locally Embedded
Wide ranging connectivity options simple copper cable, Fieldbus to Ethernet
BMS Integration possibilities
One off procurement costs (amortisation)
Internet structure
Discrete managed reports
(Possibly) lower procurement costs
Vendors are generally “niche” energy specialists
Subscription fees for system and possibly metering components

Architecture For Energy Management (Building)
WLAN
Copper Cable
Fieldbus
Ethernet
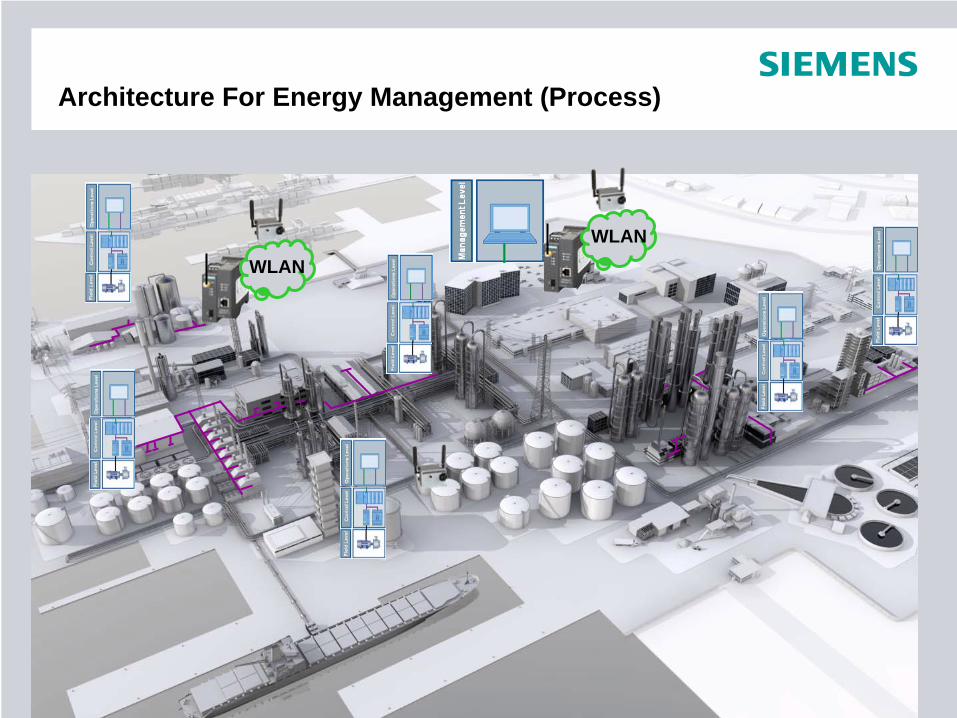
Architecture For Energy Management (Process)
WLANWLAN

Q&A – Power Management Solutions
© Siemens AG, 2010 All Rights Reserved
Power Management Solutions Exploring Hidden Cost Opportunities