Embed Size (px)
Citation preview
POWER MANAGEMENT FOR MICROBIAL FUEL CELLS
by
Avinash Shantaram
A thesis submitted in partial fulfillment of the requirements for the degree
of
Master of Science
In
Environmental Engineering
MONTANA STATE UNIVERSITY
Bozeman, Montana
April 2005

@COPYRIGHT
by
Avinash Shantaram
2005
All Rights Reserved
ii
APPROVAL
of a thesis submitted by
Avinash Shantaram
This thesis has been read by each member of the thesis committee and has been found to be satisfactory regarding content, English usage, format, citations, bibliographic style and consistency, and is ready for submission to the college of Graduate Studies.
Dr. Z. Lewandowski
Approved for the Department of Chemical Engineering
Dr. Ron Larsen
Approved for the College of Graduate Studies
Dr. Bruce McLeod

iii
STATEMENT OF PERMISSION TO USE
In presenting this thesis (paper) in partial fulfillment of the requirements for a
master’s degree at Montana State University, I agree that the Library shall make it
available to borrowers under rules of the Library.
If I have indicated my intention to copyright this thesis (paper) by including a
copyright notice page, copying is allowable only for scholarly purposes, consistent
with “fair use” as prescribed in the U.S. Copyright Law. Requests for permission for
extended quotation from or reproduction of this thesis in whole or in parts may be
granted only by the copyright holder.
Avinash Shantaram
April 14, 2005

iv
ACKNOWLEDGEMENTS
I would like gratefully acknowledge the financial support provided by grant
N-00014-02-1-0567 from the US Office of Naval Research. I also thank my
committee members: Dr. Zbigniew Lewandownski, Dr. Ron Larsen, Dr. Haluk
Beyenal and Andy Olson for their support guidance and interest in this research
project. I would also like to thank Mark Ivey from the electrical and computer
engineering department at Montana State University who provided me with much
help at the start of this project.
Completion of this project t would have been impossible without the help and
support of the staff and students at the Center for Biofilm Engineering. I would also
like to thank all the students that worked in the 337 lab at the CBE over the past three
years; without whose help I would not have been able to complete this project.
v
TABLE OF CONTENTS
1. INTRODUCTION 1 Purpose 1
Prior Research in Microbial Fuel Cells 4 Prior Research in Environmental Microbial Fuel Cells 5
Proposed Environmental Fuel Cell 5 Hypothesis 7
Problems Encountered 9 Problem#1: Storage of Energy 9 Problem#2: Increasing and Controlling Electric Potential 9 Problem#3: Restarting the System 10 Proposed Power Management System 10 Solution to the Problems 11 Problem#1 11 Problem#2 13 Problem#3 15 Applications 16 2. MATERIALS AND METHODS 18 Components of the System 18 The Cathode 19 The Anode 20 Ultracapacitor 21 DC-DC Converter 22 Voltage Comparator 26 Temperature Sensor 27
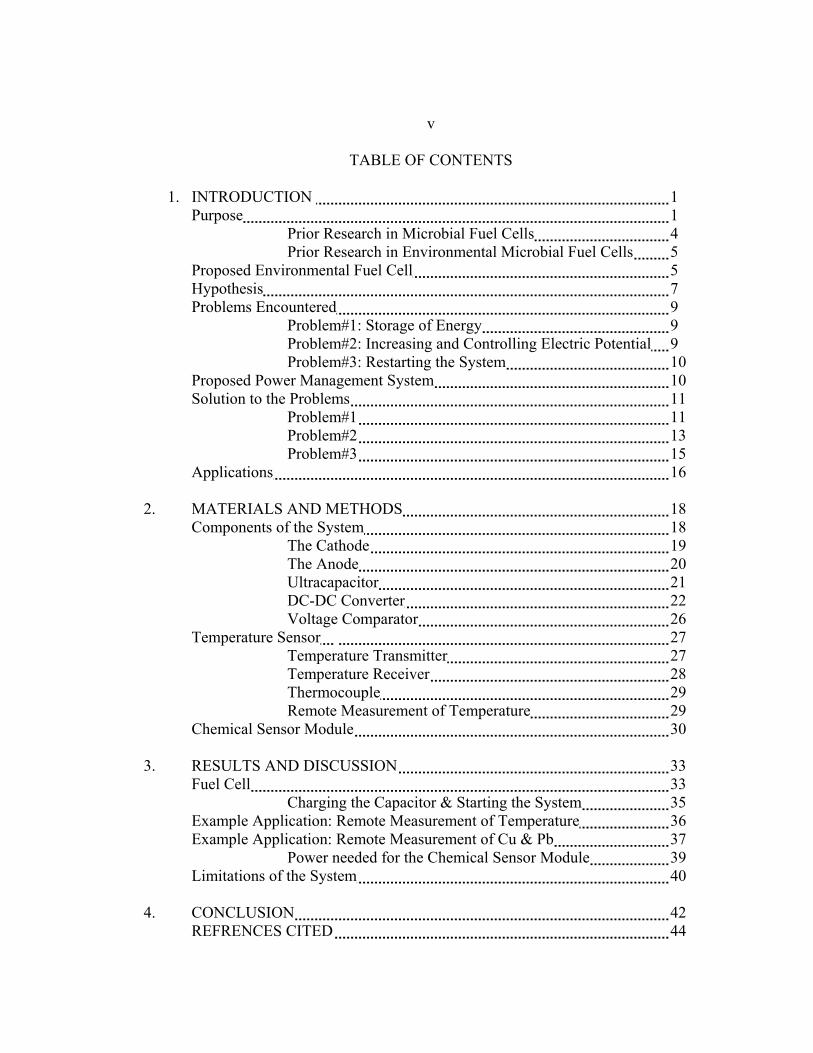
Temperature Transmitter 27 Temperature Receiver 28 Thermocouple 29 Remote Measurement of Temperature 29 Chemical Sensor Module 30 3. RESULTS AND DISCUSSION 33
Fuel Cell 33 Charging the Capacitor & Starting the System 35
Example Application: Remote Measurement of Temperature 36 Example Application: Remote Measurement of Cu & Pb 37
Power needed for the Chemical Sensor Module 39 Limitations of the System 40 4. CONCLUSION 42 REFRENCES CITED 44
vi
LIST OF FIGURES
Figure Page 1.1 Sensor and Telemetry System Powered By a MFC 8 1.2 Power Management System Needed for an Environmental MFC 11 1.3 Cross-section of an Ultracapacitor 13 1.4 Basic Configuration of a Boost Switching Regulator 14 2.1 Block Diagram of a Telemetry System Powered by a MFC 18 2.2 Picture of Cathodic Electrodes Deployed in Hyalite Creek 19 2.3 Four Sacrificial Anodes Bound Together with a Tie-Strap 20 2.4 Picture of Ultracapacitor Implemented 21 2.5 Picture of the MAX1797evkit used for the Temperature Sensor 22 2.6 Schematic of DC-DC Converter for a 3.3V 23 2.7 Schematic of DC-DC Converter for a 5V 25 2.8 RFTC4000 Temperature Transmitter 27 2.9 RFC101 Receiver with a Serial Port Interface 28 2.10 Chemical Sensor Transmitter Module 31 2.11 Chemical Sensor Receiver Module 32 3.1 Cell Current versus Anodic Surface Area 34 3.2 Capacitor Charge Curve 35 3.3 Remotely Transferred Temperature Data 36 3.4 Data Transferred from the Chemical Sensor Module 38 3.5 Current Drawn from the Chemical Sensor Module 39
vii
ABSTRACT
Monitoring parameters characterizing water quality, such as temperature, pH and concentrations of heavy metals in natural waters, is often followed by transmitting the data to remote receivers using telemetry systems. Such systems are commonly powered by batteries, which can be inconvenient at times because batteries have a limited lifetime and have to be recharged or replaced periodically to ensure that sufficient energy is available to power the electronics. To avoid these inconveniences, we have designed and tested a self-renewable power source, a microbial fuel cell, which has the potential to eliminate the need for batteries to power electrochemical sensors used to monitor water quality and small telemetry systems used to transmit the data acquired by these sensors. To demonstrate the utility of the microbial fuel cell, we have combined it with low-power, high-efficiency electronic circuitry providing a stable power source for wireless data transmission. To generate enough power for the telemetry system, energy produced by the microbial fuel cell was stored in an ultracapacitor and used in short bursts when needed. Since powering commercial components of electronic circuits requires 5 Volts, and our cell was able to deliver a maximum of 2.1 V, we used a DC-DC converter to increase the potential. The DC-DC converter powered the transmitter, which gathered the data from the sensor and transmitted them to a receiver. To demonstrate the utility of the system, we initially measured temporal variations in temperature followed by the implementation of a chemical sensor to measure copper and lead concentrations in water; this data was then wirelessly transmitted to a remote receiver
1
CHAPTER 1
INTRODUCTION
Chemical sensors have become indispensable components of contemporary
systems monitoring quality of natural waters such as concentrations of mercury and
lead. Once a sensor is deployed and activated, a link to an external data storing
device, such as a computer, is needed. The easiest way to connect these devices is to
hardwire the sensor to a computer/data logger, but in many applications where the
sensors are deployed in remote regions, such a solution is not practical and wireless
communication is recommended.
Purpose
Recent advances in chemical sensors, electronics, and wireless data
transmission have made it possible to monitor water quality remotely and transmit the
data wirelessly using telemetry systems, and such systems have been successfully
deployed and used. A telemetry system provides the means for
transmission/recording of data over a certain distance. This transmission can be in the
form of a wireless link or a hardwire connection. If the data transmission is made
using radio frequency (RF) transmitters the system can be labeled a “Wireless
Telemetry system”. Telemetry systems are used to transmit parameters from various
2
kinds of sensors. For example, chemical sensors combined with telemetry systems
have been used to monitor heavy metals, such as copper and mercury (1-4);
organophosphate nerve agents (5); phenolic compounds; (6) explosive 2,4,6-
trinitrotoluene (TNT); and hydrazine (7). Chemical sensors have also been used to
monitor blood glucose and oxygen concentrations in diabetes patients. Salehi et al.
1996 used a telemetry link to wirelessly transmit the measured parameters to a data
logger. Such telemetry links have been used for human biomonitoring applications
such as heart rate monitoring, blood pressure measurement and various other vital
parameters (Budinger et al. 2003), and to monitor the heart rate and respiration rate of
divers in under water environments (istepanian et a.l. 2002). Telemetry systems were
also popular in tracking movement and monitoring of large scale animals and lambs.
Although combining chemical sensors with telemetry systems is still mostly in
the research phase, some sensors, such as temperature sensors, have been widely
used in such configurations (8), to measure temperature remotely. Sensors that
measure temperature, humidity, pressure changes, pH, wind speed etc. are readily
available from specialized vendors such as Madgetech inc.
Typically, batteries are used to power chemical sensors and telemetry systems.
In some applications where the telemetry system is deployed in remote places
researchers have used solar power, wind power or piezoelectric fibers as alternative
energy sources, each of which have their own advantages and disadvantages. The
obvious disadvantages of solar and wind is the inconsistency of energy generation. In
some applications replacing batteries can be costly, time consuming and impractical.
3
A possible solution to this problem is to use self-renewable power supplies such as
microbial fuel cells, which can operate for a long time using local resources. Such a
power supply is just an alternative, self sustaining power source like solar or wind
power.
Microbial fuel cells cannot operate at extremely low temperatures because
microbial reactions slow as temperature decreases. Currently, we do not know how
the system behaves at low temperatures; this will require long-term testing. However,
it is expected that when the temperature returns to a higher values, the rates of
microbial reactions will increase, and the system would recover. We tested our
system for over one year in the laboratory and in the field, stopped it abnormally to
estimate the effect of interrupted power generation, and every time the system
recharged the capacitor and started to transfer the data once the conditions of normal
operation had been restored.
Microbial fuel cells offer many advantages over batteries as power sources
because they require no recharging. The main problem with using microbial cells is
the small amount of power produced by the cell, which may not be enough to run a
sensor and a transmitter continuously. To some extent this problem can be solved by
increasing the surface area of the electrodes. If it is not possible to increase the
surface area, the system can be operated less frequently using a suitable power
management program; data transmission occurs only when enough energy has been
accumulated. Another advantage of the microbial fuel cell is that even when exposed
to extreme conditions microbial fuel cells can spontaneously recover once these
4
conditions are removed. It is well known that regular batteries lose their efficiency
permanently at very low temperatures, and do not recover when the temperature
returns to normal (27).
Prior Research on Microbial Fuel Cells
A microbial fuel cell (MFC) can be defined as a system that uses
microorganisms to catalyze metabolic or enzyme catalytic energy into electrical
energy (Allen and Bennetto 1993). However most researchers have been hesitant to
pursue this as a viable power option because the power generated by a MFC is
minuscule compared to the other options stated. However for some environmental
monitoring applications where the frequency of data acquisition is not a major
requirement, MFC’s can work out very well. Extensive research toward developing
reliable microbial fuel cells is focused mostly on selecting suitable organic and
inorganic substances that can be used as sources of energy (9). Examples of such
studies: Kim et al. oxidized organics (such as glucose) (10), Liu et al. used various
organic matter in wastewater (11), and Cooney et al. and DeLong et al. used
microbially produced sulfide oxidation as an anodic reaction (12,13). While the
number of possible anodic reactions in microbial fuel cells is practically limitless, the
number of cathodic reactions available in microbial fuel cells is much and they often
are abiotic reactions, such as oxygen reduction (10,11,14-16), ferricyanide reduction
(10,17) and iron reduction (18).
5
Prior Research on Environmental Microbial Fuel Cells
Looking for possible sources of energy for the microbial reactions in
microbial fuel cells deployed in natural waters, some researchers have considered
harvesting energy from marine and freshwater sediments. Reimers et al. and Tender
et al. oxidized reduced substances in the marine bottom sediments near Tuckerton,
NJ, U.S.A. and Raritan Bay, NJ, U.S.A. using graphite electrodes; they reduced
oxygen on the cathode (19,20). Delong and Chandler proposed using microbial fuel
cells deployed in the ocean to operate sensors, and suggested oxidizing microbially
produced sulfide as the anodic reaction and reduction of oxygen as the cathodic
reaction (13).
Proposed Environmental Microbial Fuel Cell
The microbial fuel cell we used in this study consisted of a sacrificial anode
combined with the reduction of biomineralized manganese oxides. The sacrificial
anode was a commercially available slab of a magnesium alloy composed of more
than 99% magnesium; the remaining 1 % were other metals added to control the
dissolution rate. The magnesium in the alloy dissolved according to the following
reaction where E is the equilibrium potential:
Mg Mg2+ + 2e- E’pH=7.2 =-2.105 VSCE (1)
6
As the cathodic reactants we used biomineralized manganese oxides, which
are known to form on microbially colonized noble metals in natural waters. It has
been demonstrated that biomineralized manganese oxides can affect the rates and the
mechanisms of electrochemical reactions (21-23), leading to microbially influenced
corrosion of metals. When corrosion coupons made of 316 L stainless steel were left
immersed in a freshwater creek, the open circuit potential of the coupons increased
from -50 mV to +400 mVSCE (24-26). Shortly after being exposed to the creek water,
the coupons were covered with biomineralized manganese oxide (MnO2). Since the
biomineralized manganese oxide was in direct electrical contact with the stainless
steel, the metal exhibited the dissolution potential of MnO2 , as shown in the
following reactions:
MnO2(s) + H+ +e- ⇒ MnOOH(s) E0=+0.81 VSCE E’pH=7.2 =+0.383 VSCE (2)
MnOOH(s) + 3H+ +e- ⇒ Mn2+ +2H2O E0=+1.26 VSCE E’pH=7.2 =+0.336 VSCE (3)
The overall reaction is:
MnO2(s) +4 H+ +2e- ⇒ Mn2+ +2H2O E0=+1.28 VSCE E’pH=7.2 =+0.360 VSCE (4)
The potentials were calculated assuming that the concentration of Mn2+ was 1
× 10-6 M. As a result of reaction 4, manganese oxides were reduced to divalent
manganese, Mn2+ ,by electrons released from the dissolution of magnesium.
However, since the Mn2+ ions were released within the biofilm of manganese-
7
oxidizing bacteria (MOB) covering the metal surface, the manganese-oxidizing
bacteria reoxidized Mn2+ ions back to manganese oxides (21), thus forming a
recyclable cathodic reactant. This mechanism can lead to a particularly pervasive
form of microbially influenced corrosion of stainless steel, but can be also used as an
efficient cathodic reaction in microbial fuel cells.
Hypothesis
It is our intent to demonstrate that a combined a sacrificial anode with
microbial cathode can generate enough energy to power telemetry systems:
1. Powering an off-the-shelf thermocouple-based temperature sensor.
2. Powering a chemical sensor built by our research team to detect copper and
lead in water.
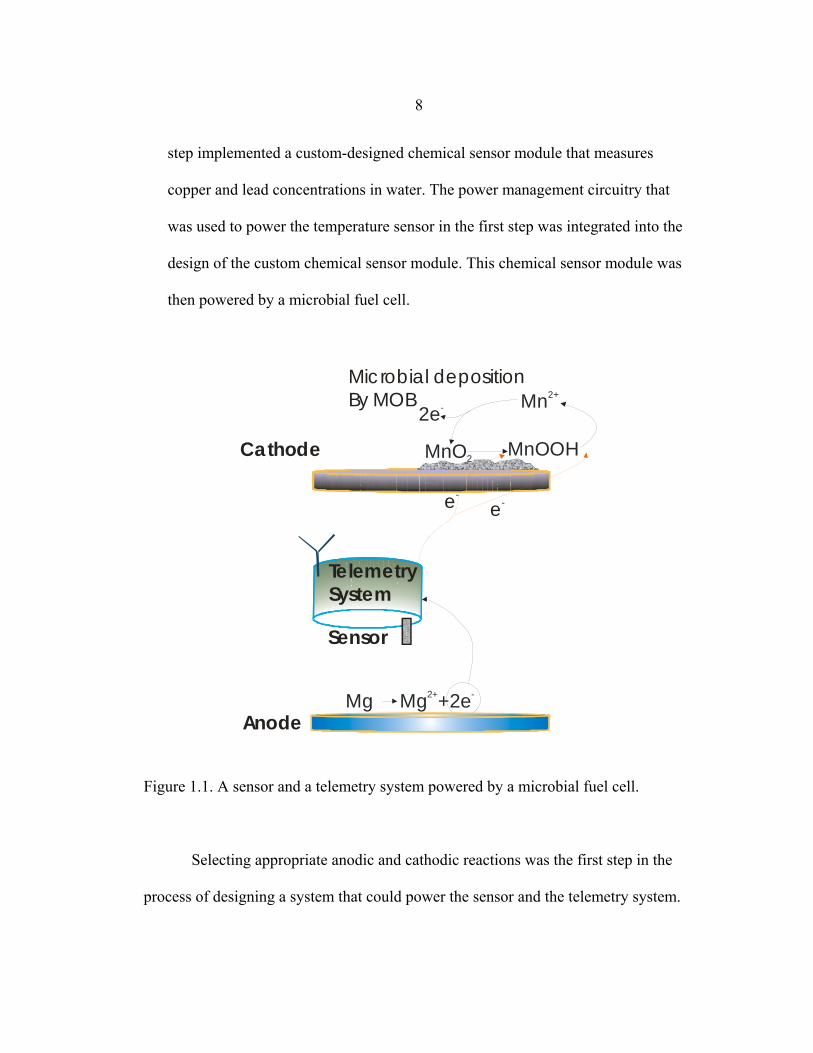
Microbial fuel cells produce small amounts of energy and the goal of this
study was to demonstrate that by implementing appropriate energy management
program the energy generated by such fuel cells was adequate to power chemical
sensors and telemetry systems, such as the one shown in figure 1.1. This study
was carried out in two steps, the first of which showed that it was possible to use a
microbial fuel cell to power a simple telemetry system which was a
thermocouple-based remote temperature monitoring system. This temperature
sensor was purchased from a specialized vendor and power management circuitry
was designed to operate this simple sensor using a microbial fuel cell. The second
8
step implemented a custom-designed chemical sensor module that measures
copper and lead concentrations in water. The power management circuitry that
was used to power the temperature sensor in the first step was integrated into the
design of the custom chemical sensor module. This chemical sensor module was
then powered by a microbial fuel cell.
Mg Mg +2e2+ -
Cathode
Anode
Sensor
MnO2 MnOOH
Mn2+
2e-
Mic robial deposition By MOB
Telemetry System
e-
e-
Figure 1.1. A sensor and a telemetry system powered by a microbial fuel cell.
Selecting appropriate anodic and cathodic reactions was the first step in the
process of designing a system that could power the sensor and the telemetry system.
9
Before the utility of the device could be demonstrated, three problems had to be
solved:
Problems Encountered
Problem #1: Storage of energy
Most solar energy powered systems use the energy generated by the solar
panels to charge a battery pack which then powers the necessary devices. This kind of
system is implemented because the amount of power generated by the solar panels
can vary drastically depending on the intensity of sunlight and the use of battery
packs can compensate for any peak power demands that might be forced on the
system. A microbial fuel cell can be thought of in this same way as it cannot sustain
the continuous operation of electronic devices. As a result the energy generated by the
microbial fuel cell had to be accumulated in devices, such as capacitors, over a certain
period of time and then delivered in short bursts to the sensor and telemetry system.
Problem #2: Increasing and controlling the electrical potential
generated by the microbial fuel cell.
The main drawback of microbial fuel cells was that individual cells could not
be connected in series like we would in batteries to increase the total overall potential.
This is due to the fact that the electrodes are in the same solution (electrolyte),
therefore when we connect them in series we are inherently shorting the anodes and
10
the cathodes leading to a drop in cell potential. Virtually all electronic components
available on the market require working potentials higher than those delivered
directly by microbial fuel cells. In addition, the potential of microbial fuel cells varies
with time. Therefore, the potential developed by the microbial fuel cell needed to be
stepped up and stabilized to power commercially available electronic components.
Problem #3: Restarting the system.
To ensure the sensor and the telemetry system did not drain the microbial fuel
cell due to its high power consumption during operation, we made sure that the
telemetry system was disconnected from the fuel cell until there was enough energy
built up in the storage device for its operation. Because the energy was accumulated
and delivered in short bursts, to generate adequate power, the system had two modes
of operation: sleep mode and the active mode. Each time, before entering the active
mode, the system had to be restarted. This required the implementation of a low
power electronic device to monitor the voltage level of the energy storage device and
to activate the required sensor electronics once there is sufficient energy built up.
Proposed Power Management System
The flowchart shown in figure 1.2 was the proposed power management
system that was needed to run a telemetry system using an environmental fuel cell.
The cathode is 316L stainless steel and the anode is a magnesium alloy. Next is an
11
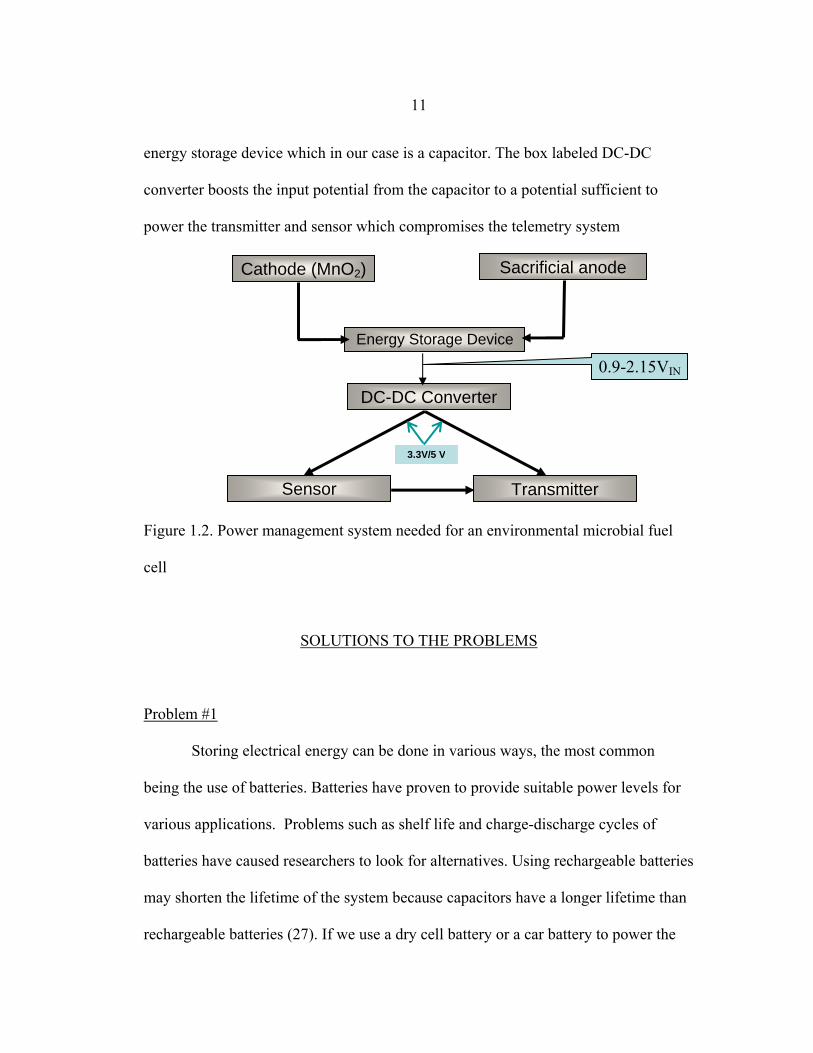
energy storage device which in our case is a capacitor. The box labeled DC-DC
converter boosts the input potential from the capacitor to a potential sufficient to
power the transmitter and sensor which compromises the telemetry system
Figure 1.2. Power management system needed for an environmental microbial fuel
cell
SOLUTIONS TO THE PROBLEMS
Problem #1
Storing electrical energy can be done in various ways, the most common
being the use of batteries. Batteries have proven to provide suitable power levels for
various applications. Problems such as shelf life and charge-discharge cycles of
batteries have caused researchers to look for alternatives. Using rechargeable batteries
may shorten the lifetime of the system because capacitors have a longer lifetime than
rechargeable batteries (27). If we use a dry cell battery or a car battery to power the
Cathode (MnO2) Sacrificial anode
Energy Storage Device
Transmitter
DC-DC Converter
Sensor
3.3V/5 V
0.9-2.15VIN
12
sensor and the telemetry system, they will lose their charge with time, and cannot be
used without recharging; their lifetime is controlled by maintenance requirements and
by leakage current.
The development of high density capacitors known as ultracapacitors or
electro-chemical capacitors work extremely efficient in certain applications. To solve
the first problem, which was the accumulation of the energy generated by the
microbial fuel cell, the energy produced by the microbial fuel cell was stored in an
ultracapacitor. This had many advantages over using rechargeable batteries, such as a
charge-discharge cycle life hundreds of thousands of times greater than that of the
batteries. Also rechargeable batteries require the use of charging/discharging control
circuitry making the system more complicated. The ultracapacitor we used had a
rated lifetime of 10 yrs and a very low leakage current (about 0.28 µA/h at 25oC).
Ultracapacitors have a much lower energy density storage capability compared to
batteries; this is the determining factor in our decision to use ultracapacitors rather
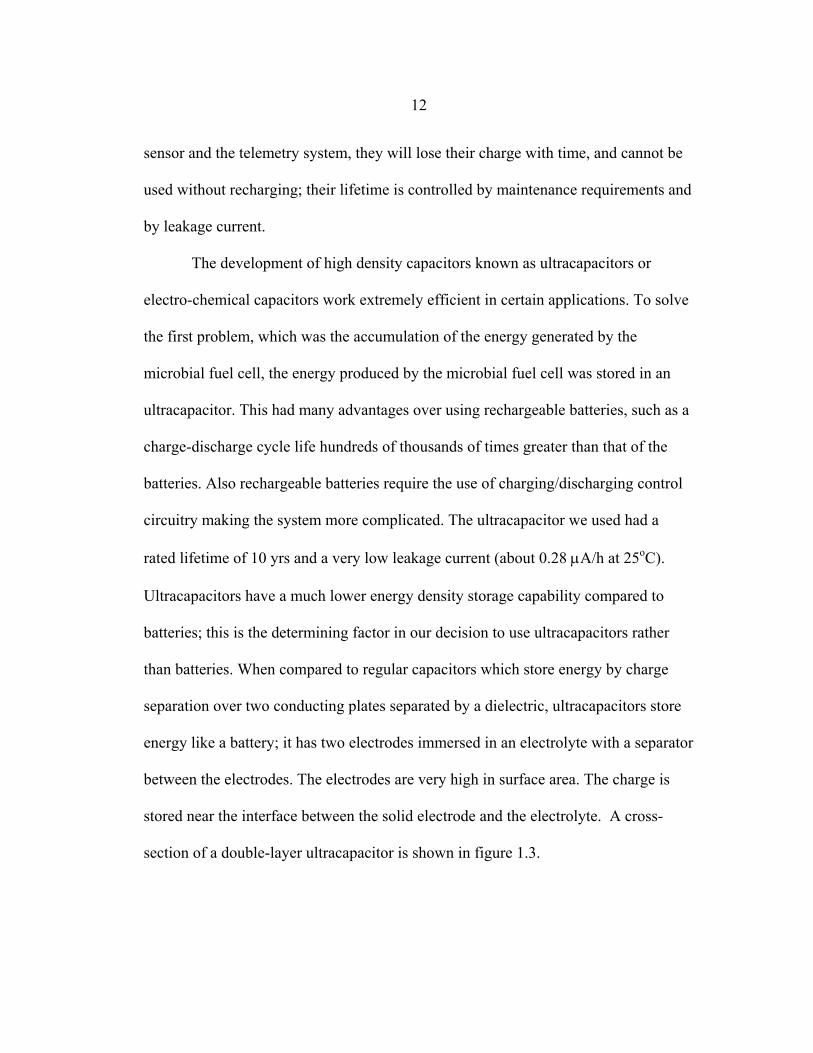
than batteries. When compared to regular capacitors which store energy by charge
separation over two conducting plates separated by a dielectric, ultracapacitors store
energy like a battery; it has two electrodes immersed in an electrolyte with a separator
between the electrodes. The electrodes are very high in surface area. The charge is
stored near the interface between the solid electrode and the electrolyte. A cross-
section of a double-layer ultracapacitor is shown in figure 1.3.
13
Figure 1.3. Crossection of an ultracapacitor adapted from “Ultracapacitors: why, how
and where is the technology”, Andrew Burke 2000
Problem #2
To solve the second problem, which was to increase and maintain the
potential from the microbial fuel cell; we used a DC-DC converter to step up (boost)
the potential of the microbial fuel cell. A DC-DC converter can be used to step up,
step down or invert any input potential to a desired value. DC-DC converters use
switching regulators to carry out the step up, step down (buck) or inverting (buck-
boost) processes. A switching regulator is an electronic circuit which uses an energy
storage device such as a capacitor, inductor or transformer to transfer energy from the
input to output in discrete packets. A constant output voltage is maintained by the
implementation of feedback circuitry. Depending on our need, switching regulators
can be used to step up, step down or invert the output voltage (www.maxim-
ic.com/appnotes.cfm/appnote_number/710). A simple step up switching regulator
configuration is shown in figure 1.4.
Electrode (High surface area particles)
Separator (ionic conductor)
Electrolyte between particles +
-
V
14
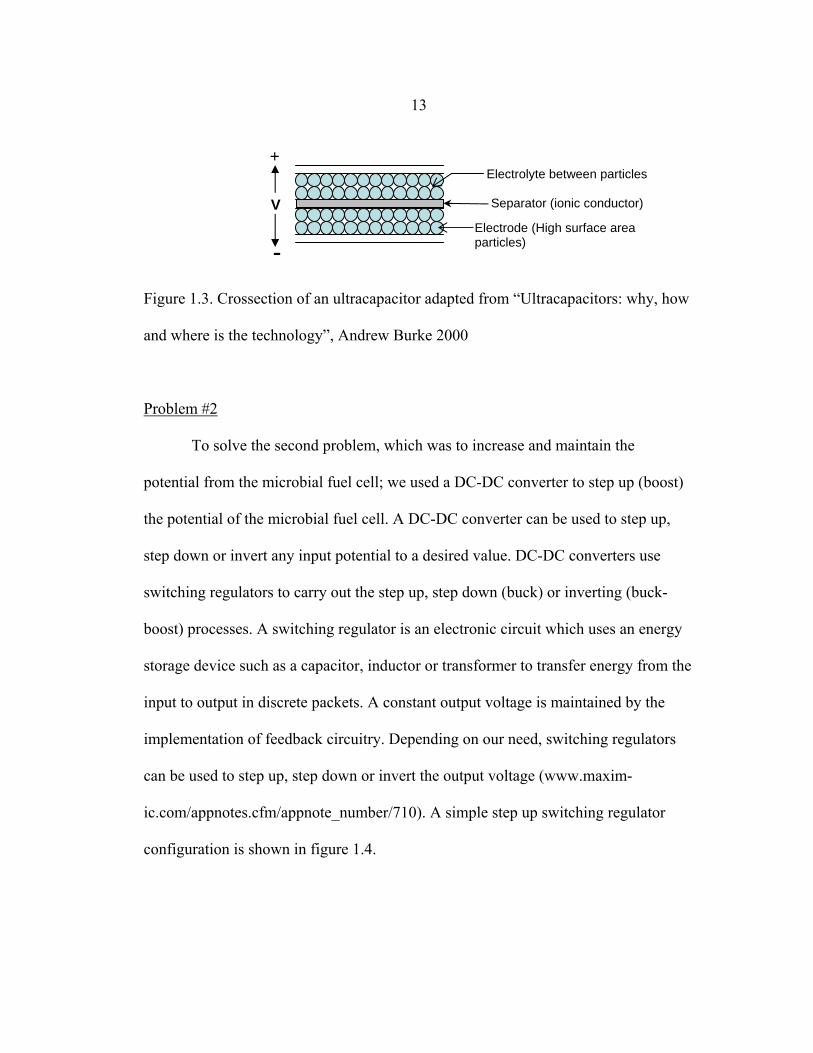
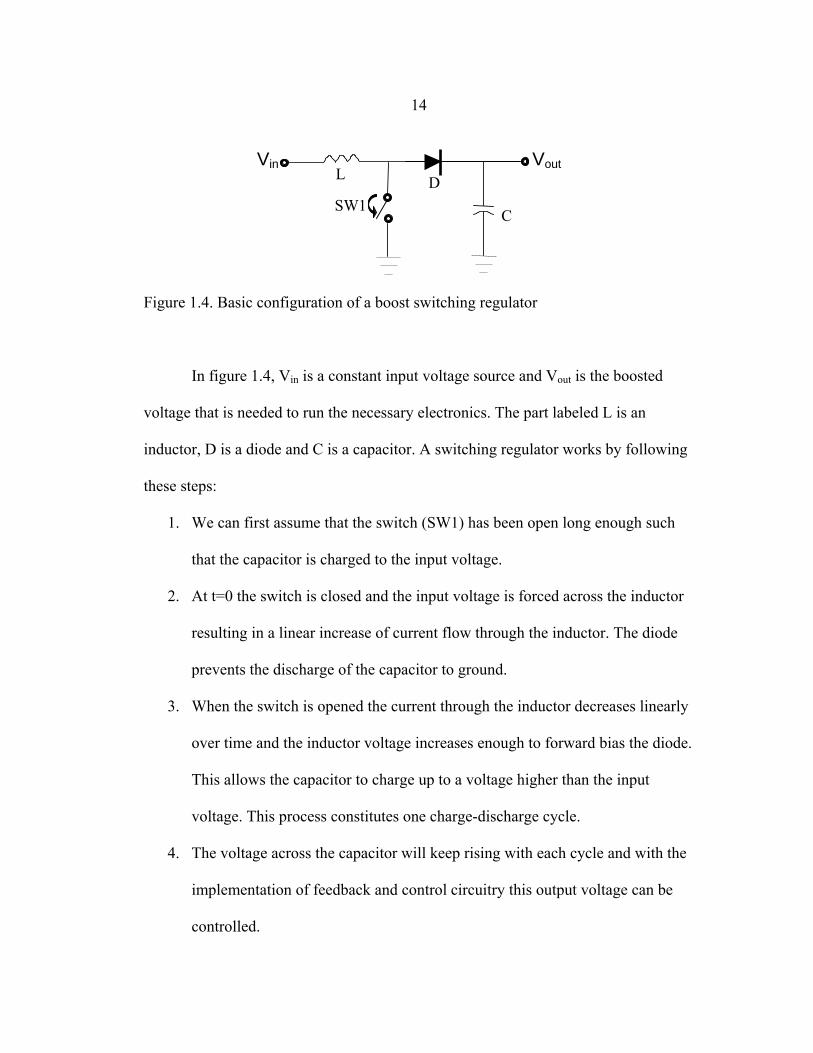
Figure 1.4. Basic configuration of a boost switching regulator
In figure 1.4, Vin is a constant input voltage source and Vout is the boosted
voltage that is needed to run the necessary electronics. The part labeled L is an
inductor, D is a diode and C is a capacitor. A switching regulator works by following
these steps:
1. We can first assume that the switch (SW1) has been open long enough such
that the capacitor is charged to the input voltage.
2. At t=0 the switch is closed and the input voltage is forced across the inductor
resulting in a linear increase of current flow through the inductor. The diode
prevents the discharge of the capacitor to ground.
3. When the switch is opened the current through the inductor decreases linearly
over time and the inductor voltage increases enough to forward bias the diode.
This allows the capacitor to charge up to a voltage higher than the input
voltage. This process constitutes one charge-discharge cycle.
4. The voltage across the capacitor will keep rising with each cycle and with the
implementation of feedback and control circuitry this output voltage can be
controlled.
Vin Vout
SW1
L D
C
15
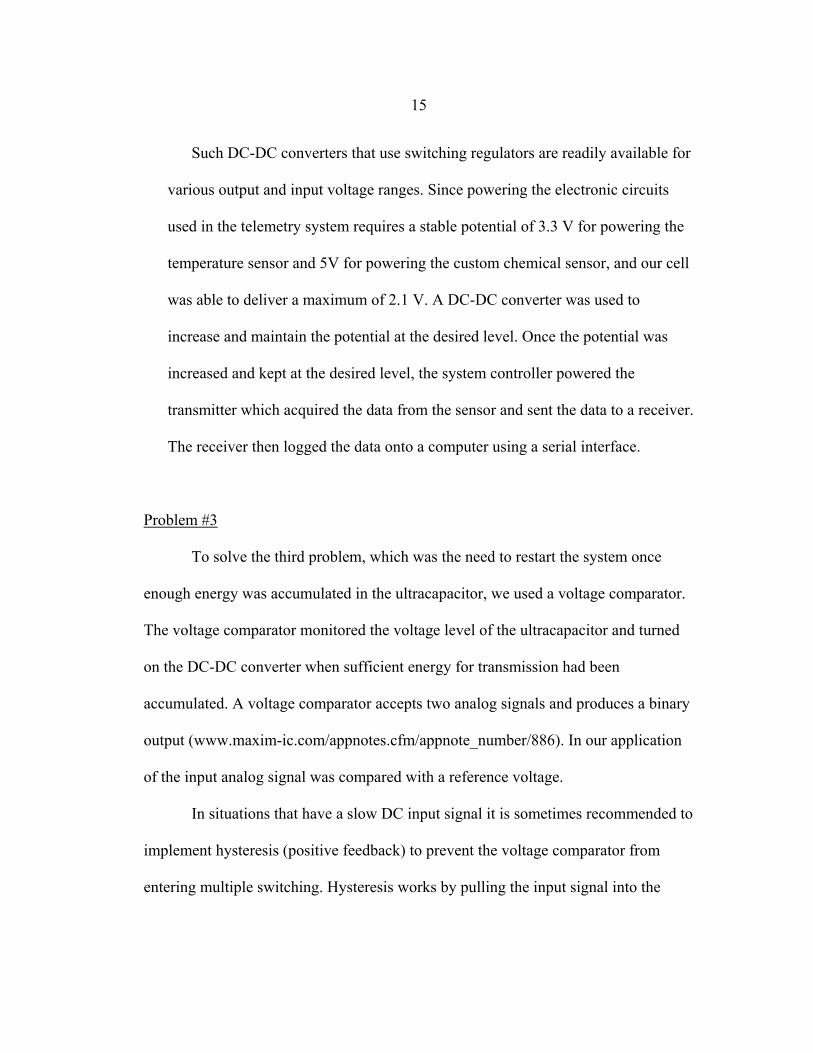
Such DC-DC converters that use switching regulators are readily available for
various output and input voltage ranges. Since powering the electronic circuits
used in the telemetry system requires a stable potential of 3.3 V for powering the
temperature sensor and 5V for powering the custom chemical sensor, and our cell
was able to deliver a maximum of 2.1 V. A DC-DC converter was used to
increase and maintain the potential at the desired level. Once the potential was
increased and kept at the desired level, the system controller powered the
transmitter which acquired the data from the sensor and sent the data to a receiver.
The receiver then logged the data onto a computer using a serial interface.
Problem #3
To solve the third problem, which was the need to restart the system once
enough energy was accumulated in the ultracapacitor, we used a voltage comparator.
The voltage comparator monitored the voltage level of the ultracapacitor and turned
on the DC-DC converter when sufficient energy for transmission had been
accumulated. A voltage comparator accepts two analog signals and produces a binary
output (www.maxim-ic.com/appnotes.cfm/appnote_number/886). In our application
of the input analog signal was compared with a reference voltage.
In situations that have a slow DC input signal it is sometimes recommended to
implement hysteresis (positive feedback) to prevent the voltage comparator from
entering multiple switching. Hysteresis works by pulling the input signal into the
16
comparator through the threshold when the output switches. This was however not
implemented into our circuit design.
Applications
The designed power management system can be used to control a variety of
sensors and telemetry systems powered by microbial fuel cells. The main principle of
the power management system we used was that the energy generated by the fuel cell
was stored in the ultracapacitor and used only when the level of the stored energy was
adequate to deliver enough power to operate the sensor and the telemetry system. To
demonstrate the utility of the power management system, we first used a
commercially available temperature sensor, transmitter and receiver, and transmitted
the measured temperature data wirelessly from the sensor to a remote receiver. The
sensor used was a thermocouple provided by the vendor. When the microbial fuel cell
charged the ultracapacitor to 1.2 V, the DC-DC converter was activated to produce a
3.3Voutput; which was then applied to the transmitter/sensor. After the temperature
data was acquired by the transmitter, it was wirelessly transmitted to the receiver.
During this process the energy in the capacitor was depleted, causing the potential to
decrease below 1.2 V. As a result, the system switched to sleep mode until the
capacitor potential reached 1.2 V, which activated the system again. Selecting the
potential of 1.2 V as the potential at which the system was changed to active mode
was arbitrary; the lower the selected potential, the shorter the charging time for the
17
capacitor. However, the minimum potential at which we could operate our DC-DC
converter was 0.9 V, so there was not much room for varying the selected potential.
After this first initial demonstration we decided to implement this power
management system to power up a more complicated chemical sensor that was not
available commercially. This chemical sensor was prototyped and built by our
research team and was designed to detect copper and lead in water. The chemical
sensor module was designed to carry out the electro-analytical process of anodic
stripping voltammetery to detect copper and lead.
Anodic stripping voltammetry (ASV) is an electrolytic method in which a
mercury thin-film electrode is held at a negative potential (-1.1V) to reduce metal
ions in solution to form an amalgam with the electrode. The solution is stirred to carry
as many of the metal ions to the electrode as possible. After deposition, the potential
is scanned from -1.1V to 0.5V at the same time the current drawn by the mercury
thin-film electrode is measured. Current peaks appear at potentials corresponding to
the oxidation of metals as they are stripped from the electrode back into the solution.
The peak height obtained was correlated to the concentration of the metal ions in the
solution using previously measured calibration curves.
Just as before, the microbial fuel cell charged an ultracapacitor to 1.2V. As
soon was this voltage was reached the DC-DC converter was activated and it was
designed to output a voltage of 5V which was needed to power up the chemical
sensor module and its sensor. The metal concentration data obtained was then
wirelessly transmitted to the receiver which was connected to a data logging PC.
18
CHAPTER 2
MATERIALS AND METHODS
Components of the System
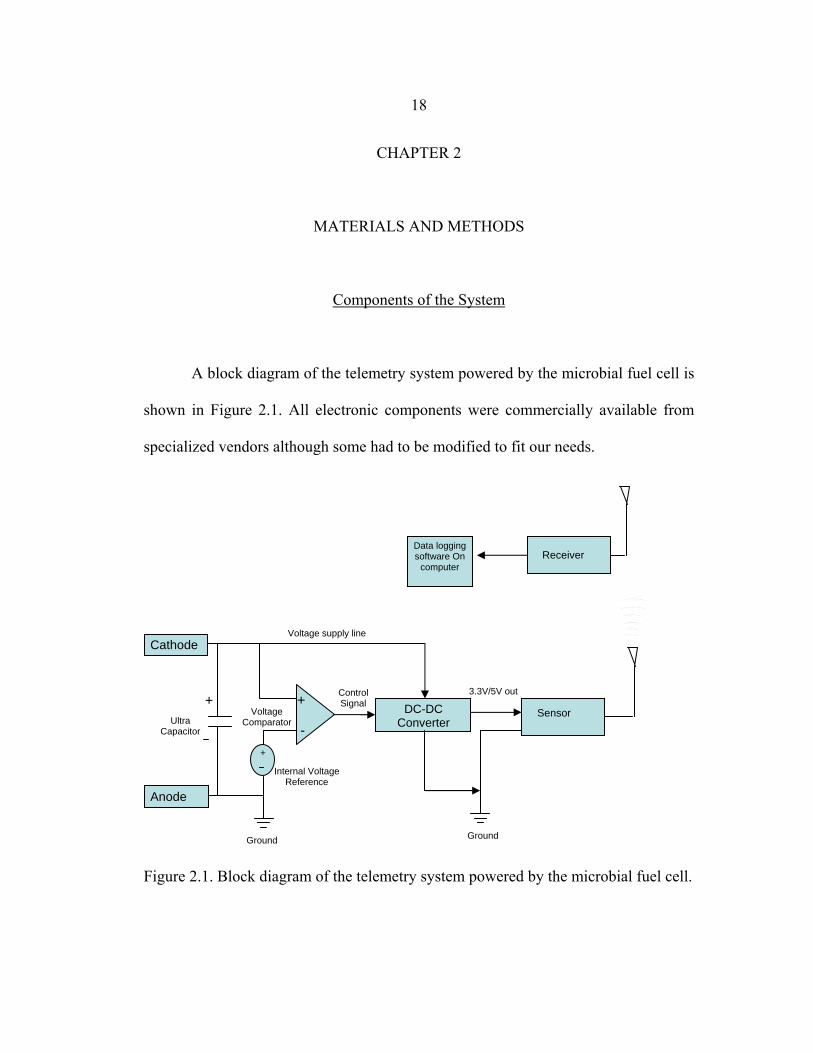
A block diagram of the telemetry system powered by the microbial fuel cell is
shown in Figure 2.1. All electronic components were commercially available from
specialized vendors although some had to be modified to fit our needs.
Figure 2.1. Block diagram of the telemetry system powered by the microbial fuel cell.
Cathode
Anode
-
+ DC-DC
Converter
+
Sensor Voltage Comparator
Internal VoltageReference
Ground Ground
Voltage supply line
Ultra Capacitor
+ Control Signal
3.3V/5V out
Receiver Data logging software On
computer
19
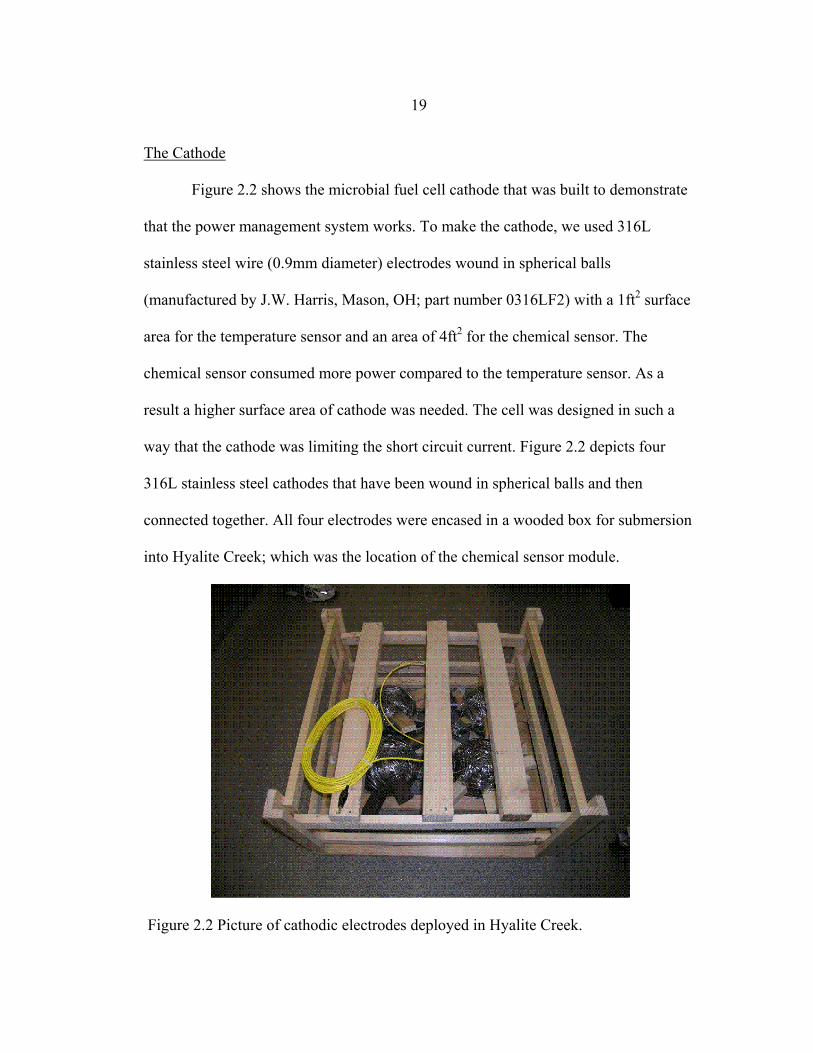
The Cathode
Figure 2.2 shows the microbial fuel cell cathode that was built to demonstrate
that the power management system works. To make the cathode, we used 316L
stainless steel wire (0.9mm diameter) electrodes wound in spherical balls
(manufactured by J.W. Harris, Mason, OH; part number 0316LF2) with a 1ft2 surface
area for the temperature sensor and an area of 4ft2 for the chemical sensor. The
chemical sensor consumed more power compared to the temperature sensor. As a
result a higher surface area of cathode was needed. The cell was designed in such a
way that the cathode was limiting the short circuit current. Figure 2.2 depicts four
316L stainless steel cathodes that have been wound in spherical balls and then
connected together. All four electrodes were encased in a wooded box for submersion
into Hyalite Creek; which was the location of the chemical sensor module.
Figure 2.2 Picture of cathodic electrodes deployed in Hyalite Creek.
20
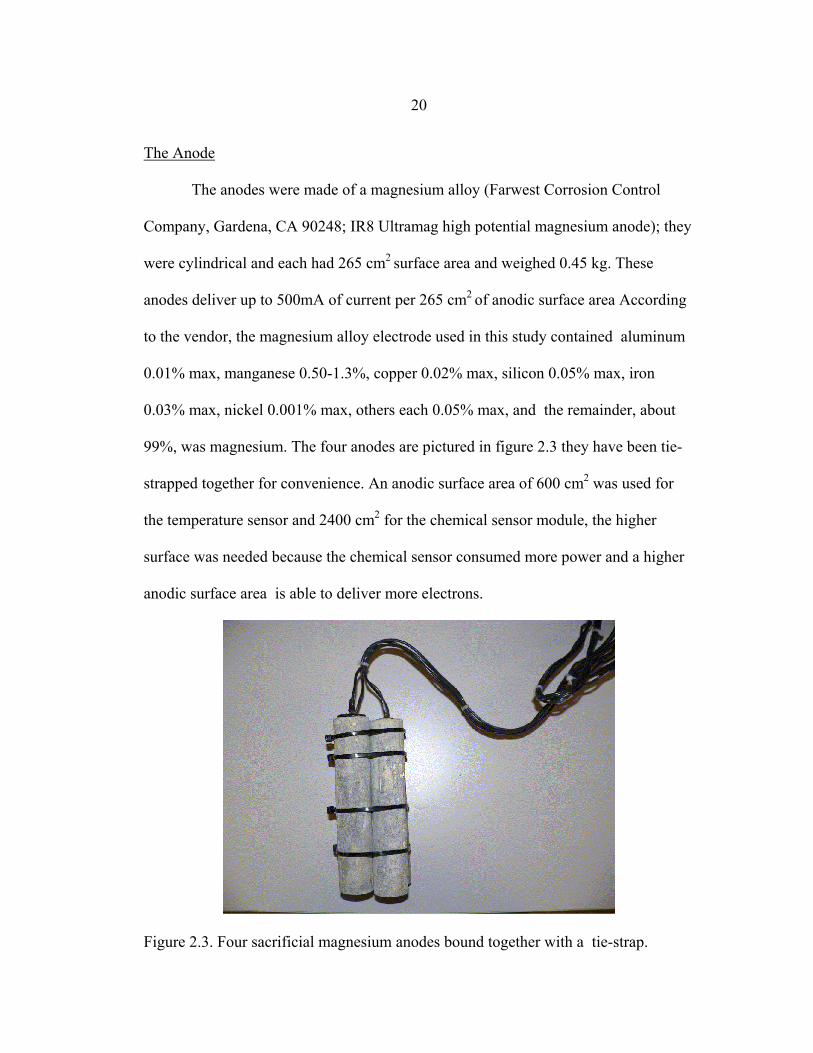
The Anode
The anodes were made of a magnesium alloy (Farwest Corrosion Control
Company, Gardena, CA 90248; IR8 Ultramag high potential magnesium anode); they
were cylindrical and each had 265 cm2 surface area and weighed 0.45 kg. These
anodes deliver up to 500mA of current per 265 cm2 of anodic surface area According
to the vendor, the magnesium alloy electrode used in this study contained aluminum
0.01% max, manganese 0.50-1.3%, copper 0.02% max, silicon 0.05% max, iron
0.03% max, nickel 0.001% max, others each 0.05% max, and the remainder, about
99%, was magnesium. The four anodes are pictured in figure 2.3 they have been tie-
strapped together for convenience. An anodic surface area of 600 cm2 was used for
the temperature sensor and 2400 cm2 for the chemical sensor module, the higher
surface was needed because the chemical sensor consumed more power and a higher
anodic surface area is able to deliver more electrons.
Figure 2.3. Four sacrificial magnesium anodes bound together with a tie-strap.
21
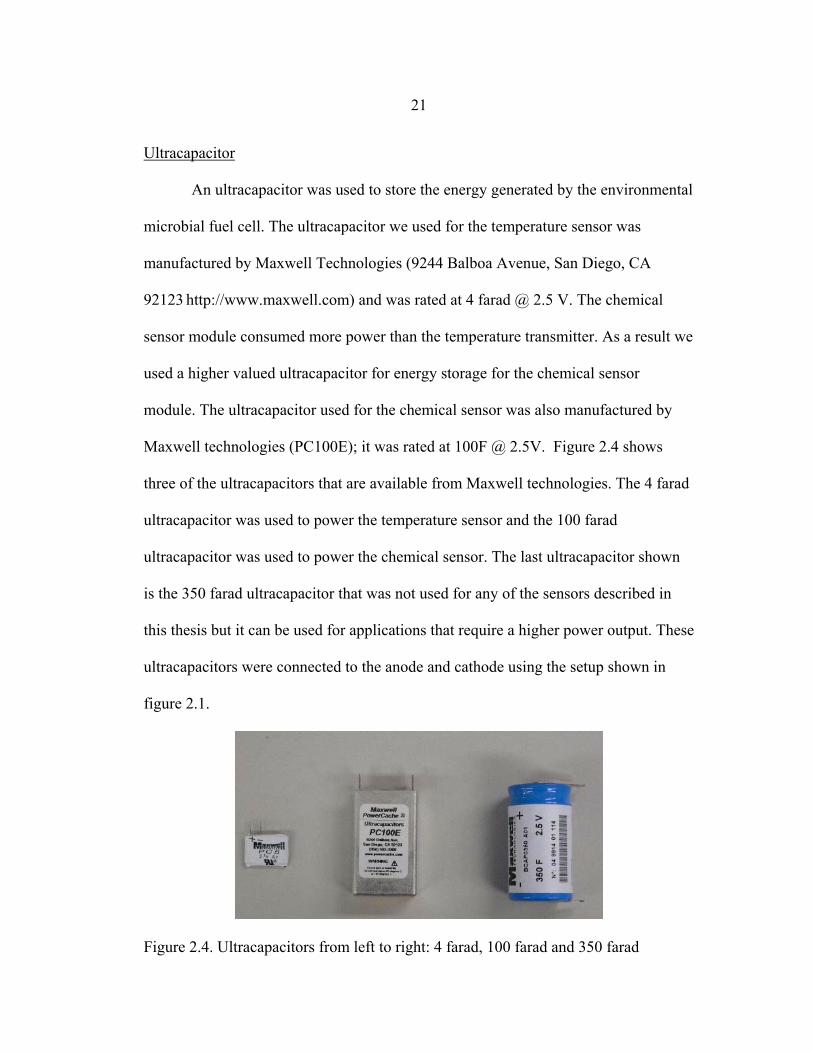
Ultracapacitor
An ultracapacitor was used to store the energy generated by the environmental
microbial fuel cell. The ultracapacitor we used for the temperature sensor was
manufactured by Maxwell Technologies (9244 Balboa Avenue, San Diego, CA
92123 http://www.maxwell.com) and was rated at 4 farad @ 2.5 V. The chemical
sensor module consumed more power than the temperature transmitter. As a result we
used a higher valued ultracapacitor for energy storage for the chemical sensor
module. The ultracapacitor used for the chemical sensor was also manufactured by
Maxwell technologies (PC100E); it was rated at 100F @ 2.5V. Figure 2.4 shows
three of the ultracapacitors that are available from Maxwell technologies. The 4 farad
ultracapacitor was used to power the temperature sensor and the 100 farad
ultracapacitor was used to power the chemical sensor. The last ultracapacitor shown
is the 350 farad ultracapacitor that was not used for any of the sensors described in
this thesis but it can be used for applications that require a higher power output. These
ultracapacitors were connected to the anode and cathode using the setup shown in
figure 2.1.
Figure 2.4. Ultracapacitors from left to right: 4 farad, 100 farad and 350 farad
22
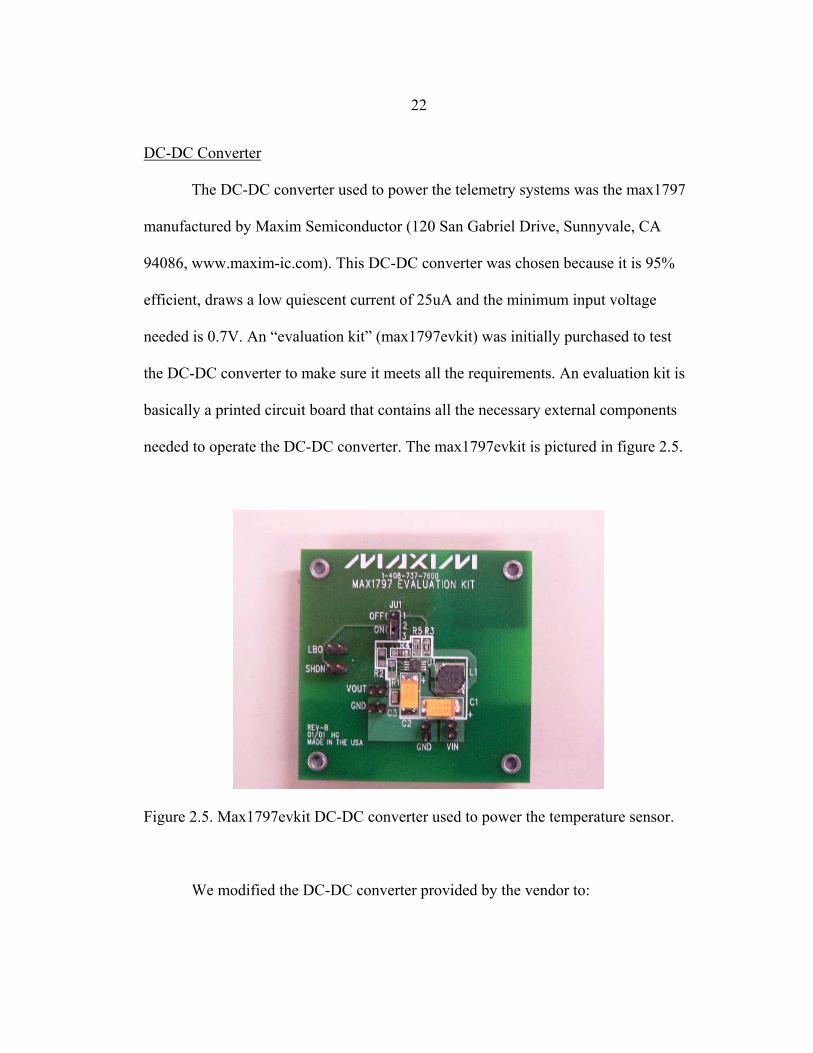
DC-DC Converter
The DC-DC converter used to power the telemetry systems was the max1797
manufactured by Maxim Semiconductor (120 San Gabriel Drive, Sunnyvale, CA
94086, www.maxim-ic.com). This DC-DC converter was chosen because it is 95%
efficient, draws a low quiescent current of 25uA and the minimum input voltage
needed is 0.7V. An “evaluation kit” (max1797evkit) was initially purchased to test
the DC-DC converter to make sure it meets all the requirements. An evaluation kit is
basically a printed circuit board that contains all the necessary external components
needed to operate the DC-DC converter. The max1797evkit is pictured in figure 2.5.
Figure 2.5. Max1797evkit DC-DC converter used to power the temperature sensor.
We modified the DC-DC converter provided by the vendor to:
23
1. Increase the output potential to 3.3V for the temperature sensor and 5V for
the chemical sensor module.
2. Automatically power up the system when the capacitor voltage reached
1.2V (when enough energy was accumulated in the system, the sensor and
telemetry system was operated automatically).
3. Keep the output voltage constant for the sensor operation (the potential of our
fuel cell varied between 1.55V and 2.2V).
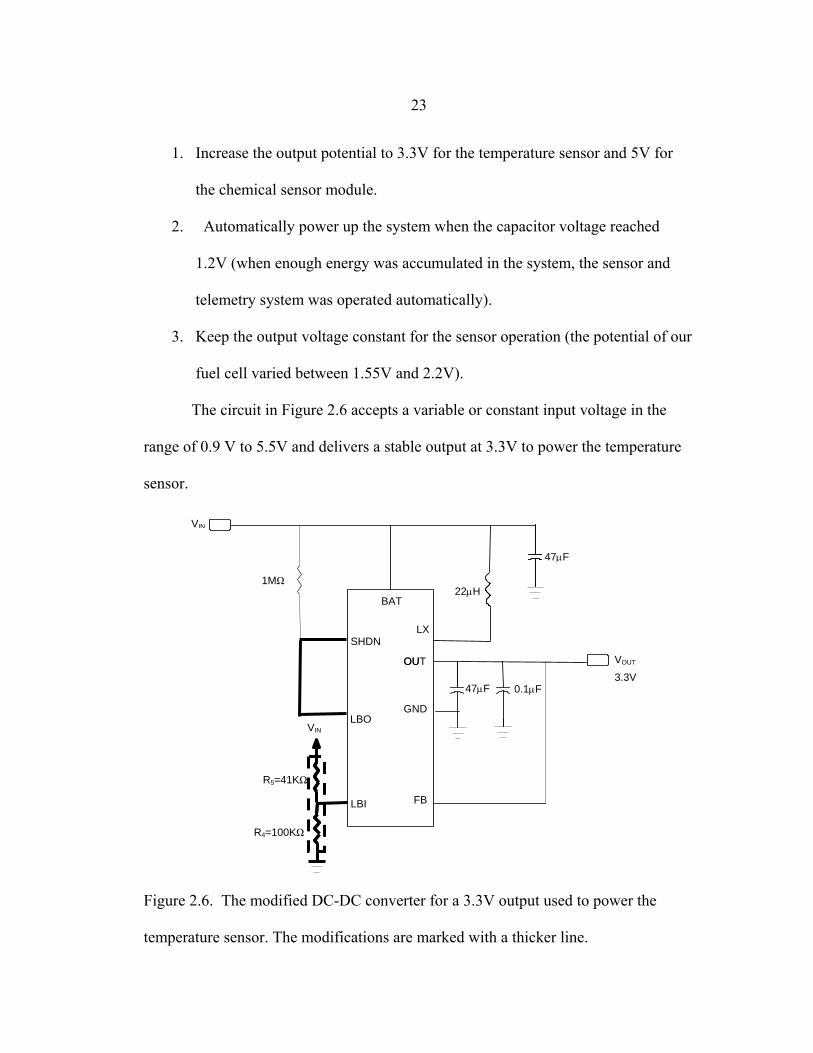
The circuit in Figure 2.6 accepts a variable or constant input voltage in the
range of 0.9 V to 5.5V and delivers a stable output at 3.3V to power the temperature
sensor.
Figure 2.6. The modified DC-DC converter for a 3.3V output used to power the
temperature sensor. The modifications are marked with a thicker line.
SHDN
BAT
LX
LBI
GND
FB
OU VOUT
47µF
47µF
VIN LBO
OUT
VIN
3.3V
1MΩ
R4=100KΩ
R5=41KΩ
0.1µF
22µH
24
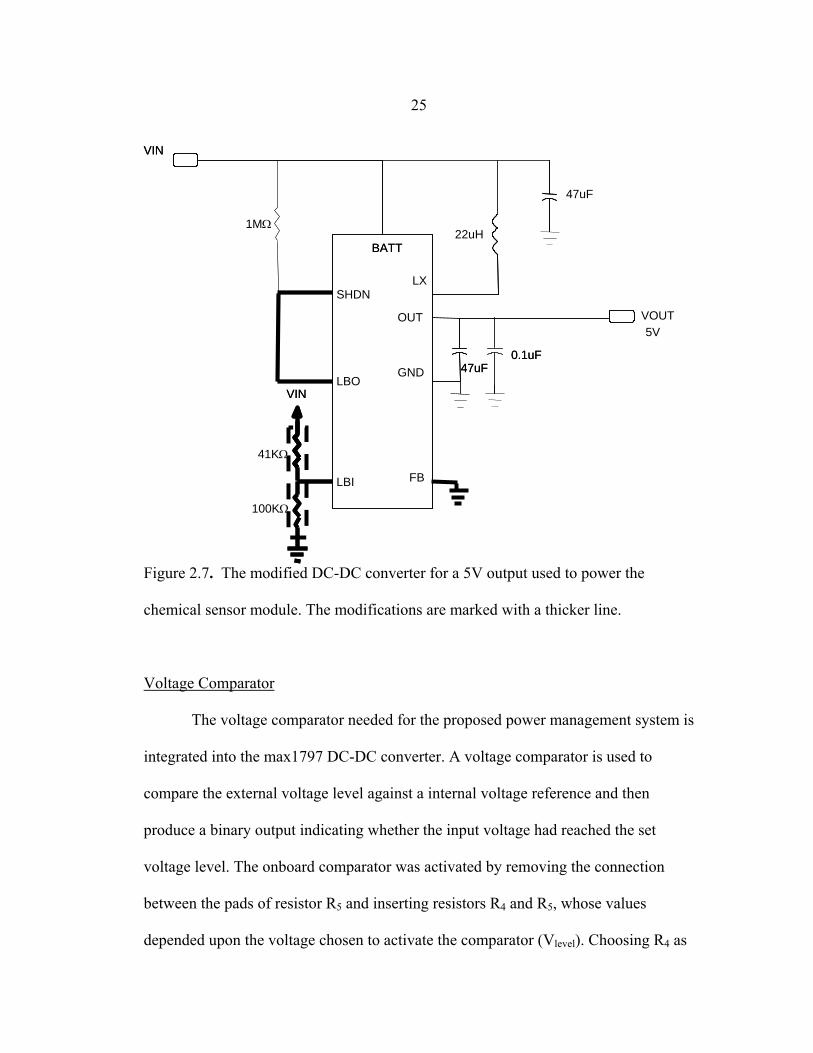
The chemical sensor module was built exclusively by our research group. All
the designed electronic components were prototyped and then a custom printed circuit
board (PCB) was manufactured onto which all the components were mounted. This
custom chemical sensor module was designed to operate from a 5V power supply as
compared to the 3.3V that was used to power the temperature transmitter. Instead of
using the evaluation kit offered by maxim semiconductor for the DC-DC converter,
we integrated the power management circuitry into the PCB design for the chemical
sensor module. The circuit design for the DC-DC converter used to power the
chemical sensor module is shown in figure 2.7. Here again the DC-DC converter was
set to activate at an input potential of 1.2V.
25
Figure 2.7. The modified DC-DC converter for a 5V output used to power the
chemical sensor module. The modifications are marked with a thicker line.
Voltage Comparator
The voltage comparator needed for the proposed power management system is
integrated into the max1797 DC-DC converter. A voltage comparator is used to
compare the external voltage level against a internal voltage reference and then
produce a binary output indicating whether the input voltage had reached the set
voltage level. The onboard comparator was activated by removing the connection
between the pads of resistor R5 and inserting resistors R4 and R5, whose values
depended upon the voltage chosen to activate the comparator (Vlevel). Choosing R4 as
VOUT
SHDN
BATT
LX
LBO
LBI
GND
FB
OUT
VIN
100KΩ
41KΩ
0.1uF47uF
22uH
47uF
VIN
BATT
VIN
5V
1MΩ
0.1uF47uF
VIN
26
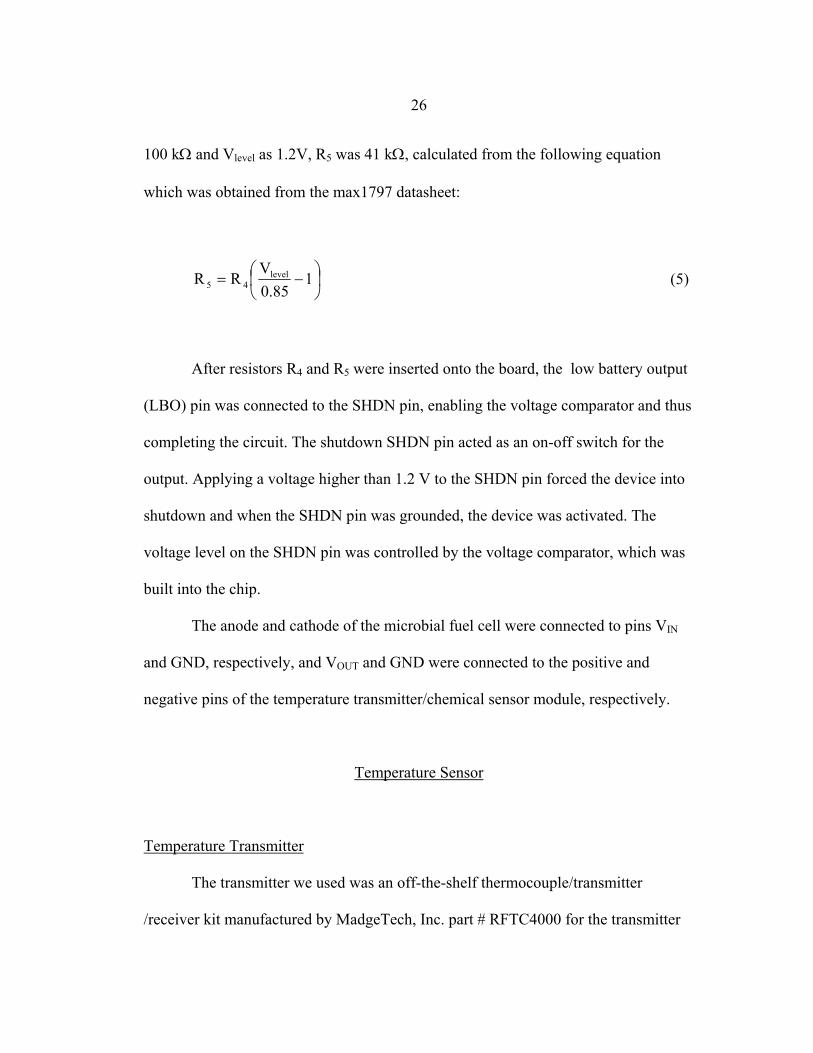
100 kΩ and Vlevel as 1.2V, R5 was 41 kΩ, calculated from the following equation
which was obtained from the max1797 datasheet:
⎟⎠⎞
⎜⎝⎛ −= 1
85.0V
RR level45 (5)
After resistors R4 and R5 were inserted onto the board, the low battery output
(LBO) pin was connected to the SHDN pin, enabling the voltage comparator and thus
completing the circuit. The shutdown SHDN pin acted as an on-off switch for the
output. Applying a voltage higher than 1.2 V to the SHDN pin forced the device into
shutdown and when the SHDN pin was grounded, the device was activated. The
voltage level on the SHDN pin was controlled by the voltage comparator, which was
built into the chip.
The anode and cathode of the microbial fuel cell were connected to pins VIN
and GND, respectively, and VOUT and GND were connected to the positive and
negative pins of the temperature transmitter/chemical sensor module, respectively.
Temperature Sensor
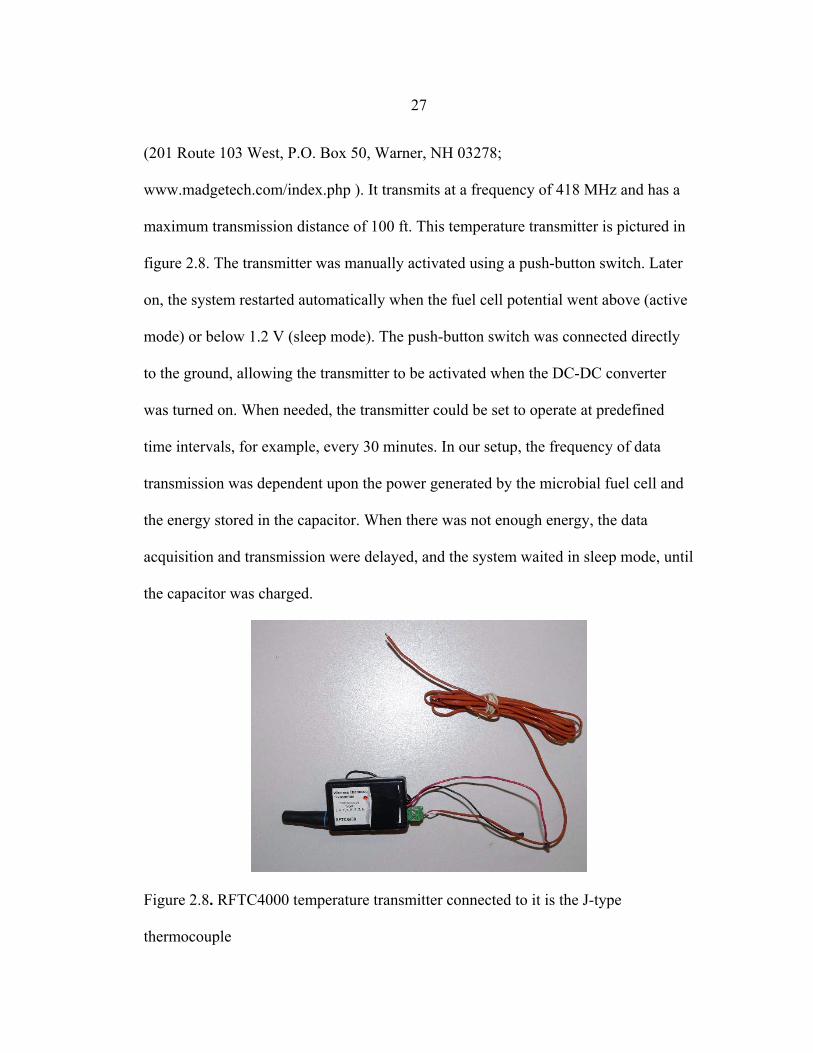
Temperature Transmitter
The transmitter we used was an off-the-shelf thermocouple/transmitter
/receiver kit manufactured by MadgeTech, Inc. part # RFTC4000 for the transmitter
27
(201 Route 103 West, P.O. Box 50, Warner, NH 03278;
www.madgetech.com/index.php ). It transmits at a frequency of 418 MHz and has a
maximum transmission distance of 100 ft. This temperature transmitter is pictured in
figure 2.8. The transmitter was manually activated using a push-button switch. Later
on, the system restarted automatically when the fuel cell potential went above (active
mode) or below 1.2 V (sleep mode). The push-button switch was connected directly
to the ground, allowing the transmitter to be activated when the DC-DC converter
was turned on. When needed, the transmitter could be set to operate at predefined
time intervals, for example, every 30 minutes. In our setup, the frequency of data
transmission was dependent upon the power generated by the microbial fuel cell and
the energy stored in the capacitor. When there was not enough energy, the data
acquisition and transmission were delayed, and the system waited in sleep mode, until
the capacitor was charged.
Figure 2.8. RFTC4000 temperature transmitter connected to it is the J-type
thermocouple
28
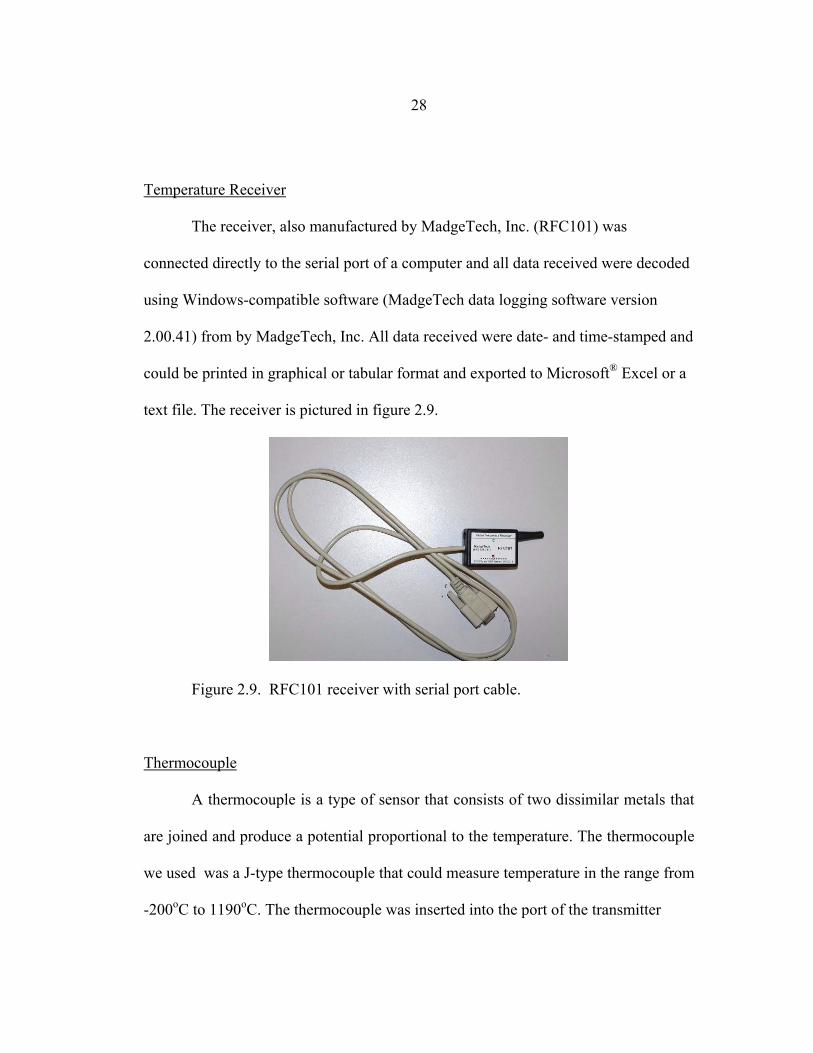
Temperature Receiver
The receiver, also manufactured by MadgeTech, Inc. (RFC101) was
connected directly to the serial port of a computer and all data received were decoded
using Windows-compatible software (MadgeTech data logging software version
2.00.41) from by MadgeTech, Inc. All data received were date- and time-stamped and
could be printed in graphical or tabular format and exported to Microsoft® Excel or a
text file. The receiver is pictured in figure 2.9.
Figure 2.9. RFC101 receiver with serial port cable.
Thermocouple
A thermocouple is a type of sensor that consists of two dissimilar metals that
are joined and produce a potential proportional to the temperature. The thermocouple
we used was a J-type thermocouple that could measure temperature in the range from
-200oC to 1190oC. The thermocouple was inserted into the port of the transmitter
29
Remote measurement of the temperature
To demonstrate that microbial fuel cells, when combined with a suitable
power management program, can deliver enough energy to operate the temperature
sensor and the telemetry system and that our power management system worked as
expected, we assembled the system (figure 2.3), connected it with a thermocouple,
measured the temperature, and transmitted the data to a remote receiver. The
thermocouple, the temperature measurement unit, and the transmitter were powered
from the microbial fuel cell. To generate energy, we assembled a microbial fuel cell
and deployed it in a freshwater creek, Roskie Creek in Bozeman, Montana. First we
deployed stainless steel coupons of 1ft2 surface area (the cathodes) and waited until
their potential increased above 300 mVSCE. Then we deployed the magnesium alloy
sacrificial anode (600cm2 surface area), assembled the fuel cell, and connected it to
the system shown in figure 2.3.
For demonstration purposes, we measured air temperature and transmitted the
data to a remote receiver. The receiver was connected to a laptop computer (IBM
T41) located at a distance less than 100 ft from the transmitter. To verify that the
measured and transmitted data were correct, we also measured the air temperature
using a mercury thermometer and compared the results. To vary the measured
temperature and to see if the system responded, we occasionally placed the
thermocouple in a beaker filled with ice.
30
Chemical Sensor Module
The chemical sensor module was designed and constructed by our research
team to detect the concentrations of metals such as copper and lead in water. In order
to determine whether the chemical sensor was able to accurately measure
concentrations of copper and lead we tested this chemical sensor in the laboratory
with known concentrations of copper and lead. The chemical sensor module had three
ports for the connection of the chemical sensor which consists of the mercury plated
working electrode, a platinum counter electrode and a saturated calomel reference
electrode. The main component of this sensor module is the microcontroller that was
programmed to carry out all the necessary electrochemical operations needed to
detect the metals in water. Once the voltage across the ultracapacitor reached 1.2V
the onboard DC-DC converter was activated and output a 5V that was used to power
all the necessary components of the chemical sensor module.
This chemical sensor performed the electro-chemical process of anodic
stripping voltammetery. This procedure required the chemical sensor module to apply
a deposition potential of -1.1V to the working electrode to deposit all the metal ions
present in the water to the mercury plated working electrode. This deposition
potential was applied for a period of 2 minutes followed by the ramping of the
potential from -1.1V to 0.5V in order to strip the metals from the electrode. The
current drawn by the working electrode was continuously measured by the chemical
sensor module during this ramping stage. The current versus potential data obtained
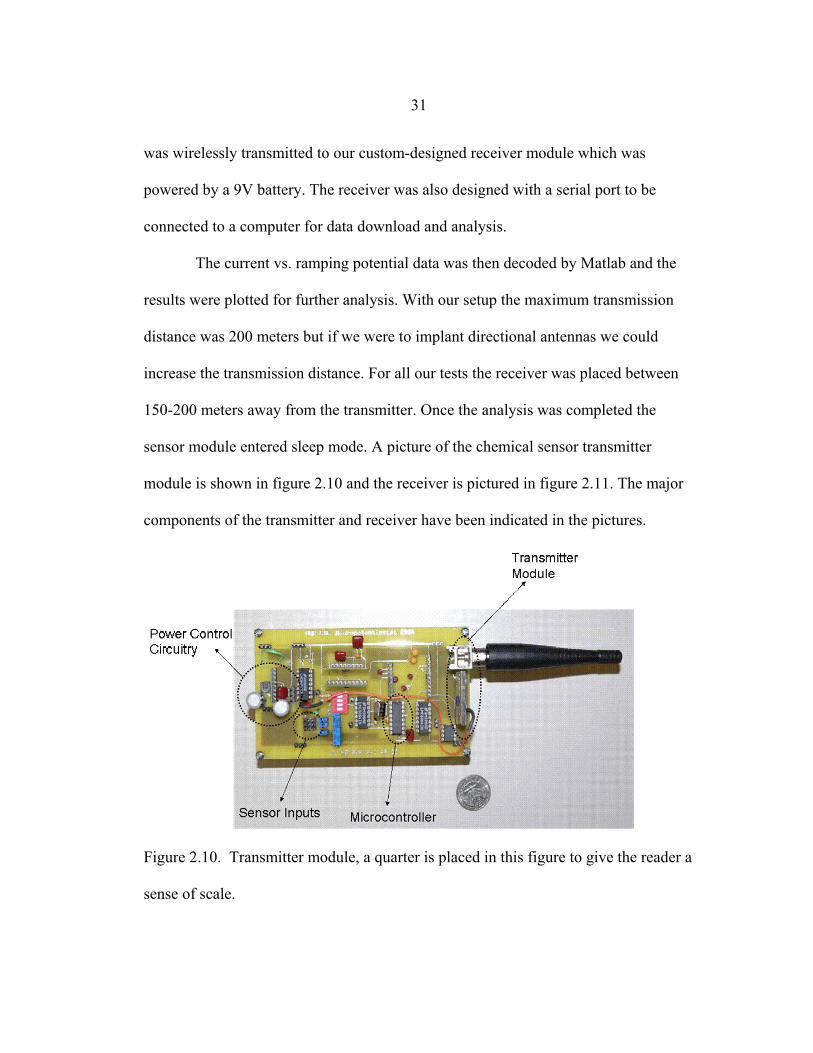
31
was wirelessly transmitted to our custom-designed receiver module which was
powered by a 9V battery. The receiver was also designed with a serial port to be
connected to a computer for data download and analysis.
The current vs. ramping potential data was then decoded by Matlab and the
results were plotted for further analysis. With our setup the maximum transmission
distance was 200 meters but if we were to implant directional antennas we could
increase the transmission distance. For all our tests the receiver was placed between
150-200 meters away from the transmitter. Once the analysis was completed the
sensor module entered sleep mode. A picture of the chemical sensor transmitter
module is shown in figure 2.10 and the receiver is pictured in figure 2.11. The major
components of the transmitter and receiver have been indicated in the pictures.
Figure 2.10. Transmitter module, a quarter is placed in this figure to give the reader a
sense of scale.
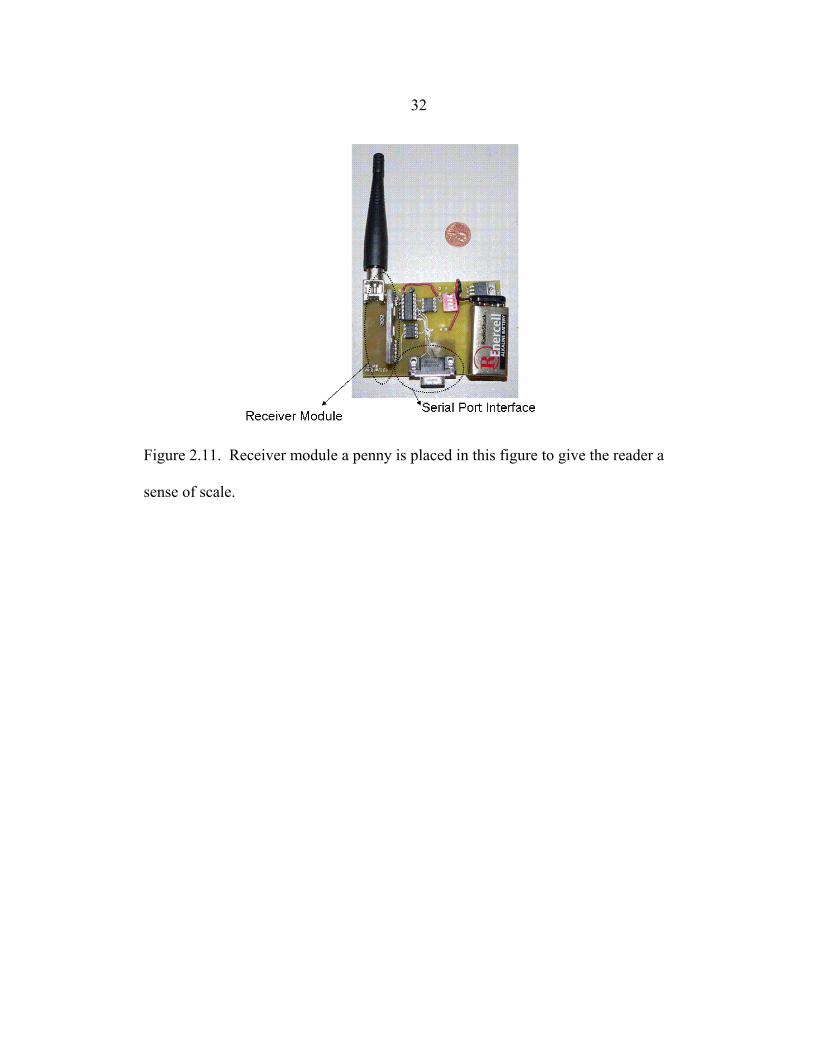
32
Figure 2.11. Receiver module a penny is placed in this figure to give the reader a
sense of scale.
33
CHAPTER 3
RESULTS AND DISCUSSION
Fuel Cell
We assembled the system step-by-step, starting from the fuel cell. The 316L
stainless steel plates used to deposit biomineralized manganese oxides exhibited an
initial potential of –50 mVSCE , and after approximately 2-3 weeks exposure to the
creek water the potential increased to almost +400 mVSCE, which is consistent with
our previous observations (23), and with thermodynamic calculations (equation 4
page 6). After the cathodic potential reached the desired level of +400 mV, we
deployed the magnesium alloy sacrificial anodes, connected the microbial fuel cell to
the circuit in figure 2.3 and left it for three weeks. During that time, the potential of
the sacrificial anode varied between -1.6 and -1.8 VSCE. We ascribe the variations in
anode potential to the fluctuations in the ambient temperature and changing chemistry
of the water.
To evaluate the amount of energy generated by the microbial fuel cell, we
measured the short-circuit current (by directly connecting the anode to the cathode) of
the fuel cell. The short circuit current was measured using a multimeter. To make sure
that the cathodic reaction was limiting the current, we increased the number of anodes
(i.e., the surface area) until the current reached a plateau. The plot of the measured
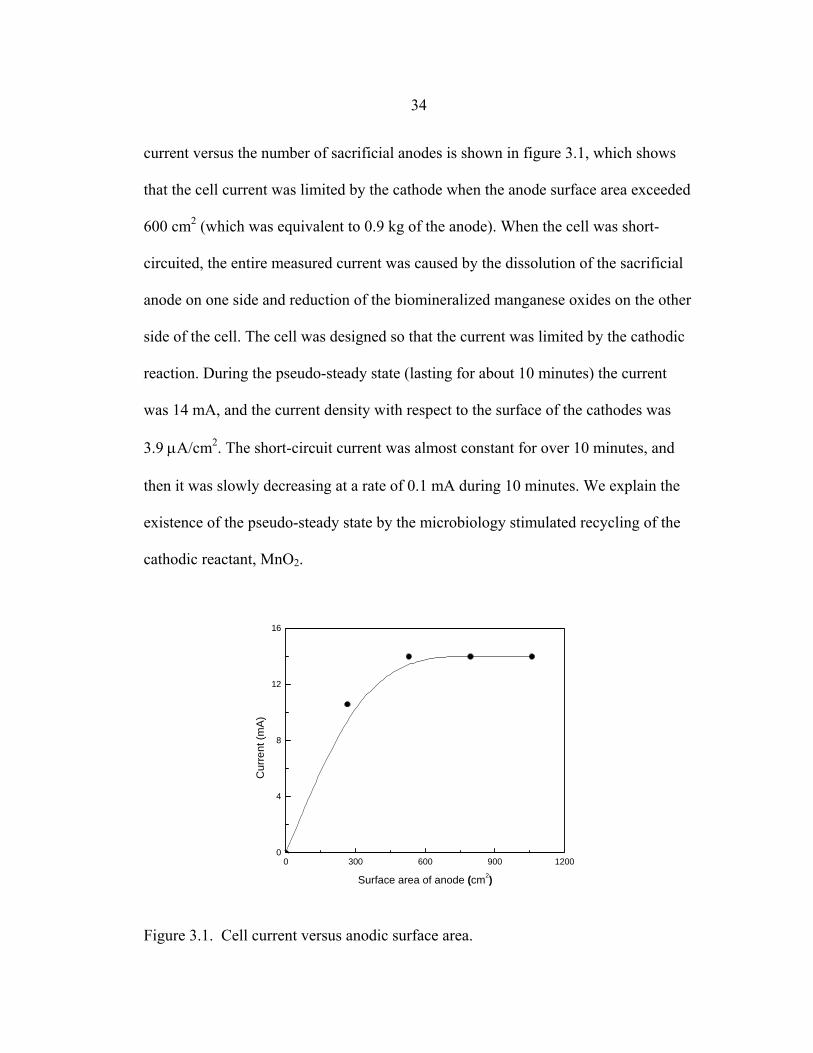
34
current versus the number of sacrificial anodes is shown in figure 3.1, which shows
that the cell current was limited by the cathode when the anode surface area exceeded
600 cm2 (which was equivalent to 0.9 kg of the anode). When the cell was short-
circuited, the entire measured current was caused by the dissolution of the sacrificial
anode on one side and reduction of the biomineralized manganese oxides on the other
side of the cell. The cell was designed so that the current was limited by the cathodic
reaction. During the pseudo-steady state (lasting for about 10 minutes) the current
was 14 mA, and the current density with respect to the surface of the cathodes was
3.9 µA/cm2. The short-circuit current was almost constant for over 10 minutes, and
then it was slowly decreasing at a rate of 0.1 mA during 10 minutes. We explain the
existence of the pseudo-steady state by the microbiology stimulated recycling of the
cathodic reactant, MnO2.
0 300 600 900 12000
4
8
12
16
Cur
rent
(mA)
Surface area of anode (cm2)
Figure 3.1. Cell current versus anodic surface area.
35
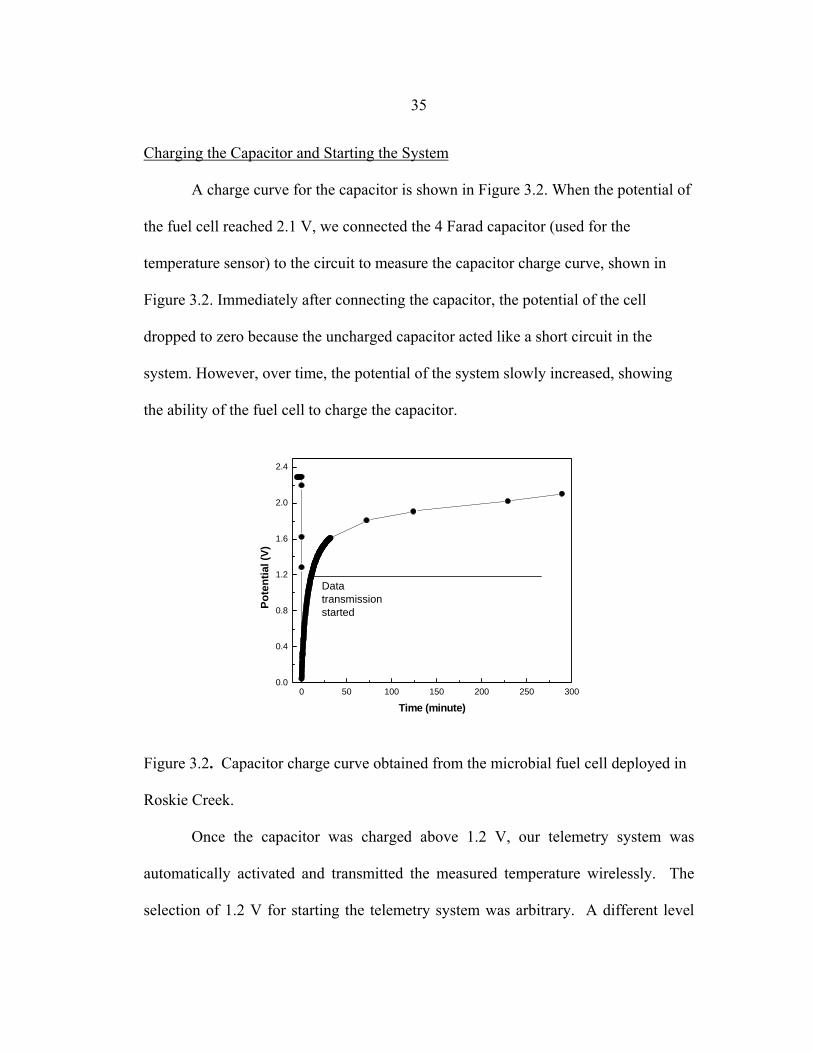
Charging the Capacitor and Starting the System
A charge curve for the capacitor is shown in Figure 3.2. When the potential of
the fuel cell reached 2.1 V, we connected the 4 Farad capacitor (used for the
temperature sensor) to the circuit to measure the capacitor charge curve, shown in
Figure 3.2. Immediately after connecting the capacitor, the potential of the cell
dropped to zero because the uncharged capacitor acted like a short circuit in the
system. However, over time, the potential of the system slowly increased, showing
the ability of the fuel cell to charge the capacitor.
0 50 100 150 200 250 3000.0
0.4
0.8
1.2
1.6
2.0
2.4
Pote
ntia
l (V)
Time (minute)
Data transmissionstarted
Figure 3.2. Capacitor charge curve obtained from the microbial fuel cell deployed in
Roskie Creek.
Once the capacitor was charged above 1.2 V, our telemetry system was
automatically activated and transmitted the measured temperature wirelessly. The
selection of 1.2 V for starting the telemetry system was arbitrary. A different level
36
could be selected: the lower the selected potential, the shorter the charging time for
the capacitor. Examples of the transmitted data are shown in figure 3.3.
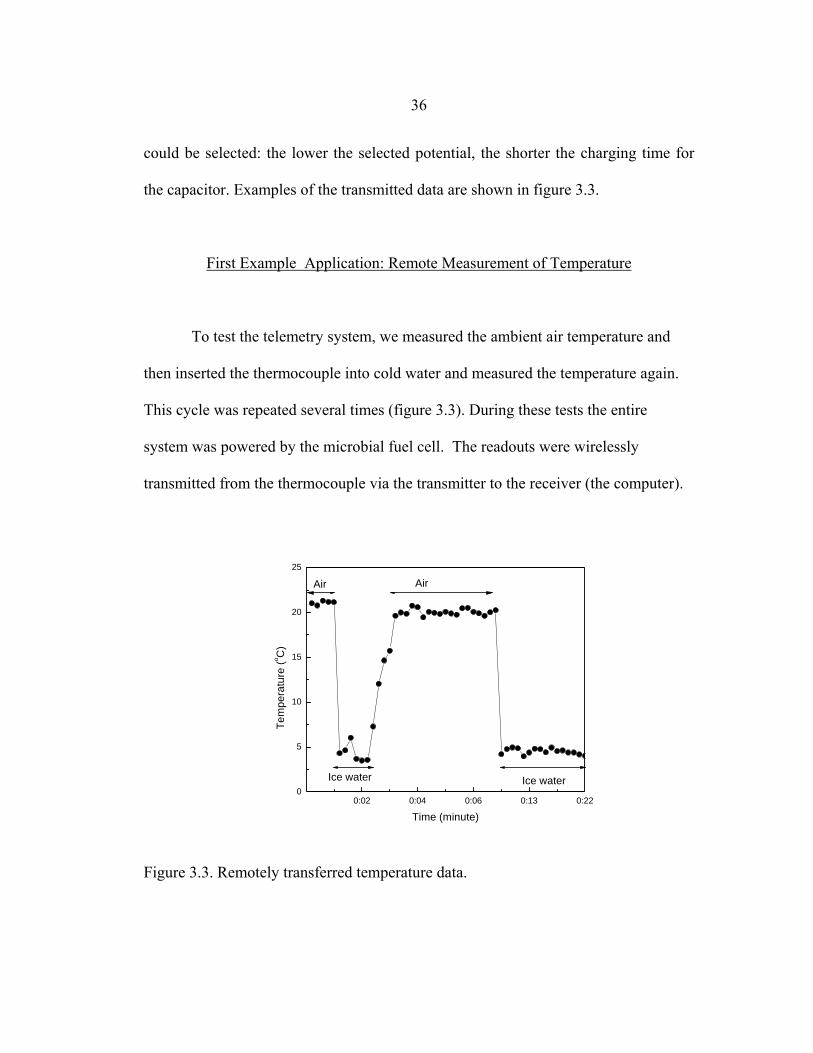
First Example Application: Remote Measurement of Temperature
To test the telemetry system, we measured the ambient air temperature and
then inserted the thermocouple into cold water and measured the temperature again.
This cycle was repeated several times (figure 3.3). During these tests the entire
system was powered by the microbial fuel cell. The readouts were wirelessly
transmitted from the thermocouple via the transmitter to the receiver (the computer).
0:02 0:04 0:06 0:13 0:220
5
10
15
20
25
Tem
pera
ture
(o C)
Time (minute)
Ice water Ice water
Air Air
Figure 3.3. Remotely transferred temperature data.
37
Second Example Application: Remote Measurement of
Copper and Lead Concentration
Just as with the temperature sensor, the same procedure was used for the
chemical sensor. Once the 100 Farad capacitor was charged to 1.2V the chemical
sensor module automatically turned on and it carried out the electro-chemical analysis
of the water. The chemical sensor was built to detect lead and copper concentrations
but as the waters around Bozeman are extremely pristine we could not test the sensor
in the field, instead we connected the sensor module to the sensor in the laboratory
and carried out the analysis with water that contained known concentrations of copper
and lead.
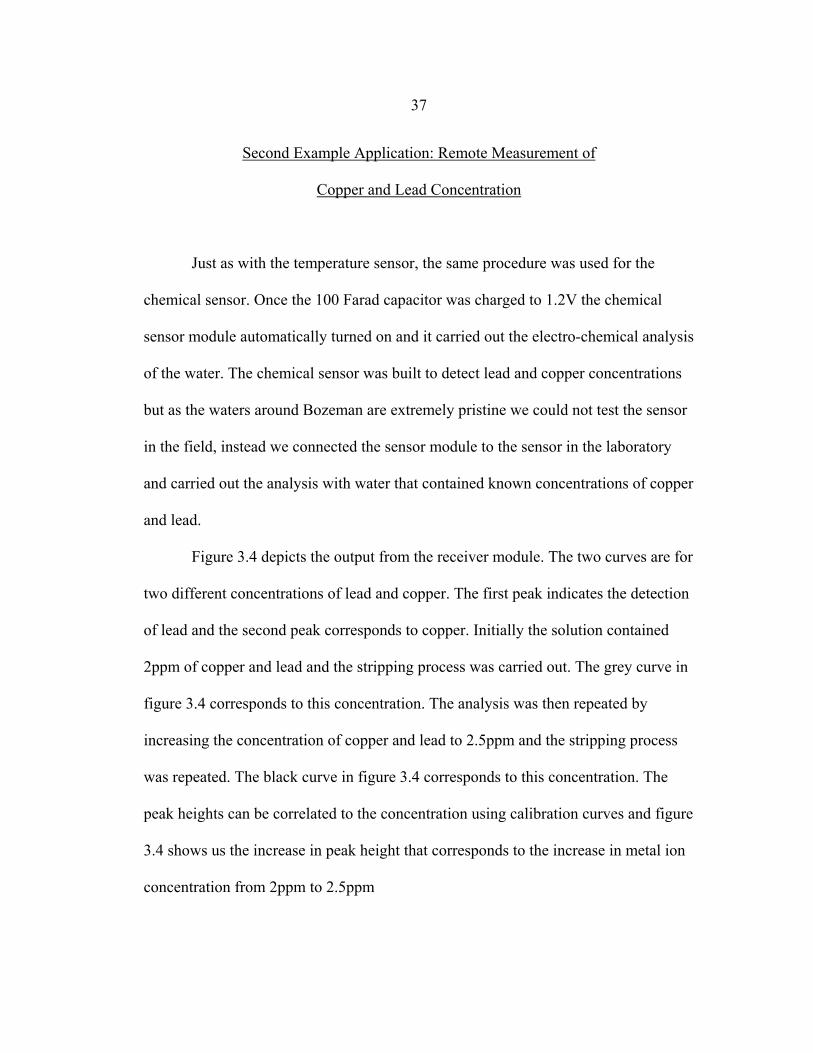
Figure 3.4 depicts the output from the receiver module. The two curves are for
two different concentrations of lead and copper. The first peak indicates the detection
of lead and the second peak corresponds to copper. Initially the solution contained
2ppm of copper and lead and the stripping process was carried out. The grey curve in
figure 3.4 corresponds to this concentration. The analysis was then repeated by
increasing the concentration of copper and lead to 2.5ppm and the stripping process
was repeated. The black curve in figure 3.4 corresponds to this concentration. The
peak heights can be correlated to the concentration using calibration curves and figure
3.4 shows us the increase in peak height that corresponds to the increase in metal ion
concentration from 2ppm to 2.5ppm
38
-60
-40
-20
0
20
40
60
-1.1 -0.7 -0.3 0.1 0.5 0.9
Potential(Volts)
Cur
rent
(uA
)
Figure 3.4. Data transmitted from the chemical sensor module, the peaks shown
indicate the detection of copper and lead. The grey curve is a concentration of 2ppm
and the black curve is at a concentration of 2.5ppm for lead and copper. The chemical
sensor module was powered using the environmental microbial fuel cell.
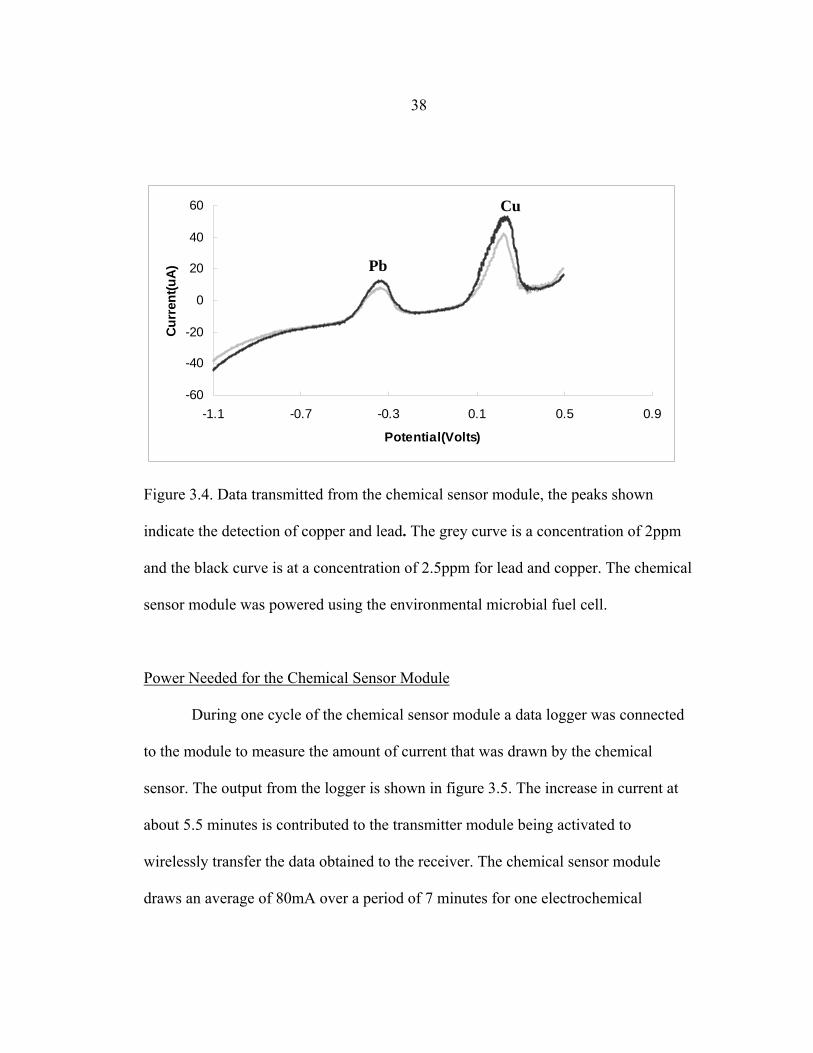
Power Needed for the Chemical Sensor Module
During one cycle of the chemical sensor module a data logger was connected
to the module to measure the amount of current that was drawn by the chemical
sensor. The output from the logger is shown in figure 3.5. The increase in current at
about 5.5 minutes is contributed to the transmitter module being activated to
wirelessly transfer the data obtained to the receiver. The chemical sensor module
draws an average of 80mA over a period of 7 minutes for one electrochemical
Pb
Cu
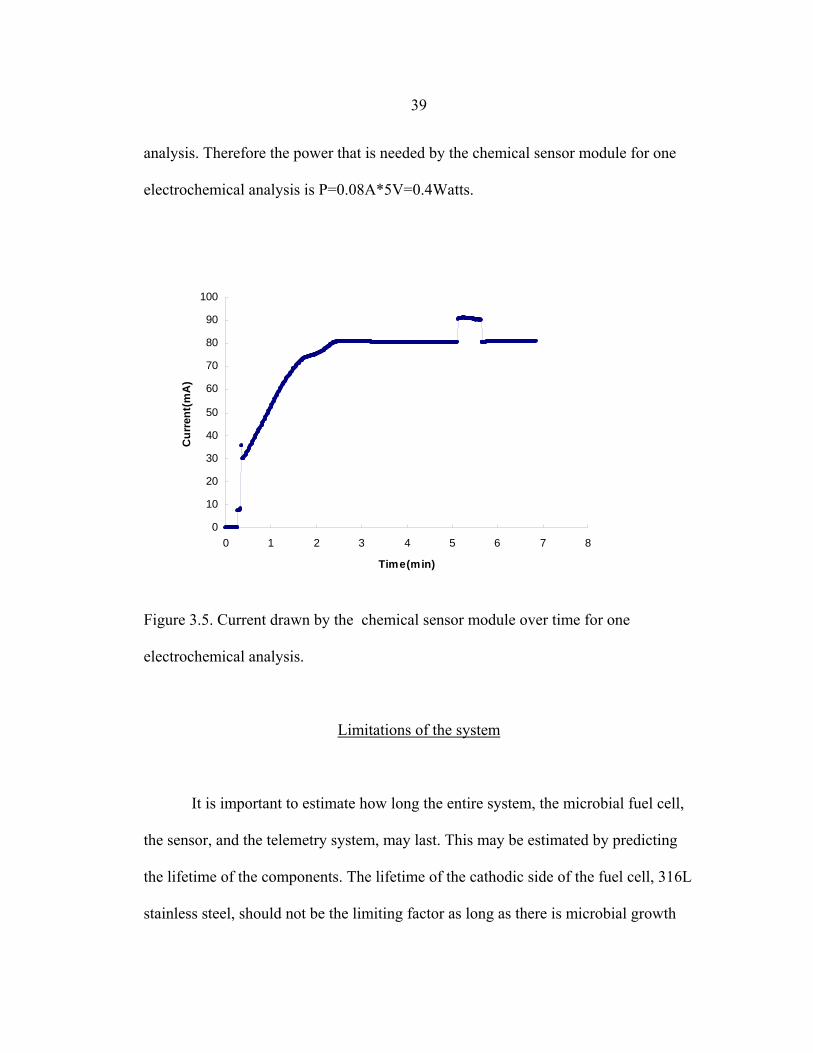
39
analysis. Therefore the power that is needed by the chemical sensor module for one
electrochemical analysis is P=0.08A*5V=0.4Watts.
0
10
20
30
40
50
60
70
80
90
100
0 1 2 3 4 5 6 7 8
Time(min)
Cur
rent
(mA
)
Figure 3.5. Current drawn by the chemical sensor module over time for one
electrochemical analysis.
Limitations of the system
It is important to estimate how long the entire system, the microbial fuel cell,
the sensor, and the telemetry system, may last. This may be estimated by predicting
the lifetime of the components. The lifetime of the cathodic side of the fuel cell, 316L
stainless steel, should not be the limiting factor as long as there is microbial growth
40
and oxygen. Assuming that the life-time of the fuel cell is limited by the life time of
the anode, it can be calculated from the current required to power the telemetry
system and the temperature sensor. Using data available from the manufacturer of the
temperature transmitter system and the sacrificial anodes we estimate that
approximately 0.015 Α is required to measure temperature and transmit data every 8
seconds. The ampere-hour rating of the anodes varies with environmental conditions;
a 0.45kg (265-cm2 initial surface area) magnesium anode can be rated at about 500
ampere-hour (Farwest Corrosion Control Company, Gardena, CA 90248). Therefore,
for 600 cm2of anode surface area it is rated at 1000 ampere-hour. Based on that, the
lifetime of the microbial fuel cell is estimated as: Lifetime (h) with 0.45 kg of anode
= 1000Ah/(0.015A) = 66666 h = 7.61 years. The same calculation can be done for the
chemical sensor module which draws 0.08A for approximately 7 minutes. But for the
chemical sensor we used 4ft2 of cathodic surface area which corresponds to an anodic
surface area of 2400 cm2. This leads to a lifetime of 4000Ah/ (.08A) =5.703 years. If
needed, these numbers can be increased just by increasing the numbers of anodes.
The calculated lifetime depending on the number of the anodes and the current
needed to operate the system is hypothetical and the actual lifetime may vary
depending on environmental conditions. For example, one unknown factor is the rate
of corrosion of the sacrificial anodes, and that can be evaluated by running long-term
tests. However, the lifetime of the anode in this fuel cell can still be controlled by
increasing the surface area of the anode.

41
The lifetimes of the telemetry system and the temperature sensor are limited
by the lifetime of the capacitor, which was listed by the vendor as 10 years. Also, the
telemetry system and temperature system may break down before the capacitor loses
its ability to charge and discharge, or the anode dissolves completely. Altogether, if
carefully designed and protected when deployed, the system can last for years.
42
CHAPTER 4
CONCLUSION
In summary, several studies have shown the possibility of harvesting energy
from the environment using microbial fuel cells, such as harvesting energy from
marine sediments. However, to the best of our knowledge, none of these studies have
demonstrated applications of microbial fuel cells. Our study is the first attempt to use
microbial fuel cells to power two different kinds of sensors with a telemetry system
that transmits the measured data wirelessly.
In the first step, we used our power management circuitry to use the energy
generated by an environmental microbial fuel cell to power a thermocouple-based
temperature sensor. This was successfully demonstrated and the temperature data
were transmitted to a remote receiver. In the second step, we used the same setup to
power a chemical sensor module and the sensor itself. This system was again
successfully tested in the field but since there is close to no copper and lead in the
waters around Hyalite Creek we tested the chemical sensor module in the laboratory
with known concentrations of copper and lead. The data obtained by the chemical
sensor module were successfully transmitted wirelessly to the receiver. These
demonstrations prove that with the implementation of our power management
circuitry it is possible to power various kinds of sensors and telemetry systems using
environmental microbial fuel cells.

43
Using the proposed power management system, future researchers can deploy
various microbially powered sensors. Long-term testing of this system was not
carried out in this study, but will need to be done to determine the long term
reliability of this system in the environment. Further improvements such as the
design of a custom DC-DC converter that is able to boost voltages as low as 0.3V-
0.5V to 5V can be implemented with higher powered transmitters so these sensors
can be deployed in remote locations to monitor environmental parameters.
44
REFERENCES
1. Hart, J. P.; Abass, A. K.; Honeychurch, K. C.; Pemberton, R. M.; Ryan, S. L.; Wedge, R. Sensors/biosensors, based on screen-printing technology for biomedical applications. Indian Journal of Chemistry Section A-Inorganic Bio-Inorganic Physical Theoretical & Analytical Chemistry. 2003, 42(4), 709-718.
2. Brooks, S. A.; Dontha, N.; Davis, C. B.; Stuart, J. K.; O'Neill, G.; Kuhr, W. G. Segregation of micrometer-dimension biosensor elements on a variety of substrate surfaces. Analytical Chemistry. 2000, 72(14), 3253-3259.
3. Baldo, M. A.; Daniele, S.; Ciani, I.; Bragato, C.; Wang, J. Remote stripping analysis of lead and copper by a mercury-coated platinum microelectrode. Electroanalysis. 2004, 16(5), 360-366.
4. Wang, J.; Tian, B. M.; Lu, J. M.; Wang, J. Y.; Luo, D. B.; MacDonald, D. Remote electrochemical sensor for monitoring trace mercury. Electroanalysis. 1998, 10(6), 399-402.
5. Wang, J.; Chen, L.; Mulchandani, A.; Mulchandani, P.; Chen, W. Remote biosensor for in-situ monitoring of organophosphate nerve agents. Electroanalysis. 1999, 11(12), 866-869.
6. Freire, R. S.; Thongngamdee, S.; Duran, N.; Wang, J.; Kubota, L. T. Mixed enzyme (laccase/tyrosinase)-based remote electrochemical biosensor for monitoring phenolic compounds. Analyst. 2002, 127(2), 258-261.
7. Wang, J.; Thongngamdee, S. On-line electrochemical monitoring of (TNT) 2,4,6-trinitrotoluene in natural waters. Analytica Chimica Acta. 2003, 485(2), 139-144.
8. Palma, L. S.; Oliveira, A.; Costa, A. S.; Andrade, A. Q.; Almeida, C. V. R.; Zurita, M. E. P. V.; Freire, R. C. S. Implementation of a feedback I-2-controlled constant temperature environment temperature meter. Sensors. 2003, 3(10), 498-503.
9. Katz, E.; Shipway, A. N.; Willner, I. Biochemical fuel cells, in HandbookofFuelCells–Fundamentals,TechnologyandApplications, Vielstich, W.; Gasteiger, H. A.; Lamm, A., editors; John Wiley & Sons,Ltd: 2003; Chapter 21, pp. 1-27.
10. Kim, N.; Choi, Y.; Jung, S.; Kim, S. Effect of initial carbon sources on the performance of microbial fuel cells containing Proteus vulgaris. Biotechnology and Bioengineering. 2000, 70(1), 109-114.
45
11. Liu, H.; Ramnarayanan, R.; Logan, B. E. Production of electricity during wastewater treatment using a single chamber microbial fuel cell. Environmental Science & Technology. 2004, 38(7), 2281-2285.
12. Cooney, M. J.; Roschi, E.; Marison, I. W.; Comninellis, C.; vonStockar, U. Physiologic studies with the sulfate-reducing bacterium Desulfovibrio desulfuricans: Evaluation for use in a biofuel cell. Enzyme and Microbial Technology. 1996, 18(5), 358-365.
13. Delong, E. F.; Chandler, P. Power from the deep. Nature Biotechnology. 2002, 20(8), 788-789.
14. Zhang, X. C.; Halme, A. Modeling of A Microbial Fuel-Cell Process. Biotechnology Letters. 1995, 17(8), 809-814.
15. Tsujimura, S.; Tatsumi, B.; Ogawa, J.; Shimizu, S.; Kano, K.; Ikeda, T. Bioelectrocatalytic reduction of dioxygen to water at neutral pH using bilirubin oxidase as an enzyme and 2,2 '-azinobis (3-ethylbenzothiazolin-6-sulfonate) as an electron transfer mediator. Journal of Electroanalytical Chemistry. 2001, 496(1-2), 69-75.
16. Oh, S.; Min, B.; Logan, B. E. Cathode performance as a factor in electricity generation in microbial fuel cells. Environmental Science & Technology. 2004, 38(18), 4900-4904.
17. Rabaey, K.; Boon, N.; Siciliano, S. D.; Verhaege, M.; Verstraete, W. Biofuel cells select for microbial consortia that self-mediate electron transfer. Applied and Environmental Microbiology. 2004, 70(9), 5373-5382.
18. Park, D. H.; Zeikus, J. G. Impact of electrode composition on electricity generation in a single-compartment fuel cell using Shewanella putrefaciens. Applied Microbiology and Biotechnology. 2002, 59(1), 58-61.
19. Tender, L. M.; Reimers, C. E.; Stecher, H. A.; Holmes, D. E.; Bond, D. R.; Lowy, D. A.; Pilobello, K.; Fertig, S. J.; Lovley, D. R. Harnessing microbially generated power on the seafloor. Nature Biotechnology. 2002, 20(8), 821-825.
20. Reimers, C. E.; Tender, L. M.; Fertig, S.; Wang, W. Harvesting energy from the marine sediment-water interface. Environmental Science & Technology. 2001, 35(1), 192-195.
21. Shi, X.; Avci, R.; Lewandowski, Z. Microbially deposited manganese and iron oxides on passive metals - Their chemistry and consequences for material performance. Corrosion. 2002, 58(9), 728-738.
46
22. Geiser, M.; Avci, R.; Lewandowski, Z. Microbially initiated pitting on 316L stainless steel. International Biodeterioration & Biodegradation. 2002, 49(4), 235-243.
23. Braughton, K. R.; Lafond, R. L.; Lewandowski, Z. The influence of environmental factors on the rate and extent of stainless steel ennoblement mediated by manganese-oxidizing biofilms. Biofouling. 2001, 17(3), 241-251.
24. Dickinson, W. H.; Lewandowski, Z.; Geer, R. D. Evidence for surface changes during ennoblement of type 316L stainless steel: Dissolved oxidant and capacitance measurements. Corrosion. 1996, 52(12), 910-920.
25. Dickinson, W. H.; Lewandowski, Z. Manganese biofouling and the corrosion behavior of stainless steel. Biofouling. 1996, 10(1-3), 79-&.
26. Dickinson, W. H.; Caccavo, F.; Lewandowski, Z. The ennoblement of stainless steel by manganic oxide biofouling. Corrosion Science. 1996, 38(8), 1407-1422.
27. M.Winter; Brodd What Are Batteries, Fuel Cells, and Supercapacitors? Chem.Rev. 2004, 104 4245-4269.