Embed Size (px)
Citation preview
18th June 2014 Microsec Research
Investment Highlights
Key Financials Highlights (Figure in INR CR)
STRONG BUY
NTPC Ltd
Sector – Power
POWER GENERATION
RETAIL + +
BSE Code 532555
NSE Code NTPC
Bloomberg Ticker NTPC IN
Reuters Ticker NTPC.BO
Face Value (INR) 10.0
Equity Share Capital (In INR Cr) 8,245.5
Average P/E 14.5x
Beta vs Sensex 0.8
Average Daily Volume (000's) 581.4
Dividend Yield 4.1%
Debt/Equity Ratio 0.8
STOCK SCAN
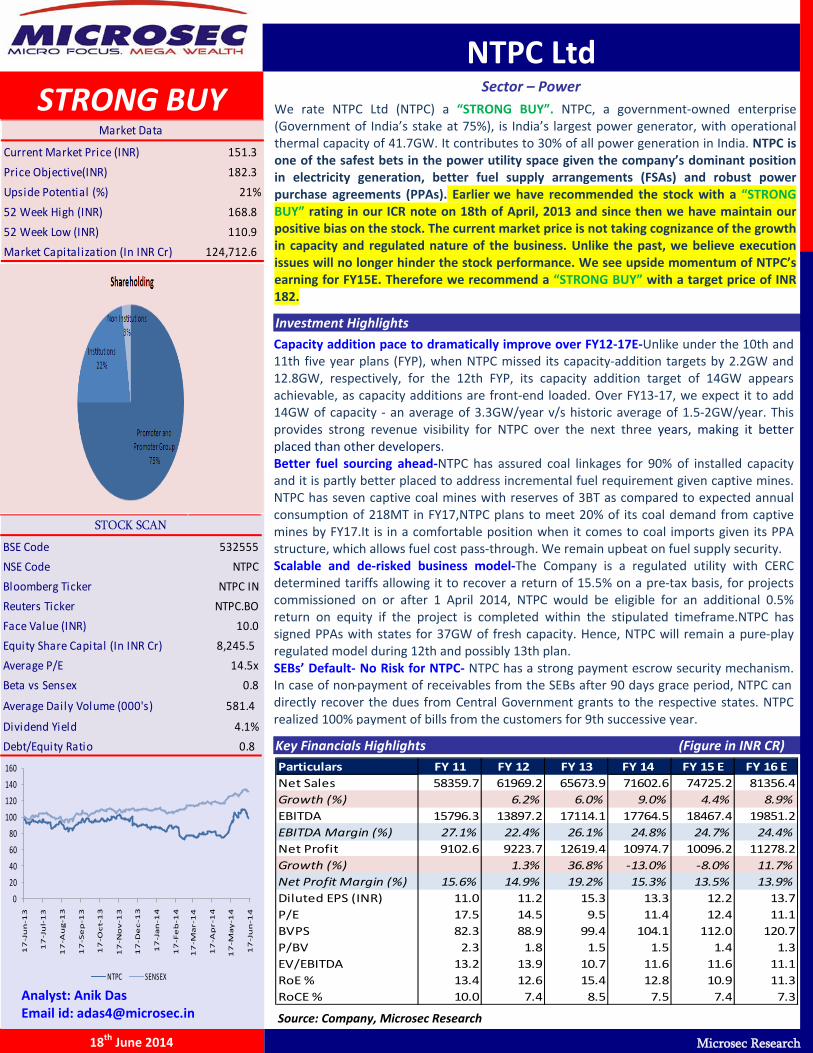
We rate NTPC Ltd (NTPC) a “STRONG BUY”. NTPC, a government-owned enterprise (Government of India’s stake at 75%), is India’s largest power generator, with operational thermal capacity of 41.7GW. It contributes to 30% of all power generation in India. NTPC is one of the safest bets in the power utility space given the company’s dominant position in electricity generation, better fuel supply arrangements (FSAs) and robust power purchase agreements (PPAs). Earlier we have recommended the stock with a “STRONG BUY” rating in our ICR note on 18th of April, 2013 and since then we have maintain our positive bias on the stock. The current market price is not taking cognizance of the growth in capacity and regulated nature of the business. Unlike the past, we believe execution issues will no longer hinder the stock performance. We see upside momentum of NTPC’s earning for FY15E. Therefore we recommend a “STRONG BUY” with a target price of INR 182. Capacity addition pace to dramatically improve over FY12-17E-Unlike under the 10th and 11th five year plans (FYP), when NTPC missed its capacity-addition targets by 2.2GW and 12.8GW, respectively, for the 12th FYP, its capacity addition target of 14GW appears achievable, as capacity additions are front-end loaded. Over FY13-17, we expect it to add 14GW of capacity - an average of 3.3GW/year v/s historic average of 1.5-2GW/year. This provides strong revenue visibility for NTPC over the next three years, making it better placed than other developers. Better fuel sourcing ahead-NTPC has assured coal linkages for 90% of installed capacity and it is partly better placed to address incremental fuel requirement given captive mines. NTPC has seven captive coal mines with reserves of 3BT as compared to expected annual consumption of 218MT in FY17,NTPC plans to meet 20% of its coal demand from captive mines by FY17.It is in a comfortable position when it comes to coal imports given its PPA structure, which allows fuel cost pass-through. We remain upbeat on fuel supply security. Scalable and de-risked business model-The Company is a regulated utility with CERC determined tariffs allowing it to recover a return of 15.5% on a pre-tax basis, for projects commissioned on or after 1 April 2014, NTPC would be eligible for an additional 0.5% return on equity if the project is completed within the stipulated timeframe.NTPC has signed PPAs with states for 37GW of fresh capacity. Hence, NTPC will remain a pure-play regulated model during 12th and possibly 13th plan. SEBs’ Default- No Risk for NTPC- NTPC has a strong payment escrow security mechanism. In case of non-payment of receivables from the SEBs after 90 days grace period, NTPC can directly recover the dues from Central Government grants to the respective states. NTPC realized 100% payment of bills from the customers for 9th successive year.
Source: Company, Microsec Research
Analyst: Anik Das Email id: [email protected]
Current Market Price (INR) 151.3
Price Objective(INR) 182.3
Upside Potential (%) 21%
52 Week High (INR) 168.8
52 Week Low (INR) 110.9
Market Capitalization (In INR Cr) 124,712.6
Market Data
Particulars FY 11 FY 12 FY 13 FY 14 FY 15 E FY 16 ENet Sales 58359.7 61969.2 65673.9 71602.6 74725.2 81356.4Growth (%) 6.2% 6.0% 9.0% 4.4% 8.9%EBITDA 15796.3 13897.2 17114.1 17764.5 18467.4 19851.2EBITDA Margin (%) 27.1% 22.4% 26.1% 24.8% 24.7% 24.4%Net Profit 9102.6 9223.7 12619.4 10974.7 10096.2 11278.2Growth (%) 1.3% 36.8% -13.0% -8.0% 11.7%Net Profit Margin (%) 15.6% 14.9% 19.2% 15.3% 13.5% 13.9%Diluted EPS (INR) 11.0 11.2 15.3 13.3 12.2 13.7P/E 17.5 14.5 9.5 11.4 12.4 11.1BVPS 82.3 88.9 99.4 104.1 112.0 120.7P/BV 2.3 1.8 1.5 1.5 1.4 1.3EV/EBITDA 13.2 13.9 10.7 11.6 11.6 11.1RoE % 13.4 12.6 15.4 12.8 10.9 11.3RoCE % 10.0 7.4 8.5 7.5 7.4 7.3
0
20
40
60
80
100
120
140
160
17
-Ju
n-1
3
17
-Ju
l-1
3
17
-Au
g-1
3
17
-Se
p-1
3
17
-Oc
t-1
3
17
-No
v-1
3
17
-De
c-1
3
17
-Ja
n-1
4
17
-Fe
b-1
4
17
-Ma
r-1
4
17
-Ap
r-1
4
17
-Ma
y-1
4
17
-Ju
n-1
4
NTPC SENSEX
- 2 -
Microsec Research
18th June 2014
Quarterly Results – Q4 FY14 (Figure in INR Cr)
DESCRIPTION Q4 14 Q4 13 Q3 14 YOY QOQ FY14 FY13 YOY
Revenues 21038.83 17366.76 18805.12 21.14% 11.88% 65737.04 72018.93 -8.72%Total Expenditure 16496.28 12572.66 14149.31 31.21% 16.59% 48640.17 54254.39 -10.35%EBITDA 4542.55 4794.10 4655.81 -5.25% -2.43% 17096.87 17764.54 -3.76% EBIDTA Margins 21.59% 27.61% 24.76% (601.38)BPS (316.69)BPS 26.01% 24.67% 134.15 BPS Other Income 599.04 883.70 748.95 3118.77 2688.89Operating Profit 5141.59 5677.80 5404.76 20215.64 20453.43Interest 567.69 591.17 601.03 1924.36 2406.59Exceptional Items 1684.11 1684.11 0.00PBDT 4573.90 6770.74 4803.73 19975.39 18046.84Depreciation 1207.64 1021.26 1024.28 3396.76 4142.19PBT 3366.26 5749.48 3779.45 16578.63 13904.65Tax 272.72 1367.87 918.17 3959.24 2929.91Net Profit 3093.54 4381.61 2861.28 -29.40% 8.12% 12619.39 10974.74 14.99%PAT Margins 14.70% 25.23% 15.22% (1,052.59)BPS (51.15)BPS 19.20% 15.24% 395.81 BPS
Equity Capital 8245.46 8245.46 8245.46 8245.46 8245.46Face Value (In Rs) 10.00 10.00 10.00 10.00 10.00No of Shares 824.55 824.55 824.55 824.55 824.55
Diluted EPS 3.75 5.31 3.47 -29.40% 8.12% 15.30 13.31 14.99%
Coal based TPS PAF 99.8 92.7 95.1 7.10 BPS 4.70 BPS 91.79 87.63 4.16 BPS Gas Based TPS PAF 99.7 95.4 99.8 4.30 BPS (0.10)BPS 92.66 95.24 (2.58)BPS Coal Based TPS PLF 88.6 87.3 82.4 1.30 BPS 6.20 BPS 83.08 81.5 1.58 BPS Gas Based TPS PLF 35.6 42.6 33.5 (7.00)BPS 2.10 BPS 55.98 35.72 20.26 BPS
Operating Metrics
NTPC Ltd - Standalone - Quarterly Annual- Standalone-
Source: Company, Microsec Research
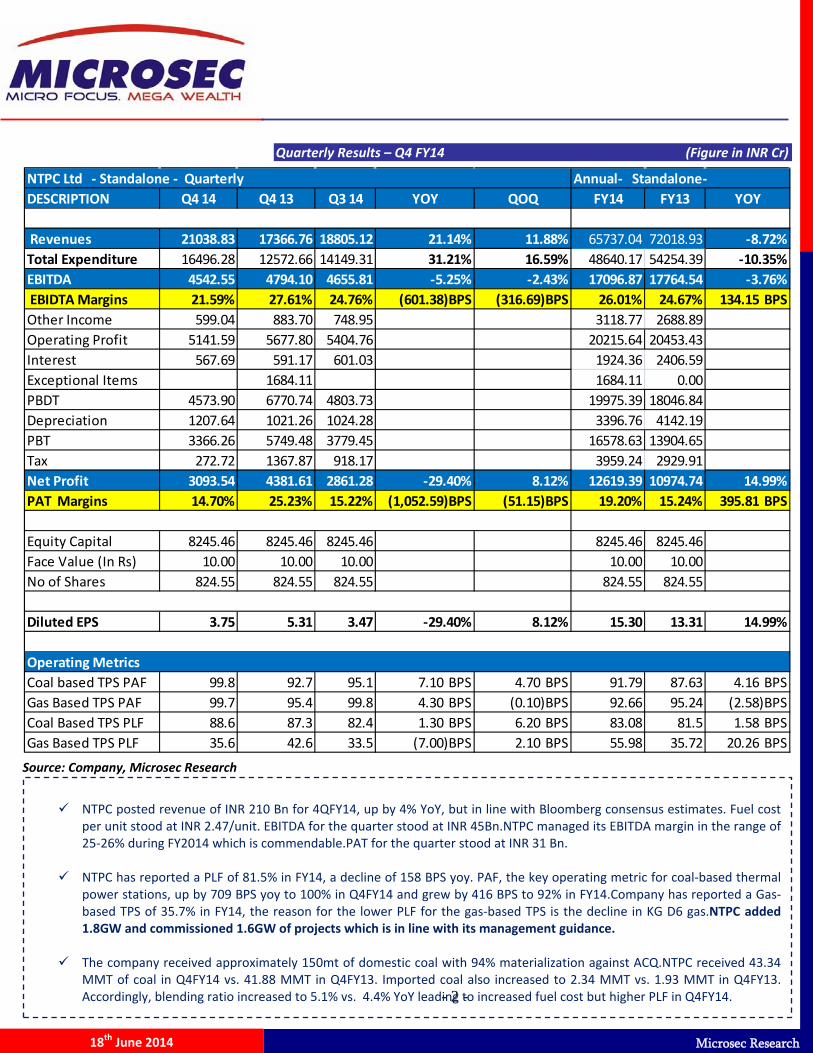
NTPC posted revenue of INR 210 Bn for 4QFY14, up by 4% YoY, but in line with Bloomberg consensus estimates. Fuel cost per unit stood at INR 2.47/unit. EBITDA for the quarter stood at INR 45Bn.NTPC managed its EBITDA margin in the range of 25-26% during FY2014 which is commendable.PAT for the quarter stood at INR 31 Bn.
NTPC has reported a PLF of 81.5% in FY14, a decline of 158 BPS yoy. PAF, the key operating metric for coal-based thermal power stations, up by 709 BPS yoy to 100% in Q4FY14 and grew by 416 BPS to 92% in FY14.Company has reported a Gas-based TPS of 35.7% in FY14, the reason for the lower PLF for the gas-based TPS is the decline in KG D6 gas.NTPC added 1.8GW and commissioned 1.6GW of projects which is in line with its management guidance.
The company received approximately 150mt of domestic coal with 94% materialization against ACQ.NTPC received 43.34
MMT of coal in Q4FY14 vs. 41.88 MMT in Q4FY13. Imported coal also increased to 2.34 MMT vs. 1.93 MMT in Q4FY13. Accordingly, blending ratio increased to 5.1% vs. 4.4% YoY leading to increased fuel cost but higher PLF in Q4FY14.
- 3 -
Microsec Research
18th June 2014
Operational Metrics
Source: Company, Microsec Research
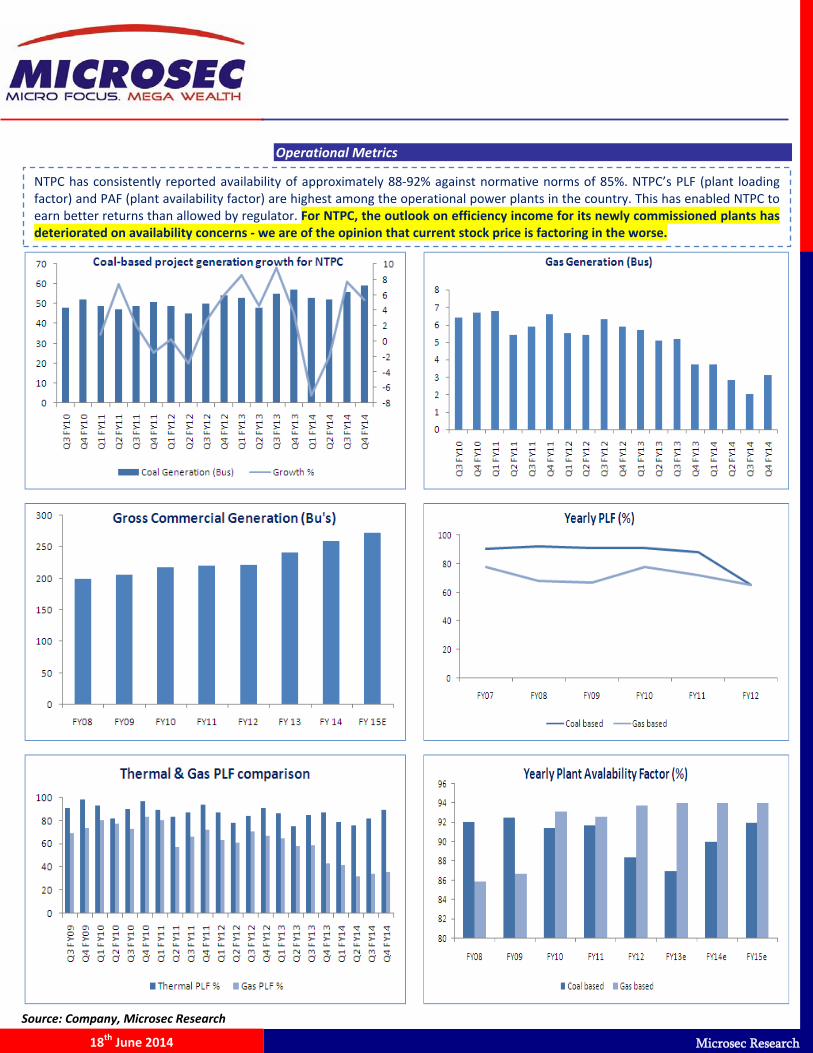
NTPC has consistently reported availability of approximately 88-92% against normative norms of 85%. NTPC’s PLF (plant loading factor) and PAF (plant availability factor) are highest among the operational power plants in the country. This has enabled NTPC to earn better returns than allowed by regulator. For NTPC, the outlook on efficiency income for its newly commissioned plants has deteriorated on availability concerns - we are of the opinion that current stock price is factoring in the worse.
- 4 -
Microsec Research
18th June 2014
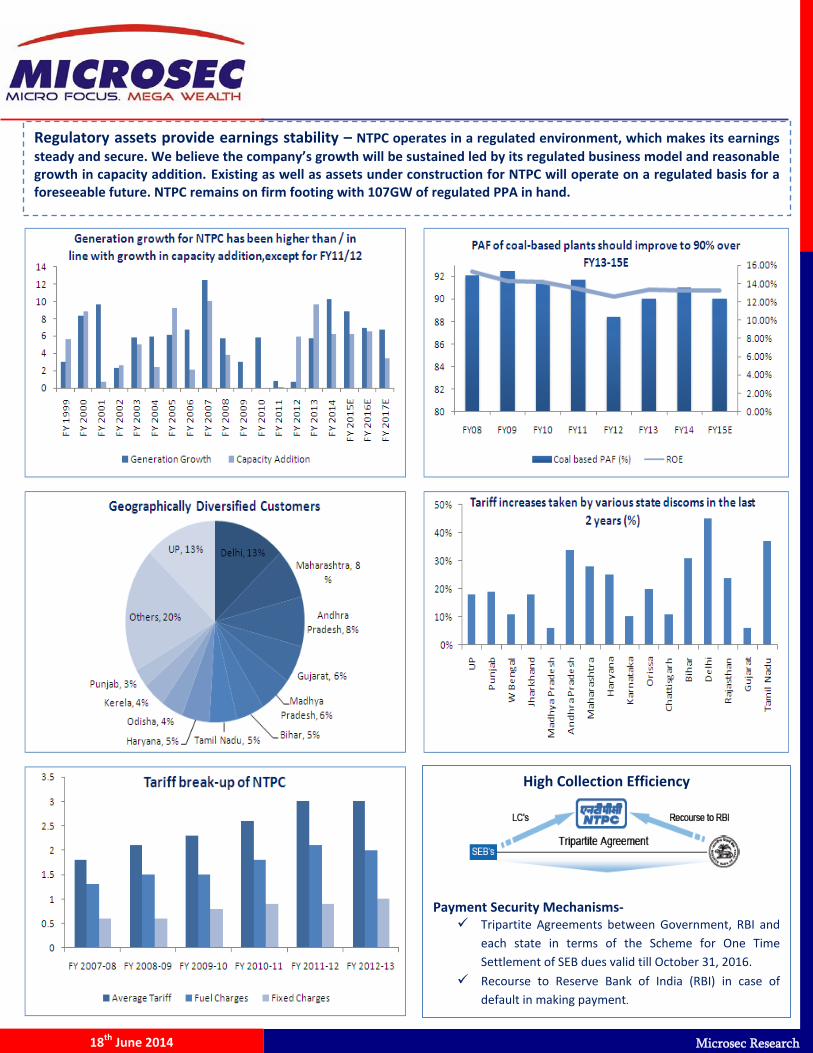
Regulatory assets provide earnings stability – NTPC operates in a regulated environment, which makes its earnings steady and secure. We believe the company’s growth will be sustained led by its regulated business model and reasonable growth in capacity addition. Existing as well as assets under construction for NTPC will operate on a regulated basis for a foreseeable future. NTPC remains on firm footing with 107GW of regulated PPA in hand.
High Collection Efficiency
Payment Security Mechanisms- Tripartite Agreements between Government, RBI and
each state in terms of the Scheme for One Time Settlement of SEB dues valid till October 31, 2016.
Recourse to Reserve Bank of India (RBI) in case of default in making payment.
- 5 -
Microsec Research
18th June 2014
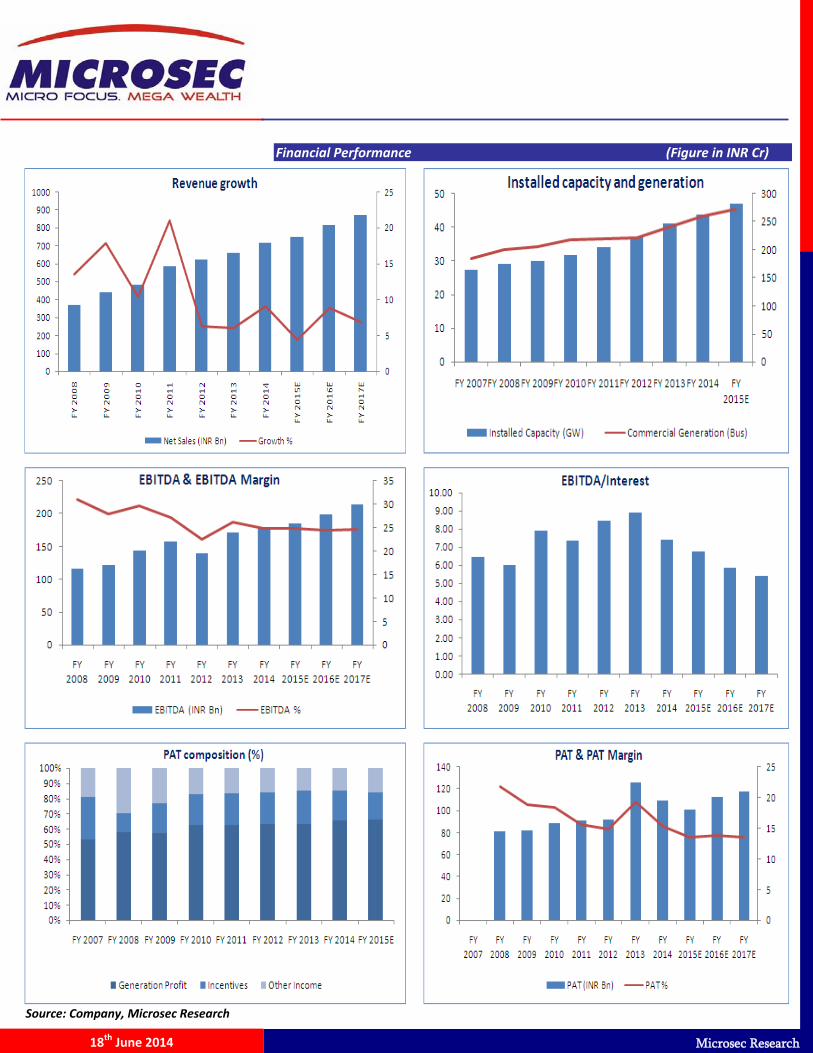
Financial Performance (Figure in INR Cr)
Source: Company, Microsec Research
- 6 -
Microsec Research
18th June 2014
Source: Company, Microsec Research
Source: Company, Microsec Research
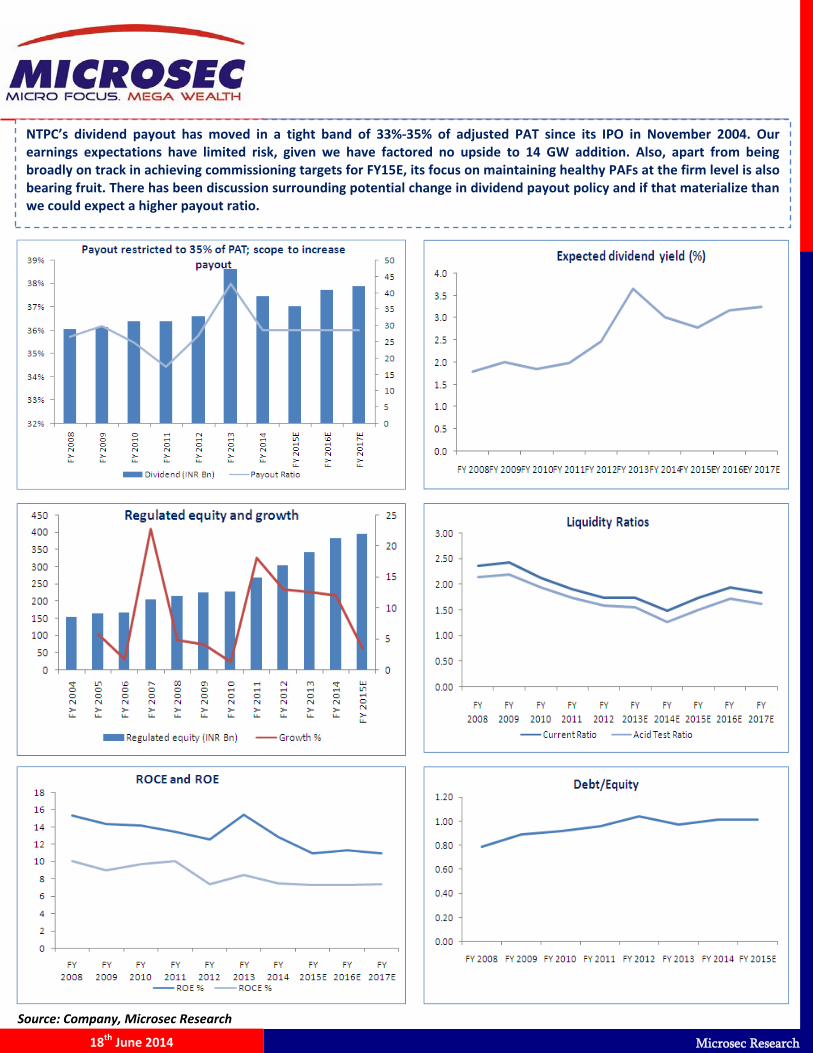
NTPC’s dividend payout has moved in a tight band of 33%-35% of adjusted PAT since its IPO in November 2004. Our earnings expectations have limited risk, given we have factored no upside to 14 GW addition. Also, apart from being broadly on track in achieving commissioning targets for FY15E, its focus on maintaining healthy PAFs at the firm level is also bearing fruit. There has been discussion surrounding potential change in dividend payout policy and if that materialize than we could expect a higher payout ratio.
Source: Company, Microsec Research
- 7 -
Microsec Research
18th June 2014
CERC Regulations for 2014-19 – Only Overhang for NTPC
Acquisition Of Regulated Assets – Possibly the best upside trigger on the stock
Source: Company, Microsec Research
Source: CERC, Microsec Research
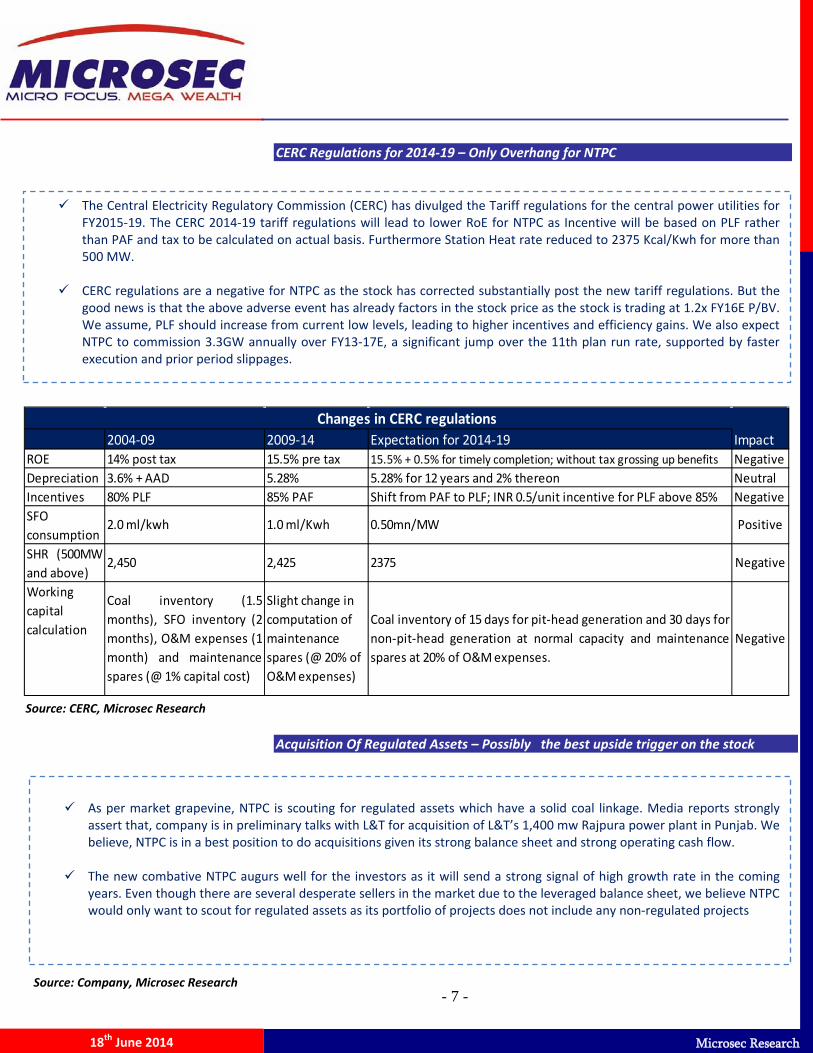
The Central Electricity Regulatory Commission (CERC) has divulged the Tariff regulations for the central power utilities for FY2015-19. The CERC 2014-19 tariff regulations will lead to lower RoE for NTPC as Incentive will be based on PLF rather than PAF and tax to be calculated on actual basis. Furthermore Station Heat rate reduced to 2375 Kcal/Kwh for more than 500 MW.
CERC regulations are a negative for NTPC as the stock has corrected substantially post the new tariff regulations. But the
good news is that the above adverse event has already factors in the stock price as the stock is trading at 1.2x FY16E P/BV. We assume, PLF should increase from current low levels, leading to higher incentives and efficiency gains. We also expect NTPC to commission 3.3GW annually over FY13-17E, a significant jump over the 11th plan run rate, supported by faster execution and prior period slippages.
2004-09 2009-14 Expectation for 2014-19 ImpactROE 14% post tax 15.5% pre tax 15.5% + 0.5% for timely completion; without tax grossing up benefits NegativeDepreciation 3.6% + AAD 5.28% 5.28% for 12 years and 2% thereon NeutralIncentives 80% PLF 85% PAF Shift from PAF to PLF; INR 0.5/unit incentive for PLF above 85% Negative
Changes in CERC regulations
Negative
Positive2.0 ml/kwh 1.0 ml/Kwh 0.50mn/MW
2,450 2,425
SFO consumption
Negative
Working capital calculation
2375
Coal inventory (1.5months), SFO inventory (2months), O&M expenses (1month) and maintenancespares (@ 1% capital cost)
Slight change in computation of maintenance spares (@ 20% of O&M expenses)
Coal inventory of 15 days for pit-head generation and 30 days fornon-pit-head generation at normal capacity and maintenancespares at 20% of O&M expenses.
SHR (500MWand above)
As per market grapevine, NTPC is scouting for regulated assets which have a solid coal linkage. Media reports strongly
assert that, company is in preliminary talks with L&T for acquisition of L&T’s 1,400 mw Rajpura power plant in Punjab. We believe, NTPC is in a best position to do acquisitions given its strong balance sheet and strong operating cash flow.
The new combative NTPC augurs well for the investors as it will send a strong signal of high growth rate in the coming
years. Even though there are several desperate sellers in the market due to the leveraged balance sheet, we believe NTPC would only want to scout for regulated assets as its portfolio of projects does not include any non-regulated projects
- 8 -
Microsec Research
18th June 2014
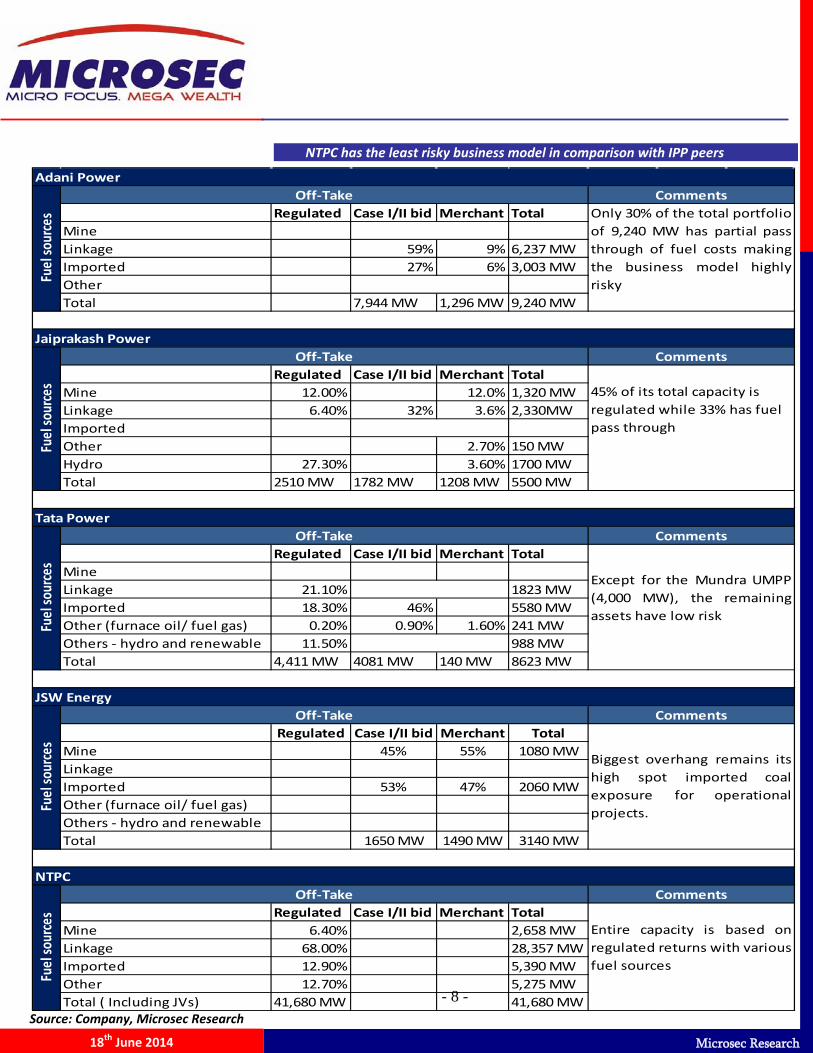
NTPC has the least risky business model in comparison with IPP peers
Source: Company, Microsec Research
Regulated Case I/II bid Merchant TotalMineLinkage 59% 9% 6,237 MWImported 27% 6% 3,003 MWOtherTotal 7,944 MW 1,296 MW 9,240 MW
Regulated Case I/II bid Merchant TotalMine 12.00% 12.0% 1,320 MWLinkage 6.40% 32% 3.6% 2,330MWImportedOther 2.70% 150 MWHydro 27.30% 3.60% 1700 MWTotal 2510 MW 1782 MW 1208 MW 5500 MW
Regulated Case I/II bid Merchant TotalMineLinkage 21.10% 1823 MWImported 18.30% 46% 5580 MWOther (furnace oil/ fuel gas) 0.20% 0.90% 1.60% 241 MWOthers - hydro and renewable 11.50% 988 MWTotal 4,411 MW 4081 MW 140 MW 8623 MW
Regulated Case I/II bid Merchant TotalMine 45% 55% 1080 MWLinkageImported 53% 47% 2060 MWOther (furnace oil/ fuel gas)Others - hydro and renewableTotal 1650 MW 1490 MW 3140 MW
Regulated Case I/II bid Merchant TotalMine 6.40% 2,658 MWLinkage 68.00% 28,357 MWImported 12.90% 5,390 MWOther 12.70% 5,275 MWTotal ( Including JVs) 41,680 MW 41,680 MW
Fuel
sour
ces
Off-Take Comments
Entire capacity is based onregulated returns with various fuel sources
Fuel
sour
ces
Off-Take Comments
45% of its total capacity is regulated while 33% has fuel pass through
Tata PowerOff-Take
NTPC
Off-Take
Fuel
sour
ces
CommentsOnly 30% of the total portfolio of 9,240 MW has partial passthrough of fuel costs makingthe business model highlyrisky
Off-Take
Biggest overhang remains itshigh spot imported coalexposure for operationalprojects.
JSW Energy
Comments
Except for the Mundra UMPP(4,000 MW), the remainingassets have low risk
Comments
Fuel
sour
ces
Fuel
sour
ces
Adani Power
Jaiprakash Power
- 9 -
Microsec Research
18th June 2014
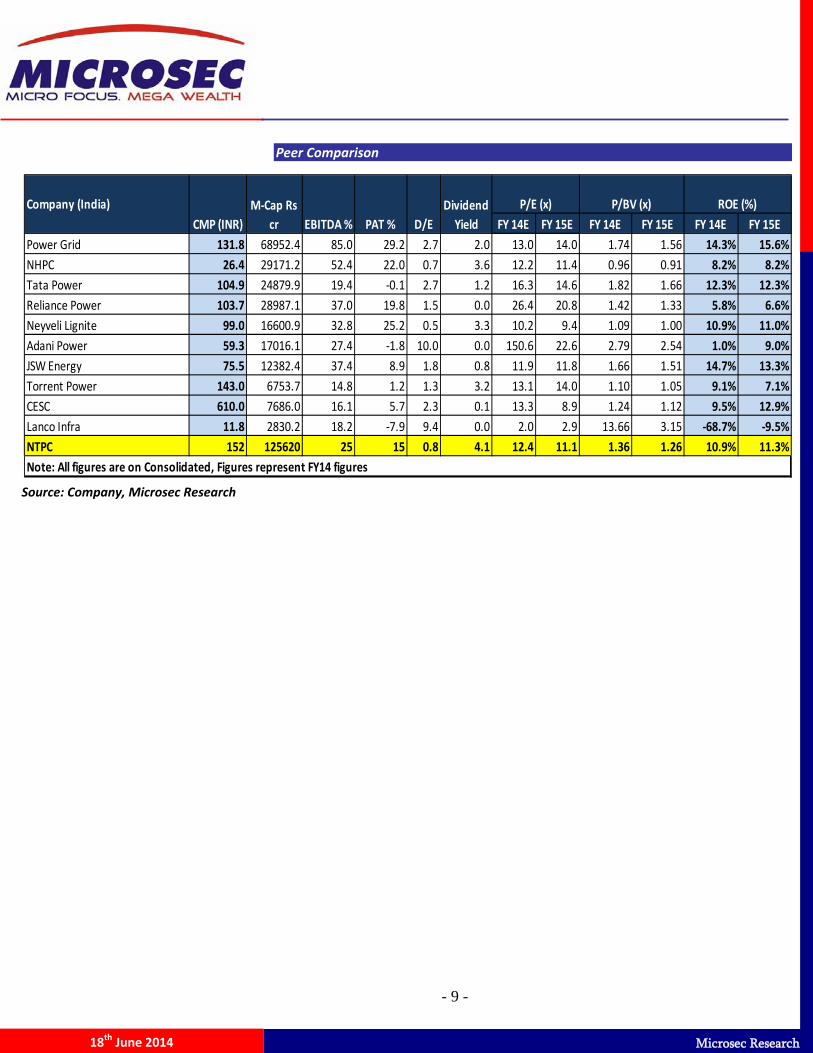
Peer Comparison
Source: Company, Microsec Research
Source: Company, Microsec Research
Source: Company, Microsec Research
FY 14E FY 15E FY 14E FY 15E FY 14E FY 15EPower Grid 131.8 68952.4 85.0 29.2 2.7 2.0 13.0 14.0 1.74 1.56 14.3% 15.6%NHPC 26.4 29171.2 52.4 22.0 0.7 3.6 12.2 11.4 0.96 0.91 8.2% 8.2%Tata Power 104.9 24879.9 19.4 -0.1 2.7 1.2 16.3 14.6 1.82 1.66 12.3% 12.3%Reliance Power 103.7 28987.1 37.0 19.8 1.5 0.0 26.4 20.8 1.42 1.33 5.8% 6.6%Neyveli Lignite 99.0 16600.9 32.8 25.2 0.5 3.3 10.2 9.4 1.09 1.00 10.9% 11.0%Adani Power 59.3 17016.1 27.4 -1.8 10.0 0.0 150.6 22.6 2.79 2.54 1.0% 9.0%JSW Energy 75.5 12382.4 37.4 8.9 1.8 0.8 11.9 11.8 1.66 1.51 14.7% 13.3%Torrent Power 143.0 6753.7 14.8 1.2 1.3 3.2 13.1 14.0 1.10 1.05 9.1% 7.1%CESC 610.0 7686.0 16.1 5.7 2.3 0.1 13.3 8.9 1.24 1.12 9.5% 12.9%Lanco Infra 11.8 2830.2 18.2 -7.9 9.4 0.0 2.0 2.9 13.66 3.15 -68.7% -9.5%NTPC 152 125620 25 15 0.8 4.1 12.4 11.1 1.36 1.26 10.9% 11.3%Note: All figures are on Consolidated, Figures represent FY14 figures
CMP (INR)M-Cap Rs
cr EBITDA % PAT %Dividend
YieldP/E (x) P/BV (x) ROE (%)
D/ECompany (India)
- 10 -
Microsec Research
18th June 2014
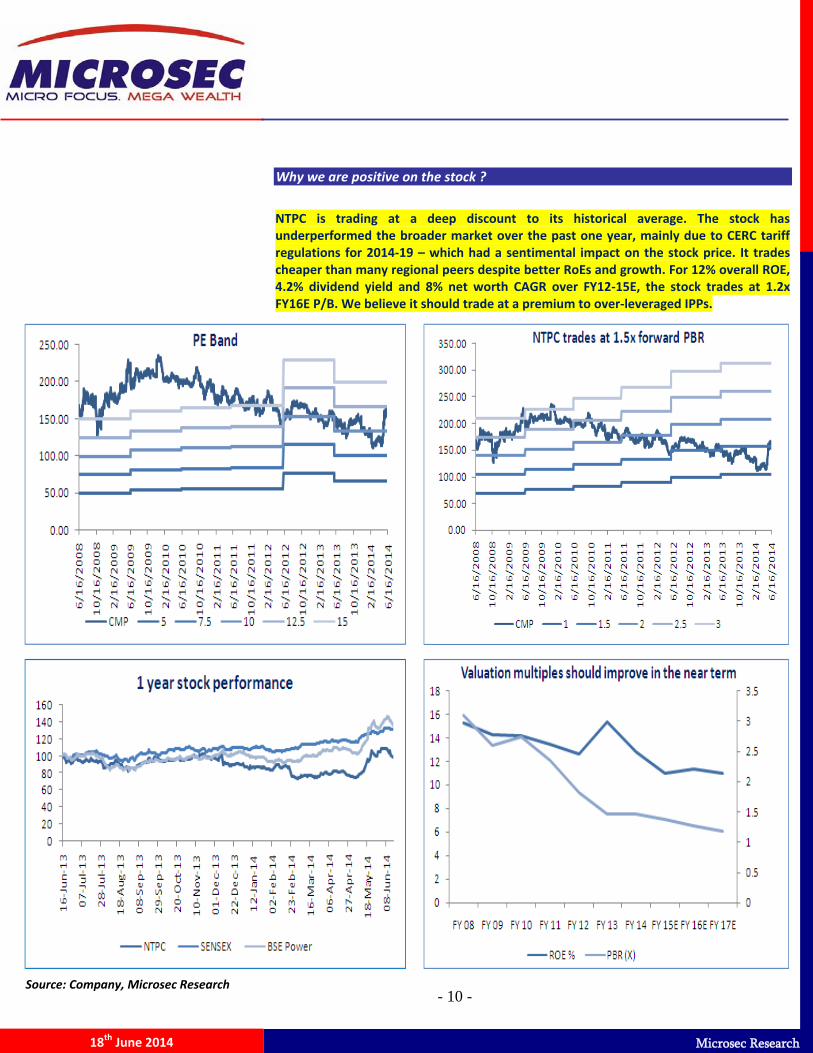
Why we are positive on the stock ?
NTPC is trading at a deep discount to its historical average. The stock has underperformed the broader market over the past one year, mainly due to CERC tariff regulations for 2014-19 – which had a sentimental impact on the stock price. It trades cheaper than many regional peers despite better RoEs and growth. For 12% overall ROE, 4.2% dividend yield and 8% net worth CAGR over FY12-15E, the stock trades at 1.2x FY16E P/B. We believe it should trade at a premium to over-leveraged IPPs.
Source: Company, Microsec Research
- 11 -
Microsec Research
18th June 2014
Valuation & View
We prefer NTPC over other IPPs over the longer term due to (a) a scalable and de-risked business model, (b) a strong balance sheet and (c) maintenance of thermal availability through fuel imports in the near term and coal mining in the longer term. NTPC offers better growth option than any other listed player in an uncertain macro scenario. 16GW of capacity is under construction, while an additional 10GW is under tendering stage. This provides visibility even beyond the 12th Plan period compared to growth holidays for many IPPs that are unable to take up new projects, given stretched balance sheets, issues with existing projects. At the CMP of INR 152 per share, NTPC is quoting at 1.36x and 1.26x its FY15E and FY16E price to book value (P/B), respectively. We have used the discounted cash flow (DCF) method to value NTPC. We have assigned a WACC of 11.14% and assumed a terminal growth rate of 3%. Our DCF based price target is INR 182 which shows an upside potential of 21% from the current market price of INR 152. Hence we recommend a “STRONG BUY” for the stock from long term perspective.
Key Risks
Unforeseen disruptions in coal mining at owned blocks- Coal India plans to supply only 80% of LOA to NTPC’s plants which were commissioned after FY09, leaving NTPC to source the remaining coal from imported sources or its own mines. Thus, any delay in coal mining could supress PAF for NTPC’s plants. Slower than expected capacity additions- Delays in capacity commissioning are not new to NTPC. Continued delays could limit its earnings growth. SEB’s lower drawl to affect incentive income- Apart from fixed ROEs, NTPC earns incentive income under the UI and heat-rate incentive schemes. Such incentive income can get affected by lower demand for power from SEB.
- 12 -
Microsec Research
18th June 2014
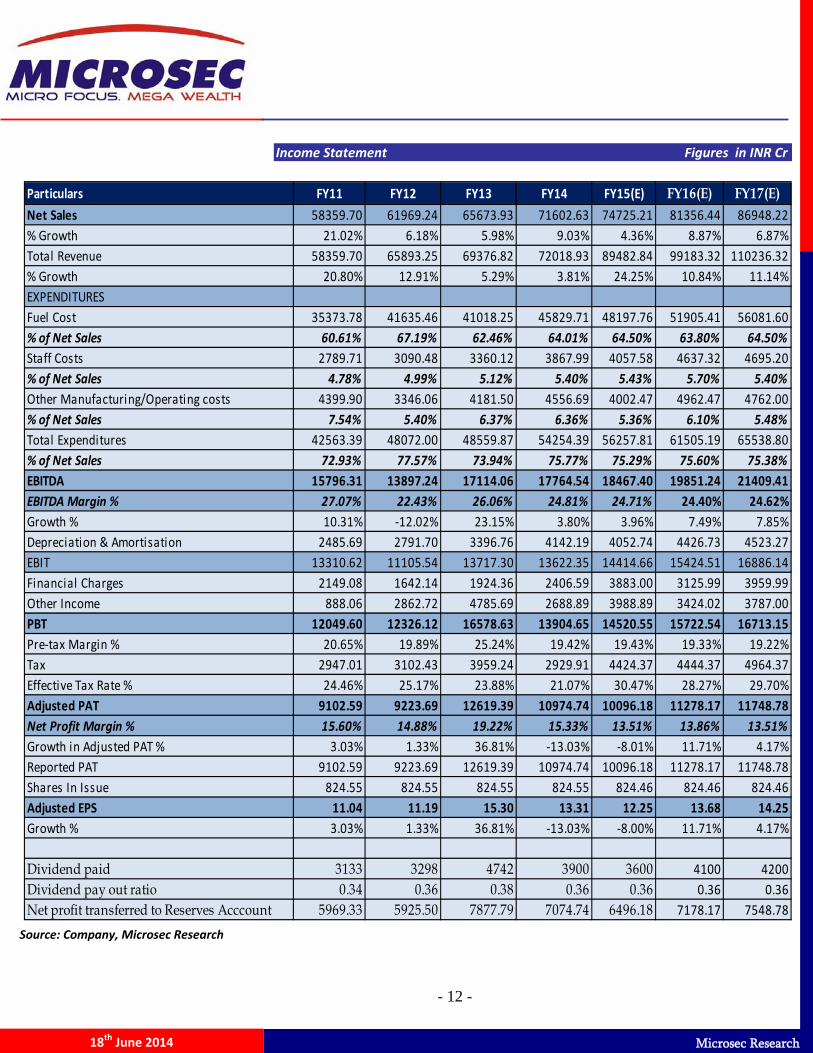
Income Statement Figures in INR Cr
Particulars FY11 FY12 FY13 FY14 FY15(E) FY16(E) FY17(E)Net Sales 58359.70 61969.24 65673.93 71602.63 74725.21 81356.44 86948.22% Growth 21.02% 6.18% 5.98% 9.03% 4.36% 8.87% 6.87%Total Revenue 58359.70 65893.25 69376.82 72018.93 89482.84 99183.32 110236.32% Growth 20.80% 12.91% 5.29% 3.81% 24.25% 10.84% 11.14%EXPENDITURESFuel Cost 35373.78 41635.46 41018.25 45829.71 48197.76 51905.41 56081.60% of Net Sales 60.61% 67.19% 62.46% 64.01% 64.50% 63.80% 64.50%Staff Costs 2789.71 3090.48 3360.12 3867.99 4057.58 4637.32 4695.20% of Net Sales 4.78% 4.99% 5.12% 5.40% 5.43% 5.70% 5.40%Other Manufacturing/Operating costs 4399.90 3346.06 4181.50 4556.69 4002.47 4962.47 4762.00% of Net Sales 7.54% 5.40% 6.37% 6.36% 5.36% 6.10% 5.48%Total Expenditures 42563.39 48072.00 48559.87 54254.39 56257.81 61505.19 65538.80% of Net Sales 72.93% 77.57% 73.94% 75.77% 75.29% 75.60% 75.38%EBITDA 15796.31 13897.24 17114.06 17764.54 18467.40 19851.24 21409.41EBITDA Margin % 27.07% 22.43% 26.06% 24.81% 24.71% 24.40% 24.62%Growth % 10.31% -12.02% 23.15% 3.80% 3.96% 7.49% 7.85%Depreciation & Amortisation 2485.69 2791.70 3396.76 4142.19 4052.74 4426.73 4523.27EBIT 13310.62 11105.54 13717.30 13622.35 14414.66 15424.51 16886.14Financial Charges 2149.08 1642.14 1924.36 2406.59 3883.00 3125.99 3959.99Other Income 888.06 2862.72 4785.69 2688.89 3988.89 3424.02 3787.00PBT 12049.60 12326.12 16578.63 13904.65 14520.55 15722.54 16713.15Pre-tax Margin % 20.65% 19.89% 25.24% 19.42% 19.43% 19.33% 19.22%Tax 2947.01 3102.43 3959.24 2929.91 4424.37 4444.37 4964.37Effective Tax Rate % 24.46% 25.17% 23.88% 21.07% 30.47% 28.27% 29.70%Adjusted PAT 9102.59 9223.69 12619.39 10974.74 10096.18 11278.17 11748.78Net Profit Margin % 15.60% 14.88% 19.22% 15.33% 13.51% 13.86% 13.51%Growth in Adjusted PAT % 3.03% 1.33% 36.81% -13.03% -8.01% 11.71% 4.17%Reported PAT 9102.59 9223.69 12619.39 10974.74 10096.18 11278.17 11748.78Shares In Issue 824.55 824.55 824.55 824.55 824.46 824.46 824.46Adjusted EPS 11.04 11.19 15.30 13.31 12.25 13.68 14.25Growth % 3.03% 1.33% 36.81% -13.03% -8.00% 11.71% 4.17%
Dividend paid 3133 3298 4742 3900 3600 4100 4200Dividend pay out ratio 0.34 0.36 0.38 0.36 0.36 0.36 0.36Net profit transferred to Reserves Acccount 5969.33 5925.50 7877.79 7074.74 6496.18 7178.17 7548.78
Source: Company, Microsec Research
- 13 -
Microsec Research
18th June 2014
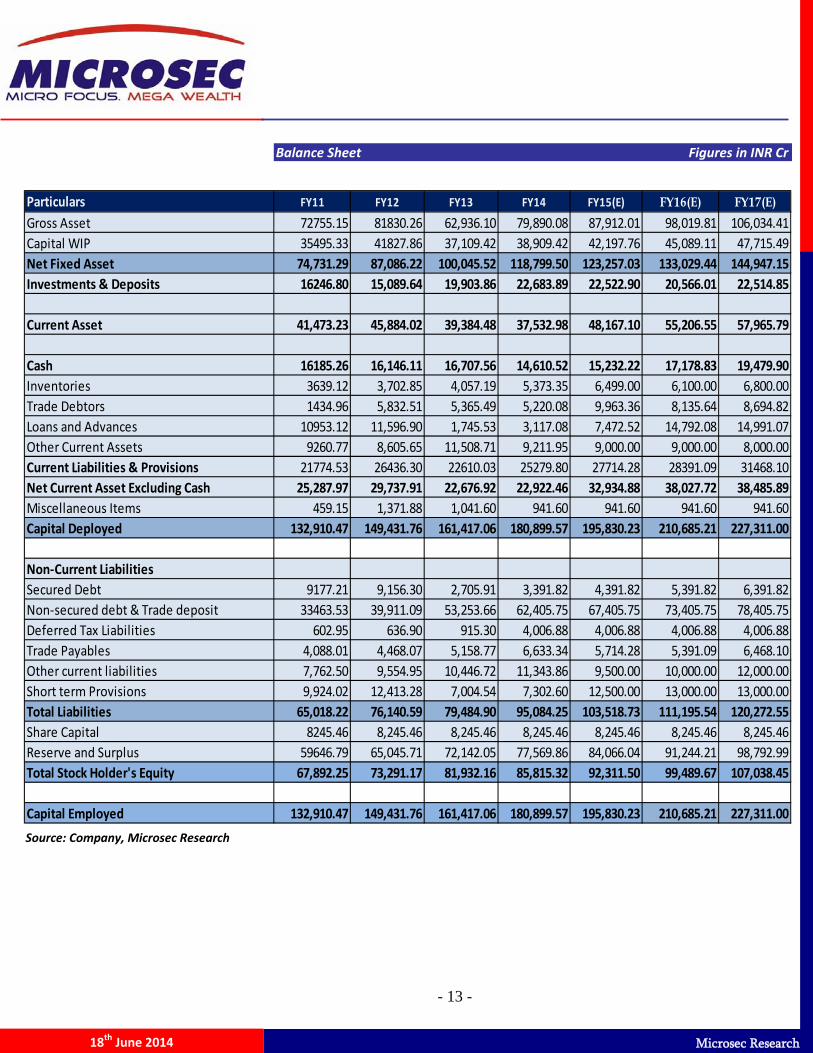
Balance Sheet Figures in INR Cr
Income Statement
Source: Company, Microsec Research
Particulars FY11 FY12 FY13 FY14 FY15(E) FY16(E) FY17(E)Gross Asset 72755.15 81830.26 62,936.10 79,890.08 87,912.01 98,019.81 106,034.41Capital WIP 35495.33 41827.86 37,109.42 38,909.42 42,197.76 45,089.11 47,715.49Net Fixed Asset 74,731.29 87,086.22 100,045.52 118,799.50 123,257.03 133,029.44 144,947.15Investments & Deposits 16246.80 15,089.64 19,903.86 22,683.89 22,522.90 20,566.01 22,514.85
Current Asset 41,473.23 45,884.02 39,384.48 37,532.98 48,167.10 55,206.55 57,965.79
Cash 16185.26 16,146.11 16,707.56 14,610.52 15,232.22 17,178.83 19,479.90Inventories 3639.12 3,702.85 4,057.19 5,373.35 6,499.00 6,100.00 6,800.00Trade Debtors 1434.96 5,832.51 5,365.49 5,220.08 9,963.36 8,135.64 8,694.82Loans and Advances 10953.12 11,596.90 1,745.53 3,117.08 7,472.52 14,792.08 14,991.07Other Current Assets 9260.77 8,605.65 11,508.71 9,211.95 9,000.00 9,000.00 8,000.00Current Liabilities & Provisions 21774.53 26436.30 22610.03 25279.80 27714.28 28391.09 31468.10Net Current Asset Excluding Cash 25,287.97 29,737.91 22,676.92 22,922.46 32,934.88 38,027.72 38,485.89Miscellaneous Items 459.15 1,371.88 1,041.60 941.60 941.60 941.60 941.60Capital Deployed 132,910.47 149,431.76 161,417.06 180,899.57 195,830.23 210,685.21 227,311.00
Non-Current LiabilitiesSecured Debt 9177.21 9,156.30 2,705.91 3,391.82 4,391.82 5,391.82 6,391.82Non-secured debt & Trade deposit 33463.53 39,911.09 53,253.66 62,405.75 67,405.75 73,405.75 78,405.75Deferred Tax Liabilities 602.95 636.90 915.30 4,006.88 4,006.88 4,006.88 4,006.88Trade Payables 4,088.01 4,468.07 5,158.77 6,633.34 5,714.28 5,391.09 6,468.10Other current liabilities 7,762.50 9,554.95 10,446.72 11,343.86 9,500.00 10,000.00 12,000.00Short term Provisions 9,924.02 12,413.28 7,004.54 7,302.60 12,500.00 13,000.00 13,000.00Total Liabilities 65,018.22 76,140.59 79,484.90 95,084.25 103,518.73 111,195.54 120,272.55Share Capital 8245.46 8,245.46 8,245.46 8,245.46 8,245.46 8,245.46 8,245.46Reserve and Surplus 59646.79 65,045.71 72,142.05 77,569.86 84,066.04 91,244.21 98,792.99Total Stock Holder's Equity 67,892.25 73,291.17 81,932.16 85,815.32 92,311.50 99,489.67 107,038.45
Capital Employed 132,910.47 149,431.76 161,417.06 180,899.57 195,830.23 210,685.21 227,311.00
- 14 -
Microsec Research
18th June 2014
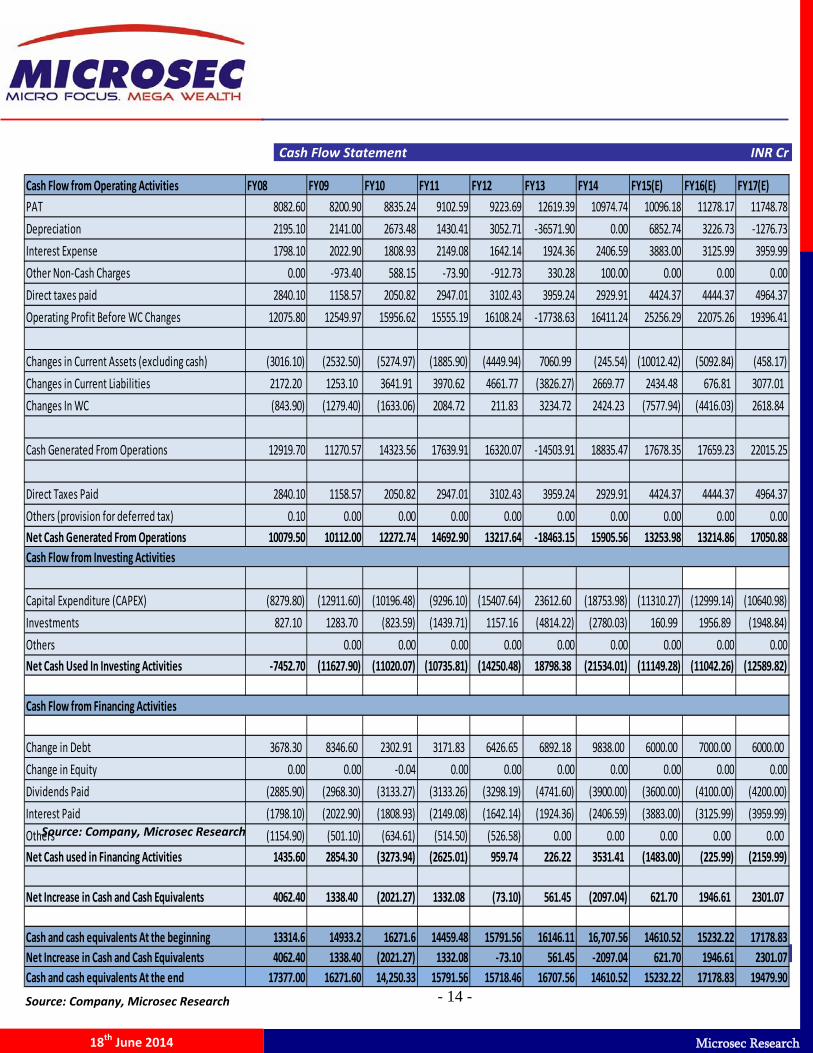
Cash Flow Statement INR Cr
Financial Ratios
Cash Flow from Operating Activities FY08 FY09 FY10 FY11 FY12 FY13 FY14 FY15(E) FY16(E) FY17(E)PAT 8082.60 8200.90 8835.24 9102.59 9223.69 12619.39 10974.74 10096.18 11278.17 11748.78
Depreciation 2195.10 2141.00 2673.48 1430.41 3052.71 -36571.90 0.00 6852.74 3226.73 -1276.73
Interest Expense 1798.10 2022.90 1808.93 2149.08 1642.14 1924.36 2406.59 3883.00 3125.99 3959.99
Other Non-Cash Charges 0.00 -973.40 588.15 -73.90 -912.73 330.28 100.00 0.00 0.00 0.00
Direct taxes paid 2840.10 1158.57 2050.82 2947.01 3102.43 3959.24 2929.91 4424.37 4444.37 4964.37
Operating Profit Before WC Changes 12075.80 12549.97 15956.62 15555.19 16108.24 -17738.63 16411.24 25256.29 22075.26 19396.41
Changes in Current Assets (excluding cash) (3016.10) (2532.50) (5274.97) (1885.90) (4449.94) 7060.99 (245.54) (10012.42) (5092.84) (458.17)
Changes in Current Liabilities 2172.20 1253.10 3641.91 3970.62 4661.77 (3826.27) 2669.77 2434.48 676.81 3077.01
Changes In WC (843.90) (1279.40) (1633.06) 2084.72 211.83 3234.72 2424.23 (7577.94) (4416.03) 2618.84
Cash Generated From Operations 12919.70 11270.57 14323.56 17639.91 16320.07 -14503.91 18835.47 17678.35 17659.23 22015.25
Direct Taxes Paid 2840.10 1158.57 2050.82 2947.01 3102.43 3959.24 2929.91 4424.37 4444.37 4964.37
Others (provision for deferred tax) 0.10 0.00 0.00 0.00 0.00 0.00 0.00 0.00 0.00 0.00Net Cash Generated From Operations 10079.50 10112.00 12272.74 14692.90 13217.64 -18463.15 15905.56 13253.98 13214.86 17050.88
Capital Expenditure (CAPEX) (8279.80) (12911.60) (10196.48) (9296.10) (15407.64) 23612.60 (18753.98) (11310.27) (12999.14) (10640.98)
Investments 827.10 1283.70 (823.59) (1439.71) 1157.16 (4814.22) (2780.03) 160.99 1956.89 (1948.84)
Others 0.00 0.00 0.00 0.00 0.00 0.00 0.00 0.00 0.00Net Cash Used In Investing Activities -7452.70 (11627.90) (11020.07) (10735.81) (14250.48) 18798.38 (21534.01) (11149.28) (11042.26) (12589.82)
Change in Debt 3678.30 8346.60 2302.91 3171.83 6426.65 6892.18 9838.00 6000.00 7000.00 6000.00
Change in Equity 0.00 0.00 -0.04 0.00 0.00 0.00 0.00 0.00 0.00 0.00
Dividends Paid (2885.90) (2968.30) (3133.27) (3133.26) (3298.19) (4741.60) (3900.00) (3600.00) (4100.00) (4200.00)
Interest Paid (1798.10) (2022.90) (1808.93) (2149.08) (1642.14) (1924.36) (2406.59) (3883.00) (3125.99) (3959.99)
Others (1154.90) (501.10) (634.61) (514.50) (526.58) 0.00 0.00 0.00 0.00 0.00Net Cash used in Financing Activities 1435.60 2854.30 (3273.94) (2625.01) 959.74 226.22 3531.41 (1483.00) (225.99) (2159.99)
Net Increase in Cash and Cash Equivalents 4062.40 1338.40 (2021.27) 1332.08 (73.10) 561.45 (2097.04) 621.70 1946.61 2301.07
Cash and cash equivalents At the beginning 13314.6 14933.2 16271.6 14459.48 15791.56 16146.11 16,707.56 14610.52 15232.22 17178.83Net Increase in Cash and Cash Equivalents 4062.40 1338.40 (2021.27) 1332.08 -73.10 561.45 -2097.04 621.70 1946.61 2301.07Cash and cash equivalents At the end 17377.00 16271.60 14,250.33 15791.56 15718.46 16707.56 14610.52 15232.22 17178.83 19479.90
Cash Flow from Financing Activities
Cash Flow from Investing Activities
Source: Company, Microsec Research
Source: Company, Microsec Research
- 15 -
Microsec Research
18th June 2014
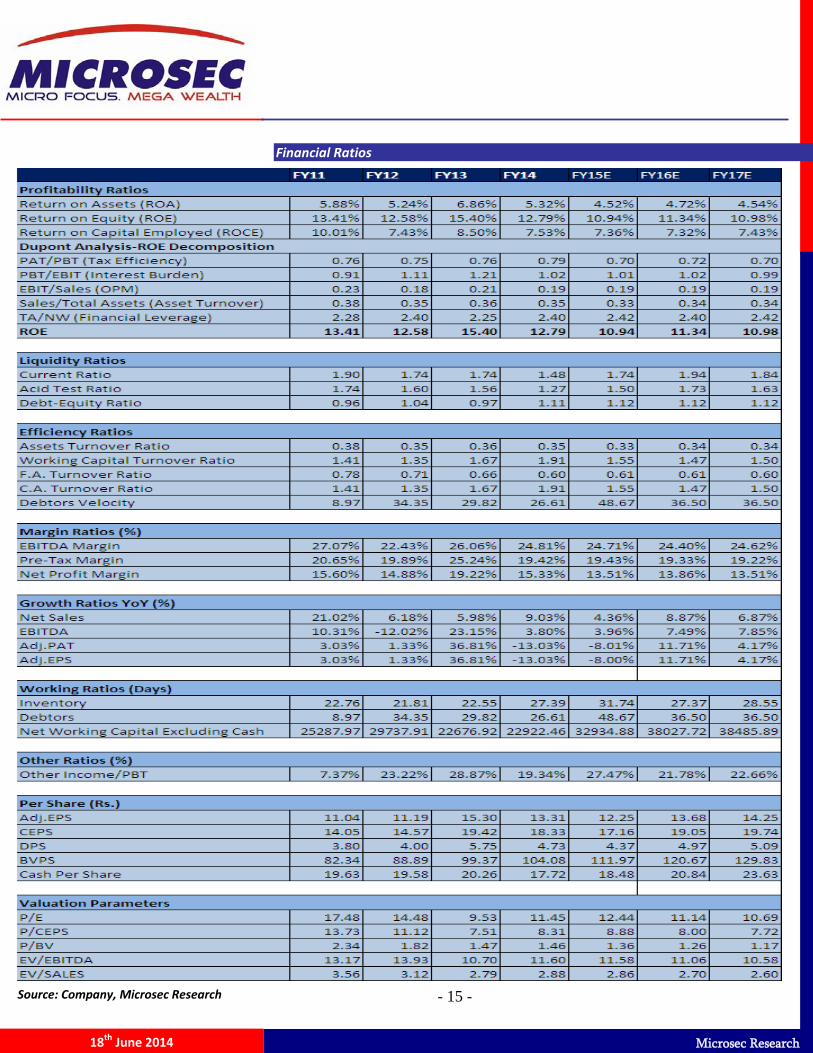
Financial Ratios
Source: Company, Microsec Research
- 16 -
Microsec Research
18th June 2014
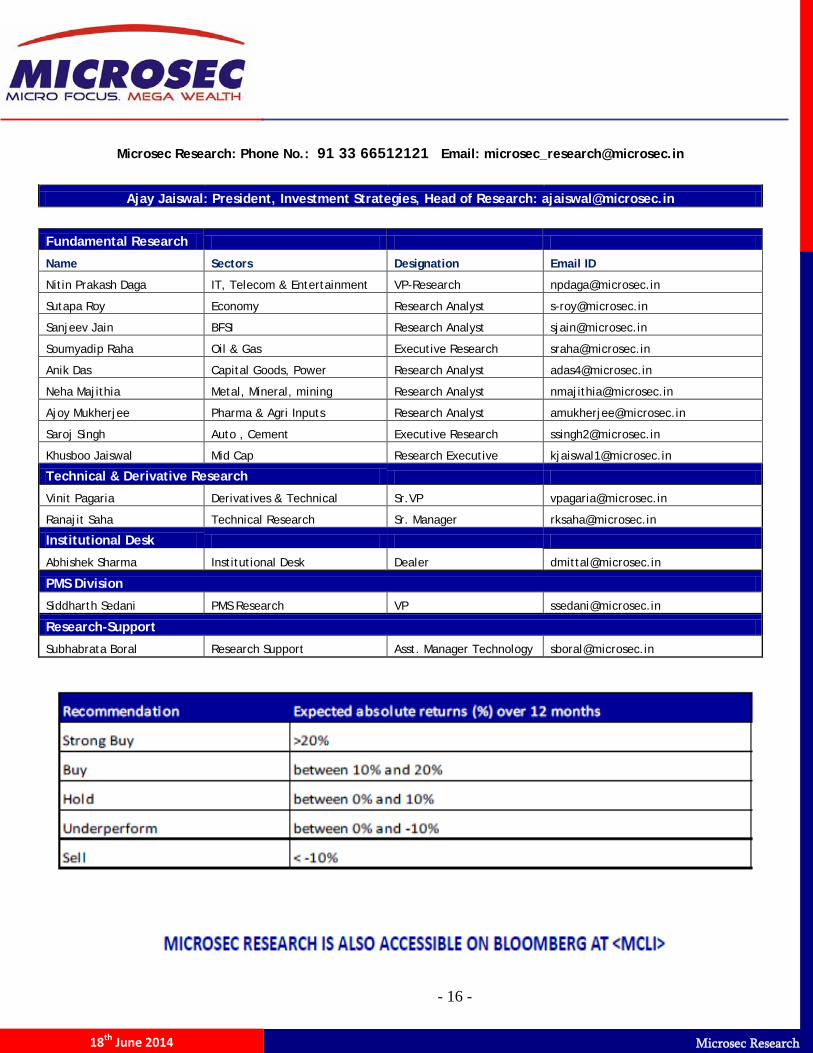
Microsec Research: Phone No.: 91 33 66512121 Email: [email protected]
Ajay Jaiswal: President, Investment Strategies, Head of Research: [email protected]
Fundamental Research
Name Sectors Designation Email ID
Nitin Prakash Daga IT, Telecom & Entertainment VP-Research [email protected]
Sutapa Roy Economy Research Analyst [email protected]
Sanjeev Jain BFSI Research Analyst [email protected]
Soumyadip Raha Oil & Gas Executive Research [email protected]
Anik Das Capital Goods, Power Research Analyst [email protected]
Neha Majithia Metal, Mineral, mining Research Analyst [email protected]
Ajoy Mukherjee Pharma & Agri Inputs Research Analyst [email protected]
Saroj Singh Auto , Cement Executive Research [email protected]
Khusboo Jaiswal Mid Cap Research Executive [email protected]
Technical & Derivative Research
Vinit Pagaria Derivatives & Technical Sr.VP [email protected]
Ranajit Saha Technical Research Sr. Manager [email protected]
Institutional Desk
Abhishek Sharma Institutional Desk Dealer [email protected]
PMS Division
Siddharth Sedani PMS Research VP [email protected]
Research-Support
Subhabrata Boral Research Support Asst. Manager Technology [email protected]
- 17 -
Microsec Research
18th June 2014

- 18 -
Microsec Research
18th June 2014


![PassBy[ME] - Bugzilla integration on CentOS 6.5 · PDF filePassBy[ME] - Bugzilla integration on CentOS 6.5 operating sytem Copyright Microsec Ltd. – 2014.](https://img.pdfslide.us/doc/110x75/5a7520f37f8b9a93088c25bb/passbyme-bugzilla-integration-on-centos-65-passbyme-bugzilla-integration.jpg)