Embed Size (px)
Citation preview

Power ForwardWhy the World’s Largest Companies Are Investing in Renewable Energy
Prepared by David Gardiner & Associates, LLC
WORKING TOGETHER TO REDUCE THE IMPACT OF CLIMATE CHANGE

2 Power Forward

© N
AT
ION
AL
GE
OG
RA
PH
IC S
TO
CK
/SA
RA
H L
EE
N/W
WF
Why the World’s Largest Companies Are Investing in Renewable Energy 1
Contents
AcknowledgementsCalvert Investments, Ceres and WWF would like to thank Ryan Hodum of David Gardiner & Associates as lead author of this report and Mark Molitor as lead researcher. Lead contributors from the participating organizations include Bryn Baker, Marty Spitzer and Matt Banks, WWF; Brian Bowen, Peyton Fleming, Christopher Fox, Anne Kelly, Lance Pierce and Katina Tsongas, Ceres; and Rebecca Henson and Bennett Freeman, Calvert Investments.
Executive Summary ....................................................................................................... 2
Recommendations for Corporations ................................................................... 6
Recommendations for Policy Makers ................................................................... 7
Introduction .................................................................................................................. 9
Report Methodology ........................................................................................... 10
What Targets Are Companies Setting? ............................................................................ 10
Why Are Companies Buying Renewable Energy? ............................................................. 18
How Do Companies Plan to Achieve Their Renewable Energy Commitments? ................... 18
RenewableEnergyCertificates ........................................................................... 19
Power Purchase Agreements .............................................................................. 21
On-Site Direct Investment ................................................................................. 22
What Are the Barriers to Investing in Renewable Energy at Scale? ................................. 23
Cost of Renewable Energy ................................................................................ 23
Case Study: Walmart ......................................................................................... 24
Internal Competition for Capital ....................................................................... 25
Case Study: Johnson & Johnson ........................................................................ 25
Policy .................................................................................................................. 26
Case Study: Sprint .............................................................................................. 27
Recommendations for Corporations and Policy Makers ................................................... 28
Recommendations for Corporations ................................................................ 29
Recommendations for Policy Makers ................................................................ 29
Appendix A ................................................................................................................ 32
Appendix B ................................................................................................................. 37
© N
AT
ION
AL
GE
OG
RA
PH
IC S
TO
CK
/SA
RA
H L
EE
N/W
WF
2 Power Forward
Large corporations are increasingly turning to renewable energy to power their operations. Companies are investing in renewable energy because it makes good business sense: renewable energy helps reduce long-term operating costs, diversify energy supply and hedge against market volatility in traditional fuel markets. It also enables companies to achieve greenhouse gas (GHG) emissions reduction goals and demonstrate leadership on broader corporate sustainability and climate commitments.
Fifty-nine percent of the Fortune 100 and nearly two-thirds of the Global 100 have set GHG emissions reduction commitments, renewable energy commitments or both. As corporations turn to renewable energy to reduce GHG emissions and meet specific sourcing goals, companies are driving significant new investments in renewable energy. Though these pockets of activity are encouraging, with the proper policies, companies could set even stronger renewable energy commitments.
Among the combined Fortune 100 and Global 100 companies, two dozen have set public, voluntary renewable energy commitments. These include globally recognized brands like AT&T, Dow Chemical, General Motors, Google, HSBC, Procter & Gamble, Volkswagen and Walmart.
Global corporate renewable energy commitments are driving global purchasing. For many of the Fortune 100 and Global 100 firms, action on renewable energy is not limited to regional or national levels; it is planned across a global scale. In order to meet their renewable energy targets, companies are developing comprehensive purchasing strategies in every market where they have a significant presence—often in countries core to their supply chains.
Looking at corporate targets by sector, in the Fortune 100, the Materials and Telecommunications sectors have the highest share of companies who have set both GHG and renewable energy commitments. The Industrials and Financial sectors have the highest share of companies that have set GHG targets only. The Energy sector, followed by Health Care, lags in setting either a GHG or renewable energy target (see chart, opposite top).
By sector in the Global 100, the vast majority of utilities have set both GHG and renewable energy targets. Consumer Discretionary companies lead in setting GHG targets, followed by Materials and Consumer Staples. The Energy, Healthcare and Industrials sectors lag in setting targets (see chart, opposite below).
The global transition to a lower carbon economy is accelerating due to rising public concern about climate change. This large-scale trend presents an opportunity for companies to meet corporate climate commitments and diversify their energy sources by purchasing and investing in renewable energy.
EXECUTIVESUMMARY
“We are hoping to demonstrate
environmental responsibility
at Microsoft with our
commitment to be carbon
neutral starting in July 2012.
As part of our accountability
pillar of the overall strategy,
we have established an
internal price on carbon that
will allow us to embed the
cost of carbon in our financial
model and account for the true
cost of our electricity use and
air travel, along with raising
funds for efficiency and
renewable energy projects.
As part of our portfolio
approach to renewable energy,
we are exploring long-term
PPAs, capital in new renewable
energy projects, data centers
with on-site innovative
renewable energy sources,
and RECs and carbon offsets.”
Tamara “TJ” Dicaprio
Senior Director,
Carbon and Renewable Energy,
Microsoft Corporation

Why the World’s Largest Companies Are Investing in Renewable Energy 3
RE Target only GHG Targets GHG and RE TargetsNo Targets
100%
90%
80%
70%
60%
50%
40%
30%
20%
10%
0%
Con
sum
er
Dis
cret
iona
ry
Con
sum
er
Sta
ples
Ene
rgy
Fina
ncia
l
Hea
lth C
are
Info
rmat
ion
Tech
nolo
gy
Mat
eria
ls
Indu
stri
als
Tele
com
-
mun
icat
ions
FORTUNE 100 Percentage of Companies with Climate and Energy Targets by Sector
42 42
17
44 44
13
64
18 18
45
55
50
43
7
25
67
8
30
50
20
100
33
67
Sums greater than 100 are due to rounding.
Util
ities
None
100%
90%
80%
70%
60%
50%
40%
30%
20%
10%
0%
Con
sum
er
Dis
cret
iona
ry
Con
sum
er
Sta
ples
Ene
rgy
Fina
ncia
l
Hea
lth C
are
Info
rmat
ion
Tech
nolo
gy
Mat
eria
ls
Indu
stri
als
Tele
com
-
mun
icat
ions
Util
ities
GLOBAL 100 Percentage of Companies with Climate and Energy Targets by Sector
6
72
22 22
56
22
57
5
33
5
46 46
8
50 50 50 50
33 33 33
67
43 43
14
20
80
Sums greater than 100 are due to rounding.
33

4 Power Forward
1 Bakewell, S. (January 12, 2012). Clean energy investment rises to $260 billion, boosted by solar. Bloomberg. Retrieved from http://www.bloomberg.com/news/2012-01-12/clean-energy-investment-rises-to-a-record-260-billion-on-solar.html2 Houssin, D. (July 5, 2012). IEA sees renewable energy growth accelerating over next five years. International Energy Agency. Retrieved from http://www.iea.org/newsroomandevents/pressreleases/2012/july/name,28200,en.html
In 2011, renewable energy investments reached a record high of $260 billion worldwide.1 At the same time, renewable energy costs continue to decline, with dramatic gains over the past 20 years in wind and solar in particular. Global renewable energy power generation is expected to continue to grow rapidly overthenextfiveyears,accordingtotheInternationalEnergyAgency.2
As companies become more sophisticated in their renewable energy procurement methods,moreandmoreofthemarepursuingdiversifiedapproachestorenewable energy that often include a combination of Renewable Energy Certificates(RECs),whichareamarket-basedmeansoftrackingwhoproducesand who uses renewable energy; Power Purchase Agreements (PPAs), which are contracts to buy power over a negotiated period; and on-site direct investment.
Many companies with a history of predominantly purchasing RECs have transitioned instead to favoring PPAs and on-site direct investment, driven by longer-term commitments to emissions reductions and renewable energy. These companies are looking to capture the long-term value of renewable energy, like electricity price certainty, instead of year-on-year purchases of RECs. In some cases companies are able to get closer to cost parity (the price at which renewable energy is cost competitive with fossil fuel) with long-term PPAs or on-site direct investment. Companies also increasingly recognize that RECs do little to incentivize new investments in renewable energy. By investing directly or signing PPAs, companies are directly adding renewable capacity to the grid.
Principle barriers to accelerating corporate renewable energy purchasing include:
1. A desire by most companies to purchase renewable energy at cost parity or better, which differs across geographies;
2. Internal competition for capital funding that must otherwise drive top-line growth; and
3. Short-term, inconsistent policies that hinder companies from setting and meeting renewable energy commitments, particularly, unstable renewable energy support and an inability for companies to sign PPAs.
In order to meet their corporate sustainability commitments and invest in renewable energy, companies have developed innovative solutions to overcome many of these barriers. Walmart is prioritizing long-term PPAs above other financingmodelsasawayofprocuringlong-term,low-costrenewableenergy.Johnson & Johnson launched a CO2 project capital relief fund to overcome internalcompetitionofcapitalandtodriveimplementationofenergyefficiencyand renewable energy projects at their sites around the world.
Additionally, companies are increasingly engaging in policy advocacy to expand their access to renewable energy and reduce costs. While many companies have aggressive public commitments to renewable energy, the lack of strong, consistent and long-term policies can create uncertainty regarding the price, supply and
“Sprint has committed to
reduce its reliance on fossil
fuels and increase its use of
renewable energy sources
for electricity. That’s why we
have been actively working to
meet our goal to secure 10%
of our total electricity through
renewable energy sources
by 2017. We support the
extension of the Production
Tax Credit for wind because
it has enabled companies
like Sprint to make the shift
to abundant, clean and
homegrown wind energy.”
Amy Hargroves
Manager,
Corporate Social Responsibility,
Sprint
Source: “Business Leaders Urge Congress to Extend Renewable Energy Tax Credit,” Press Release, September 18, 2012 (http://www.ceres.org/press/press-releases/business-leaders-urge-congress-to-extend-renewable-energy-tax-credit)

Why the World’s Largest Companies Are Investing in Renewable Energy 5
Twenty-four companies from the Fortune 100 and Global Fortune 100 have set specific targets—either percentage of energy, capacity (MW) or level of investment—for buying and investing in renewable energy for their own operations. These commitments include:
Assicurazioni Generali: 28 MW of renewable energy by 2014 (which includes a €40 million investment in solar, wind and biomass)
AT&T: 5 MW of alternative energy from fuel cell and solar production by 2012 (relative to 2011 capacity baseline of 3,888 kW)
BP: Invest $8 billion in renewable energy between 2005 and 2015
Caterpillar: 20% renewable energy by 2020
Chevron: Invest $2.2 billion between 2011 and 2013 in renewable energy andefficiency
Deutsche Post: Increase percentage of electricity generated from renewable energy sources to 60% by 2012
Dow Chemical: 50% zero carbon energy by 2050
DuPont: Reduce nonrenewable energy use by 10% per adjusted dollar revenue by 2020 (relative to 2010 baseline)
E.ON: Invest €7 billion in renewable energy by 2017
Électricité de France: Long-term goal of 1,000 MW of renewable energy production
Enel: Increase net installed capacity of renewables by 6.6 GW by 2016 in Latin America, Russia and Eastern Europe
GDF Suez: Increase installed renewable energy capacity by 50% between 2009 and 2015
General Motors: Utilize 125 MW of renewable energy by 2020 (globally), including a commitment to double solar power from 30 to 60 MW by 2015
Google: 100% renewable energy (long-term goal)
Hess: 10% renewable energy for company operations (long-term goal)
Hewlett-Packard: 8% renewable energy by 2012
HSBC Holdings: 40% renewable energy by 2020
Johnson & Johnson: 50 MW of renewable energy by 2015
News Corporation: 20% renewable energy by 2015
Procter & Gamble: 30% renewable energy by 2020 (100% long-term goal)
Samsung Electronics: Install 2.4 MW of renewable energy by 2017
Sprint Nextel: 10% renewable energy by 2017
Volkswagen: Invest €1 billion in the expansion of renewable energy resources including solar and wind by 2020
Walmart: 100% renewable energy (long-term goal)
© N
AT
ION
AL
GE
OG
RA
PH
IC S
TO
CK
/JA
SO
N E
DW
AR
DS
/WW
F

6 Power Forward
deployment of renewable energy. In many markets, government incentives for renewable energy help make projects feasible, such as solar RECs in New Jersey or the renewable energy feed-in tariffs in Germany and the United Kingdom. Not all markets allow companies to seek PPAs with renewable energy providers, for example. As a result of renewable energy policy uncertainty, many companies with corporate renewable energy commitments, including Hewlett-Packard, Johnson & Johnson and Sprint, are engaged in policy advocacy, both directly with legislators and in support of key policies such as the Production Tax Credit (PTC) for wind. Others are seeking to change the rules so they can sign PPAs and choose where and how they source their energy. As large electricity consumers with significantpoliticalclout,corporatepurchasersofrenewableenergyare,inmanycases,redefiningtheverypoliticsofrenewableenergy.
Corporate commitments are driving renewable energy investments. The combination of a sluggish recovery from the global economic crisis and austerity measurestotacklebudgetdeficitshashadasignificantimpactonrenewableenergydeploymentacrossnearlyeverymarket,drawingdownfinancialsupportfrom government incentives, which typically have been a key driver for renewable energy investment. Corporate investment in renewable energy, therefore, is even more important as a driver of renewable energy markets in the near term. Investing in renewable energy has become an integral part of what it means to be asustainablecompanyinthe21stcentury,whichhassignificantimplicationsforelectric utility companies as more large electricity consumers shift to renewable energy.Thefindingsofthisreportalsohaveimplicationsforpolicymakers,whoshould be moving to expand availability of renewable energy to lower prices in order to meet the growing demand among the world’s largest corporations.
Recommendations for Corporations• Companies that do not have renewable energy or GHG commitments should settime-boundtargets.Thereisastrongeconomiccaseandsignificantprecedent for setting a corporate commitment to manage climate risks.
• Companies with GHG targets should also set renewable energy targets, or at a minimum ensure that renewable energy is a part of any GHG reduction strategy.Specificrenewableenergytargetsarestronglyencouragedbecausethey clearly explain a company’s commitment to renewable energy. While energyefficiencyisencouragedasthefirstandleast-costinvestment,companies—especiallygrowingcompanies—willnotachievetheirclimatecommitmentsthroughefficiencyalone;itwillrequireparallelinvestments in renewable energy.
• Companies should be fully transparent in reporting their GHG commitments and the role that renewable energy should play in meeting them, using emerging global standards for Scope 2 carbon accounting. Companies should publicly disclose the amount of renewable energy they purchase annually compared to their total energy consumption, in order to measure progress.
• Companies should identify opportunities to support local, state and national policies that remove barriers to scale up renewable energy and enable companies to achieve their climate commitments. Companies are already seeing thevalueofengaginginspecificenablingpoliciesthatimproveaccesstoandreduce the cost of renewable energy. All companies should be engaged in policy
Why the World’s Largest Companies Are Investing in Renewable Energy 7
advocacy because it helps increase availability of renewable energy and lower prices, while bringing corporate commitments and public policy positions in line with one another.
Recommendations for Policy Makers• U.S. policies that promote renewable energy, like the Production Tax Credit
for wind or feed-in tariffs for solar, should be extended. The PTC in particular has enabled the wind industry to dramatically slash energy costs, which eliminates an important barrier to purchasing renewable energy. Allowing the PTC to expire will immediately raise prices for companies committed to buying renewable energy.
• State utility regulators should authorize the use of third-party PPAs and remove policies that limit the development of on-site renewable power generation. Currently, PPAs are not allowed or are otherwise restricted in Florida, Georgia, Iowa, Kentucky and North Carolina.3 As companies increasingly look to PPAs to procure long-term, cost-effective renewable energy, policy makers and utility regulators must work together to enable increased corporate access to renewable energy.
• Renewable Portfolio Standards (RPSs) should be enacted in all U.S. states, eitherthroughstatelegislaturesorthroughafederalRPS.AnRPSrequiresutilities to procure a minimum amount of electricity from renewable sources. In the 30 states and Washington, D.C. where they currently exist, governors and state legislators should strengthen and expand RPSs. RPS mandates have driven one third of new renewable electricity in the United States.4
• Because the Fortune 100 and Global 100 operate internationally, policies such as feed-in tariffs and renewable energy mandates are needed to kick-start renewable energy industries, particularly in emerging markets. Many countries criticaltoglobalsupplychainshavefledglingrenewableenergymarketsthatrequirestablesupportandclearpolicies.Inothermarkets,likeChina,voluntarygreen power markets do not yet exist, and incentives and market structures must be created.
• Ultimately,policiesthatenabledeepercostreductionstoleveltheplayingfieldwithconventionalenergysourcesareneeded.Companiesarealreadysignificantdrivers of renewable energy purely through voluntary efforts, but to reach the scale and pace needed to address the challenge of climate change, policies are needed that enable more companies across more sectors to use renewable energy cost-competitively. These include market-based solutions that price negativeexternalitiesandallowbusinessestofindthemostcost-effectivemeasures to achieve their GHG and renewable energy commitments.
3 DSireSolar (August 2012). Third-party solar PV PPAs. Retrieved from http://www.dsireusa.org/documents/summarymaps/3rd_Party_PPA_map.pdf 4 Fulton, M., & Capalino, R. Deutche Bank Group, Deutche Bank Climate Change Advisors (2012). Ramping up renewables: Leveraging state RPS programs amid uncertain federal support. Retrieved from the U.S. Partnership for Renewable Energy Finance website: http://www.dbcca.com/dbcca/EN/_media/Ramping_up_Renewables-Leveraging_State_RPS_Programs_amid_Uncertain_Federal_Support.pdf

Why the World’s Largest Companies Are Investing in Renewable Energy 9
IntroductionTheworld’slargestcompaniesunderstandthebenefitsofrenewableenergy,motivating many to set voluntary corporate renewable energy commitments that scale up their use of renewable energy. Companies are driven to adopt these targets by a combination of factors, including an attractive economic return on investment, climate science and evidence of increasing climate impacts, concern from the public and their customers about environmental and social issues, as well as public policies that increasingly support renewable energy. Renewable energy has become an integral part of corporate sustainability and climate plans.
This report is designed to clarify the size and scope of corporate renewable energy commitments in order to shed greater light on their level of ambition and impact. In addition, this report seeks to better understand the business case behind why members of the Fortune 100 (America’s largest corporations by revenue) and Global 100 (the world’s largest corporations by revenue) are investingsignificantlyinrenewableenergywhen,formany,thereisnolegalobligation to do so.
WWF, Calvert and Ceres have commissioned this review of corporate renewable energy and climate commitments by David Gardiner & Associates. All three organizations work extensively with businesses to promote renewable energy and corporate sustainability through partnership programs and/or shareholder advocacy, and all three organizations recognize the urgency for corporate action to mitigate climate change.
In an era of rapidly changing expectations, opportunities and risks, this report is meant to offer recommendations and models of success to corporate sustainability officersandinvestorsastheydevelopandimplementcorporaterenewableenergycommitments and GHG emissions reduction strategies. This review will provide both audiences with a clearer overall picture of existing corporate renewable energycommitmentsandwillidentifythemajorissues—bothopportunitiesandbarriers—relatedtostrengtheningthosecommitmentswithinalargercorporatesustainability strategy. The review will also help the renewable energy industry, policy makers and the media better understand corporate renewable energy customersaswellasthepoliciesneededtoleveltheplayingfieldtoenablelargecorporate purchasers of energy to continue purchasing renewable energy at scale.
Recent reports from Ceres and WWF offer companies clear guidelines for designing and achieving corporate renewable energy and GHG emissions reduction commitments. WWF’s Energy Report: 100% Renewable Energy by 2050 lays out the vision and the technical feasibility of a world run almost entirely on renewable energy by 2050.5 The Road to 2020: Corporate Progress on the Ceres Roadmap for Sustainability, a recent publication by Ceres and Sustainalytics, reviews how U.S. companies are making progress on their sustainability commitments, including renewable energy and GHG emissions reduction.6 The report recommends that in order to achieve emissions reduction
“We aim to make production
operations at our plants
around the world 25% more
eco-friendly by 2018. In
concrete terms, that means
25% less energy and water
consumption, emissions and
waste. One major contributory
factor here is the €600 million
investment we are making
in energy from renewables,
including solar and
hydroelectric power and wind
energy [recently increased
to €1 billion]. This will lead to
a 40% drop in CO2 emissions
from energy supplies to our
production plants.”
Martin Winterkorn
Chairman of the Board
of Management,
Volkswagen Aktiengesellschaft
and Bernd Osterloh
Chairman of the General and
Group Works Councils
5 WWF (February 3, 2010). The energy report: 100% renewable energy by 2050. Retrieved from http://wwf.panda.org/what_we_do/footprint/climate_carbon_energy/energy_solutions/renewable_energy/sustainable_energy_report/6 (2012). The road to 2020: Corporate progress on the Ceres roadmap for sustainability. Boston, MA: Ceres, Sustainalytics.
Source: 2011 Volkswagen Sustainability Report (http://sustainability-report2011.volkswagenag.com/en.html)
© W
OR
RA
DIR
EK
MU
KS
AB
/123
RF

10 Power Forward
targets advised by the Intergovernmental Panel on Climate Change, companies must source 30% of their energy from renewable sources by 2020 and reduce GHG emissions 25% by 2020 (from a 2005 baseline).
Report MethodologyThis report evaluates how companies are committing to purchase renewable energy, with a focus on operations. Our analysis offers a prospective assessment of how and at what scale companies are committed to investing in and procuring renewable energy.
Thefindingsinthisreportarebasedonpubliclyavailableinformation, including annual corporate sustainability reports, 2012 responses to the Carbon Disclosure Project, the EPA Green Power Partnership and the 2012 Global Corporate Renewable Energy Index, created by Bloomberg New Energy Finance and Vestas. In particular, this report examines the publicly available information on companies in the Fortune 100 and Global 100. The Global 100 includes 29 companies also in the Fortune 100, which should be taken into consideration when attempting to compare the scope and scale of commitments across both lists. In order to supplement this research, this report also includes trends and highlights from nearly 20 interviews with Fortune 100 senior executives. Important caveats to consider are that publicly available data can be imperfect and interviews were conducted with only a limited set of companies that do not represent a comprehensive view of the economy.
This study complements recent research on corporate renewable energy trends, most notably the 2012 Global Corporate Renewable Energy Index by Bloomberg New Energy Finance and Vestas, by also including GHG emissions reduction commitments, given that a portion of that climate commitment would be met by investments in renewable energy. While the report does not focus on energy efficiency,itisnotmeanttodiminishitsimportance—corporateleadersoftenpursueadiversifiedapproachtoenergyprocurement,whichshouldincludeasignificantfocusonenergyefficiencyinadditiontorenewableenergy.“Renewableenergy” in this report usually refers to renewable electricity (though companies also procure renewables for thermal needs) and will not include transport energy.
What Targets Are Companies Setting?Fortune 100 and Global 100 companies are buying renewable energy today and plan to buy more tomorrow, driven largely by corporate renewable energy commitments and GHG emissions reduction commitments.
Corporate renewable energy commitments differ by scope, scale and level of ambition. Commitment types are typically one of three options: a percentage of total energy (e.g., HSBC Holdings will secure 40% renewable energy by 2020), an absolute procurement target (e.g., Johnson & Johnson will procure 50 MW of renewable energy by 2015) or a target investment level (e.g., Volkswagen will invest €1 billion in renewable energy resources including solar, wind and hydroelectric power by 2020).
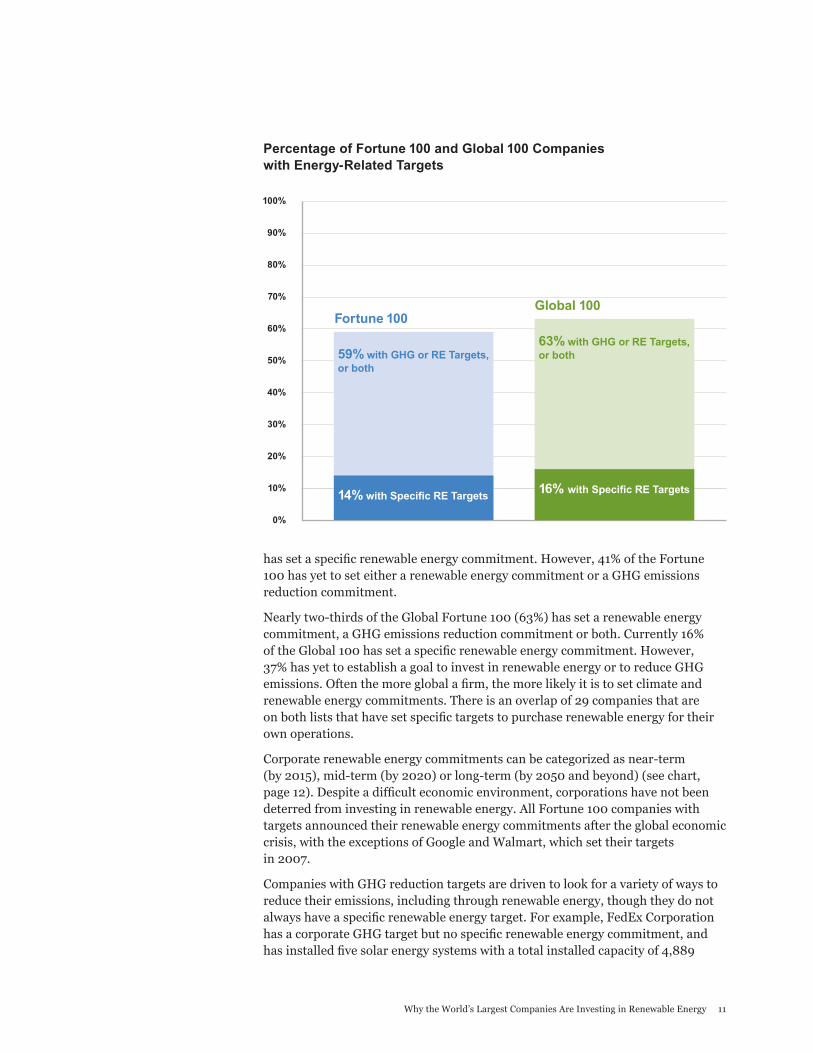
Fifty-nine percent of the Fortune 100 has set a renewable energy commitment, a GHG emissions reduction commitment or both. Currently 14% of the Fortune 100
Why the World’s Largest Companies Are Investing in Renewable Energy 11
hassetaspecificrenewableenergycommitment.However,41%oftheFortune100 has yet to set either a renewable energy commitment or a GHG emissions reduction commitment.
Nearly two-thirds of the Global Fortune 100 (63%) has set a renewable energy commitment, a GHG emissions reduction commitment or both. Currently 16% oftheGlobal100hassetaspecificrenewableenergycommitment.However,37% has yet to establish a goal to invest in renewable energy or to reduce GHG emissions.Oftenthemoreglobalafirm,themorelikelyitistosetclimateandrenewable energy commitments. There is an overlap of 29 companies that are onbothliststhathavesetspecifictargetstopurchaserenewableenergyfortheirown operations.
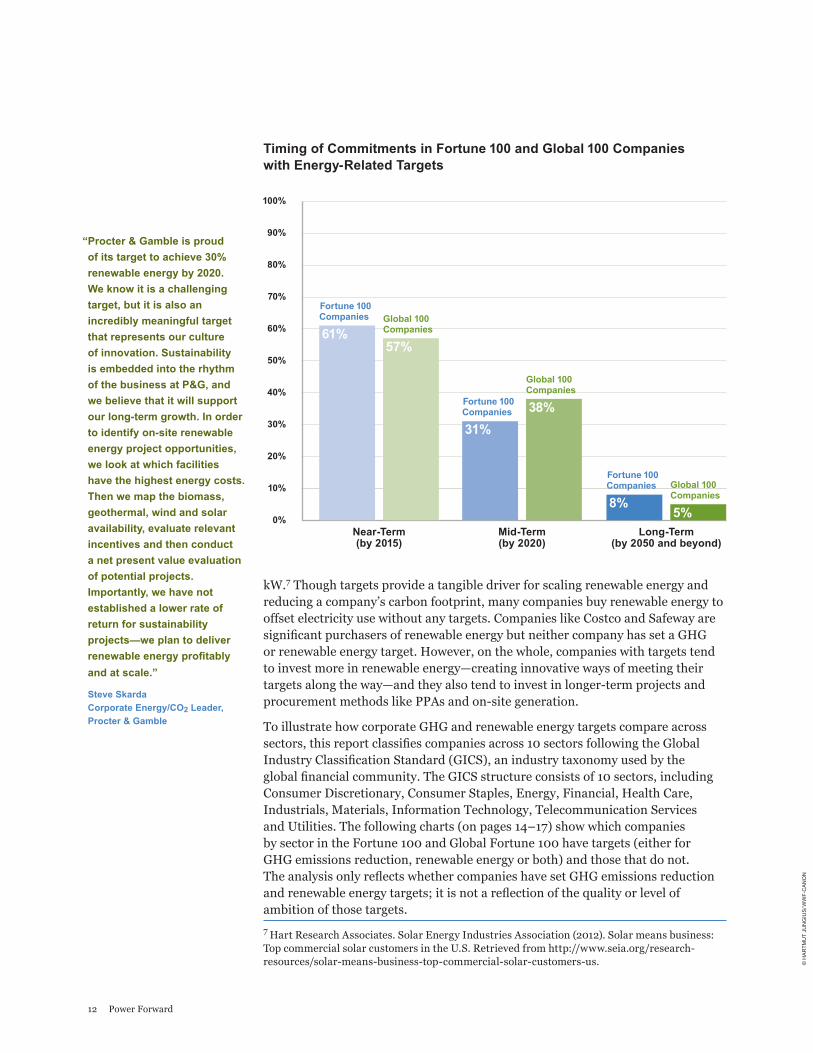
Corporate renewable energy commitments can be categorized as near-term (by 2015), mid-term (by 2020) or long-term (by 2050 and beyond) (see chart, page12).Despiteadifficulteconomicenvironment,corporationshavenotbeendeterred from investing in renewable energy. All Fortune 100 companies with targets announced their renewable energy commitments after the global economic crisis, with the exceptions of Google and Walmart, which set their targets in 2007.
Companies with GHG reduction targets are driven to look for a variety of ways to reduce their emissions, including through renewable energy, though they do not alwayshaveaspecificrenewableenergytarget.Forexample,FedExCorporationhasacorporateGHGtargetbutnospecificrenewableenergycommitment,andhasinstalledfivesolarenergysystemswithatotalinstalledcapacityof4,889
Percentage of Fortune 100 and Global 100 Companies with Energy-Related Targets
100%
90%
80%
70%
60%
50%
40%
30%
20%
10%
0%
16% with Specific RE Targets14% with Specific RE Targets
63% with GHG or RE Targets, or both59% with GHG or RE Targets,
or both
Fortune 100Global 100
12 Power Forward
kW.7 Though targets provide a tangible driver for scaling renewable energy and reducing a company’s carbon footprint, many companies buy renewable energy to offset electricity use without any targets. Companies like Costco and Safeway are significantpurchasersofrenewableenergybutneithercompanyhassetaGHGor renewable energy target. However, on the whole, companies with targets tend toinvestmoreinrenewableenergy—creatinginnovativewaysofmeetingtheirtargetsalongtheway—andtheyalsotendtoinvestinlonger-termprojectsandprocurement methods like PPAs and on-site generation.
To illustrate how corporate GHG and renewable energy targets compare across sectors,thisreportclassifiescompaniesacross10sectorsfollowingtheGlobalIndustryClassificationStandard(GICS),anindustrytaxonomyusedbytheglobalfinancialcommunity.TheGICSstructureconsistsof10sectors,includingConsumer Discretionary, Consumer Staples, Energy, Financial, Health Care, Industrials, Materials, Information Technology, Telecommunication Services and Utilities. The following charts (on pages 14–17) show which companies by sector in the Fortune 100 and Global Fortune 100 have targets (either for GHG emissions reduction, renewable energy or both) and those that do not. TheanalysisonlyreflectswhethercompanieshavesetGHGemissionsreductionandrenewableenergytargets;itisnotareflectionofthequalityorlevelofambition of those targets.
Timing of Commitments in Fortune 100 and Global 100 Companies with Energy-Related Targets
100%
90%
80%
70%
60%
50%
40%
30%
20%
10%
0%Mid-Term (by 2020)
Near-Term (by 2015)
Long-Term (by 2050 and beyond)
Fortune 100Companies
8%
Global 100Companies
5%
Fortune 100Companies
31%
Global 100Companies
38%
Fortune 100Companies
61%Global 100Companies
57%
“Procter & Gamble is proud
of its target to achieve 30%
renewable energy by 2020.
We know it is a challenging
target, but it is also an
incredibly meaningful target
that represents our culture
of innovation. Sustainability
is embedded into the rhythm
of the business at P&G, and
we believe that it will support
our long-term growth. In order
to identify on-site renewable
energy project opportunities,
we look at which facilities
have the highest energy costs.
Then we map the biomass,
geothermal, wind and solar
availability, evaluate relevant
incentives and then conduct
a net present value evaluation
of potential projects.
Importantly, we have not
established a lower rate of
return for sustainability
projects—we plan to deliver
renewable energy profitably
and at scale.”
Steve Skarda
Corporate Energy/CO2 Leader,
Procter & Gamble
7 Hart Research Associates. Solar Energy Industries Association (2012). Solar means business: Top commercial solar customers in the U.S. Retrieved from http://www.seia.org/research-resources/solar-means-business-top-commercial-solar-customers-us. ©
HA
RT
MU
T J
UN
GIU
S/W
WF
-CA
NO
N
© H
AR
TM
UT
JU
NG
IUS
/WW
F-C
AN
ON

14 Power Forward
In the Fortune 100, the Materials and Telecommunications sectors lead in setting both GHG and renewable energy targets. Companies from the Industrials and Financials sectors lead in setting GHG targets only (without also setting renewable energy targets). There are no utilities currently in the Fortune 100.
TheEnergyindustryislaggingmostinsettingtargets—64%ofcompaniesin the Energy sector have not set either a GHG or renewable energy target, followed by 50% of companies without targets in the Health Care sector and 45% in the Financial sector. The Health Care and Industrial sectorsonlyhaveonecompanythathassetaspecificrenewableenergycommitment. For the full list of Fortune 100 companies and targets by sector see Appendix A, pp 32–36.
RE Target only GHG Targets GHG and RE TargetsNo Targets
100%
90%
80%
70%
60%
50%
40%
30%
20%
10%
0%
Con
sum
er
Dis
cret
iona
ry
Con
sum
er
Sta
ples
Ene
rgy
Fina
ncia
l
Hea
lth C
are
Info
rmat
ion
Tech
nolo
gy
Mat
eria
ls
Indu
stri
als
Tele
com
-
mun
icat
ions
FORTUNE 100 Percentage of Companies with Climate and Energy Targets by Sector
42 42
17
44 44
13
64
18 18
45
55
50
43
7
25
67
8
30
50
20
100
33
67
Sums greater than 100 are due to rounding.
Util
ities
None

Why the World’s Largest Companies Are Investing in Renewable Energy 15
Consumer Discretionary
NO TARGET (42%)
Amazon.comCHSComcastLowe’sSears Holdings
GHG TARGETS (42%)
Best BuyFord Motor*Home Depot Johnson ControlsWalt Disney
RE and GHG TARGETS (17%)
General Motors*News Corporation
Consumer Staples
NO TARGET (44%)
Costco Wholesale*Kroger*PepsiCoSafewaySyscoTyson FoodsWalgreen
GHG TARGETS (44%)
Archer Daniels Midland*CVS Caremark*Kraft FoodsPhilip Morris InternationalSupervaluTargetThe Coca-Cola Company
RE and GHG TARGETS (13%)
Procter & Gamble*Walmart Stores*
FORTUNE 100 Companies with Energy-Related Targets by Sector
Energy
NO TARGET (64%)
Enterprise Products PartnersMarathon PetroleumMurphy OilPlains All American PipelineSunocoValero Energy*World Fuel Services
GHG TARGETS (18%)
Conoco Phillips*Exxon Mobil*
RE and GHG TARGETS (18%)
Chevron*Hess
Financial
NO TARGET (45%)
American International GroupBerkshire Hathaway*Fannie Mae*Freddie Mac*INTL FCStoneLiberty Mutual Insurance GroupMetLifeNationwideNew York Life Insurance
GHG TARGETS (55%)
AllstateAmerican ExpressBank of America Corp.*Citigroup*Goldman Sachs GroupJ.P. Morgan Chase & Co.*Morgan StanleyPrudential FinancialState Farm Insurance Cos.TIAA-CREFWells Fargo*
RE and GHG TARGETS (0%)
Health Care
NO TARGET (50%)
AetnaAmerisourceBergen*Express Scripts Holding (merged with Medco)HCA HoldingsMcKesson*Medco Health Solutions (merged with Express Scripts)WellPoint
GHG TARGETS (43%)
Abbott LaboratoriesCardinal Health*HumanaMerckPfizerUnitedHealth Group*
RE and GHG TARGETS (7%)
Johnson & Johnson
Industrials
NO TARGET (25%)
Delta Air LinesGeneral DynamicsHoneywell International
GHG TARGETS (67%)
BoeingDeereFedExGeneral Electric*Lockheed MartinUnited Continental HoldingsUnited Parcel ServiceUnited Technologies
RE and GHG TARGETS (8%)
Caterpillar
InformationTechnology
NO TARGET (30%)
Apple*Ingram Micro Oracle
GHG TARGETS (50%)
Cisco SystemsDell Intel International Business Machines*Microsoft
RE and GHG TARGETS (20%)
GoogleHewlett-Packard*
Materials
NO TARGET (0%)
GHG TARGETS (0%)
RE and GHG TARGETS (100%)
Dow ChemicalDuPont
Telecommunications
NO TARGET (0%)
GHG TARGETS (33%)
Verizon*
RE and GHG TARGETS (67%)
AT&T*Sprint Nextel
* These companies appear in both the Fortune 100 and Global 100.
Note: Companies listed here are from the annual 2012 ranking of the Fortune 100 and Global 100.

16 Power Forward
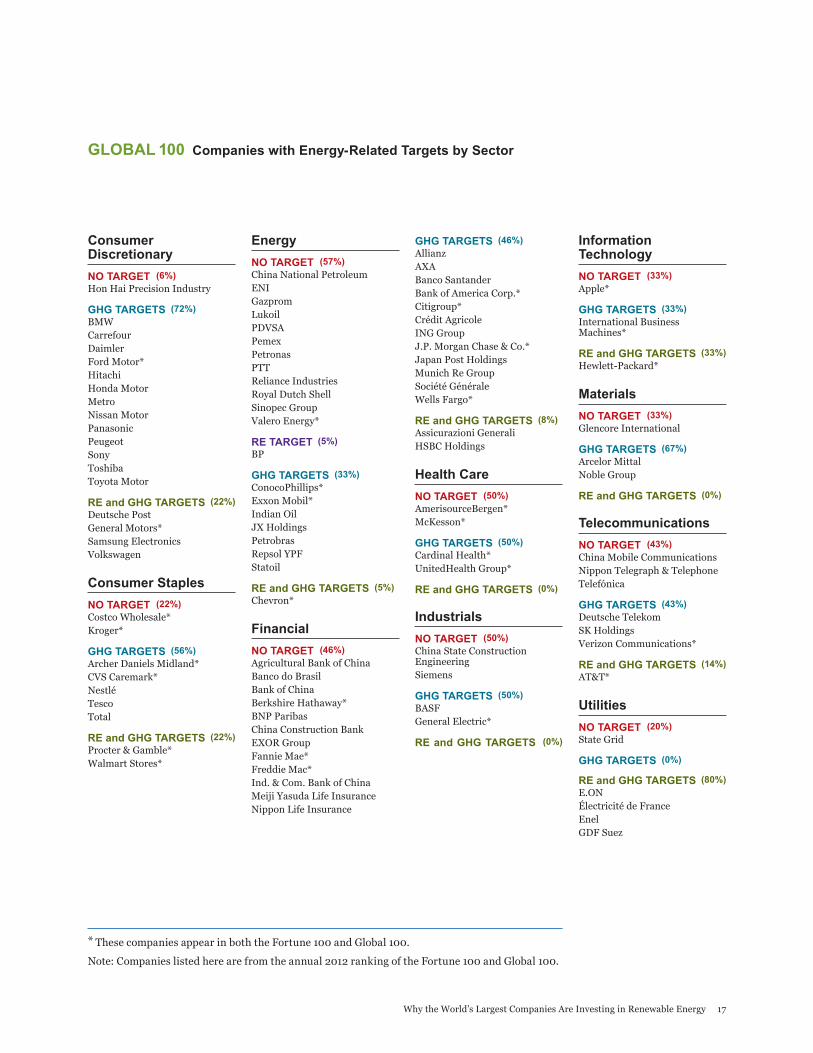
In the Global 100, the Utilities sector leads with 80% of companies setting both GHG and renewable energy targets. Over 50% of companies in the Consumer Discretionary, Materials, and Consumer Staples sectors have set a GHG target. Energy sector companies lag most in setting targets. Fifty percent of companies in the Health Care and Industrials sectors also do not have targets. For the full list of Global 100 companies and targets by sector see Appendix B, pp 37–42.
RE Target only GHG Targets GHG and RE TargetsNo Targets
100%
90%
80%
70%
60%
50%
40%
30%
20%
10%
0%
Con
sum
er
Dis
cret
iona
ry
Con
sum
er
Sta
ples
Ene
rgy
Fina
ncia
l
Hea
lth C
are
Info
rmat
ion
Tech
nolo
gy
Mat
eria
ls
Indu
stri
als
Tele
com
-
mun
icat
ions
Util
ities
GLOBAL 100 Percentage of Companies with Climate and Energy Targets by Sector
6
72
22 22
56
22
57
5
33
5
46 46
8
50 50 50 50
33 33 33
67
43 43
14
20
80
Sums greater than 100 are due to rounding.
33
Why the World’s Largest Companies Are Investing in Renewable Energy 17
Consumer Discretionary
NO TARGET (6%)
Hon Hai Precision Industry
GHG TARGETS (72%)
BMWCarrefourDaimlerFord Motor*HitachiHonda MotorMetroNissan MotorPanasonicPeugeotSonyToshibaToyota Motor
RE and GHG TARGETS (22%)
Deutsche PostGeneral Motors*Samsung ElectronicsVolkswagen
Consumer Staples
NO TARGET (22%)
Costco Wholesale*Kroger*
GHG TARGETS (56%)
Archer Daniels Midland*CVS Caremark*NestléTescoTotal
RE and GHG TARGETS (22%)
Procter & Gamble*Walmart Stores*
Energy
NO TARGET (57%)
China National PetroleumENIGazpromLukoilPDVSAPemexPetronasPTTReliance IndustriesRoyal Dutch ShellSinopec GroupValero Energy*
RE TARGET (5%)
BP
GHG TARGETS (33%)
ConocoPhillips*Exxon Mobil*Indian OilJX HoldingsPetrobrasRepsol YPFStatoil
RE and GHG TARGETS (5%)
Chevron*
Financial
NO TARGET (46%)
Agricultural Bank of ChinaBanco do BrasilBank of ChinaBerkshire Hathaway*BNP ParibasChina Construction BankEXOR GroupFannie Mae*Freddie Mac*Ind. & Com. Bank of ChinaMeiji Yasuda Life InsuranceNippon Life Insurance
GHG TARGETS (46%)
AllianzAXABanco SantanderBank of America Corp.*Citigroup*Crédit AgricoleING GroupJ.P. Morgan Chase & Co.*Japan Post HoldingsMunich Re GroupSociété GénéraleWells Fargo*
RE and GHG TARGETS (8%)
Assicurazioni Generali HSBC Holdings
Health Care
NO TARGET (50%)
AmerisourceBergen*McKesson*
GHG TARGETS (50%)
Cardinal Health*UnitedHealth Group*
RE and GHG TARGETS (0%)
Industrials
NO TARGET (50%)
China State Construction EngineeringSiemens
GHG TARGETS (50%)
BASFGeneral Electric*
RE and GHG TARGETS (0%)
InformationTechnology
NO TARGET (33%)
Apple*
GHG TARGETS (33%)
International Business Machines*
RE and GHG TARGETS (33%)
Hewlett-Packard*
Materials
NO TARGET (33%)
Glencore International
GHG TARGETS (67%)
Arcelor MittalNoble Group
RE and GHG TARGETS (0%)
Telecommunications
NO TARGET (43%)
China Mobile CommunicationsNippon Telegraph & TelephoneTelefónica
GHG TARGETS (43%)
Deutsche TelekomSK HoldingsVerizon Communications*
RE and GHG TARGETS (14%)
AT&T*
Utilities
NO TARGET (20%)
State Grid
GHG TARGETS (0%)
RE and GHG TARGETS (80%)
E.ONÉlectricité de FranceEnelGDF Suez
GLOBAL 100 Companies with Energy-Related Targets by Sector
* These companies appear in both the Fortune 100 and Global 100.
Note: Companies listed here are from the annual 2012 ranking of the Fortune 100 and Global 100.

18 Power Forward
Why Are Companies Buying Renewable Energy?Companies are investing in renewable energy because it makes good business sense. Renewable energy offers companies important opportunities to reduce operating costs, diversify energy supply and hedge against market volatility in traditional fuel markets. These investments also enable companies to achieve GHG emissions reduction goals and demonstrate leadership in broader corporate climate commitments. The three most common drivers for purchasing renewable energy include:
Investing in renewable energy is an effective way to reduce the environmental impact of a company’s electricity use, effectively reducing the corporate carbon emissions profile. For instance, Sony promotes the use of renewable energy to achieve its corporate GHG commitment to reduce absolute emissions 30% by 2015. Renewable energy accounts for approximately 10% of the total amount of electricity that Sony purchases worldwide each year.8
Companies are driven by demand and interest from their customers. For example, according to the 2012 Global Consumer Wind Study, a survey of over 24,000 consumers in 20 countries, 74% of consumers said they would have a more positive perception of a brand if wind energy were the primary energy source used in its production, and 49% of consumers expressed willingness to pay more for products made with renewable energy.9
Companies are looking for opportunities to lock in fixed, long-term prices in order to limit exposure to commodity price swings. Renewable energy offers an opportunity for companies to decrease use of fossil fuels and reduce and stabilize utility costs. A reliance on fossil fuel generation can expose a company to price spikes and variations in fossil fuel costs. Renewable energy is a fuel-free option, which can provide long-term price certainty. For example, General Motors established a global renewable energy commitment to utilize 125 MW of renewable energy on-site by 2020, including a commitment to double solar power from 30 to 60 MW by 2015, across its manufacturing facilities in over 30countries.Thisplanwillallowthemanufacturertolockinafixedpriceforelectricity over the long term, guarding against expected rises in traditional fuel markets.
How Do Companies Plan to Achieve Their Renewable Energy Commitments?For many of the largest companies, strategies to meet their renewable energy commitments are not limited to national or regional levels; they are implemented on a global scale.
Global corporate commitments are driving global purchasing. As the largest corporations in the world choose to procure renewable energy at scale, it will
“HSBC plans to dramatically
increase its renewable energy
use from 25% to 40% by 2020.
We decided to make this
commitment for three reasons:
we want to improve our carbon
footprint, we want to save
money and we want to lock in
lower rates over the long term.
As one of the largest investors
in renewable energy, we are
looking for opportunities
across the globe in wind,
solar, geothermal, biomass
and fuel cells.”
Bill Thomas
Group Head, HTS Sustainability,
HSBC Holdings
8 World Wildlife Foundation (2012). Sony leading through innovation. Retrieved from http://wwf.panda.org/what_we_do/how_we_work/businesses/climate/climate_savers/partner_companies/sony/ 9 Consumers more willing to buy from brands using renewable energy (September 14, 2012). Environmental Leader. Retrieved from http://www.environmentalleader.com/2012/09/14/consumers-more-willing-to-buy-from-brands-using-renewable-energy/
Why the World’s Largest Companies Are Investing in Renewable Energy 19
have ripple effects in nearly every major market. For example, Walmart is developing a comprehensive renewable energy purchasing strategy in every marketwhereithasasignificantpresenceinordertomeetits100%renewableenergy commitment. Already the company has more than 180 renewable energy projects in operation or under development, providing more than 1.1 billion kW hours of renewable electricity annually.10 At the same time, in order to achieve its 40% renewable energy target by 2020, HSBC plans to identify low-cost renewable energy opportunities in China, Europe, India, Latin America, the United Kingdom and the United States.
Companies are testing the waters in a few markets before expanding. In order to strategically deploy capital across various markets, companies with a global presence complete internal reviews to identify key market opportunities. Companies tend to analyze each market by product volume, corporate energy use, level of private and public sector investment in renewable energy, and favorable regulatorystructureforrenewableenergyfinancing(suchasincentivesandallowanceofPPAs).Intelservesasonesuchexample—followingthecompany’ssuccessful investment in solar energy in Israel, Vietnam and the United States, Intel now plans additional renewable energy opportunities across Asia, most notably in China, India, Japan and Malaysia.
Corporate commitments also differ in execution. As companies become more sophisticated in their renewable energy procurement methods, more and more companiesarepursuingadiversifiedapproachtorenewableenergythatoftenincludes a combination of RECs, PPAs and on-site direct investment. Many companies with a history of predominantly purchasing RECs have transitioned to instead favoring PPAs and on-site direct investment exclusively. Though inexpensive, RECs come at a premium and in some cases companies are able to get closer to cost parity with long-term PPAs or on-site direct investment. For companies concerned that REC purchases may not deliver new or additional renewable energy to the grid, PPAs and on-site investment are favorable.
Renewable Energy CertificatesRECs are credits purchased from a utility through a third-party vendor in which acompanycanbuytheenvironmental“attributes”associatedwiththerenewableelectricity generated (1 REC = 1 megawatt hour). Companies choose to buy RECs because they:
• Allowflexibility,especiallywhenothergreenproductsareotherwisenotlocallyavailable. REC purchases enable companies to purchase renewable energy across a diverse geographical area while still applying the renewable energy attributes to the electricity use at a given facility. Intel continues to be the nation’s largest voluntary purchaser of renewable energy, a title awarded to the company each year since 2008 by the U.S. Environmental Protection Agency’s (EPA’s) Green Power Partnership. In 2012, Intel increased its purchase of RECs to account for nearly 90% of its U.S. electricity use.
10 Raj, R. (October 5, 2012). How to sell renewable energy to Walmart. GreenBiz. Retrieved from http://www.greenbiz.com/blog/2012/10/05/how-sell-renewable-energy-walmart


Why the World’s Largest Companies Are Investing in Renewable Energy 21
11 Sprint. (2012). Investing in clean energy. Retrieved from http://www.sprint.com/responsibility/ouroperations/climate_change/renewable-energy.html12 Carew, D., & Mandel, M. (2012). Investment heroes: who’s betting on America’s future? Progressive Policy Institute. Retrieved from http://progressivepolicy.org/wp-content/uploads/2012/07/07.2012-Mandel_Carew_Investment-Heroes_Whos-Betting-on-Americas-Future.pdf
• Enable companies to maintain existing relationships with their utilities. For companies that are otherwise unfamiliar with renewable energy project opportunities, RECs allow for companies to continue their existing procurement arrangements with electricity providers.
• Demonstrate commitment to renewable energy while transitioning to PPAs and on-site direct investment. RECs offer a bridge while companies learn about other renewable energy investment strategies. In addition, RECs offer the opportunity for a company to scale to its organization’s total energy consumption,whichcanbedifficulttodoexclusivelywithPPAsandon-sitedirect investment.
Power Purchase AgreementsA PPA is a contract to buy power over time at a negotiated price from a particular facility in which the renewable energy is either located on-site or sited remotely. Inthisfinancialarrangement,athird-partydeveloperowns,operates,maintainsand monitors the renewable energy system, placing risk on the project developer, not the company. Companies are most likely to negotiate PPAs where electricity ratesarehigh,incentivesexistandfinancialpartnersareavailable.FirmspreferPPAs because they:
• Ensure that a company is directly responsible for new, additional renewable energy generation. In order to achieve its full corporate renewable energy commitment of 10% by 2017, Sprint Nextel plans to negotiate numerous PPAsin2012and2013.SprinthasfoundthatPPAsareapreferablefinancingstrategy,followingasuccessfulfive-yearPPAwithKansasCityPower&Lightthat ended in 2011.11
• Limitcapitalinvestmentrequired,freeingupresourcestoinvestinrevenue-generating assets. In 2011, AT&T was the single largest private investor in the United States, with over $20 billion in capital expenditures, mostly in broadband infrastructure.12 For the company to achieve its corporate renewable energy commitment to purchase 5 MW of renewable energy by 2012 (from fuel cellsandsolarphotovoltaic(PV)systems),thePPAfinancingstructureoffersapreferredmodel.Bylimitingthecapitaloutlayrequiredforrenewableenergy, it allows the company to focus on investments in its wireless network.
• Can be more cost-effective for meeting long-term commitments than buying RECs off the spot market. Most corporate renewable energy commitments enable a company to plan for the long term. RECs only represent a fraction of the total value of a renewable energy project and are typically contracted for no more than two to three years, whereas negotiating a PPA for 15–20 years guaranteesalong-termrevenuestream—whichrepresentssignificantfinancialvaluetoprojectdevelopers.Importantlyforcompanies,along-term,fixed-pricecontract for renewable energy protects them from expected price increases and volatility in traditional fuel markets.
© N
AT
ION
AL
GE
OG
RA
PH
IC S
TO
CK
/SA
RA
H L
EE
N/W
WF

22 Power Forward
• Deliver renewable energy from local sources. Google buys electricity directly from a renewable energy project developer through PPAs, selecting projects that are on the same power grid as its data center facilities. Google has completed twolong-term(20-year)PPAs:thefirstisfor114MWinIowaandthesecondis for 100.8 MW in Oklahoma. The company sells the power back into the grid at the local, wholesale price and, in the process of selling, strips RECs and keeps them so that no one can claim credit for the green aspect of the purchase. Recently, Google announced an agreement with the Grand River Dam Authority to deliver 48 MW of wind energy from the Canadian Hills Wind Project to power its data center in Oklahoma.13
• Can buy from sites with the best resources. Latin America’s largest wind farm is under development in Mexico as part of a 20-year PPA involving Mitsubishi, Heineken and FEMSA (the largest Coca-Cola bottler in Latin America). Once operational, the wind farm will have an installed capacity of 396 MW.14 The project will be completed in the southern region of Oaxaca along the Isthmus ofTehuantepec,whichhasbeenidentifiedtohavethebestwindresources.15
• Offer innovative opportunities for collaboration. Large manufacturers often encourage their suppliers to locate within a close proximity. Some have begun toinvestigatethepossibilityofnegotiatinga“CooperativePPA,”whichcouldpass on economic savings through a combined purchase that aggregates demand for renewable energy within a limited geographic region. Collaboration can yield greater market interest, better pricing and lower project risks. The EPA’s Green Power Partnership advises that an aggregated renewable energy effort can yield volume discounts and lower administrative and transaction costs,anddeliverbetter-qualifiedvendorsandprojects.16
On-Site Direct InvestmentMany companies prefer to construct and operate renewable energy, such as solar or wind, on-site in order to improve fuel diversity and visibly demonstrate their corporate commitment. Companies prefer on-site direct investment because it:
• Allows companies to most clearly account for investments against a corporate renewable energy commitment. Direct investment enables a company to receive federal, state and local incentives and rebates while also retaining RECs to claim against their renewable energy and GHG emissions reduction commitments (whereas a third party will often justify the costs by selling the RECs). On-site investments in renewable energy are most easily communicated to customers
13 Demasi, G. (September 26, 2012). [Web log message]. Retrieved from http://googleblog.blogspot.com/2012/09/more-renewable-energy-for-our-data.html 14 Andrew (March 12, 2012). Latin America’s largest wind project to power Mexico Coca-Cola, Heinekin, OXXO.Clean Technica. Retrieved from http://cleantechnica.com/2012/03/12/latin-americas-largest-wind-project-to-power-mexico-coca-cola-heineken-oxxo/ 15 Elliott, D., Schwartz, M., Scott, G., Haymes, S., Heimiller, D., & George , R. Department of Energy (2003).Wind energy resource atlas of Oaxaca (NREL/TP-500-34519). Retrieved from National Renewable Energy Laboratory website: http://www.nrel.gov/wind/pdfs/34519.pdf16 Collison, B. Environmental Protection Agency (2011). EPA green power partnership clean energy collaborative procurement initiative. Retrieved from http://www.epa.gov/greenpower/cecp/documents/MWDC_CleanEnergyProcurement_HigherEd.pdf

Why the World’s Largest Companies Are Investing in Renewable Energy 23
and stakeholders. BMW built a 9.5-mile pipeline to deliver landfillgasdirectlytoitsautomotivemanufacturingplantinSpartanburg,South Carolina, which provides more than 50% of the company’s on-site energy needs.17
• Freescompaniesfromlong-termfinancialarrangementswiththirdpartiesandensuresasecureinvestmentofferingsteady,reliablecashflowsoverlong-termhorizons.Multinationalinsurancecompaniescontinuetomakesignificantdirect investments in renewable energy projects.18 Munich RE recently bought three UK wind farms with a combined capacity of 102 MW (bringing the company’s total investment in renewable energy to more than €600 million) and Allianz has invested more than €1.3 billion in renewable energy since 2005, most notably in German and French wind power farms with investment returns around 7%.19
• Offersflexibilityassolarequipmentpricescontinuetodropatadramaticpace(whichmaymakecompanieshesitanttoenterinto20-yearcontractsatfixedprices). UPS installed a 250 kW solar rooftop array on its Lakewood, New Jersey,facility,whichwillprovideasignificantportionofthebuilding’speakenergy needs.20 UPS electrical engineers were able to design a custom solar systemtomeetthecompany’srequirementtominimizeroofpenetration— asignificantcostandaconcernifmanagedbyathirdparty.Thisenablesthecompany to depreciate that asset over time, which reduces its taxable income.
What Are the Barriers to Investing in Renewable Energy at Scale?Cost of Renewable EnergyMost companies will not pay a premium for renewable energy. Projects must be price competitive to locally available forms of power, meaning that in mostcasesrenewableenergyacquisitionmustbedeliveredatcostparityorbetter. Companies with renewable energy commitments are seeking the least costlyinvestmentstoachievetheirobjectives,whichisdifficulttorealizeinmany markets. Historically low natural gas prices have begun to affect corporate renewable energy purchasing decisions. In the United States, for example, natural gas prices fell from $4.37/mmBtu in 2010 to $3.98/mmBtu in 2011, the lowest annual average price for natural gas since 2002.21 Low natural gas prices are causing challenges for renewable energy projects, making it harder to justify any cost premium for renewable energy.
17 http://www.southeastcleanenergy.org/profiles/se_profiles/BMW_Case_Study.pdf18 Burger, A. (August 17, 2012). Direct investments in renewable energy increasingly attractive. TriplePundit. Retrieved from http://www.triplepundit.com/2012/08/renewable-energy-pension-funds/ 19 Dauer, U., & Edinger, A. (August 16, 2012). [Web log message]. Retrieved from http://blogs.wsj.com/source/2012/08/16/could-insurers-plug-germanys-energy-funding-gap/20 Rasberry, E. (June 15, 2011). UPS to harness solar power at New Jersey facility. Retrieved from http://pressroom.ups.com/Press+Releases/Archive/2011/Q2/ci.UPS+to+Harness+Solar+Power+at+New+Jersey+Facility.print 21EnergyInformationAdministration,“2011Brief:EnergyCommodityPriceTrendsVariedWidely During 2011,” Today in Energy, January 9, 2012. Available at http://www.eia.gov/todayinenergy/detail.cfm?id=4490
“Electricity use at UPS
operations represents 10%
of our overall carbon footprint.
In order to achieve our
corporate commitment to
reduce our greenhouse
gas emissions, we have
aggressively pursued
opportunities in solar energy.
To date we have installed
numerous 1 MW rooftop solar
systems that we designed
and own ourselves, which
work far better than a PPA.”
Scott Wicker
Vice President of Corporate
Plant Engineering and
Chief Sustainability Officers,
UPS

24 Power Forward
Companies are launching innovative strategies to address the cost of renewable energy. For instance, Walmart is focusing on the most cost-effective markets and signing long-term contracts with providers in order to deliver business certainty whileloweringcosts.Whilethisisasuccessfulstrategy,itrequiresthatcompaniescan sign third-party PPAs, something which is not possible in all markets.
Case Study: Walmart Using PPAs to Enhance Cost Competitiveness
• Established an ambitious goal to be supplied by 100% renewable energy
• Committed to reduce GHG emissions by 20% by the end of 2012 from its 2005 base of stores, clubs and distribution centers
• Operates more than 180 renewable energy projects providing more than 1.1 billion kW hours of renewable energy annually
Walmart is the largest retailer, the third-largest public corporation and the biggestprivateemployerintheworld.HeadquarteredinBentonville,Arkansas,the company has over 10,400 stores in 27 countries, including Brazil, China, Japan, Mexico and the United Kingdom. Walmart has set ambitious renewable energy and GHG emissions reduction goals, most notably to be supplied by 100% renewable energy and to reduce GHG emissions by 20% by the end of 2012 from its 2005 base of stores, clubs and distribution centers. Walmart US is currently the largest on-site green power generator in the United States and has more installed solar capacity than any other company in the U.S.22 By the end of 2010, the company achieved an absolute GHG reduction of 12.74% in its 2005 base of stores.23
In deciding to set a long-term, ambitious renewable energy goal (with no exact end date), Walmart has been able to strengthen the renewable energy market. Solar manufacturers and policy makers, to name a few, now have certainty that companies like Walmart will continue to demand renewable energy, which allows each to form a business model or policy strategy around increased renewable energy demand. Instead of offsetting their non-renewable power by buying RECs, the company’s strategy is to work with developers to build new renewable energy projects from the ground-up, usually by guaranteeing the purchase of the renewable power in a long-term Power Purchase Agreement (PPA). By providing a guaranteed revenue stream for the project developer, Walmart’s high credit-rating andlow-riskprofilegivebanksandfinanciersconfidencetoprovidebettercostsofcapitalandstrongfinancingterms,therebymakingnewrenewableprojectsviableand affordable before the shovel even hits the ground.
It has been Walmart’s experience that with every renewable energy project completed, the costs of renewable energy go down. With over 180 renewable energy projects around the world that currently provide the company with over 1.1 billion kW hours of renewable energy annually, each project has been cost competitive with traditional power. Nearly every project has been developed
22“Top20On-siteGeneration”,Web.October2,2012,http://www.epa.gov/greenpower/toplists/top20onsite.htm;“SolarMeansBusiness:TopCommercialSolarCustomersintheU.S.,”Web.November, 2012, http://www.seia.org/research-resources/solar-means-business-top-commer-cial-solar-customers-us. 23“GreenhouseGasEmissions,”Walmart,Web.October31,2012,http://corporate.walmart.com/global-responsibility/environment-sustainability/greenhouse-gas-emissions.
“We established a long-term
goal to be supplied by 100%
renewable energy. It is
important for companies to tip
their hands to have the market
rise to meet their needs. If
solar manufacturers or policy
makers know that there are
companies of our size that
have long-term commitments
to renewable energy, they can
form their business models
and policy strategies around
that.”
Greg Pool
Senior Manager of Renewable
Energy and Emissions,
Walmart Stores, Inc.
Why the World’s Largest Companies Are Investing in Renewable Energy 25
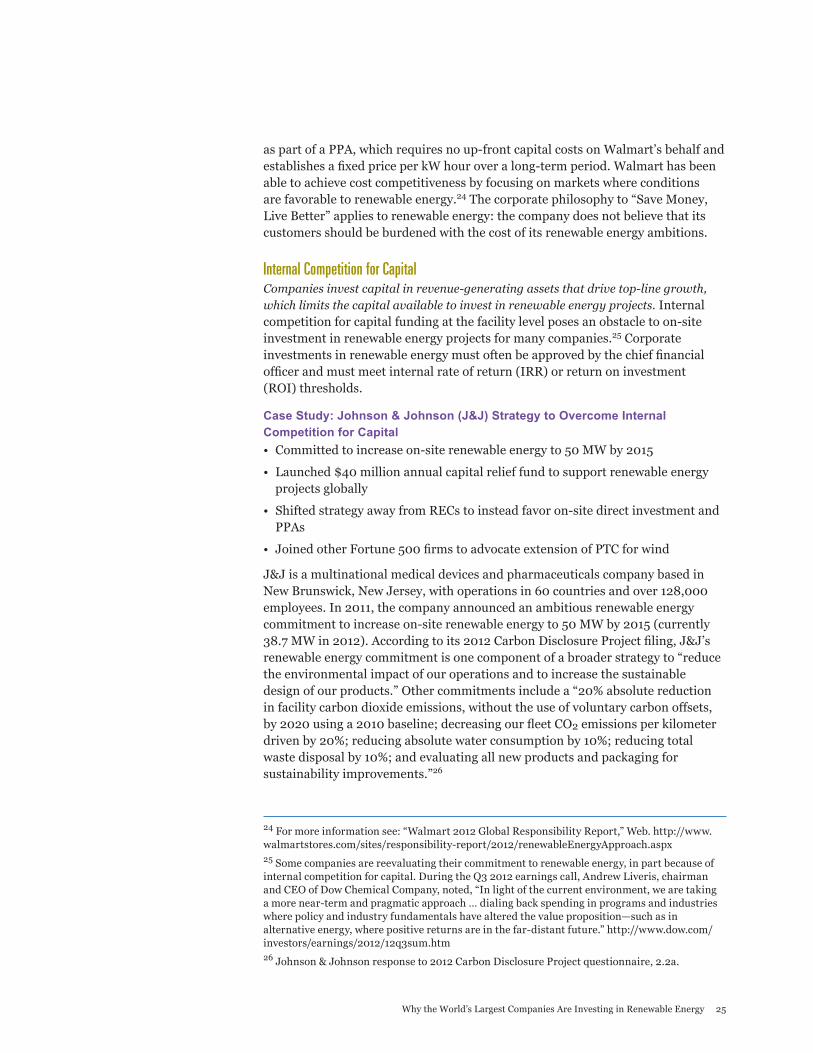
aspartofaPPA,whichrequiresnoup-frontcapitalcostsonWalmart’sbehalfandestablishesafixedpriceperkWhouroveralong-termperiod.Walmarthasbeenable to achieve cost competitiveness by focusing on markets where conditions are favorable to renewable energy.24Thecorporatephilosophyto“SaveMoney,Live Better” applies to renewable energy: the company does not believe that its customers should be burdened with the cost of its renewable energy ambitions.
Internal Competition for CapitalCompanies invest capital in revenue-generating assets that drive top-line growth, which limits the capital available to invest in renewable energy projects. Internal competition for capital funding at the facility level poses an obstacle to on-site investment in renewable energy projects for many companies.25 Corporate investmentsinrenewableenergymustoftenbeapprovedbythechieffinancialofficerandmustmeetinternalrateofreturn(IRR)orreturnoninvestment (ROI) thresholds.
Case Study: Johnson & Johnson (J&J) Strategy to Overcome Internal Competition for Capital
• Committed to increase on-site renewable energy to 50 MW by 2015
• Launched $40 million annual capital relief fund to support renewable energy projects globally
• Shifted strategy away from RECs to instead favor on-site direct investment and PPAs
• JoinedotherFortune500firmstoadvocateextensionofPTCforwind
J&J is a multinational medical devices and pharmaceuticals company based in New Brunswick, New Jersey, with operations in 60 countries and over 128,000 employees. In 2011, the company announced an ambitious renewable energy commitment to increase on-site renewable energy to 50 MW by 2015 (currently 38.7MWin2012).Accordingtoits2012CarbonDisclosureProjectfiling,J&J’srenewableenergycommitmentisonecomponentofabroaderstrategyto“reducethe environmental impact of our operations and to increase the sustainable designofourproducts.”Othercommitmentsincludea“20%absolutereductionin facility carbon dioxide emissions, without the use of voluntary carbon offsets, by2020usinga2010baseline;decreasingourfleetCO2 emissions per kilometer driven by 20%; reducing absolute water consumption by 10%; reducing total waste disposal by 10%; and evaluating all new products and packaging for sustainability improvements.”26
24Formoreinformationsee:“Walmart2012GlobalResponsibilityReport,”Web.http://www.walmartstores.com/sites/responsibility-report/2012/renewableEnergyApproach.aspx 25 Some companies are reevaluating their commitment to renewable energy, in part because of internal competition for capital. During the Q3 2012 earnings call, Andrew Liveris, chairman andCEOofDowChemicalCompany,noted,“Inlightofthecurrentenvironment,wearetaking a more near-term and pragmatic approach … dialing back spending in programs and industries wherepolicyandindustryfundamentalshavealteredthevalueproposition—suchasinalternative energy, where positive returns are in the far-distant future.” http://www.dow.com/investors/earnings/2012/12q3sum.htm26Johnson&Johnsonresponseto2012CarbonDisclosureProjectquestionnaire,2.2a.

26 Power Forward
One of the largest hurdles for corporations to invest in renewable energy at scale is limited capital funding. In order to sustain its investment in renewable energy, J&J created a $40 million annual capital relief fund to support energy efficiencyandrenewableenergyprojectsglobally.27 This fund is designed to allowthecorporateofficetorelievealocalsiteofthecapitalrequiredtoinvestin renewable energy projects that helps to overcome the competition at the facility level around capital funding. In addition, J&J lowered the threshold IRR (compared to other cost-improvement projects) to 15% for projects that have a “carbonreductionimpact,”wheremostofJ&J’scompetitorsrequirea20%rateof return or better. In 2011, J&J spent $48.2 million on projects that reduced GHG emissions, increased renewable energy capacity and generated energy cost savings. This included the installation of three solar PV systems in New Jersey and Pennsylvania for a total of 12 solar PV systems with an installed capacity of 11.6 MW.28
As a founding member of the EPA Green Power Partnership, J&J was honored as a Green Power Partner of the Year in 2003, 2005, 2006 and 2007, largely through purchasing RECs from wind power and biomass facilities. J&J chose to set its renewable energy commitment, in part, to encourage a shift away from purchasing voluntary RECs and instead to prioritize on-site direct investment in addition to negotiating PPAs. Priority projects for J&J include solar, biomass, cogenerationandlandfillgastoenergy.
Given the important role of government in developing renewable energy policies, J&J was an active member of the United States Climate Action Partnership, an alliance of major businesses and leading environmental organizations in support oflegislationrequiringsignificantreductionsofGHGemissions.Morerecently,J&JjoinedseveralotherFortune500firmstorequestcongressionalleadershipto extend the PTC for wind, a key provision supporting renewable energy in the United States.29
PolicyShort-term and inconsistent renewable energy policies hinder companies from setting ambitious commitments and pose an obstacle to companies in meeting existing commitments because of uncertainty around the price, supply and deployment of renewable energy. The business case for renewable energy technologiesisinfluencedbyacombinationoflocal,stateandfederalpolicies.Long-termgovernmentpoliciesarenormallydifficulttosustain,adilemma thatisfurtheramplifiedbythecurrentsluggishrecoveryfromtheglobaleconomiccrisis,causinggovernmentstodrawdownfinancialsupportforrenewable energy policies.
27 Johnson & Johnson Responsibility (2012). Energy use and alternative energy. Retrieved fromhttp://www.jnj.com/responsibility/ESG/environment/climate_change/Energy_Use_and_Alternative_Energy. 28 Hart Research Associates. Solar Energy Industries Association (2012). Solar means business: Top commercial solar customers in the U.S. Retrieved from http://www.seia.org/research-resources/solar-means-business-top-commercial-solar-customers-us 29 Johnson & Johnson, Starbucks, 17 other companies tell Congress to extend wind tax credit (September 24, 2012). Environmental Leader. Retrieved from http://www.environmentalleader.com/2012/09/24/johnson-johnson-starbucks-17-other-companies-tell-congress-to-extend-wind-tax-credit/

Why the World’s Largest Companies Are Investing in Renewable Energy 27
Government policies in nearly every major market across the globe now prioritize renewable energy investments in one fashion or another. In many markets, government incentives for renewable energy help make projects feasible, such as solar RECs in New Jersey or the renewable energy feed-in tariffs in Germany and the United Kingdom. National targets for renewable energy are helping to drive renewables as well. However, incentives have wavered in recent years due to global economic instability. Other important policy barriers exist; for example, not all markets allow companies to seek PPAs with renewable energy providers, something which is crucial in order for companies to exercise their choice of energy supply and drive renewable energy demand.
Most analysts also conclude government support and ambition remain below the levelrequiredtomitigatetheworstimpactsofclimatechange.The2011GlobalInvestor Statement on Climate Change, supported by 285 investors that represent assets of more than $20 trillion, notes that,
“Private sector investment will only flow at the scale and pace necessary if it is supported by clear, credible and long-term domestic and international policy frameworks—investment-grade climate change and energy policies—that shift the balance in favor of low-carbon investment opportunities.” 30
DeutscheBankarguesthatcountrieswithmore“TLC”—transparency,longevityandcertainty—intheirpolicyframeworkswillattractmoreinvestmentandbuildrenewable energy industries faster than their policy-lagging counterparts.31 In the United States, this tension is best illustrated by a recent campaign by 19 companies,includingmajorconsumerbrandsandseveralFortune500firms,tosupport extension of the PTC for wind, the policy most responsible for the growth of America’s thriving wind industry. According to a letter sent to congressional leadership,
“The PTC has enabled the industry to slash wind energy costs—90% since 1980—a big reason why companies like ours are buying increasing amounts of renewable energy. Extending the PTC lowers prices for all consumers, keeps America competitive in a global marketplace and creates homegrown American jobs.” 32
Much of the advocacy to date around the PTC has focused on the supply side: more wind energy will ensure more job creation. Increasingly, companies on the demand side are calling for a long-term renewable energy policy because it will lower prices and make it easier to meet corporate commitments.
30 IIGCC (2011). 2011 global investor statement on climate change. Retrieved from http://www.ceres.org/files/press-files/2011-global-investor-statement-on-climate-change/official-2011-global-investor-statement-on-climate-change 31 Fulton, M. Deutche Bank Group, Deutche Bank Climate Change Advisors (2012). Global climate change policy tracker. Retrieved from http://www.dbcca.com/dbcca/EN/_media/Global_Policy_Tracker_20120424.pdf 32 BICEP (September 18, 2012). Production tax credit for wind energy. Retrieved from http://www.ceres.org/files/press-files/bicep-ptc-extension-letter-9172012/at_download/file

28 Power Forward
Case Study: Sprint Policy Advocacy on Renewable Energy
• Committed to secure 10% of its total electricity through renewable sources by 2017
• Invested in renewables through PPAs and RECs
• Advocated for the extension of the wind PTC
Over the past decade, Sprint’s involvement with renewable energy has included installation of on-site clean-energy facilities, partnering with energy research institutions to research clean-energy alternatives for backup power at sites, advocating in support of clean-energy opportunities and purchasing renewable energy through utility partnerships. Sprint believes that its best option for investing directly in renewable energy is through long-term PPAs, and the company established a Renewable Energy Working Committee in the second half of 2011 to develop its strategy for achieving its 10% renewable energy goal by 2017.33
Sprint’sfive-yearPPAforwindenergywithKansasCityPower&LightendedonDecember 31, 2011; as such, the company looked for a suitable replacement for thatenergy(equalto2.5%ofSprint’stotalelectricaluse)tomeetthefull10%reduction goal by 2017. With the expiration of the PTC, Sprint’s renewable energy investment strategy of securing PPAs became at risk.
To manage this risk, Sprint has become involved in policy advocacy. Sprint’s actions have included lobbying with Kansas City Power & Light to get approval to build the Spearville Wind Farm in Kansas, having Sprint CEO Dan Hesse meet with leadership of the U.S. Department of Energy regarding renewable energy opportunities, speaking publicly about the importance of renewable energy and, in June 2012, sending a letter to congressional leaders urging them to support the extension of the PTC for wind energy. For consumers of wind electricity, theeconomicbenefitsofthePTCaretremendous.Inarecentinterview, AmyHargroves,Sprint’smanagerofcorporateresponsibility,said,“Weneed our voices to be heard. We think it’s important to have more green energy choices in the United States.”34
Recommendations for Corporations and Policy MakersRenewable energy offers companies the opportunity to reduce operating costs, diversify energy supply, hedge against market volatility in traditional fuel markets, achieve GHG emissions reduction goals and realize broader corporate sustainability commitments.
Companies will buy more renewable energy as project developers and policy makers tackle the barriers companies cannot address alone, including the price of renewable energy and unpredictable and inconsistent policies.
33 Sprint (2012). Investing in clean energy. Retrieved from http://www.sprint.com/responsibil-ity/ouroperations/climate_change/renewable-energy.html 34 Green Biz. (November 15, 2012). Starbucks, J&J, Yahoo! fight to extend wind energy tax credit. Retrieved from http://m.greenbiz.com/17574/show/631d885f5e31b6a736daa2c2ffa86346&t=qh3441j7g0tpeq6mr1qqi0rqd5

Why the World’s Largest Companies Are Investing in Renewable Energy 29
35 Scope 1 (all direct GHG emissions), Scope 2 (indirect GHG emissions from consumption of purchased electricity, heat or steam), Scope 3 (other indirect emissions).
In order to achieve emissions reductions at a scale that is ambitious enough to address the risks posed by global climate change, the world’s largest companies will need to set corporate commitments in line with the science. The majority of leading climate scientists recommends that the global economy must achieve GHG emissions reductions of 80% below 1990 levels by 2050. Getting started nowwillbeeasierandcheaper—companiesthatwaitwillfaceriskstotheircompetitiveness.
Recommendations for Corporations• Companies that do not have renewable energy or GHG commitments should setthem.Thereisastrongeconomiccaseandsignificantprecedentforsetting a corporate commitment to manage climate risks. More than half of the Fortune 100 and over two-thirds of the Global 100 have set GHG emissions reduction commitments, renewable energy commitments or both.
• Companies with GHG targets should also set renewable energy targets, or at a minimum ensure that renewable energy is a part of any GHG emissions reductionstrategy.Specificrenewableenergytargetsarestronglyencouragedbecause they clearly explain a company’s commitment to renewable energy. Whileenergyefficiencyisencouragedasthefirstandleast-costinvestment,companieswillnotachievetheirclimatecommitmentsthroughefficiency alone;itwillrequireparallelinvestmentsinrenewableenergy.
• Companies should be fully transparent in reporting their GHG commitments and the role that renewable energy should play in meeting those commitments using emerging global standards for Scope 2 carbon accounting.35 Companies should publicly disclose the amount of renewable energy they purchase annually compared to their total energy consumption, in order to measure progress (at least in terms of the percentage of total energy, if not total MW).
• Companies should identify opportunities to support local, state and national policies that remove barriers to scaling up renewable energy and enable companies to achieve their climate commitments. Companies are already seeingthevalueofengaginginspecificenablingpoliciesthatimproveaccess to and reduce the cost of renewable energy. All companies should be engaged in policy advocacy, because it helps increase availability of renewable energy and lower prices.
Ultimately, for companies in the Fortune 100, Global 100 and beyond to continue scaling up purchases and investments in renewable energy, effective public policy is needed to create greater market stability, increase corporate access to renewable energy and reduce the cost of renewable energy.

30 Power Forward
Recommendations for Policy Makers• Policies that promote renewable energy, like the PTC for wind or feed-in tariffs
for solar, should be extended. The PTC in particular has enabled the wind industry to slash energy costs, which eliminates an important barrier to purchasing renewable energy. Allowing the PTC to expire will immediately raise prices for companies committed to buying renewable energy.
• State utility regulators should authorize the use of third-party PPAs and remove policies that limit the development of on-site renewable power generation. Currently, PPAs are not allowed or are otherwise restricted in Florida, Georgia, Iowa, Kentucky and North Carolina.36 As companies increasingly look to PPAs to procure long-term, cost-effective renewable energy, policy makers and utility regulators must work together to enable increased corporate access to renewable energy.
• Renewable Portfolio Standards (RPSs) should be enacted in all U.S. states, eitherthroughstatelegislaturesorthroughafederalRPS.AnRPSrequiresutilities to procure a minimum amount of electricity from renewable sources. In the 30 states and Washington, D.C. where they currently exist, governors and state legislators should strengthen and expand RPSs. RPS mandates have driven one third of new renewable electricity in the United States. 37
• Because the Fortune 100 and Global 100 operate internationally, policies such as feed-in tariffs and renewable energy mandates are needed to kick-start renewable energy industries, particularly in emerging markets. Many countries criticaltoglobalsupplychainshavefledglingrenewableenergymarketsthatrequirestablesupportandclearpolicies.Inothermarkets,likeChina,voluntarygreen power markets do not yet exist, and incentives and market structures must be created. Mexico offers a successful model that combines limited government investment in renewable energy with clear policy conditions for private sector investment by enabling PPAs and charging a standard interconnection fee from project to facility.
• Ultimately,policiesthatenabledeepercostreductionstoleveltheplayingfieldwithconventionalenergysourcesareneeded.Companiesarealreadysignificantdrivers of renewable energy purely through voluntary efforts, but to reach the scale and pace needed to address the challenge of climate change, policies are needed that enable more companies across more sectors to use renewable energy cost-competitively. These include market-based solutions that price negativeexternalitiesandallowbusinessestofindthemostcost-effectivemeasures to achieve their GHG and renewable energy commitments.
36 DSireSolar (August 2012). Third-party solar PV PPAs. Retrieved from http://www.dsireusa.org/documents/summarymaps/3rd_Party_PPA_map.pdf37 Fulton, M., & Capalino, R. Deutche Bank Group, Deutche Bank Climate Change Advisors (2012). Ramping up renewables: Leveraging state RPS programs amid uncertain federal support. Retrieved from U.S. Partnership for Renewable Energy Finance website: http://www.dbcca.com/dbcca/EN/_media/Ramping_up_Renewables-Leveraging_State_RPS_Programs_amid_ Uncertain_Federal_Support.pdf ©
AD
AM
OS
WE
LL/W
WF
-CA
NO
N

Why the World’s Largest Companies Are Investing in Renewable Energy 31
© A
DA
M O
SW
ELL
/WW
F-C
AN
ON

32 Power Forward
FORTUNE 100 Climate and Renewable Energy Commitments by Sector
Consumer Discretionary:
General Motors*
News Corp.
Best Buy
Ford Motor*
Home Depot
Johnson Controls
Walt Disney
Amazon.com
CHS
Comcast
Lowe’s
Sears Holdings
Consumer Staples:
Procter & Gamble*
Walmart Stores*
Archer Daniels Midland*
CVS Caremark*
Kraft Foods
Philip Morris International
Supervalu
Utilize 125 MW of renewable energy by 2020 (globally), which includes a commitment to double solar from 30 MW to 60 MW by 20151
By 2015, Invest in clean energy equal to 20% of electricity use3
None
None
None
None
None
None
None
None
None
None
30% by 2020, 100% long-term goal10
Supplied by 100% renewable energy (long-term goal)12
None
None
None
None
None
Reduce carbon intensity from facilities by 20% by 2020 (2000 baseline)2
By 2015, reduce absolute Scope 1, 2 & 3 emissions by 15%; reduce emissions intensity at least 15% per revenue (both relative to 2006 baseline)4
Reduce absolute Scope 1 & 2 emissions in North America by 20% by 2020 (relative to 2009 baseline)5
Reduce our facility CO2 emissions by 30% per vehicle by 2025 compared to a 2010 baseline, building on our reduction of 31% from 2000 to 20106
Remove 20% of absolute GHG emissions from domestic supply chain by 2015 (relative to 2009 baseline)7
Reduce carbon dioxide equivalent emissions per million U.S. dollars revenue from 50 in 2011 to 35.5 by 20188
By 2012, achieve 50% of long-term absolute goal of zero net direct GHG emissions9
None
None
None
None
None
Emit zero fossil-based CO2 emissions (long-term goal)11
20% absolute reduction by 2012 (relative to 2005 baseline of stores, clubs and distribution centers)13
15% reduction on a per-unit-of-production basis by 2020 (relative to 2010 baseline)14
Reduce carbon intensity by 15% by 2018 (relative to 2010 baseline)15
Reduce Scope 1 & 2 CO2 emissions in manufacturing plants by 15% by 2015 per metric ton of product (relative to 2010 baseline)16
Reduce Scope 1 & 2 CO2 manufacturing emissions by 20%/mil. cigarettes equiv. by 2015; reduce Scope 1, 2 & 3 CO2 emissions by 30%/mil. cigarettes equiv. by 2020 (both relative to 2010 baseline).17
Reduce absolute carbon emissions by 10% by the end of 2012 (relative to 2007 baseline)18
COMPANY RE TARGET GHG TARGET
APPENDIX A
GH
G Targ
etsG
HG
and
RE
Targets
No
Targets
* These companies appear in both the Fortune 100 and Global 100.

Why the World’s Largest Companies Are Investing in Renewable Energy 33
Target
The Coca-Cola Company
Costco Wholesale*
Kroger*
PepsiCo
Safeway
Sysco
Tyson Foods
Walgreen
Energy:
Chevron*
Hess
Conoco Phillips*
Exxon Mobil*
Enterprise Products Partners
Marathon Petroleum
Murphy Oil
Plains All American Pipeline
Sunoco
Valero Energy*
World Fuel Services
Financials:
Allstate
American Express
Bank of America Corp.*
None
None
None
None
None
None
None
None
None
Invest $2.2 billion between 2011 and 2013 on renewable energy and efficiency21
Purchase at least 10% of annual net purchased electricity for company operations from renewable sources (long-term goal)23
None
None
None
None
None
None
None
None
None
None
None
None
Reduce Scope 1 and Scope 2 GHG emissions intensity by 10% per square foot and 20% per million dollars of retail sales by 2015 (relative to 2007 baseline)19
Stabilize overall emissions; 5% absolute reduction in Annex 1 countries by 2015 (2004 baseline)20
None
None
None
None
None
None
None
Reduce absolute Scope 1 & 2 emissions by 0.7% by 2012 (relative to 2011 baseline)21
Reduce Scope 1 & 2 CO2e/barrel of oil equivalent by 20% by 2013; other targets reported (relative to 2008 baseline)24
Reduce CO2e/cubic meter bitumen production by 12% by 2016 (relative to 2010 baseline)25
Reduce Scope 1 GHG intensity by 10% by 2012 (relative to 2002 baseline)26
None
None
None
None
None
None
None
Reduce absolute Scope 1 & 2 emissions by 20% by 2020 (relative to 2007 baseline)27
Reduce absolute Scope 1, 2 & 3 emissions by 10% by 2012 (relative to 2006 baseline)28
Reduce absolute aggregate emissions by 30% by 2015 (relative ot 2004 baseline)29
FORTUNE 100 Climate and Renewable Energy Commitments by Sector, (continued)
COMPANY RE TARGET GHG TARGET
Consumer Staples (continued):
APPENDIX A
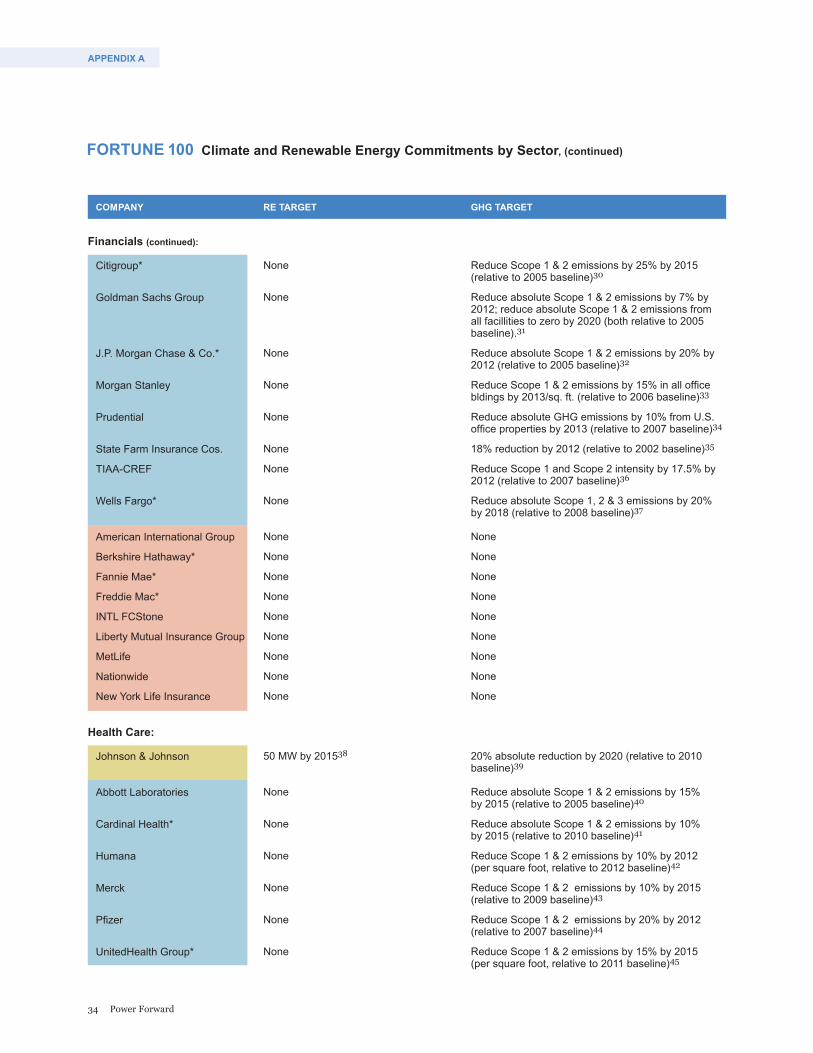
34 Power Forward
FORTUNE 100 Climate and Renewable Energy Commitments by Sector, (continued)
COMPANY RE TARGET GHG TARGET
Citigroup*
Goldman Sachs Group
J.P. Morgan Chase & Co.*
Morgan Stanley
Prudential
State Farm Insurance Cos.
TIAA-CREF
Wells Fargo*
American International Group
Berkshire Hathaway*
Fannie Mae*
Freddie Mac*
INTL FCStone
Liberty Mutual Insurance Group
MetLife
Nationwide
New York Life Insurance
Health Care:
Johnson & Johnson
Abbott Laboratories
Cardinal Health*
Humana
Merck
Pfizer
UnitedHealth Group*
None
None
None
None
None
None
None
None
None
None
None
None
None
None
None
None
None
50 MW by 201538
None
None
None
None
None
None
Reduce Scope 1 & 2 emissions by 25% by 2015 (relative to 2005 baseline)30
Reduce absolute Scope 1 & 2 emissions by 7% by 2012; reduce absolute Scope 1 & 2 emissions from all facillities to zero by 2020 (both relative to 2005 baseline).31
Reduce absolute Scope 1 & 2 emissions by 20% by 2012 (relative to 2005 baseline)32
Reduce Scope 1 & 2 emissions by 15% in all office bldings by 2013/sq. ft. (relative to 2006 baseline)33
Reduce absolute GHG emissions by 10% from U.S. office properties by 2013 (relative to 2007 baseline)34
18% reduction by 2012 (relative to 2002 baseline)35
Reduce Scope 1 and Scope 2 intensity by 17.5% by 2012 (relative to 2007 baseline)36
Reduce absolute Scope 1, 2 & 3 emissions by 20% by 2018 (relative to 2008 baseline)37
None
None
None
None
None
None
None
None
None
20% absolute reduction by 2020 (relative to 2010 baseline)39
Reduce absolute Scope 1 & 2 emissions by 15% by 2015 (relative to 2005 baseline)40
Reduce absolute Scope 1 & 2 emissions by 10% by 2015 (relative to 2010 baseline)41
Reduce Scope 1 & 2 emissions by 10% by 2012 (per square foot, relative to 2012 baseline)42
Reduce Scope 1 & 2 emissions by 10% by 2015 (relative to 2009 baseline)43
Reduce Scope 1 & 2 emissions by 20% by 2012 (relative to 2007 baseline)44
Reduce Scope 1 & 2 emissions by 15% by 2015 (per square foot, relative to 2011 baseline)45
Financials (continued):
APPENDIX A

Why the World’s Largest Companies Are Investing in Renewable Energy 35
FORTUNE 100 Climate and Renewable Energy Commitments by Sector, (continued)
COMPANY RE TARGET GHG TARGET
Aetna
AmerisourceBergen*
Express Scripts Holding (now merged with Medco)
HCA Holdings
McKesson*
Medco Health Solutions (now merged with Express Scripts)
WellPoint
Industrials:
Caterpillar
Boeing
Deere
FedEx
General Electric*
Lockheed Martin
United Continental Holdings
United Parcel Service
United Technologies
Delta Air Lines
General Dynamics
Honeywell International
Information Technology:
Hewlett-Packard*
None
None
None
None
None
None
None
20% by 202046
None
None
None
None
None
None
None
None
None
None
None
Striving to power company with 100% renewable energy56
8% by 201258
None
None
None
None
None
None
None
25% absolute reduction at existing facilities by 2020 (relative to 2006 baseline)47
1% absolute reduction in Scope 1 & 2 emissions by 2012; 25% reduction in Scope 1 & 2 emissions at major manufacturing facilities by 2012/ adjusted unit revenue (both relative to 2007 baseline).48
Reduce carbon intensity by 25% per dollar of revenue by 2014 (relative to 2005 baseline)49
By 2020, reduce Scope 1 aircraft emissions by 30% per-available-ton-mile (relative to 2005 baseline50
Reduce absolute Scope 1 & 2 emissions by 25% by 2015 (relative to 2004 baseline)51
Reduce absolute carbon emissions by 25% by 2012 (relative to 2007 baseline)52
50% reduction in CO2 intensity by 2050 (relative to 2005 baseline); carbon-neutral growth beginning in 2020.53
Reduce Scope 1 and 2 emissions intensity by 10% by 2016 (relative to 2007 baseline)54
By 2015, reduce absolute GHG emissions 27% (relative to 2006 baseline)55
None
None
None
Zero carbon footprint57
Reduce GHG emissions from owned and leased facilities by 20% by 2013 on an absolute basis (relative to 2005 baseline)59
Health Care (continued):
APPENDIX A

36 Power Forward
FORTUNE 100 Climate and Renewable Energy Commitments by Sector, (continued)
Cisco Systems
Dell
Intel
International Business Machines*
Microsoft
Apple*
Ingram Micro
Oracle
Materials:
Dow Chemical
DuPont
Telecommunication Services:
AT&T*
Sprint Nextel
Verizon Communications*
Utilities:
No utilities in the Fortune 100
None
None
None
None
None
None
None
None
By 2050, at least 50% of the energy consumed globally will be non-carbon emitting65
Reduce non-renewable energy use by 10% per adjusted dollar revenue by 2020 (relative to 2010 baseline)67
5MW of alternative energy from fuel cell and solar production by 2012 (relative to 2011 capacity baseline of 3,888 kW)69
10% by 201771
None
25% absolute reduction by 201260
Reduce global GHG emissions per dollar of revenue by 15% by 2012 and reduce worldwide facilities GHG emissions by 40% by 2015 (both relative to 2007 baseline)61
Reduce Scope 1 & 2 emissions by 20% by 2012 (relative to 2007 baseline)62
Reduce Scope 1 & 2 emissions by 12% by 2012 (relative to 2005 baseline)63
Carbon neutral by 201364
None
None
None
Reduce GHG emissions 2.5% per year/pound of product by 2015 (relative to 2005 baseline); by 2025, stop the growth of absolute emissions of GHG within the company66
Reduce at least 15% absolute reduction by 2015 (relative to 2004 baseline)68
20% absolute reduction in Scope 1 emissions by 2020 (relative to 2008 baseline)70
20% absolute reduction in Scope 1 & 2 by 2017 (relative to 2007 baseline)72
50% reduction in carbon intensity by 2020 (relative to 2009 baseline)73
COMPANY RE TARGET GHG TARGET
Information Technology (continued):
APPENDIX A

Why the World’s Largest Companies Are Investing in Renewable Energy 37
Consumer Discretionary:
Deutsche Post
General Motors*
Samsung Electronics
Volkswagen
BMW
Carrefour
Daimler
Ford Motor*
Hitachi
Honda Motor
Metro
Nissan Motor
Panasonic
Peugeot
Sony
GLOBAL 100 Climate and Renewable Energy Commitments by Sector
COMPANY RE TARGET GHG TARGET
Increase the percentage of electricity generated from renewable energy sources to more than 60% by 201274
Utilize 125 MW of renewable energy by 2020 (globally), which includes a commitment to double solar from 30 MW to 60 MW by 201576
Set up and operate renewable systems with total 2.4MW capacities by adopting small-hydro power generation system and roof-top solar generation system gradually by 201778
Volkswagen will invest around €1 billion in the expansion of renewable energy resources including solar, wind and hydroelectric power by 202080
None
None
None
None
None
None
None
None
None
None
None
Reduce Scope 1, 2 & 3 emissions intensity by 30% by 2020 (relative to 2007 baseline)75
Reduce carbon intensity from facilities by 20% by 2020 (2000 baseline)77
Reduce GHG emissions intensity normalized by sales (metric tonnes of CO2 per KRW 100 million) by 50% by 2013 (relative to 2008 baseline)79
Reduce GHG emissions in German operations 40% by 2020 (relative to 2010 baseline)81
Reduction of product CO2 emissions by 50% by 2020 (relative to 1995 baseline)82
Reduce Scope 1 & 2 emissions intensity by 40% by 2020 (relative to 2009 baseline)83
Reduce absolute Scope 3 emissions by 13% by 2016; reduce Scope 1 & 2 emissions by 20% by 2015 per vehicle (both relative to 2007 baseline)84
Reduce facility CO2 emissions by 30% per vehicle by 2025 compared to a 2010 baseline, building on reduction of 31% from 2000 to 201085
Reduce annual CO2 emissions by 100 million tonnes by 2025 through Hitachi products and services (relative to 2005 baseline)86
Reduce Scope 3 emissions by 30% by 2020 (relative to 2000 baseline); reduce Scope 1 & 2 emissions for corporate activities by 5% by 2013/unit of production (relative to 2008 baseline)87
Reduce GHG emissions by 15% by 2015 (relative to 2006 baseline)88
Reduce Scope 1 & 2 emissions by 27% by 2016 per vehicle produced; reduce Scope 3 emissions by 35% by 2016 (both relative to 2005 baseline)89
Ensure Scope 1, 2 & 3 emissions peak and begin descending by 2018 (relative to 2005 baseline)90
Reduce absolute Scope 1 emissions by 15% by 2020 (relative to 2010 baseline); Reduce Scope 3 emissions by 32% by 2020 (relative to 2008 baseline)91
30% reduction in the absolute amount of GHG emissions by 2015 (relative to 2000 baseline)92
APPENDIX B
RE
Target o
nly
GH
G Targ
etsG
HG
and
RE
Targets
No
Targets
* These companies appear in both the Fortune 100 and Global 100.

38 Power Forward
GLOBAL 100 Climate and Renewable Energy Commitments by Sector, (continued)
COMPANY RE TARGET GHG TARGET
Toshiba
Toyota Motor
Hon Hai Precision Industry
Consumer Staples:
Procter & Gamble*
Walmart Stores*
Archer Daniels Midland*
CVS Caremark*
Nestlé
Tesco
Total
Costco Wholesale*
Kroger*
Energy:
Chevron*
ConocoPhillips*
Exxon Mobil*
Indian Oil
JX Holdings
None
None
None
30% by 2020, 100% long-term goal95
Supplied by 100% renewable energy (long-term goal)97
None
None
None
None
None
None
None
Invest $2.2 billion between 2011 and 2013 on renewable energy and efficiency104
None
None
None
None
Reduce Scope 1 & 2 emissions by 35% by 2015 (relative to 1990 baseline); reduce Scope 3 emissions by 44% by 2012 per unit revenue (relative to 2000 baseline)93
Reduce absolute Scope 1 and 2 CO2 emissions 25% by 2012 (relative to 1990 baseline)94
None
Emit zero fossil-based CO2 emissions (long-term goal)96
20% absolute reduction by 2012 (relative to 2005 baseline)98
15% reduction on a per-unit-of-production basis by 2020 (relative to 2010 baseline)99
Reduce carbon intensity by 15% by 2018 (relative to 2010 baseline)100
Reduce Scope 1 & 2 emissions by 5% by 2015 per metric ton of product (relative to 2010 baseline)101
New stores built between 2007 and 2020 to emit half the CO2 of a 2006 new store102
Reduce Scope 1 emissions related to flaring by 50% by 2014 (relative to 2005 baseline). Other targets reported.103
None
None
Reduce absolute Scope 1 & 2 GHG emissions by 0.7% by 2012 (relative to 2011 baseline)105
Reduce tonnes CO2e / cubic meter bitumen production by 12% by 2016 (relative to 2010 baseline) 106
Reduce Scope 1 GHG intensity by 10% by 2012 (relative to 2002 baseline)107
Achieve growth path in an environmentally responsible manner in line with national target to cut the emissions intensity of GDP by 20–25% by 2020 compared to the 2005 level108
Reduce Scope 1 emissions from refining and production and other departments by 3% by 2012/unit of production (both relative to 2009 baseline)109
Consumer Discretionary (continued):
APPENDIX B

Why the World’s Largest Companies Are Investing in Renewable Energy 39
GLOBAL 100 Climate and Renewable Energy Commitments by Sector, (continued)
COMPANY RE TARGET GHG TARGET
Petrobras
Repsol YPF
Statoil
BP
China National Petroleum
ENI
Gazprom
Lukoil
PDVSA
Pemex
Petronas
PTT
Reliance Industries
Royal Dutch Shell
Sinopec Group
Valero Energy*
Financials:
Assicurazioni Generali
HSBC Holdings
Allianz
AXA
None
None
None
Invest $8 billion over ten years in alternative energy in operations (beginning in 2005)113
None
None
None
None
None
None
None
None
None
None
None
None
28MW of renewable energy by 2014, which includes a 40 million Euro investment in solar, wind and biomass114
Increase energy consumption from renewables from 24% to 40% by 2020116
None
None
By 2015, reduce 10% of the energy intensity in the refining process; reduce 15% of the Scope 1 GHG emission intensity in the exploration and production activities; reduce 5% of the GHG emission intensity in the thermoelectric plant activities (all relative to 2009 baseline). Other targets reported.110
Absolute reduction of Scope 1 and Scope 2 of 9.26%, 2005–2013. Reduce emissions by 2.5 million metric tonnes from 2005–2013 related to “business as usual” scenario111
Reduce Scope 1 CO2 emissions on the Norwegian continental shelf about 800 000 tonnes by 2020 (relative to 2007 baseline)112
None
None
None
None
None
None
None
None
None
None
None
None
None
10% reduction of emissions from Scope 1 and Scope 2 by 2012 (relative to 2009 baseline)115
Reduce annual carbon emissions per employee by 1 tonne, from 3.5 to 2.5 tonnes, between 2012–2020117
Reduce Scope 1, 2 & 3 emissions by 35% by 2015 per full time employee (relative to 2006 baseline)118
Reduce Scope 1, 2 & 3 emissions by 20% by 2012 per full-time employee (relative to 2008 baseline)119
Energy (continued):
APPENDIX B

40 Power Forward
GLOBAL 100 Climate and Renewable Energy Commitments by Sector, (continued)
COMPANY RE TARGET GHG TARGET
Banco Santander
Bank of America Corp.*
Citigroup*
Crédit Agricole
ING Group
J.P. Morgan Chase & Co.*
Japan Post Holdings
Munich Re Group
Société Générale
Wells Fargo*
Agricultural Bank of China
Banco do Brasil
Bank of China
Berkshire Hathaway*
BNP Paribas
China Construction Bank
EXOR Group
Fannie Mae*
Freddie Mac*
Ind. & Com. Bank of China
Meiji Yasuda Life Insurance
Nippon Life Insurance
None
None
None
None
None
None
None
None
None
None
None
None
None
None
None
None
None
None
None
None
None
None
Reduce Scope 2 GHG emissions by 3% by 2012 and 2.5% by 2013/resident; reduce total emissions by 9% by 2013/resident (all relative to 2010 baseline); covers Brazil, Chile, Spain, Mexico & UK120
30% absolute reduction by 2015 (relative to 2004 baseline)121
Reduce Scope 1 & 2 CO2 emissions by 25% by 2015 (relative to 2005 baseline)122
Reduce Scope 1 & 2 emissions by 15% by 2014 per kWh (relative to 2012 baseline)123
Reduce CO2 emissions by 30% in 2012 (relative to 2007 baseline)124
Reduce absolute Scope 1 & 2 emissions by 20% by 2012 (relative to 2005 baseline)125
Reduce absolute emissions by 9% by 2013 (relative to 2007 baseline)126
Carbon neutral by 2015; at least 10% of Scope 1, 2 & 3 emissions will be reduced globally, up to 90% by offsets (relative to 2009 baseline).127
Reduce CO2 emissions per occupant by 11% between 2008–2012128
Reduce absolute Scope 1, 2 & 3 emissions by 20% by 2018 (relative to 2008 baseline)129
None
None
None
None
None
None
None
None
None
None
None
None
Financials (continued):
APPENDIX B
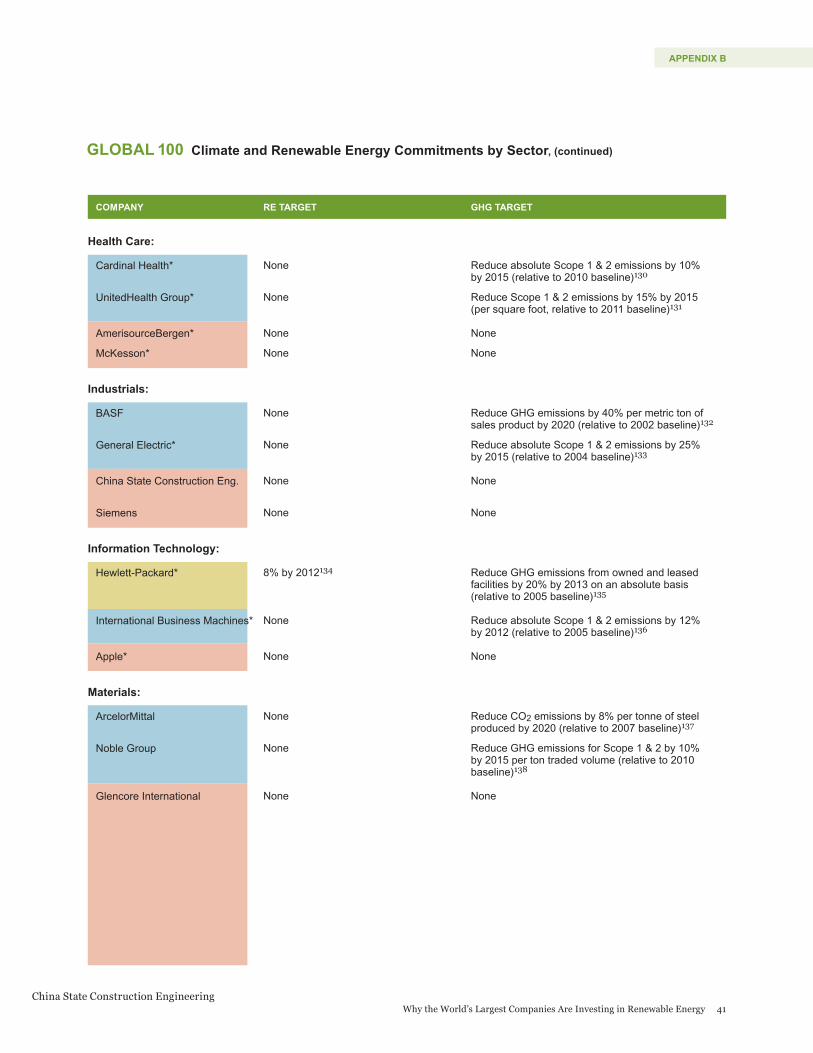
China State Construction Engineering
Why the World’s Largest Companies Are Investing in Renewable Energy 41
GLOBAL 100 Climate and Renewable Energy Commitments by Sector, (continued)
COMPANY RE TARGET GHG TARGET
Health Care:
Cardinal Health*
UnitedHealth Group*
AmerisourceBergen*
McKesson*
Industrials:
BASF
General Electric*
China State Construction Eng.
Siemens
Information Technology:
Hewlett-Packard*
International Business Machines*
Apple*
Materials:
ArcelorMittal
Noble Group
Glencore International
None
None
None
None
None
None
None
None
8% by 2012134
None
None
None
None
None
Reduce absolute Scope 1 & 2 emissions by 10% by 2015 (relative to 2010 baseline)130
Reduce Scope 1 & 2 emissions by 15% by 2015 (per square foot, relative to 2011 baseline)131
None
None
Reduce GHG emissions by 40% per metric ton of sales product by 2020 (relative to 2002 baseline)132
Reduce absolute Scope 1 & 2 emissions by 25% by 2015 (relative to 2004 baseline)133
None
None
Reduce GHG emissions from owned and leased facilities by 20% by 2013 on an absolute basis (relative to 2005 baseline)135
Reduce absolute Scope 1 & 2 emissions by 12% by 2012 (relative to 2005 baseline)136
None
Reduce CO2 emissions by 8% per tonne of steel produced by 2020 (relative to 2007 baseline)137
Reduce GHG emissions for Scope 1 & 2 by 10% by 2015 per ton traded volume (relative to 2010 baseline)138
None
APPENDIX B

42 Power Forward
GLOBAL 100 Climate and Renewable Energy Commitments by Sector, (continued)
COMPANY RE TARGET GHG TARGET
Telecommunications:
AT&T*
Deutsche Telekom
SK Holdings
Verizon Communications*
China Mobile Communications
Nippon Telegraph & Telephone
Telefónica
Utilities:
E.ON
Électricité de France
Enel
GDF Suez
State Grid
5MW of alternative energy from fuel cell and solar production against our 2011 capacity baseline of 3,888 kW by 2012 139
None
None
None
None
None
None
Invest EUR7 billion in renewables over the next five years as a substitute for other power generation144
1000 MW of renewable energy production (long-term goal)146
Increase the net installed capacity of renewables by 6.6 GW by 2016 in Latin America, Russia, and Eastern Europe148
Increase installed renewable capacity by 50% by 2015 (relative to 2009 baseline)150
None
20% absolute reduction in Scope 1 emissions by 2020 (relative to 2008 baseline)140
By 2020, reduce CO2 emissions in Germany by 40% (relative to 1995 baseline)141
Reduce emissions by 30% by 2020 per sales in KRW (relative to 2009 baseline)142
50% reduction in carbon intensity by 2020 (relative to 2009 baseline)143
None
None
None
Reduce Scope 1 emissions by 50% by 2025 (per unit of production, relative to 1990 baseline)145
In France, reduce Scope 1 absolute emissions by 30% by 2020 (relative to 1990 baseline). Other targets reported147
Reduce Scope 1 intensity by 15% by 2020 (relative to 2007 baseline)149
Reduce absolute Scope 1 emissions in Belgium (10% of overall emissions) by 2% by 2015 (relative to 2007 baseline)151
None
APPENDIX B

Why the World’s Largest Companies Are Investing in Renewable Energy 43
1 http://gmsustainability.com/ ENVIRONMENTAL_ 2020Commitments.html 2 Ibid.3 http://gei.newscorp.com/strategy.html 4 Newscorp response to 2012 Carbon Disclosure Project questionnaire,3.1.5 Best Buy response to Carbon DisclosureProjectquestion-naire, 1.2a.6 http://corporate.ford.com/microsites/sustainability-report-2011-12/environment-climate7 https://corporate.home depot.com/Corporate Responsibility/Environment/Documents/Sustainability__Brochure_pages.pdf8 http://www.johnsoncontrols.com/content/dam/WWW/jci/corporate/sustainabil-ity/2011_bsr/21093_JC_2011BSR_HealthSafety_kzh1.pdf9 http://thewaltdisneycom-pany.com/sites/default/files/commitment-categories/file/DisneyCitizenshipTar-gets2012_Final32612_9.pdf10 http://www.pg.com/en_US/sustainability/environmen-tal_sustainability/environ-mental_vision.shtml 11 Ibid.12 http://corporate.walmart.com/global-responsibility/environment-sustainability/energy 13 http://corporate.walmart.com/global-responsibility/environment-sustainability/greenhouse-gas-emissions 14 http://www.adm.com/en-US/responsibility/2011CR/Pages/Environment.aspx
15 http://info.cvscaremark.com/our-company/corporate-responsibility/environment/measuring-emissions 16 Kraft Foods response to 2012 Carbon Disclosure Projectquestionnaire,3.1b.17 Philip Morris International response to 2012 Carbon Disclosure Project questionnaire,3.1b.18 http://www.supervalu.com/sv-webapp/about/envsteward-ship.jsp 19 http://corporate.target.com/corporate-responsibility/goals-reporting/goals-prog-ress20 http://wwf.panda.org/what_we_do/how_we_work/businesses/climate/climate_savers/partner_companies/the_coca_cola_company/ 21 http://www.chevronenergy.com/news_room/default.asp?pr=pr_20110825.asp 22 Chevron response to 2012 Carbon Disclosure Project questionnaire,3.1a,3.3b.23 Hess response to 2012 Carbon Disclosure Project questionnaire,3.1a,3.3b24 Ibid.25 Conoco Phillips response to 2012 Carbon Disclosure Projectquestionnaire,3.1a.26 Exxon Mobil response to 2012 Carbon Disclosure Projectquestionnaire,3.1a.27 Allstate response to 2012 Carbon Disclosure Project questionnaire,3.28 American Express response to 2012 Carbon Disclosure Projectquestionnaire,3.1a.29 http://about.bankofamerica.com/assets/pdf/CSR_Advanc-ing_Environmental_Sustain-ability.pdf
30 Citigroup response to 2012 Carbon Disclosure Project questionnaire,3.1a.31 Goldman Sachs response to 2012 Carbon Disclosure Projectquestionnaire,3.1a.32 JPMorgan Chase response to 2012 Carbon Disclosure Projectquestionnaire,3.1a.33 Morgan Stanley response to 2012 Carbon Disclosure Projectquestionnaire,3.1a-d.34 http://www.prudential.com/view/page/public/15961#Commitments 35 http://www.statefarm.com/aboutus/community/green/facilities/fleet.asp 36 TIAA-CREF reponse to 2012 Carbon Disclosure projectquestionnaire,3.137 Wells Fargo response to 2012 Carbon Disclosure Projectquestionnaire,3.1a.38 http://www.jnj.com/wps/wcm/connect/e265d6804bc83ae392f6ffbf30c50c56/2011-responsibilty-report.pdf?MOD=AJPERES 39 http://www.jnj.com/responsibility/ESG/environ-ment/climate_change/greenhouse_gas_emissions 40 Abbott Laboratories response to 2012 Carbon DisclosureProjectquestion-naire, 3.1a.41 Cardinal Health response to 2012 Carbon Disclosure Projectquestionnaire,3.1a.42 Humana response to 2012 Carbon Disclosure Project questionnaire,3.1b43 http://www.merckresponsibility.com/focus-areas/environmental-sustainability/environmental-goals/home.html
44 Pfizer response to 2012 Carbon Disclosure Project questionnaire,3.1.45 http://www.unitedhealthgroup.com/2011-social-responsibility-report/content/executive-summary/healthy-environment.aspx46 http://www.caterpillar.com/sustainability/vision-mission-strategy 47 http://www.caterpillar.com/cda/files/3694814/7/CAT-015_2011_SR_PDF_v2.5.pdf48 Boeing response to 2012 Carbon Disclosure Project questionnaire,3.1a.49 http://www.deere.com/wps/dcom/en_US/corporate/our_company/citizenship/environmental_stewardship/operations/operations.page 50 FedEx response to 2012 Carbon Disclosure Project questionnaire,3.1a.51 General Electric response to 2012 Carbon Disclosure Projectquestionnaire,3.1.52 http://secure.ps.zmags.com/assets/griffin/2011CSR_Report_DownloadUpdate.pdf 53 http://www.united.com/web/format/pdf/globalcitizenship/2010-11-UnitedCorporateResponsi-bilityReport.pdf 54 United Parcel Service response to 2012 Carbon DisclosureProjectquestion-naire, 3.1. 55 http://utc.com/Corporate+Responsibility/Environment/2015+Sustainability+Goals 56 http://www.google.com/green/energy/ 57 http://www.google.com/green/
ENDNOTES

44 Power Forward
58 http://www8.hp.com/us/en/hp-information/environ-ment/goals.html 59 Ibid.60 http://newsroom.cisco.com/dlls/2008/prod_062408c.html 61 http://content.dell.com/us/en/corp/d/corp-comm/cr-earth-emissions 62 Intel response to 2012 Carbon Disclosure Project questionnaire,3.63 IBM response to 2012 Carbon Disclosure Project questionnaire,3.1a.64 http://www.microsoft.com/environment/ 65 http://www.dow.com/sustainability/pdf/OurPosi-tion_EngClimate_FINAL.pdf 66 Ibid.67 http://www2.dupont.com/inclusive-innovations/en-us/gss/sustainability/commit-ments/footprint-goals.html 68 Ibid. 69 http://www.att.com/Common/about_us/files/csr_2012/alternative_energy.pdf 70 http://www.att.com/Common/about_us/files/csr_2012/progress_toward_goals_2011.pdf 71 http://www.sprint.com/responsibility/ouroperations/climate_change/renewable-energy.html 72 http://www.sprint.com/responsibility/ouroperations/climate_change/greenhouse-gas-emissions.html 73 http://responsibility.verizon.com/sustainabil-ity/2011
74 http://www.dp-dhl.com/content/dam/dpdhl/verantwortung/Corporate-Responsibility-Report-2011.pdf 75 DHL response to 2012 Carbon Disclosure Project questionnaire,3.76 http://www.gm.com/article.content_pages_news_us_en_2012_sep_0912_green_corp_cit.~content~gmcom~home~vision~environment1.html77 http://gmsustainability.com/ ENVIRONMENTAL_ 2020Commitments.html78 http://www.samsung.com/us/aboutsamsung/sustainabil-ity/environment/climatestrat-egy/energymanagement.html 79 Ibid.80 http://www.reuters.com/article/2011/08/26/us-volk-swagen-windpark-idUS-TRE77P1NG20110826 81 http://sustainability-report2011.volkswagenag.com/en/environment/climate-protection/energy-supply-strategy.html 82 http://www.sustainableenergyforall.org/actions-commitments/commitments/single/new-bmw-group-environmental-targets 83 Carrefour response to 2012 Carbon Disclosure Project, 3.2. 84 Daimler response to 2012 Carbon Disclosure Project questionnaire,3.85 http://corporate.ford.com/microsites/sustainability-report-2011-12/environment-climate
86 http://www.sustainableenergyforall.org/actions-commitments/commitments/single/long-term-environmental-vision-2025 87 Honda Motor Corp response to 2012 Carbon Disclosure Projectquestionnaire,3.1.88 http://www.metrogroup.de/internet/site/metrogroup/node/14013/Len/index.html 89 Nissan Motor Corp response to 2012 Carbon DisclosureProjectquestion-naire, 3.1. 90 Panasonic response to 2012 Carbon Disclosure Project questionnaire,3.91 Peugeot response to 2012 Carbon Disclosure Project questionnaire,3.1.92 http://www.sony.net/SonyInfo/csr_report/environment/climate/ghg/site/index2.html 93 Toshiba response to 2012 Carbon Disclosure Project questionnaire,3.1.94 Toyota Motor Corp response to 2012 Carbon Disclosure Projectquestionnaire,3.1a.95 http://www.pg.com/en_US/sustainability/environmen-tal_sustainability/environ-mental_vision.shtml 96 Ibid.97 http://corporate.walmart.com/global-responsibility/environment-sustainability/energy 98 http://corporate.walmart.com/global-responsibility/environment-sustainability/greenhouse-gas-emissions 99 http://www.adm.com/en-US/responsibility/2011CR/Pages/Environment.aspx
100 http://info.cvscaremark.com/our-company/corporate-responsibility/environment/measuring-emissions 101 Nestle response to 2012 Carbon Disclosure Project questionnaire,3.102 http://www.tescoplc.com/files/pdf/reports/tesco_cr_re-view_2012.pdf 103 Total response to 2012 Carbon Disclosure Project questionnaire,3.1a.104 http://www.chevronenergy.com/news_room/default.asp?pr=pr_20110825.asp 105 Chevron response to 2012 Carbon Disclosure Project Questionnaire, 3.1a.106 Conoco Phillips response to 2012 Carbon Disclosure Projectquestionnaire,3.1a.107 Exxon Mobil response to 2012 Carbon Disclosure Projectquestionnaire,3.1a.108 http://www.iocl.com/download/CSR_2010_11270212.pdf 109 JX Holdings response to 2012 Carboon Disclosure Projectquestionnaire,3.1b.110 Petrobras response to 2012 Carbon Disclosure Project questionnaire,3.1e.111 Repsol YPF response to 2012 Carbon Disclosure Projectquestionnaire,3.1a.112 http://www.statoil.com/en/EnvironmentSociety/Environment/Climate/Downloads/Statoil%20response%20to%20car-bon%20disclosure%20project%202012.pdf 113 BP response to 2012 Carbon Disclosure Project questionnaire,3.1.
ENDNOTES

114 http://www.generali.com/ 273213/2011Sustainability-Report.pdf115 Ibid.116 http://www.hsbc.com/1/2/sustainability/protecting-the-environment 117 http://www.hsbc.com/1/2/sustainability/protecting-the-environment 118 Allianz response to 2012 Carbon Disclosure Project questionnaire,3.1b.119 AXA response to 2012 Carbon Disclosure Project questionnaire,3.1.120 Banco Satander response to 2012 Carbon Disclosure Projectquestionnaire,2.2a,3.1b.121 http://about.bankofameri-ca.com/assets/pdf/CSR_Ad-vancing_Environmental_Sus-tainability.pdf 122 Citigroup response to 2012 Carbon Disclosure Project questionnaire,3.1a.123 Credit Agricole response to 2012 Carbon Disclosure Projectquestionnaire,3.1b.124 http://www.ingforsome-thingbetter.com/pdf/ING_Sustainability_Report_2011.pdf 125 JPMorgan Chase response to 2012 Carbon Disclosure Projectquestionnaire,3.1a.126 http://www.ecodesk.com/sustainability/japan-post 127 Munich RE response to 2012 Carbon Disclosure Projectquestionnaire,3.1a.128 http://csr.societegenerale.com/home-page/social-and-environmental-policy/environmental-policy/carbon-neutrality-plan
129 Wells Fargo response to 2012 Carbon Disclosure Projectquestionnaire,3.1a.130 Cardinal Health response to 2012 Carbon Disclosure Projectquestionnaire,3.1a.131 http://www.unitedhealthgroup.com/2011-social-responsibility-report/content/executive-summary/healthy-environment.aspx 132 http://www.bericht.basf.com/2011/en/managements-analysis/environmentand-safety/climateprotection/globalgoals.html?cat=b 133 General Electric response to 2012 Carbon Disclosure Projectquestionnaire,3.1.134 http://www8.hp.com/us/en/hp-information/environment/goals.html 135 Ibid.136 International Business Machines response to 2012 Carbon Disclosure Project questionnaire,3.137 http://www.arcelormittal.com/corp/corporate-responsi-bility/environment/climate-change 138 Noble Group response to 2012 Carbon Disclosure Projectquestionnaire,3.1a.139 http://www.att.com/Common/about_us/files/csr_2012/alternative_energy.pdf 140 http://www.att.com/Common/about_us/files/csr_2012/progress_toward_goals_2011.pdf141 http://www.telekom.com/corporate-responsibility/climate-and-environment/co2-reduction/64852 142 http://www.sk.com/introduce/report/report.asp
143 http://responsibility.verizon.com/sustainability/2011 144 http://www.eon.com/en/media/news/press-releases/2011/12/15/e-dot-on-multi-billion-euro-program-for-energy-transformation.html 145 E.ON response to 2012 Carbon Disclosure Project questionnaire,3.1b,3.1d.146 http://www.edfenergy.com/about-us/energy-generation/renewable-generation/wind-turbines.shtml 147 Electricite de France response to 2012 Carbon DisclosureProjectquestion-naire, 3.1b. 148 http://www.enel.com/en-GB/doc/report2011/Enel_Sustainability_Report.pdf149 Enel response to 2012 Carbon Disclosure Project questionnaire,3.1b.150 http://www.gdfsuez-energy.co.uk/corporate/sustainability/environment/ 151 GDF Suez response to 2012 Carbon Disclosure Project, 1.2a, 3.2a.
ENDNOTES

© M
AR
TIN
VO
NK
A/1
23R
F
About the OrganizationsWWF is an organization dedicated to stopping the degradation of the planet’s natural environment and building a future in which humans live in harmony with nature. WWF achieves this mission through innovative partnerships that combine on-the-ground conservation, high-level policy and advocacy and work to make business and industry more sustainable. This work includes engagements with hundreds of companies across a range of sustainability issues, including through the Climate Savers program, whose member companies have cut their CO2 emissions by over 100 million tons since the beginning of the program, while creating competitive advantage and increasing shareholder value. WWF also supports green power toolsandcertificationsystemslikeWindMade™ www.windmade.org. For more information, visit http://worldwildlife.org/initiatives/transforming-business (U.S. website) and www.panda.org (global website).
Ceres is an advocate for sustainability leadership. It mobilizes a powerful coalition of investors, companies, and public interest groups to accelerate and expand the adoption of sustainable business practices and solutions to build a healthy global economy. Ceres also directs the Investor Network on Climate Risk (INCR), a network of 100 institutional investors with collective assets totaling more than $10 trillion. For more information, visit www.ceres.org and www.incr.com.
Calvert Investments is an investment management company serving institutional investors, retirement plans, financialintermediaries,andtheirclients. Many of Calvert’s investment strategies feature integrated corporate sustainability and responsibility research. Founded in 1976 and based in Bethesda, Maryland, Calvert Investments managed assets of more than $11.9 billion as of November 13, 2012. For more information, visit www.calvert.com.
David Gardiner & Associates (DGA) is a strategic advisor to organizations seeking a sustainable future. We deliver innovative and practical solutions for businessesandnonprofits.Ourpolicyknowledge and strong relationships with policymakers, trade associations, environmental, labor and consumer groups enable us to forge partnerships and foster dialogue for a range of organizations, including Fortune 500 companies,nonprofitorganizations,and foundations. For more information, visit www.dgardiner.com.