Embed Size (px)
Citation preview
Genetic Epidemiology 30: 314–319 (2006)
Power Comparison of Generalizations of the Mean Test for AffectedSib Pairs in Case of Incompletely Informative Markers
Michael Knapp�
Institute for Medical Biometry, Informatics and Epidemiology, University of Bonn, Germany
Previously applied test statistics for affected sib pairs (ASP) have been criticized for not fully exploiting the power of agiven sample, because they do not account for incomplete informativity of an affected sib pair. To circumvent this problem,recently a new test had been proposed which weighs families proportional to their marker informativity. Here, the behaviorof this new test is explored under scenarios considered to be relevant in the context of complex diseases. The results showthat the new test does not represent an improvement. The asymptotic version of the new test tends to be markedly anti-conservative even for larger sample sizes, whereas the permutation procedure proposed for the simulation of exact P valuesis at least questionable. Most importantly, the new test is less powerful than its competitors, especially in case of low markerinformativity it was designed for. Genet. Epidemiol. 30:314–319, 2006. r 2006 Wiley-Liss, Inc.
Key words: linkage analysis; marker informativity
The supplemental materials described in this article can be found at http://www.interscience.wiley.com/jpages/0741-0395/suppmatContract grant sponsor: Deutsche Forschungsgemeinschaft; Contract grant number: Kn378/1-3.�Correspondence to: Dr. Michael Knapp, Institute for Medical Biometry, Informatics and Epidemiology, University of Bonn, Sigmund-Freud-Str. 25, D-53105 Bonn, Germany. E-mail: [email protected] 16 November 2005; Accepted 18 January 2006Published online 20 March 2006 in Wiley InterScience (www.interscience.wiley.com).DOI: 10.1002/gepi.20146
INTRODUCTION
Recently, there has been an extensive debate onthe potential decrease of power induced by theinclusion of incomplete informative families in thecontext of nonparametric linkage analysis (Schorkand Greenwood, 2004a,b; Cordell, 2004; Mukho-padhyay et al., 2004; Visscher and Wray, 2004;Sieberts et al., 2004; Abecasis et al., 2004).Following these concerns, Franke and Ziegler[2005] presented a new test statistic Tw fornonparametric affected sib pair (ASP) analysiswhich weighs families proportional to theirmarker informativity and which, according tothe evidence presented in their paper, in case oflow marker informativity appears to be substan-tially superior in terms of power when comparedto previously applied test statistics. However, thepower estimates obtained in the simulation studyof Franke and Ziegler [2005] were incorrect due toan error in their calculations. More importantly,their simulation study only evaluates power forcompletely penetrant diseases without phenoco-pies, which may be considered as not reallyrelevant in the context of genetically complex
diseases. The purpose of the present report is toexplore the behavior of Tw for disease models witha less strong genetic effect.
METHODS
NOTATION
For a family consisting of parents plus twochildren, let M denote the observed marker geno-types, let ASP denote the event that both childrenare affected, and let IBD 5 j denote the event thatthe two children share j alleles identical-by-descent(IBD) at some position in the genome. Then,
PðMjASPÞ ¼X2
j¼0
PðIBD ¼ j; M; ASPÞ
PðASPÞ
¼X2
j¼0
PðMjASP; IBD ¼ jÞ
PðIBD ¼ jjASPÞ
¼X2
j¼0
~wjzj
ð1Þ
r 2006 Wiley-Liss, Inc.
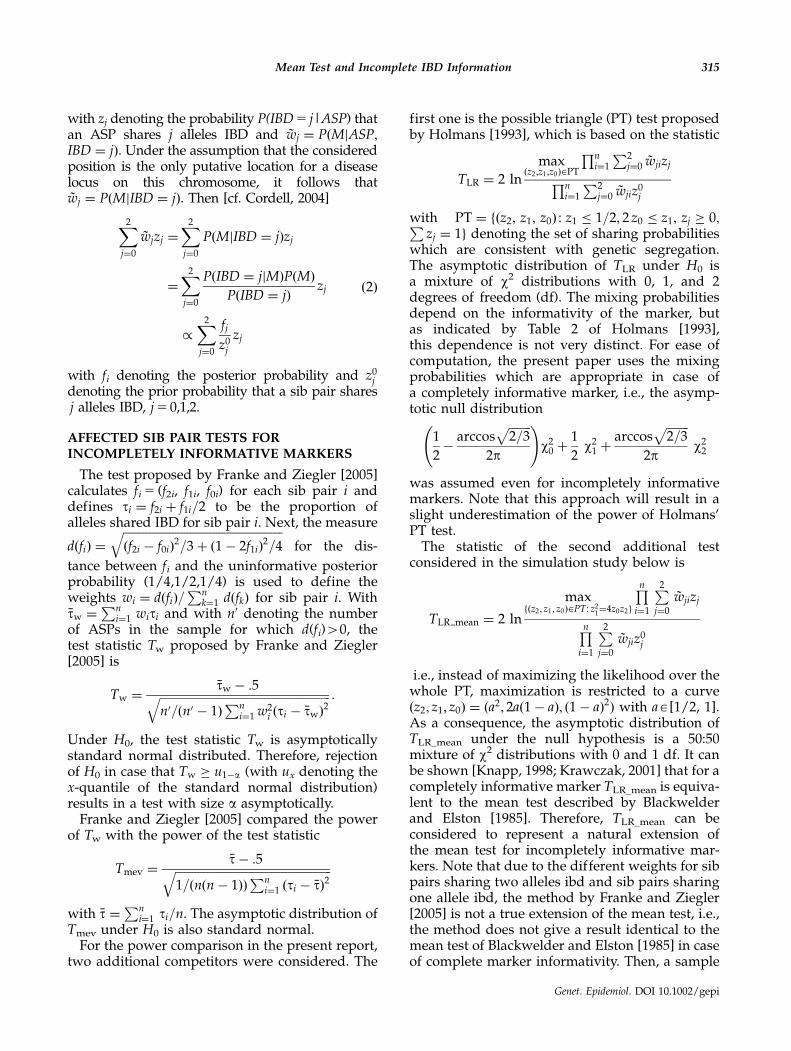
with zj denoting the probability P(IBD 5 j|ASP) thatan ASP shares j alleles IBD and ~wj ¼ PðMjASP;IBD ¼ jÞ. Under the assumption that the consideredposition is the only putative location for a diseaselocus on this chromosome, it follows that~wj ¼ PðMjIBD ¼ jÞ. Then [cf. Cordell, 2004]
X2
j¼0
~wjzj ¼X2
j¼0
PðMjIBD ¼ jÞzj
¼X2
j¼0
PðIBD ¼ jjMÞPðMÞ
PðIBD ¼ jÞzj
/X2
j¼0
fj
z0j
zj
ð2Þ
with fi denoting the posterior probability and z0j
denoting the prior probability that a sib pair sharesj alleles IBD, j 5 0,1,2.
AFFECTED SIB PAIR TESTS FORINCOMPLETELY INFORMATIVE MARKERS
The test proposed by Franke and Ziegler [2005]calculates fi 5 (f2i, f1i, f0i) for each sib pair i anddefines ti ¼ f2i þ f1i=2 to be the proportion ofalleles shared IBD for sib pair i. Next, the measure
dðfiÞ ¼
ffiffiffiffiffiffiffiffiffiffiffiffiffiffiffiffiffiffiffiffiffiffiffiffiffiffiffiffiffiffiffiffiffiffiffiffiffiffiffiffiffiffiffiffiffiffiffiffiffiffiffiffiffiffiffiðf2i � f0iÞ
2=3þ ð1� 2f1iÞ2=4
qfor the dis-
tance between fi and the uninformative posteriorprobability (1/4,1/2,1/4) is used to define theweights wi ¼ dðfiÞ=
Pnk¼1 dðfkÞ for sib pair i. With
�tw ¼Pn
i¼1 witi and with n0 denoting the numberof ASPs in the sample for which d(fi)40, thetest statistic Tw proposed by Franke and Ziegler[2005] is
Tw ¼�tw � :5ffiffiffiffiffiffiffiffiffiffiffiffiffiffiffiffiffiffiffiffiffiffiffiffiffiffiffiffiffiffiffiffiffiffiffiffiffiffiffiffiffiffiffiffiffiffiffiffiffiffiffiffiffiffiffiffiffiffiffi
n0=ðn0 � 1ÞPn
i¼1 w2i ðti � �twÞ
2q :
Under H0, the test statistic Tw is asymptoticallystandard normal distributed. Therefore, rejectionof H0 in case that Tw � u1�a (with ux denoting thex-quantile of the standard normal distribution)results in a test with size a asymptotically.
Franke and Ziegler [2005] compared the powerof Tw with the power of the test statistic
Tmev ¼�t� :5ffiffiffiffiffiffiffiffiffiffiffiffiffiffiffiffiffiffiffiffiffiffiffiffiffiffiffiffiffiffiffiffiffiffiffiffiffiffiffiffiffiffiffiffiffiffiffiffiffiffiffiffiffiffi
1=ðnðn� 1ÞÞPn
i¼1 ðti � �tÞ2
qwith �t ¼
Pni¼1 ti=n. The asymptotic distribution of
Tmev under H0 is also standard normal.For the power comparison in the present report,
two additional competitors were considered. The
first one is the possible triangle (PT) test proposedby Holmans [1993], which is based on the statistic
TLR ¼ 2 ln
maxðz2;z1;z0Þ2PT
Qni¼1
P2j¼0 ~wjizjQn
i¼1
P2j¼0 ~wjiz0
j
with PT ¼ fðz2; z1; z0Þ : z1 � 1=2; 2 z0 � z1; zj � 0;Pzj ¼ 1g denoting the set of sharing probabilities
which are consistent with genetic segregation.The asymptotic distribution of TLR under H0 isa mixture of w2 distributions with 0, 1, and 2degrees of freedom (df). The mixing probabilitiesdepend on the informativity of the marker, butas indicated by Table 2 of Holmans [1993],this dependence is not very distinct. For ease ofcomputation, the present paper uses the mixingprobabilities which are appropriate in case ofa completely informative marker, i.e., the asymp-totic null distribution
1
2�
arccosffiffiffiffiffiffiffiffi2=3
p2p
!w2
0 þ1
2w2
1 þarccos
ffiffiffiffiffiffiffiffi2=3
p2p
w22
was assumed even for incompletely informativemarkers. Note that this approach will result in aslight underestimation of the power of Holmans’PT test.
The statistic of the second additional testconsidered in the simulation study below is
TLR mean ¼ 2 ln
maxfðz2; z1; z0Þ2PT: z2
1¼4z0z2g
Qni¼1
P2j¼0
~wjizj
Qni¼1
P2j¼0
~wjiz0j
i.e., instead of maximizing the likelihood over thewhole PT, maximization is restricted to a curveðz2; z1; z0Þ ¼ ða2; 2að1� aÞ; ð1� aÞ2Þ with aA[1/2, 1].As a consequence, the asymptotic distribution ofTLR_mean under the null hypothesis is a 50:50mixture of w2 distributions with 0 and 1 df. It canbe shown [Knapp, 1998; Krawczak, 2001] that for acompletely informative marker TLR_mean is equiva-lent to the mean test described by Blackwelderand Elston [1985]. Therefore, TLR_mean can beconsidered to represent a natural extension ofthe mean test for incompletely informative mar-kers. Note that due to the different weights for sibpairs sharing two alleles ibd and sib pairs sharingone allele ibd, the method by Franke and Ziegler[2005] is not a true extension of the mean test, i.e.,the method does not give a result identical to themean test of Blackwelder and Elston [1985] in caseof complete marker informativity. Then, a sample
315Mean Test and Incomplete IBD Information
Genet. Epidemiol. DOI 10.1002/gepi
is characterized by (n2, n1, n0) with ni denotingthe observed number of sib pairs sharing exactlyi alleles ibd (0 � i � 2). It can be shown that
Twðn2 þ 1; n1 � 2; n0 � 1ÞoTwðn2; n1; n0Þ
i.e., the value of the test statistic decreases with anincreasing number of sib pairs sharing two allelesibd, provided that the total number of alleles ibdin the sample is fixed. This decrease is substantial,as already can be seen from the following simpleexample. Assume a first sample of 10 ASPs inwhich five sib pairs share two alleles ibd and theremaining five sib pairs share one allele ibd. Ina second sample of 10 ASPs, seven sib pairs sharetwo alleles ibd and one sib pair shares one alleleibd. Thus, the total number of alleles ibd is 15in both samples, and, therefore, the statistic ofthe mean test proposed by Blackwelder and Elston[1985] as well as the statistic TLR_mean is identicalfor both samples. However, Tw(5, 5, 0) 5 3.79for the first and Tw(7, 1, 2) 5 1.88 for the secondsample.
SIMULATION STUDY
To compare the performance of test statisticsTmev, Tw, TLR, and TLR_mean, a simulation studywas performed. The alternative hypotheses(z2,z1,z0) considered in this study should reflectrelevant scenarios in current attempts to decom-pose the genetic basis of complex diseases. In casethat ðz2; z1; z0Þ ¼ ðt2; 2tð1� tÞ; ð1� tÞ2Þ with 1=2 �t � 1, the sharing of paternal and maternal allelesare independent in ASPs and, therefore, anexcellent approximation of the sample size nrequired to obtain a power of 1�b with the meantest in case of a completely informative marker isgiven by [cf. Sengul et al., 2001]
n ¼
ffiffiffi2p
u1�a �ffiffiffiffiffiffiffiffiffiffiffiffiffiffiffiffiffiffiffi2tð1� tÞ
pub
2t� 1
!2
ð3Þ
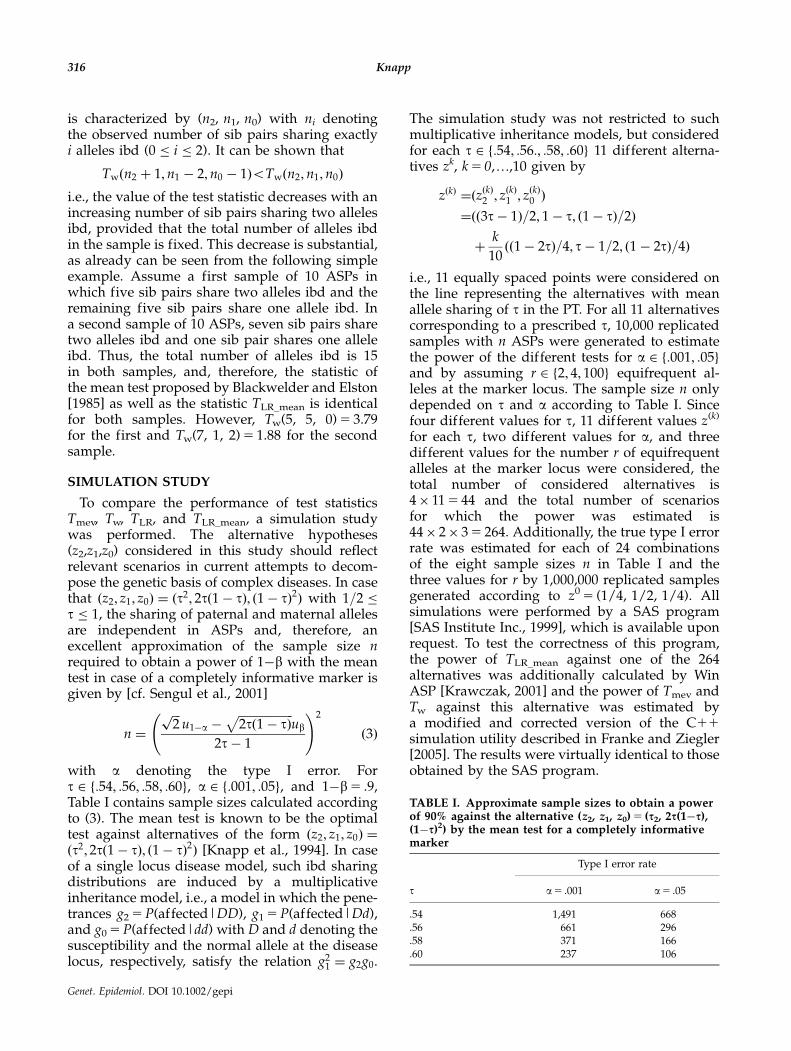
with a denoting the type I error. Fort 2 f:54; :56; :58; :60g, a 2 f:001; :05g, and 1�b5 .9,Table I contains sample sizes calculated accordingto (3). The mean test is known to be the optimaltest against alternatives of the form ðz2; z1; z0Þ ¼
ðt2; 2tð1� tÞ; ð1� tÞ2Þ [Knapp et al., 1994]. In caseof a single locus disease model, such ibd sharingdistributions are induced by a multiplicativeinheritance model, i.e., a model in which the pene-trances g2 5 P(affected|DD), g1 5 P(affected|Dd),and g0 5 P(affected|dd) with D and d denoting thesusceptibility and the normal allele at the diseaselocus, respectively, satisfy the relation g2
1 ¼ g2g0.
The simulation study was not restricted to suchmultiplicative inheritance models, but consideredfor each t 2 f:54; :56:; :58; :60g 11 different alterna-tives zk, k 5 0,y,10 given by
zðkÞ ¼ðzðkÞ2 ; zðkÞ1 ; z
ðkÞ0 Þ
¼ðð3t� 1Þ=2; 1� t; ð1� tÞ=2Þ
þk
10ðð1� 2tÞ=4; t� 1=2; ð1� 2tÞ=4Þ
i.e., 11 equally spaced points were considered onthe line representing the alternatives with meanallele sharing of t in the PT. For all 11 alternativescorresponding to a prescribed t, 10,000 replicatedsamples with n ASPs were generated to estimatethe power of the different tests for a 2 f:001; :05gand by assuming r 2 f2; 4; 100g equifrequent al-leles at the marker locus. The sample size n onlydepended on t and a according to Table I. Sincefour different values for t, 11 different values z(k)
for each t, two different values for a, and threedifferent values for the number r of equifrequentalleles at the marker locus were considered, thetotal number of considered alternatives is4� 11 5 44 and the total number of scenariosfor which the power was estimated is44� 2� 3 5 264. Additionally, the true type I errorrate was estimated for each of 24 combinationsof the eight sample sizes n in Table I and thethree values for r by 1,000,000 replicated samplesgenerated according to z0 5 (1/4, 1/2, 1/4). Allsimulations were performed by a SAS program[SAS Institute Inc., 1999], which is available uponrequest. To test the correctness of this program,the power of TLR_mean against one of the 264alternatives was additionally calculated by WinASP [Krawczak, 2001] and the power of Tmev andTw against this alternative was estimated bya modified and corrected version of the C11
simulation utility described in Franke and Ziegler[2005]. The results were virtually identical to thoseobtained by the SAS program.
TABLE I. Approximate sample sizes to obtain a powerof 90% against the alternative (z2, z1, z0) 5 (s2, 2s(1�s),(1�s)2) by the mean test for a completely informativemarker
t
Type I error rate
a5 .001 a5 .05
.54 1,491 668
.56 661 296
.58 371 166
.60 237 106
316 Knapp
Genet. Epidemiol. DOI 10.1002/gepi
RESULTS
TYPE I ERROR RATES
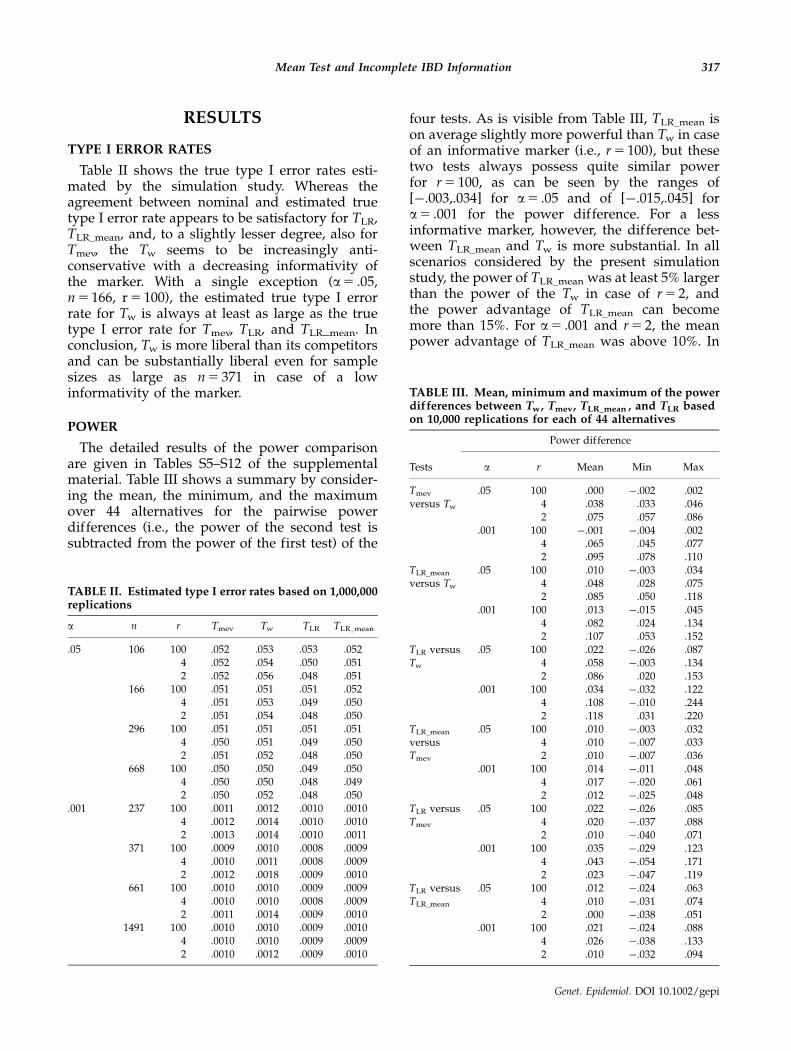
Table II shows the true type I error rates esti-mated by the simulation study. Whereas theagreement between nominal and estimated truetype I error rate appears to be satisfactory for TLR,TLR_mean, and, to a slightly lesser degree, also forTmev, the Tw seems to be increasingly anti-conservative with a decreasing informativity ofthe marker. With a single exception (a5 .05,n 5 166, r 5 100), the estimated true type I errorrate for Tw is always at least as large as the truetype I error rate for Tmev, TLR, and TLR_mean. Inconclusion, Tw is more liberal than its competitorsand can be substantially liberal even for samplesizes as large as n 5 371 in case of a lowinformativity of the marker.
POWER
The detailed results of the power comparisonare given in Tables S5–S12 of the supplementalmaterial. Table III shows a summary by consider-ing the mean, the minimum, and the maximumover 44 alternatives for the pairwise powerdifferences (i.e., the power of the second test issubtracted from the power of the first test) of the
four tests. As is visible from Table III, TLR_mean ison average slightly more powerful than Tw in caseof an informative marker (i.e., r 5 100), but thesetwo tests always possess quite similar powerfor r 5 100, as can be seen by the ranges of[�.003,.034] for a5 .05 and of [�.015,.045] fora5 .001 for the power difference. For a lessinformative marker, however, the difference bet-ween TLR_mean and Tw is more substantial. In allscenarios considered by the present simulationstudy, the power of TLR_mean was at least 5% largerthan the power of the Tw in case of r 5 2, andthe power advantage of TLR_mean can becomemore than 15%. For a5 .001 and r 5 2, the meanpower advantage of TLR_mean was above 10%. In
TABLE II. Estimated type I error rates based on 1,000,000replications
a n r Tmev Tw TLR TLR_mean
.05 106 100 .052 .053 .053 .0524 .052 .054 .050 .0512 .052 .056 .048 .051
166 100 .051 .051 .051 .0524 .051 .053 .049 .0502 .051 .054 .048 .050
296 100 .051 .051 .051 .0514 .050 .051 .049 .0502 .051 .052 .048 .050
668 100 .050 .050 .049 .0504 .050 .050 .048 .0492 .050 .052 .048 .050
.001 237 100 .0011 .0012 .0010 .00104 .0012 .0014 .0010 .00102 .0013 .0014 .0010 .0011
371 100 .0009 .0010 .0008 .00094 .0010 .0011 .0008 .00092 .0012 .0018 .0009 .0010
661 100 .0010 .0010 .0009 .00094 .0010 .0010 .0008 .00092 .0011 .0014 .0009 .0010
1491 100 .0010 .0010 .0009 .00104 .0010 .0010 .0009 .00092 .0010 .0012 .0009 .0010
TABLE III. Mean, minimum and maximum of the powerdifferences between Tw, Tmev, TLR_mean , and TLR basedon 10,000 replications for each of 44 alternatives
Power difference
Tests a r Mean Min Max
Tmev
versus Tw
.05 100 .000 �.002 .0024 .038 .033 .0462 .075 .057 .086
.001 100 �.001 �.004 .0024 .065 .045 .0772 .095 .078 .110
TLR_mean
versus Tw
.05 100 .010 �.003 .0344 .048 .028 .0752 .085 .050 .118
.001 100 .013 �.015 .0454 .082 .024 .1342 .107 .053 .152
TLR versusTw
.05 100 .022 �.026 .0874 .058 �.003 .1342 .086 .020 .153
.001 100 .034 �.032 .1224 .108 �.010 .2442 .118 .031 .220
TLR_mean
versusTmev
.05 100 .010 �.003 .0324 .010 �.007 .0332 .010 �.007 .036
.001 100 .014 �.011 .0484 .017 �.020 .0612 .012 �.025 .048
TLR versusTmev
.05 100 .022 �.026 .0854 .020 �.037 .0882 .010 �.040 .071
.001 100 .035 �.029 .1234 .043 �.054 .1712 .023 �.047 .119
TLR versusTLR_mean
.05 100 .012 �.024 .0634 .010 �.031 .0742 .000 �.038 .051
.001 100 .021 �.024 .0884 .026 �.038 .1332 .010 �.032 .094
317Mean Test and Incomplete IBD Information
Genet. Epidemiol. DOI 10.1002/gepi
conclusion, TLR_mean, TLR, and Tmev clearly out-performed Tw in the present simulation study forr 5 2 and 4. The power difference betweenTLR_mean and Tmev is always between �2.5% and6.1% and seems not to be affected by markerinformativity. On average, TLR_mean appears to beslightly more powerful than Tmev. The powerdifference between TLR and TLR_mean can be morepronounced. Whereas the power advantage ofTLR_mean is never larger than 3.8%, there arealternatives for which the power of TLR is morethan 13% larger than the power of TLR_mean.A closer inspection of Tables S5–S12 reveals thatalternatives for which the power of TLR is largerthan the power of TLR_mean are represented bypoints near the line z1 5 2z0 in the PT, whereasTLR_mean is more powerful than TLR for alterna-tives near the line z1 5 1/2.
DISCUSSION
There is no statistic for ASPs which is uniformlymost powerful against all alternatives. Therefore,it is not surprising that disease models exist forwhich Tw outperforms its competitors. One suchdisease model is that of a rare dominant disease.As shown in Table S3 of the supplementalmaterial, the power of Tw for this scenario islarger than the power of Tmev, TLR, and TLR_mean.The difference between the tests, however, ismuch smaller than indicated by the simulationresults of Franke and Ziegler [2005]. With currentsample sizes of at least 100 ASPs, disease loci withsuch a strong genetic effect as implied by a raredominant disease will be easily detected by anystatistic for nonparametric linkage analysis. There-fore, the relative performance of the tests againstsuch alternatives seems to be of minor interest.Thus, the present report compared Tw, Tmev, TLR,and TLR_mean against a broad set of alternativeswhich were selected to represent genetic effectswhich are sufficiently strong in the sense that theycan be detected by sample sizes in the range of100–1,500 ASPs, but which are not over-optimis-tically strong to be easily detected by a few dozensof ASPs. The recommendation on the basis of theresults is surprisingly clear-cut. There is no reasonto advocate the usage of Tw. Firstly, there wasnearly no alternative for which Tw was superior toits competitors in case of a near completelyinformative (r 5 100) marker. Secondly, the resultsindicate that the relative performance of Tw
becomes increasingly poorer with decreasing
marker informativity. Thus, Tw misses its goal tobe relatively powerful especially in case of lowmarker informativity. Thirdly, the gap betweenthe true type I error rate and the nominal levelis larger for Tw than for TLR and TLR_mean, i.e., Tw
tends to be anti-conservative.To guard against the inflation of the true type I
error probability for the Tw, Franke and Ziegler[2005] suggested a Monte Carlo permutationprocedure to assign an empirical P value to theobserved value of the test statistic for the real data.Franke and Ziegler [2005] considered it to beessential for such a permutation procedure thatan ASP of the real sample is replaced in thesimulated sample by an ASP with identicalinformativity. This criterion, however, is neithernecessary nor sufficient for a valid permutationprocedure. The goal of a Monte Carlo permutationprocedure is to sample from the distribution of thetest statistic under the null hypothesis. Theprocedure by Franke and Ziegler [2005], how-ever, replaces an ASP possessing an ibd score ofone (i.e., (f2, f1, f0) 5 (0,1,0)) by an ASP withðf2, f1, f0Þ ¼ ð1� f1 � f0, ð1þ sinðtÞÞ=2, ð1þ
ffiffiffi3p
cosðtÞ� sinðtÞÞ=4Þ, where t is drawn from a uniformU(a, b) distribution with aE3.67 and bE5.76.Therefore, the permutation procedure by Frankeand Ziegler [2005] generates observations whichmay be impossible to occur in the real data, forexample, in case that only a single marker locushas been genotyped. Thus, their procedure missesto sample from the distribution of the test statisticunder the null hypothesis and its validity is atleast questionable. Table S1 of the supplementalmaterial suggests a straightforward approachfor constructing a valid permutation procedurefor the case of a single marker: Each family of thereal data contributes a family for the simulatedsample which possesses an identical mating typeand for which the ibd score is randomly selectedaccording to the conditional probabilities givenin Table S1 when (1/4, 1/2, 1/4) is inserted for(z2, z1, z0). For example, a family in the real sam-ple with mating type 3 (i.e., both parents possessan identical heterozygous genotype) is replacedwith probability 1/8 by a family with(f2, f1, f0) 5 (1, 0, 0), with probability 1/2 by a familywith (f2, f1, f0) 5 (0, 1, 0), with probability 1/8 by afamily with (f2, f1, f0) 5 (0, 0, 1), and with proba-bility 1/4 by a family with (f2, f1, f0)5(1/2, 0, 1/2).Obviously, this procedure samples from the distri-bution of the test statistic under the null hypothesisand conditional on the distribution of observedmating types.
318 Knapp
Genet. Epidemiol. DOI 10.1002/gepi
This report considered only the asymptoticversion of Tw, Tmev, TLR , and TLR_mean and didnot compare the tests with empirically determinedP values. The main reason for this decision wasthe computational burden induced by a powercomparison for permutation tests. Since Tw wasthe most liberal asymptotic test, there is no reasonto expect a power advantage for Tw if the empi-rical versions of the tests would be compared.
ACKNOWLEDGMENTS
This work was supported by grant Kn378/1-3(Projects D1 of FOR 423) from the DeutscheForschungsgemeinschaft.
ELECTRONIC-DATABASEINFORMATION
The WinASP power calculator is availableat http://www.uni-kiel.de/medinfo/mitarbeiter/krawczak/download/index.html
REFERENCESAbecasis G, Cox N, Daly MJ, Kruglyak L, Laird N, Markianos K,
Patterson N. 2004. No bias in linkage analysis. Am J HumGenet 75:722–723.
Blackwelder WC, Elston RC. 1985. A comparison of sib-pairlinkage tests for disease susceptibility loci. Genet Epidemiol2:85–97.
Cordell HJ. 2004. Bias toward the null hypothesis in model-freelinkage analysis is highly dependent on the test statistic used.Am J Hum Genet 74:1294–1302.
Franke D, Ziegler A. 2005. Weighting affected sib pairs by markerinformativity. Am J Hum Genet 77:230–241.
Holmans P. 1993. Asymptotic properties of affected sib-pairlinkage analysis. Am J Hum Genet 52:362–374.
Knapp M. 1998. Genetische Ursachen von Erkrankungen. Beitragezur statistischen Methodik bei der Bestimmung von Kran-kheitsgenen. Universitat Bonn: Habilitationsschrift.
Knapp M, Seuchter SA, Baur MP. 1994. Linkage analysis in nuclearfamilies. 1: Optimality criteria for affected sib-pair tests. HumHered 44:37–43.
Krawczak M. 2001. ASP—a simulation-based power calculator forgenetic linkage studies of qualitative traits, using sib-pairs.Hum Genet 109:675–677.
Mukhopadhyay I, Feingold E, Weeks DE. 2004. No ‘‘bias’’toward the null hypothesis in most conventional multi-point nonparametric linkage analyses. Am J Hum Genet 75:716–718.
Risch N. 1990. Linkage strategies for genetically complex traits. III.The effect of marker polymorphism on analysis of affectedrelative pairs. Am J Hum Genet 46:242–253.
SAS Institute Inc. 1999. SAS Language Reference. Cary, NC:Version 8. SAS Institute.
Schork NJ, Greenwood TA. 2004a. Inherent bias toward the nullhypothesis in conventional multipoint nonparametric linkageanalysis. Am J Hum Genet 74:306–316.
Schork NJ, Greenwood TA. 2004b. Got bias? The authors reply.Am J Hum Genet 75:723–727.
Sengul H, Weeks DE, Feingold E. 2001. A survey of affected-sibship statistics for nonparametric linkage analysis. Am JHum Genet 69:179–190.
Sieberts SK, Broman KW, Gudbjartsson DF. 2004. ‘‘Bias towardsthe null’’ means reduced power. Am J Hum Genet 75:720–722.
Suarez BK, Rice J, Reich T. 1978. The generalized sib-pair IBDdistribution: its use in the detection of linkage. Ann HumGenet 42:87–94.
Visscher PM, Wray NR. 2004. Conventional multipoint nonpara-metric linkage analysis is not necessarily inherently biased.Am J Hum Genet 75:718–720.
319Mean Test and Incomplete IBD Information
Genet. Epidemiol. DOI 10.1002/gepi