Embed Size (px)
Citation preview

Power ChoicesPathways to Carbon-Neutral Electricity in Europe by 2050

EURELECTRIC’s 2007 Role of Electricity project
showed that, under the most favourable scenario using
all available energy options to meet a 50% reduction
target for carbon dioxide emissions in the EU 25 by
2050, the specific CO2 emissions for the European
power sector would fall from the current 0.45 tonnes
CO2 per MWh to 0.10 t CO2/ MWh - equivalent to some
500 million tonnes of CO2 per annum.
Meanwhile the 4th Assessment Report of the
International Panel on Climate Change (IPCC) indicated
that, to in order to stabilise atmospheric CO2 emissions
within the threshold of 440ppm, and thus hold the
global temperature rise to an average of 2°C over the
pre-industrial level, emissions would have to fall by
50% on current levels and that the OECD countries
would have to reduce their emissions by 60-80%. This
implies that the OECD power sector would have to be
virtually carbon-free by 2050.
Recognising the responsibility of the power sector as a
major emitter of greenhouse gas, sixty Chief Executives
of electricity companies representing well over 70%
of total EU power generation signed a Declaration in
March 2009, committing to action to achieve carbon-
neutrality by mid-century. The Declaration, which also
draws attention to the need for a properly-functioning
electricity market in Europe, the desirability of an
international carbon
emissions market and
the role of efficient
electric technologies
in the overall drive for
energy efficiency and
carbon reductions, was
handed to the EU Energy
Commissioner by
EURELECTRIC President
Lars G Josefsson.
Carbon-neutrality means:
- Calculatingemissionsaccuratelyinatransparent
manner
- Reducingemissionstothefullestextentfeasible
withinthesector
- Offsettingresidualemissionsthroughactions
toreducegreenhousegaseselsewhere-via
technologytransfer,afforestation,etc-such
thatnetcarbonemissionsareequivalenttozero
The EURELECTRIC Power Choices study was set up to
examine how this vision can be made reality. Setting a
reduction goal of 75% - mid-way on the IPCC’s 60-80%
scale - Power Choices looks into the technological
developments that will be needed in the coming
decades and examines some of the policy options
that will have to be put in place within the EU to attain
a deep cut in carbon emissions by mid-century..
Confirming that a carbon neutral power supply, in
combination with a paradigm shift on the demand
side, is the key to achieving this deep cut in overall EU
emissions, the PowerChoices scenario delivers carbon-
neutral power in Europe by 2050:
via low-carbon technologies such as renewable
energies (RES), carbon capture & storage (CCS)
technologies and nuclear power
through intelligent and efficient electricity
generation, transmission and use
with intelligent electricity use as the driver for a
secure, low-carbon energy future
by promoting the roll-out of electric road vehicles
through a drive for widespread energy efficiency in
our economy and society
at a lower long-term total energy cost than under
the Baseline scenario
BackgroundCarbon Reduction Actions and the Power Choices Study

Key Outcomes• Carbon-neutral power in Europe by 2050 is achievable
• The major CO2 reduction in the power sector occurs during 2025 to 2040
• All power generation options, plus robust electricity and carbon markets and
policies to foster energy efficiency, are all needed simultaneously
• A paradigm-shift is needed on the demand side: intelligent electricity sys-
tems should replace direct use of fossil fuels
• The PowerChoices scenario minimises energy import dependency
Policy Recommendations In order to achieve a carbon-neutral power sector, strong and immediate politi-
cal action is required to:
Support the carbon market so as to deliver the EU CO2 cap at least cost
Ensure that all sectors internalise the cost of greenhouse gas emissions
Actively promote an international agreement on climate change
Ensure that public authorities take a leading role in energy efficiency, adop-
ting standards and incentives to help consumers choose energy-efficient
technologies
Enable the use of all low-carbon technology options, by ensuring very subs-
tantial investment in:
- large-scale uptake of renewable energies
- early deployment of carbon capture & storage (CCS) technologies, which
must be tested and proven by 2020
- new nuclear power plants
- ‘smart’ grids and networks
- widespread energy efficiency in our economy and society
Encourage public acceptance of modern energy infrastructure, especially
grids, onshore wind, and CO2-storage sites, and streamline their licensing
procedures
Ensure recognition that the cost of technology deployment differs substanti-
ally across the EU Member States and distribution effects will vary
Facilitate the electrification of road transport and spatial heating & cooling

Modelling for an Optimum Energy Portfolio
The Study
EURELECTRIC’s Power Choices study uses the PRIMES energy
model developed and run by Athens Technical University
by a team under Professor Pantelis Capros - also used by
the European Commission for its energy scenario work - to
examine scenarios to 2050. For this project, the model has
been fully updated as regards macroeconomic and power-
sector data and assumptions.
The scenario calculations break the 2050 timeframe into three
periods: 1) recession 2008-2014; 2) recovery 2015-2022; and
3) low but stable growth 2023-2050. These macroeconomic
assumptions are consistent with those employed by the
EU legislative bodies for economic analysis. They are a key
factor in the model, as the level of economic activity and
growth drives future energy demand. Fuel prices are derived
from the Prometheus world energy model and are employed
consistently throughout.
The study develops two alternative scenarios for the EU-27
countries during the 1990-2050 period: Baseline, assuming
all existing policies are pursued; and PowerChoices, which
sets a 75% reduction target for greenhouse gases across the
entire EU economy.
The Baseline scenario assumes that:
• Full auctioning of emissions allowances under the EU
Emissions Trading System (ETS) applies as of 2015
• Renewable energies (RES) reach their highest level of
deployment via existing national support mechanisms
• After 2020, no further policies are set to promote RES
• The EU maintains beyond 2020 the linear CO2 reduction
set by the ETS
• CO2 prices are applied only in sectors covered by the
ETS
• Announced pilot projects for carbon capture and storage
are in operation by 2020
• The nuclear phase-out envisaged in Germany and
Belgium remains in place
• Energy effi ciency policies are enacted, driving energy
savings and cutting demand
• Electricity does not become a major fuel in the road
transport sector
The Power Choices scenario aims for an optimal portfolio
of power generation based on an integrated energy market.
The PRIMES model calculates the market-optimum, taking
into account the technology assumptions developed by the
industry. The scenario assumes that:
Climate action becomes a priority and the EU sets and
reaches a target of cutting 75% of its CO2 emissions from
the whole economy versus 1990 levels
Electricity becomes a major transport fuel as plug-in
electric and hybrid cars develop
All power generation options remain available, including
nuclear power in those countries that currently produce
it, but envisaged national phase-out policies remain
No binding RES-targets are set after 2020; RES support
mechanisms remain fully in place until 2020 and are then
gradually phased out during 2020-2030
Energy effi ciency is pushed by specifi c policies and
standards on the demand-side during the entire projection
period, which will result in slower demand growth
The price of CO2 (‘carbon-value’) applies uniformly to all
economic sectors, not just those within the ETS, so that
all major emitting sectors pay for their emissions
After 2020, an international carbon market defi nes the
price per tonne of CO2; after 2030 the CO2 price is the
only driver for deployment of low-carbon technologies
CCS technology is commercially available from 2025.
CO2 emissions under Baseline and PowerChoices work out
as shown in the graph:
CO2 emissions index (1990=100)
0.0
20.0
40.0
60.0
80.0
100.0
120.0
1990 2000 2010 2020 2030 2040 2050
Baseline Power Choices
Modelling for an Optimum Modelling for an Optimum Modelling for an Optimum Modelling for an Optimum Energy PortfolioEnergy PortfolioEnergy PortfolioEnergy Portfolio

Power Choices results in savings in primary energy consumption versus Baseline The PowerChoices scenario shows primary energy consumption
to 2050 falling from 1795 Mtoe to 1402 Mtoe, a reduction of
22% on Baseline.
The major part of this reduction is accounted for by considerably
lower demand in the transport and residential sectors, much of
this trend being due to substitution by electricity of relatively
ineffi cient uses of oil and gas in road transport and household
heating. A signifi cant role is also played by much improved
building insulation, plus effi ciency advances in existing
electrical applications.
Power Choices scenario delivers a major reduction in import
dependency.
We observe a reduction of 40% in net energy imports under the
PowerChoices scenario compared to Baseline. In addition to
the greatly reduced use of oil and gas in end-user applications,
the scenario also indicates a slightly lower use of gas for
generating electricity than in the Baseline scenario.
A change in the structure of fi nal energy demand – a shift to electricity. This reduction in primary energy demand translates to an even
steeper decrease in fi nal energy consumption, from 1170 Mtoe
to 817 Mtoe, a saving of 30% on Baseline.
The PowerChoices scenario delivers a signifi cant part of the
reduction in fi nal energy consumption through a shift towards
electric applications.
The scenario indicates very strong reduction in end use of
gas and oil – down from 52.5% of fi nal energy demand under
Baseline to only 36% under PowerChoices. This is mirrored by a
consequent increase in the proportion of electricity in end-use
applications – up from 20% to 45.5%. We see a small increase
in the proportion of renewable energy in end use - from 7%
to 7.5% - a fi gure which includes applications such as solar
thermal and biomass-based heating. However the overall RES
share in energy demand is much higher, as RES-power assumes
much greater importance in electricity generation.
Energy in the Wider Economy
A paradigm shift on the demand side: oil and gas replaced by effi cient electric technologies
Primary Energy Requirements in Mtoe
0200400600800
100012001400160018002000
2010 2020 2030 2040 2050
Baseline
Renewables
Nuclear
Natural gas
Oil
Solids
Final Energy Demand in Mtoe
0
200
400
600
800
1000
1200
1400
2010 2020 2030 2040 2050
Baseline
Renewables
Steam Distrib.
Electricity
Gas
Oil
Solids
Under Power Choices, the
residential sector shows
fi nal energy consumption of
175Mtoe in 2050, down from
308Mtoe in 2005. A major part
of this cut is accountable to heating and cooling, in which fi nal
energy demand falls by over half from 275Mtoe to 135Mtoe,
due to major progress in insulation and a shift in heating
technology away from oil and gas towards effi cient heat
pumps, which sees both gas and oil demand in the sector cut by
over 60% by 2050. Residential energy demand is also reduced
by major advances in the effi ciency of electrical appliances and
lighting technology, where the PowerChoicesscenario results
in 40% lower energy demand in 2050 compared to Baseline.
Under the Power Choices
scenario, fi nal energy
consumption in the transport
sector is cut by over 35%, from
362Mtoe in 2005 to 223Mtoe
in 2050. This transition is particularly remarkable given a
predicted rise of over 45% in distance travelled per citizen
over the period – from 12,750km per year in 2005 to 18,250km
in 2050. The key here is the wholesale electrifi cation of road
transport, with over 90% of passenger cars powered by
electricity by 2050. This reduces both oil consumption and
carbon emissions in the sector by over 75%.
residential transport

Electricity Generation
RES Take Off, Broad Fuel Mix Maintained Although the PowerChoices scenario sees electricity claim a greater
share of total energy consumption, as the energy-effi ciency drive
squeezes out less effi cient vectors, total EU net power generation
reaches a level not much greater than under Baseline, rising from
some 3,100 TWh in 2005 to around 4,800 TWh in 2050.
Among the various sources of power generation, RES-power
production increases dramatically, reaching 1,800 TWh in
2050 and becoming - despite the phase-out of support schemes
by 2030 - at 38% of total EU generation the greatest single
source of power. This compares with just over 15% in 2005.
Among RES technologies, windpower takes the lead, with on-
shore wind providing 32% of the RES contribution and off-shore
wind 24%. Hydropower remains stable throughout the period,
accounting for 20% of the RES total. Biomass-fi red electricity
also sees a substantial increase, although in relative terms its
share of RES power slightly decreases, while solar power also
comes into the picture.
While nuclear power generation increases somewhat under
PowerChoices - from around 950TWh in 2005 to 1300TWh in
2050 - its share of electricity actually falls from 31% to 27%.
Most new nuclear capacity is completed after 2025. Electricity
from solid fuels decreases until 2025, when the implementation
of CCS facilitates a revival. However, the level of solid fuel-fi red
generation in 2050, at 870TWh, does not show a signifi cant
increase on the 2005 fi gure of 850TWh and its share actually
falls from almost 28% to 18% over the period. Gas-fi red power
reaches its peak in 2040, followed by a slight decline as gas
and carbon prices rise and CCS also becomes necessary for
gas-fi red plants, stabilising at 750 TWh in 2050, 16% of total
EU electricity compared to 22% in 2005. Oil-fi red plants have
only a marginal role, with production progressively reducing
over time to reach just 1% of total power generation in 2050.
Meanwhile total power capacity increases 55% from 800GW in
2010 to over 1200GW in 2050. This net increase is almost solely
attributable to RES-technologies, which by 2050 take a 54%
share of EU installed power capacity, while thermal (32%) and
nuclear (14%) capacity increase slightly over the period.
Carbon Intensity Falls DramaticallyCarbon dioxide emissions from the EU power sector decrease
substantially under both Baseline and PowerChoices scenarios.
Baseline policy action reduces sector CO2 emissions by 66%,
still leaving 492 Mt CO2 emitted in 2050.
Power Choices sees CO2 emissions plummet by 90% versus
the 2005 level, from 1423 Mt to just 128 Mt in 2050.
What does ‘128 Mt CO2 emitted by 2050’ really mean?
Taking as an example a typical large-sized lignite-fired
plant of 1,250 MW capacity, with average emissions of
0.955 tonnes of CO2 per MWh electricity produced, and
assuminganaveragebase-loadoperationof7,500hours
peryear, theentireEuropeanpowersectorwouldemit in
2050 the equivalent 2009emissionsof roughlyonlyone
singlepowerplantforeverytwoEUmemberstates
Under the Baseline scenario, the power sector would still emit
84Kg/MWh in 2050, thus delivering a reduction of less than
75% on the 2005 level. Under Power Choices, the carbon-
intensity of power generation falls by almost 95%, from roughly
360kg/MWhin 2005 to 22kg/MWh in 2050.
Power Choices - Power Generation (TWh net)
Power Choices - Power Generation from RES in TWh
0
1000
2000
3000
4000
5000
2010 2020 2030 2040 2050
From RES (see details below)
From NuclearFrom GasFrom OilFrom Solids
0
200
400
600
800
1000
1200
1400
1600
1800
2000
2010 2020 2030 2040 2050
– Geothermal heat– Geothermal heat– Biomass-waste fired
Other renewables (tidal etc.)Solar
– Wind off-shore
– Wind on-shore
– Run of river
– Lakes
CO2 emissions (in Mt CO2) Thermal power plants
0
200
400
600
800
1000
1200
1400
1600
2010 2020 2030 2040 2050
Baseline Power Choices

Investmentand cost
Carbon intensity of the power sector (in t CO2/MWh net)
0.00
0.05
0.10
0.15
0.20
0.25
0.30
0.35
0.40
2010 2020 2030 2040 2050
Baseline Power Choices
Power Generation Investment (billion €)
0,0
500,0
1000,0
1500,0
2000,0
2500,0
Baseline Power Choices
2025-2050
2000-2025
Total Cost of Energy as % of GDP
8.00
9.00
10.00
11.00
12.00
13.00
2010 2020 2030 2040 2050Baseline Power Choices
Until 2025, the main drivers for carbon reductions are
energy effi ciency improvements and a fuel switch from
oil and coal to gas, while the increasing deployment of
renewable energy sources also plays an important role. As
from 2025, CO2 emissions decline quite rapidly, primarily
due to the deployment of CCS technologies, fi rst applied to
coal-fi red plants and then also to gas- and oil-fi red plants.
The two other main drivers for reducing CO2 emissions are,
once again, the higher penetration rate of RES, plus new
installed nuclear power capacity.
Investments rising from 2025 Total cumulative investment in power generation amounts
to some €2 trillion in 2005 money by 2050. During the 2000-
2025 period, PowerChoices investments total €803 billion,
quite comparable with the €791 billion under the Baseline
scenario. In the subsequent 25 years, from 2025 to 2050,
the required investments are much higher, totalling €1,156
billion, €157 billion more than Baseline.
Overall energy cost in the economy decreases long term The Power Choices scenario sees the overall cost of
energy in relation to GDP increasing from just under 11%
in 2010 to 12% by 2025, mirroring the pattern in Baseline.
However, in the long term, the cost of energy under Power
Choices falls back to just below 9% at 2050, much lower
than under Baseline, despite the less ambitious GHG
emissions reduction target in that scenario.
The initial rise in the cost of energy is due to high capital
outlay, in line with the carbon-neutrality goal, and one-
off investments in energy effi ciency – for example in
insulation equipment, which will also contribute to the
rise in energy costs.
Over time, return on investments in energy effi ciency,
the growing role of electricity, particularly in transport,
combined with demand-side management programmes,
will allow optimisation of the system by smoothing
out more expensive peaking electricity production and
reducing average costs. The rapid decrease in energy cost
as a percentage of GDP after 2025 also refl ects the overall
decrease in primary energy use.
Energy effi ciency
Q: How signifi cant is the impact of energy effi ciency?
A: Reducing EU greenhouse gas emissions by 75% by 2050, without the strong investment drive in energy effi ciency seen under the Power Choices scenario would push the total cost of energy up by an additional 2% of GDP.
?
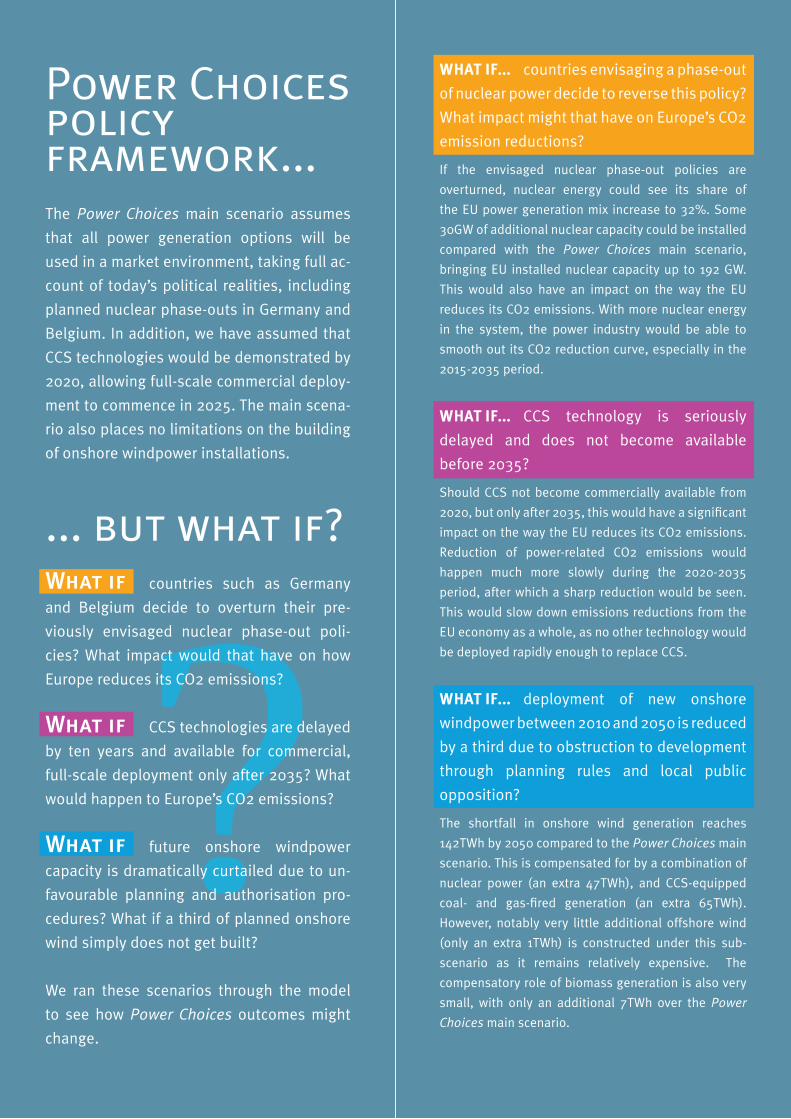
Power Choicespolicy framework...The Power Choices main scenario assumes
that all power generation options will be
used in a market environment, taking full ac-
count of today’s political realities, including
planned nuclear phase-outs in Germany and
Belgium. In addition, we have assumed that
CCS technologies would be demonstrated by
2020, allowing full-scale commercial deploy-
ment to commence in 2025. The main scena-
rio also places no limitations on the building
of onshore windpower installations.
... but what if?What if countries such as Germany
and Belgium decide to overturn their pre-
viously envisaged nuclear phase-out poli-
cies? What impact would that have on how
Europe reduces its CO2 emissions?
What if CCS technologies are delayed
by ten years and available for commercial,
full-scale deployment only after 2035? What
would happen to Europe’s CO2 emissions?
What if future onshore windpower
capacity is dramatically curtailed due to un-
favourable planning and authorisation pro-
cedures? What if a third of planned onshore
wind simply does not get built?
We ran these scenarios through the model
to see how Power Choices outcomes might
change.
WHAT IF... countries envisaging a phase-out
of nuclear power decide to reverse this policy?
What impact might that have on Europe’s CO2
emission reductions?
If the envisaged nuclear phase-out policies are
overturned, nuclear energy could see its share of
the EU power generation mix increase to 32%. Some
30GW of additional nuclear capacity could be installed
compared with the Power Choices main scenario,
bringing EU installed nuclear capacity up to 192 GW.
This would also have an impact on the way the EU
reduces its CO2 emissions. With more nuclear energy
in the system, the power industry would be able to
smooth out its CO2 reduction curve, especially in the
2015-2035 period.
WHAT IF... CCS technology is seriously
delayed and does not become available
before 2035?
Should CCS not become commercially available from
2020, but only after 2035, this would have a significant
impact on the way the EU reduces its CO2 emissions.
Reduction of power-related CO2 emissions would
happen much more slowly during the 2020-2035
period, after which a sharp reduction would be seen.
This would slow down emissions reductions from the
EU economy as a whole, as no other technology would
be deployed rapidly enough to replace CCS.
WHAT IF... deployment of new onshore
windpower between 2010 and 2050 is reduced
by a third due to obstruction to development
through planning rules and local public
opposition?
The shortfall in onshore wind generation reaches
142TWh by 2050 compared to the PowerChoices main
scenario. This is compensated for by a combination of
nuclear power (an extra 47TWh), and CCS-equipped
coal- and gas-fired generation (an extra 65TWh).
However, notably very little additional offshore wind
(only an extra 1TWh) is constructed under this sub-
scenario as it remains relatively expensive. The
compensatory role of biomass generation is also very
small, with only an additional 7TWh over the Power
Choices main scenario.

The Union of the Electricity Industry-EURELECTRIC
is the sector association representing the electricity
industry at pan-European level, plus its affiliates
and associates on several other continents.
EURELECTRIC’s mission is to contribute to the
development and competitiveness of the electricity
industry and to promote the role of electricity in the
advancement of society.
As a centre of strategic expertise, EURELECTRIC
identifies the common interests of its Members
and, through research into the marketplace,
technologies, legislation, etc, assists them in
formulating common solutions to be implemented
and in coordinating and carrying out the necessary
action. It also acts in liaison with other international
associations and organisations, recognising their
specific missions and responsibilities.
In the European Union, EURELECTRIC represents
the electricity industry in public affairs, in particular
in relation to the EU legislative institutions, in
order to promote the interests of its Members at
a political level.
The electricity sector comprises more than 3,500
companies, serving over 200 million billable
customers and employing some 750,000people.
These companies have an installed power capacity
totalling 900 Gigawatts, generating some 3,600
Terawatt-hours of electricity annually.
This electricity is transmitted and distributed over a
total surface area of 5.4millionkm2to a population
of 570millionpeople.
Total annual industry turnover in Member
countries is some €300 billion, and annual
investment in plant and infrastructure totals more
than €45billion.
speaking on behalf of an essential european industry
Union of the Electricity Industry - EURELECTRIC aisblBoulevard de l’Impératrice, 66 - boite 2B - 1000 BrusselsBelgiumTel: + 32 2 515 10 00 ; Fax: + 32 2 515 10 10
www.eurelectric.org Pho
to: ©
Fer
nan
do P
alm
a &
Set
h Jo
el, G
etty
imag
es /
Des
ign
: ww
w.g
ener
is.b
e


![[John O'Meara] Charter of Christendom the Signifi(Bookos.org)](https://img.pdfslide.us/doc/110x75/55cf9445550346f57ba0d1df/john-omeara-charter-of-christendom-the-signifibookosorg.jpg)


![Shossler Eurelectric(Compatibility Mode]](https://img.pdfslide.us/doc/110x75/577ce0b31a28ab9e78b3e149/shossler-eurelectriccompatibility-mode.jpg)
