Embed Size (px)
Citation preview

Poverty Trends and Links to Demographics and Economic Change
Frank Wen, Manager
Research & Analysis
Southern California Association of Governments
Presentation Topics
Poverty “War on Poverty”, “Great Society” Poverty rates—Census statistics 50 Years later, progress, development Observations about war on poverty
Demographics of poverty• Who most likely will be in poverty• Opinions on causes of poverty
Demographic/economic Trends and implications

3
Poverty is the parent of revolution and crime Poverty is the worst form of violence Poverty is costly to the poor and society
• Ugly bi‐products:Ignorance, disease, delinquency, crime, irresponsibility, immorality
Child poverty• Powerless victims• Children antisocial behavior
Women and poverty• Feminization of poverty
Poverty and the environment Impact of poverty on health
Unpleasant Faces/Consequences of Poverty

4
“We have declared unconditional war on poverty.
Our objective is total victory. . . . I believe that thirty years from now Americans will look back upon these 1960s as the time of the great AmericanBreakthrough . . . toward the victory of prosperity over poverty.”— Lyndon B. Johnson, My Hope for America (1964)
President Johnson Declared War on Poverty

5
U.S. President Johnson's first ever public reference to the "Great Society" took place during a speech to students on May 7, 1964, at Ohio University in Athens:
“And with your courage and with your compassion and your desire, we will build a Great Society. It is a Society where no child will go unfed, and no youngster will go unschooled.”
He later formally presented his specific goals for the Great Society in another speech at the University of Michigan in Ann Arbor on May 22, 1964:
“We are going to assemble the best thought and broadest knowledge from all over the world to find these answers. I intend to establish working groups to prepare a series of conferences and meetings—on the cities, on natural beauty, on the quality of education, and on other emerging challenges. From these studies, we will begin to set our course toward the Great Society.”
Great Society

6
Great Society: Wars of nations are fought to change maps. But wars of poverty are
fought to map changeThe Great Society—A set of programs launched in 1964 try to designed to eliminate 1. Poverty 2. Racial injusticeMajor initiatives:• The Economic Opportunity Act• Food Stamp Act• Civil Rights Act• Social Security Act• Elementary and Second Education Act• Higher Education Act• Immigration and Nationality Services Act

7
SCAG Conferences With Focus on Prosperity & Poverty
Poverty has no causes. Only prosperity has causes.”

8
The First Census Measurement of PovertyCPS Report, Series P-60, No. 54, May 31, 1968

Bureau of the Census Measurement of Poverty
1973: lowest 11.1%
Supplemental Poverty Measure
(SPM)
2000: 3rd lowest 11.3%
10
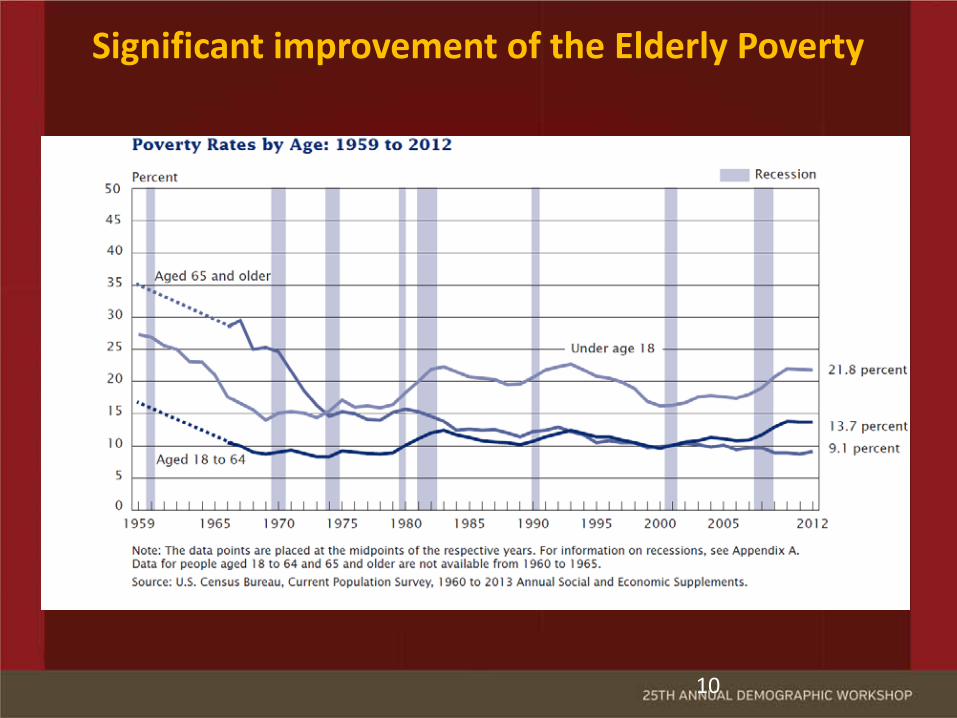
Significant improvement of the Elderly Poverty

11
The War on Poverty: 50 Years Later
1. Family2. Work‐Labor force participation rate3. Education4. Federal programs and incentives for
work5. War on poverty is expensive
1. Poverty has improved significantly since 1967 use SPM
2. Government programs do help

12
Poverty War on 15% Poverty Rate

Presentation Topics
Poverty Poverty rates—Census statistics War on Poverty and Great Society 50 Years later, progress, development Observations about war on poverty
Demographics of povertyWho most likely will be in povertyOpinions on causes of poverty
Demographic/economic Trends and implications

14.0 12.9
17.9
7.9
10.9
32.2
41.3
15.9
21.719.7
18.4
0.0
5.0
10.0
15.0
20.0
25.0
30.0
35.0
40.0
45.0
All People In families . . With relatedchildren under
18 years
In married‐couple families
. . With relatedchildren under
18 years
In families with afemale
householder, nohusband present
. . With relatedchildren under
18 years
In families with amale
householder, nowife present
. . With relatedchildren under
18 years
Unrelatedindividuals
. . In non‐familyhouseholds
Poverty Levels by Family Status
Source: Dynamics of Economic Well‐Being: Poverty 2009‐2011 (P70‐137)

Poverty: Education, Labor Force and Marital Conditions
15
14.0
16.4
4.5
14.3
30.2
17.5
26.6
14.5
7.66.6
17.3 17.7
0.0
5.0
10.0
15.0
20.0
25.0
30.0
35.0
All Employedabsent from
work
Employedfull‐time
Employedpart‐time
Unemployed Not in laborforce
Less than 4years of high
school
High schoolgraduate, no
college
One of moreyears ofcollege
Married Separated,divorced, orwidowed
Nevermarried
Source: Dynamics of Economic Well‐Being: Poverty 2009‐2011 (P70‐137)

Poverty: Ethnicity, Age, Gender, Household Size & Disability
16
14.0
11.9
9.3
26.3
10.8
24.2
12.0
21.2
12.7
6.8
12.8
15.2
22.9
10.9
19.7
8.5
11.9 11.8
18.0
21.8
0.0
5.0
10.0
15.0
20.0
25.0
30.0
All
W NHW
B A H NH
<18
18 to 64 years
65 & Above
M F Work disability
No w
ork disability
1 2 3 4 5 6&+
Source: Dynamics of Economic Well‐Being: Poverty 2009‐2011 (P70‐137)

17
0%
5%
10%
15%
20%
25%
30%
35%
1993 1994 1995 1996 1997 1998 1999 2000 2001 2002 2003 2004 2005 2006 2007 2008 2009 2010 2011 2012
Foreign born, non‐citizen Foreign born, naturalized Native born
Poverty: Native‐born Compared with Immigrants

18
Why Poverty? Some Opinions
0%
5%
10%
15%
20%
25%
30%
The Wefaresystem
Lack ofopportunities
Educationopportunities
Familybreakdown
Work ethics Lackgovernmentfunding
Drugs Discriminations
Source: NBC News/WSJ Poll, 6/2013

19
Top 5 Solutions to Cut Poverty Proposed by President Obama in State of the Union Address
1. Creating good jobs2. Raising wages3. Training the next generation of workers4. Investing in children5. Strengthening families
20
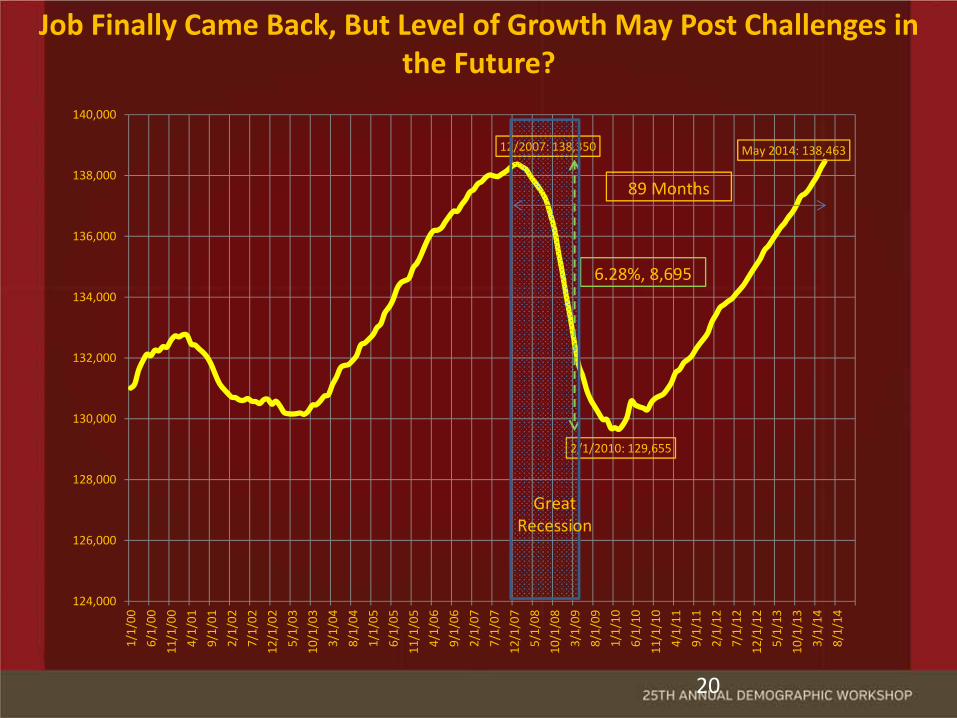
Job Finally Came Back, But Level of Growth May Post Challenges in the Future?
12/2007: 138,350
2/1/2010: 129,655
May 2014: 138,463
124,000
126,000
128,000
130,000
132,000
134,000
136,000
138,000
140,0001/1/00
6/1/00
11/1/00
4/1/01
9/1/01
2/1/02
7/1/02
12/1/02
5/1/03
10/1/03
3/1/04
8/1/04
1/1/05
6/1/05
11/1/05
4/1/06
9/1/06
2/1/07
7/1/07
12/1/07
5/1/08
10/1/08
3/1/09
8/1/09
1/1/10
6/1/10
11/1/10
4/1/11
9/1/11
2/1/12
7/1/12
12/1/12
5/1/13
10/1/13
3/1/14
8/1/14
6.28%, 8,695
89 Months
Great Recession
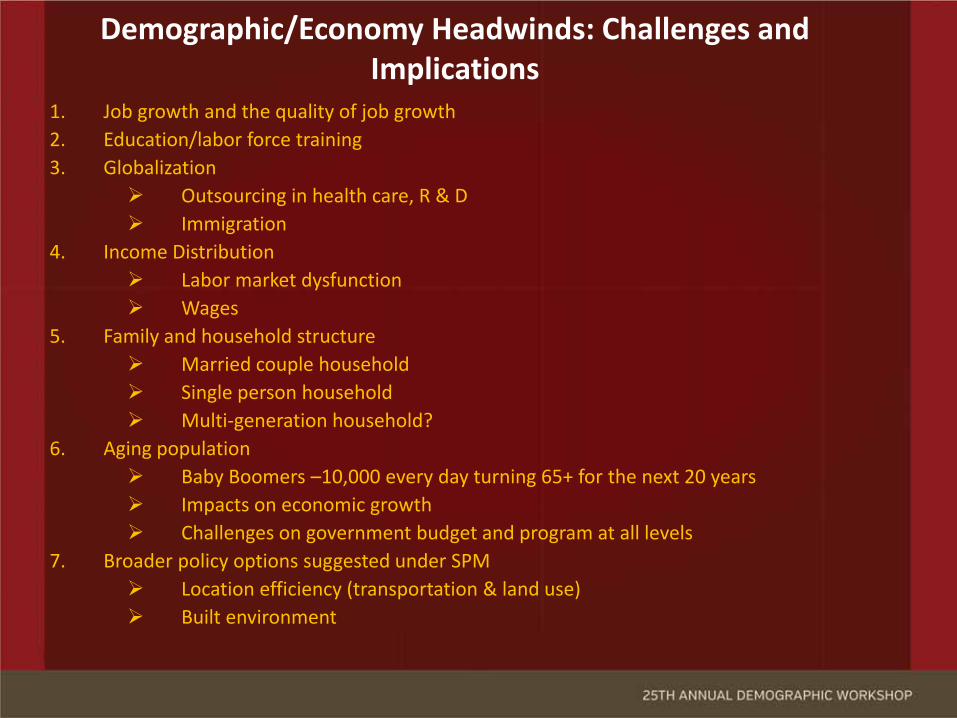
Demographic/Economy Headwinds: Challenges and Implications
1. Job growth and the quality of job growth2. Education/labor force training3. Globalization
Outsourcing in health care, R & D Immigration
4. Income Distribution Labor market dysfunction Wages
5. Family and household structure Married couple household Single person household Multi‐generation household?
6. Aging population Baby Boomers –10,000 every day turning 65+ for the next 20 years Impacts on economic growth Challenges on government budget and program at all levels
7. Broader policy options suggested under SPM Location efficiency (transportation & land use) Built environment

WAR ON POVERTY

24
The Growth of Economy is not Equitably Shared!?

Changes in U.S. Employment from Start of the Recession