Embed Size (px)
Citation preview
Poverty on the Cheap: Estimating Poverty Maps UsingAggregated Mobile Communication Networks
Christopher Smith-ClarkeICRI: CitiesLondon, UK
Afra MashhadiBell Labs, Alcatel-LucentDublin, Rep. of Irelandafra.mashhadi@alcatel-
lucent.com
Licia CapraUniversity College London
London, [email protected]
ABSTRACTGovernments and other organisations often rely on data col-lected by household surveys and censuses to identity areas inmost need of regeneration and development projects. How-ever, due to the high cost associated with the data collec-tion process, many developing countries conduct such sur-veys very infrequently and include only a rather small sampleof the population, thus failing to accurately capture the cur-rent socio-economic status of the country’s population. Inthis paper, we address this problem by means of a method-ology that relies on an alternative source of data from whichto derive up to date poverty indicators, at a very fine level ofspatio-temporal granularity. Taking two developing countriesas examples, we show how to analyse the aggregated call de-tail records of mobile phone subscribers and extract featuresthat are strongly correlated with poverty indexes currently de-rived from census data.
Author KeywordsICT4D; Data4D; Call detail records; Socio-economics
ACM Classification KeywordsH.1.2 User/Machine Systems: Human information process-ing; K.4.3 Computer and Society: Organizational Impacts
INTRODUCTIONHousehold surveys and censuses, periodically conducted byNational Statistical Institutes and the like, collect informationdescribing the social and economic well being of a nation, aswell as the relative prosperity of its different regions. Suchdata is then used by agencies and governments to identifythose areas in most need of intervention, for example, in theform of policies and programs that aim to improve the plightof their citizens. Interventions can take many forms, from na-tional or regional policy, to local regeneration projects. Toprovide the most value socio-economic data needs to be upto date and it ought to be possible to disaggregate the data ateach of these levels of granularity, and in between. However,
Permission to make digital or hard copies of all or part of this work for personal orclassroom use is granted without fee provided that copies are not made or distributedfor profit or commercial advantage and that copies bear this notice and the full cita-tion on the first page. Copyrights for components of this work owned by others thanACM must be honored. Abstracting with credit is permitted. To copy otherwise, or re-publish, to post on servers or to redistribute to lists, requires prior specific permissionand/or a fee. Request permissions from [email protected]’14, April 26–May 1, 2014, Toronto, ON, Canada.Copyright c© 2014 978-1-4503-2473-1/14/04$15.00.http://dx.doi.org/10.1145/2556288.2557358
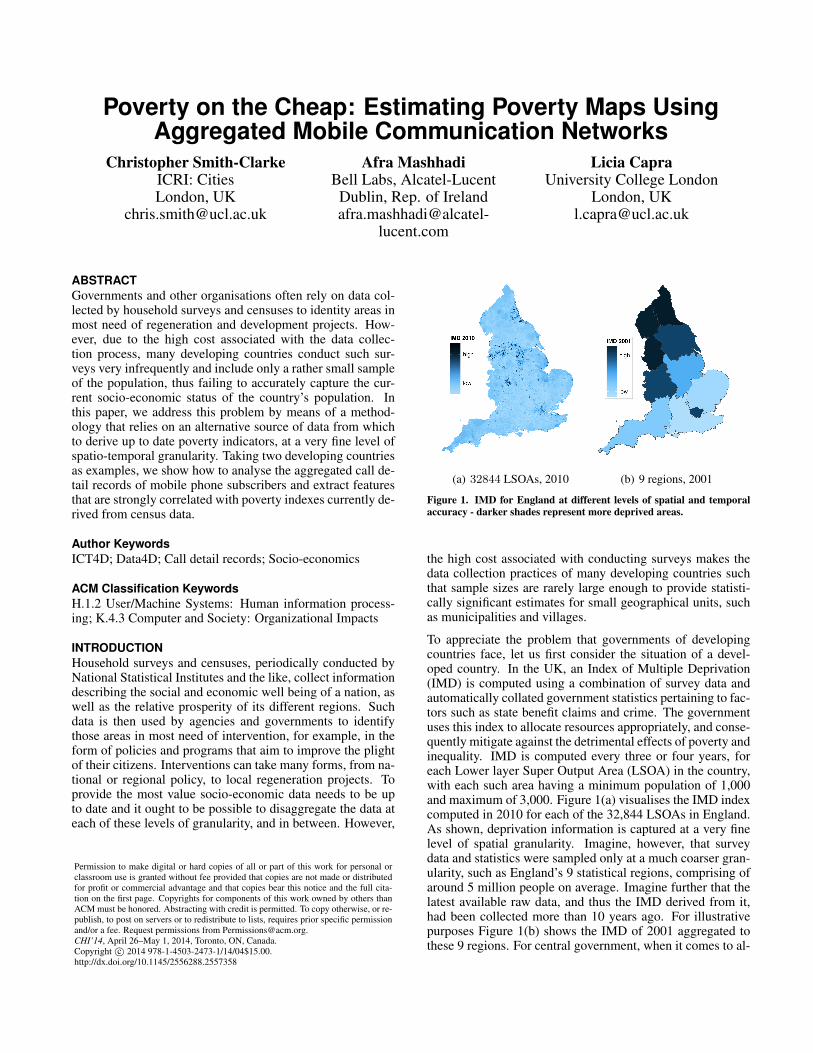
(a) 32844 LSOAs, 2010 (b) 9 regions, 2001
Figure 1. IMD for England at different levels of spatial and temporalaccuracy - darker shades represent more deprived areas.
the high cost associated with conducting surveys makes thedata collection practices of many developing countries suchthat sample sizes are rarely large enough to provide statisti-cally significant estimates for small geographical units, suchas municipalities and villages.
To appreciate the problem that governments of developingcountries face, let us first consider the situation of a devel-oped country. In the UK, an Index of Multiple Deprivation(IMD) is computed using a combination of survey data andautomatically collated government statistics pertaining to fac-tors such as state benefit claims and crime. The governmentuses this index to allocate resources appropriately, and conse-quently mitigate against the detrimental effects of poverty andinequality. IMD is computed every three or four years, foreach Lower layer Super Output Area (LSOA) in the country,with each such area having a minimum population of 1,000and maximum of 3,000. Figure 1(a) visualises the IMD indexcomputed in 2010 for each of the 32,844 LSOAs in England.As shown, deprivation information is captured at a very finelevel of spatial granularity. Imagine, however, that surveydata and statistics were sampled only at a much coarser gran-ularity, such as England’s 9 statistical regions, comprising ofaround 5 million people on average. Imagine further that thelatest available raw data, and thus the IMD derived from it,had been collected more than 10 years ago. For illustrativepurposes Figure 1(b) shows the IMD of 2001 aggregated tothese 9 regions. For central government, when it comes to al-

locating resources to the most needy areas, such informationprovides little basis for any kind of policy or program target-ing beyond this level. In many parts of the world this is thebest that can be achieved, and in others the situation is evenworse, with no estimates of living standards available at all.
In this paper we present work towards alleviating this prob-lem. We show how, through analysis of patterns inherent inmobile phone users’ collective behaviour, governments andNGOs can automatically compute proxy poverty indicatorsin a low cost and timely manner from unobtrusively collectedcall network data. Our methodology takes as input call de-tail records (CDR) aggregated to the cell tower level, whichare collected by mobile phone operators primarily for billingpurposes. Starting from this raw data, we describe featuresthat can be extracted and used as proxy indicators of povertylevels. Taking two developing areas as examples, we quanti-tatively demonstrate the strong correlation these new featureshave with respect to poverty indicators derived from costlycensus data. Our results benefit the intended users (e.g., poli-cymakers and NGOs) by providing interpretable results to actupon, in contrast to the black-box machine learning approachof previous work. We enable disaggregation at multiple levelsof granularity thereby potentially influencing policy imple-mented at different levels, from neighbourhood to region. Weoffer an increased level of protection of mobile phone users’privacy by aggregating CDRs prior to any analysis, thus re-moving a barrier to wider adoption of this approach. Finally,we make significant progress towards generalisation by pre-senting results from two different developing regions. Allthat is required is for telecommunication providers to shareanonymised, aggregated call detail records on a controlled ba-sis. There are early signs of this already happening (e.g., D4DChallenge1), with researchers also starting to develop frame-works that would encourage even more providers to embracethis initiative [22]. We conclude the paper with a discussionof the practical implications of this methodology, its knownlimitations, and the next steps required to improve it further.
RELATED WORKResearch has been active over the last decade, within theHCI community and elsewhere, to understand the relationbetween, on the one hand, factors of human well-being andsocio-economics, and on the other, technologically mediatedsocial networks, such as online services like Facebook andTwitter, and social relations represented in telecommunica-tions networks. For example, Burke et al. [6] examined therelationship between activity on Facebook and social capi-tal and loneliness, and found that engagement with Facebookcorrelates positively with overall well-being. Quercia et al.found that deprivation in London, UK, varies geographicallywith topics of tweets discussed in different areas [24], andalso that sentiment of tweets [23] correlates with deprivation.Eagle et al. [8] measured communication diversity from fixedline phone call records in England, and found that higher di-versity (i.e., the more evenly dispersed a person’s commu-nication between people and places) correlates with socio-economic deprivation, aggregated to telephone exchange ar-
1http://www.d4d.orange.com/home
eas. Blumemstock [5] looked more closely at the relation be-tween users’ demographics, collected through personal inter-views, and their mobile phone usage from a sample of com-pany employees in Rwanda; they found that gender and socialstatus had a direct correlation with the volume of their call ac-tivity.
The results of the afore mentioned works clearly have thepotential to provide predictions of factors of well-being andsocio-economic status. Indeed, Kramer et al. [18] found thatsentiment of Facebook user content correlates with a person’shappiness, and used this finding to develop a measurementof ‘Facebook Gross National Happiness’. However, a fol-lowup study presented contradictory results, suggesting in-stead that expressed sentiment may play a role in regulat-ing a Facebook user’s mood rather than directly reflect it.Gutierrez et al. [14] hypothesised that mobile top-up be-haviour reflects the wealth of the phone user, with poorerpeople likely to top-up their phone credit in small amountsfairly frequently, whereas wealthier people likely to top-upinfrequently in larger amounts. They built a model basedon this hypothesis, applied it to individual call records fromCote d’Ivoire (not the same dataset as studied in this paper),and derived a proxy wealth indicator from it. To date, thetop-up model has not been validated against any establishedwealth indicator, therefore only speculative conclusions canbe drawn. Furthermore, knowledge of individuals’ financialdata is required by the model, raising serious privacy con-cerns.
Moving away from exploitation of human interaction, otherattempts to develop proxies for socio-economic factors in-clude the use of satellite imagery to remotely identify thevisual signs of economic development. The total area lit byNight Time Light (NTL) measured from satellite imagery wasshown to correlate with a country’s Gross Domestic Product[10]; this was later shown to hold for other countries too [7,30, 9]. However, the geographic scale at which such method-ology can be applied is rather coarse. Furthermore, output ofa recent ‘Datadive’2 that looked at the relationship betweenNTL and small area poverty levels in Bangladesh suggeststhat the penetration of electrical lighting is approaching satu-ration, consequently removing the signal previously present.3
Work that directly explores the potetial for CDRs to provideestimates of socio-economic factors includes that of Soto etal. [29], who defined a comprehensive list of 279 featuresthat could be extracted from CDRs of a South-American city,and measured the extent to which each of them correlateswith known socio-economic levels (SEL) in that city. Themost significant features were then used in a variety of ma-chine learning techniques, and shown to achieve up to 80%accuracy when classifying areas according to three classes ofSEL. The method developed in [29] was further investigatedby Frias-Martinez et al. [13, 12], who then implemented it ina GUI-based system, designed to reduce the number of census
2http://blogs.worldbank.org/opendata/scenes-dc-big-data-dive-final-report3https://hackpad.com/Predicting-Small-Scale-Poverty-Measures-from-Night-Illumination-f6RoPTY6IWB

areas that needed to be manually surveyed, by using surveyeddata as training labels, and using the model to estimate the re-mainder [11]. This time, the highest accuracy quoted is 76%for a 3-class problem and 63% for a 6-class problem. Thisapproach has the potential to provide savings in the cost ofsurveying, but also suffers from a number of drawbacks: aswith [14], many of the features used in these works requiredetailed knowledge of individuals’ call behaviour, thus rais-ing privacy concerns and, consequently, limiting the possibil-ity of obtaining such data from telecommunication providersin the first place. Even if anonymised individual data weremade available, a methodology that includes so many fea-tures, embedded in a complex machine learning, ‘black-box’,predictor, would be difficult to interpret by nonexperts andwould thus require a significant level of trust from policymak-ers and others who might act upon the results. Arguably, forsuch predictions to play a role in decision making processes,it is vital that governments can understand how the estimatesare reached. A final limitation is that this approach still re-quires a significant financial investment, with up to two thirdsof census areas needing to be surveyed to provide trainingexamples.
With the aim to develop a practical methodology to derivepoverty indicators for developing countries, at a fine levelof spatio-temporal granularity and at very low cost, we keptthese two requirements in mind: First, the source data ourmethodology relies upon must not infringe users’ privacy;at such, rather than using CDRs at an individual user level,we only look at CDRs aggregated by the cell towers throughwhich the calls are routed. Second, the features we extractfrom raw data ought to be relatively easy to interpret, whichmay in turn increase the confidence with which the resultingestimates can be acted upon.
DATASET DESCRIPTIONIn order to develop a practical methodology that governmentsof developing countries can use to accurately infer poverty,we require two kinds of datasets: i) a dataset that is represen-tative of the country’s population, that is automatically col-lected so to contain always up to date information, and that isavailable at a fine level of geographical granularity; we willuse this dataset to automatically extract features that signalspoverty. ii) A ground truth dataset of geographically disag-gregated poverty (or wealth indicators), to be used for valida-tion purposes. For the former, we consider mobile call detailrecords obtained from local network operators. Primarily forbilling purposes, mobile telecoms providers record details ofeach call and text message made over their network, includingthe time, duration, caller and callee IDs, and the base stationtowers (or ‘cell towers’) through which the call or text wasrouted. These call detail records thus provide a rich source ofdata, and given the high penetration rate of mobile technologyin developing countries, they also offer a relatively unbiasedpicture in terms of demographics. For the latter, we use coun-try specific socio-economic datasets, publicly available andpresently derived from surveys and censuses.
Call Detail RecordsWe obtained two datasets of anonymised, aggregated voicecalls: the first contains calls between 5 million Orange cus-tomers from Cote d’Ivoire over the period beginning Decem-ber 1st 2011 until April 28th 2012 (referred to as Set 1 inthe D4D Challenge [4]); the second contains call records ofaround 928, 000 customers of a network operator from an-other developing region, which we will refer to as Region B,spanning a period of 6 weeks in early 2012 (specific detailsabout the location and time are omitted in order to preservethe anonymity of the network operator). The datasets containthe total volume (number of calls) and duration of calls be-tween each pair of cell towers over the entire period. Notealso an important difference in how data is aggregated in ourwork and in [11, 12, 28] is that the aggregation performedin previous work is an average of properties of individuals.That is, individual data is used to infer home locations andto measure properties of individuals’ behaviour. In contrast,our data consists of total traffic between cell towers so no in-dividual data is ever accessed. Features we derive are of theaggregated network and not of individuals which are then ag-gregated. Mobile phone penetration is high enough in manydeveloping countries to make such datasets sufficiently rep-resentative of the population.4 Indeed, both network oper-ators hold a dominant position in their respective markets,with Orange having 48% market share in Ivory Coast5 andthe anonymous operator being the leading provider of mobileservices in Region B. Table 1 provides summary statistics ofeach dataset.
Cote d’Ivoire Region BTotal Number of Calls 471 million 40 millionTotal Call Duration (mins) 960 million 170 millionTime Period 20 weeks 6 weeksPopulation 20 million 58 millionTotal Area (hectares) 33 million 19 million
Table 1. Summary properties of the two CDR datasets.
To provide some geographical context, Figures 2(a) and 2(b)show the locations of cell towers in relation to the regionalboundaries of Cote d’Ivoire and Region B respectively. Theinsets of these figures show the dense concentration of celltowers in and around the largest cities of each region. Theeconomic capital of Cote d’Ivoire, Abidjan, has a signifi-cantly higher population density than the rest of the countryand is where most economic activity and trading takes place.A similar observation can be made of Region B shown insetin 2(b).
Socio-ecomonic dataIn order to validate the ability of our methodology to ac-curately estimate economic poverty, as currently defined bygovernments and international organisations, we use centrallymanaged datasets as ground-truth of poverty levels. In partic-ular, for Cote d’Ivoire, we use poverty rate estimates providedby the International Monetary Fund, dating from 2008 [15].4http://www.itu.int/en/ITU-D/Statistics/Documents/facts/ICTFactsFigures2013.pdf5http://www.orange.com/en/group/global-footprint/countries/Group-s-activities-in-Ivory-Coast
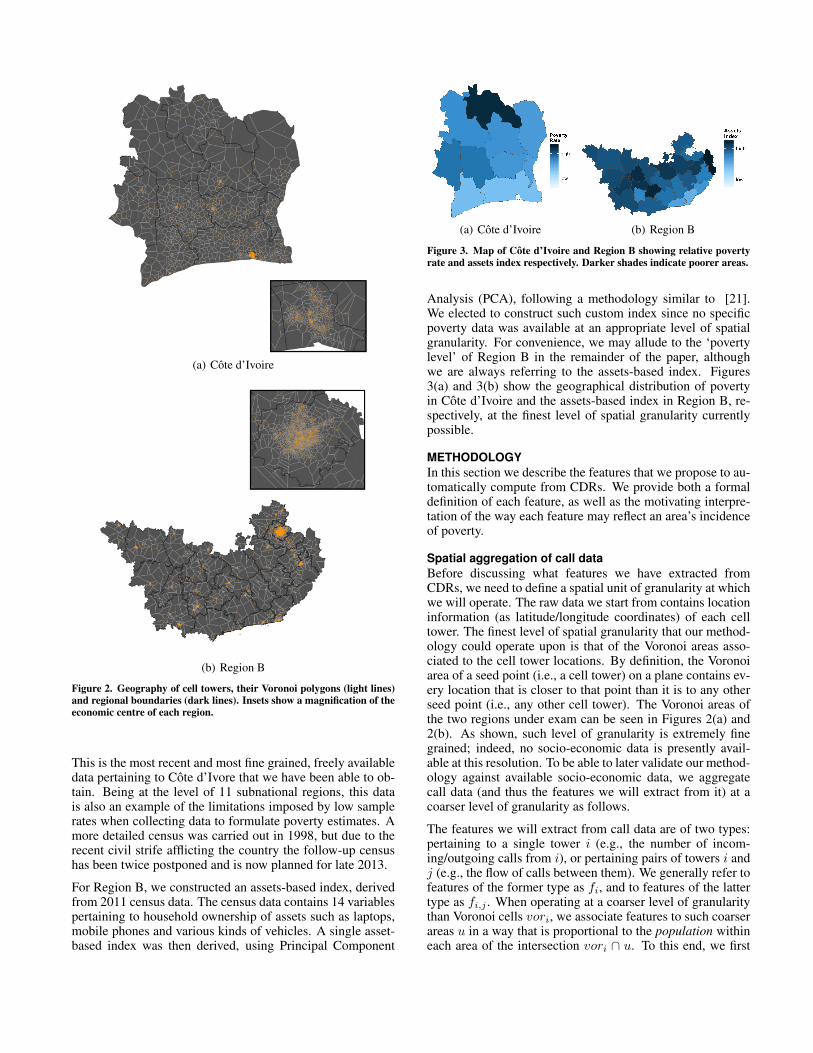
(a) Cote d’Ivoire
(b) Region B
Figure 2. Geography of cell towers, their Voronoi polygons (light lines)and regional boundaries (dark lines). Insets show a magnification of theeconomic centre of each region.
This is the most recent and most fine grained, freely availabledata pertaining to Cote d’Ivore that we have been able to ob-tain. Being at the level of 11 subnational regions, this datais also an example of the limitations imposed by low samplerates when collecting data to formulate poverty estimates. Amore detailed census was carried out in 1998, but due to therecent civil strife afflicting the country the follow-up censushas been twice postponed and is now planned for late 2013.
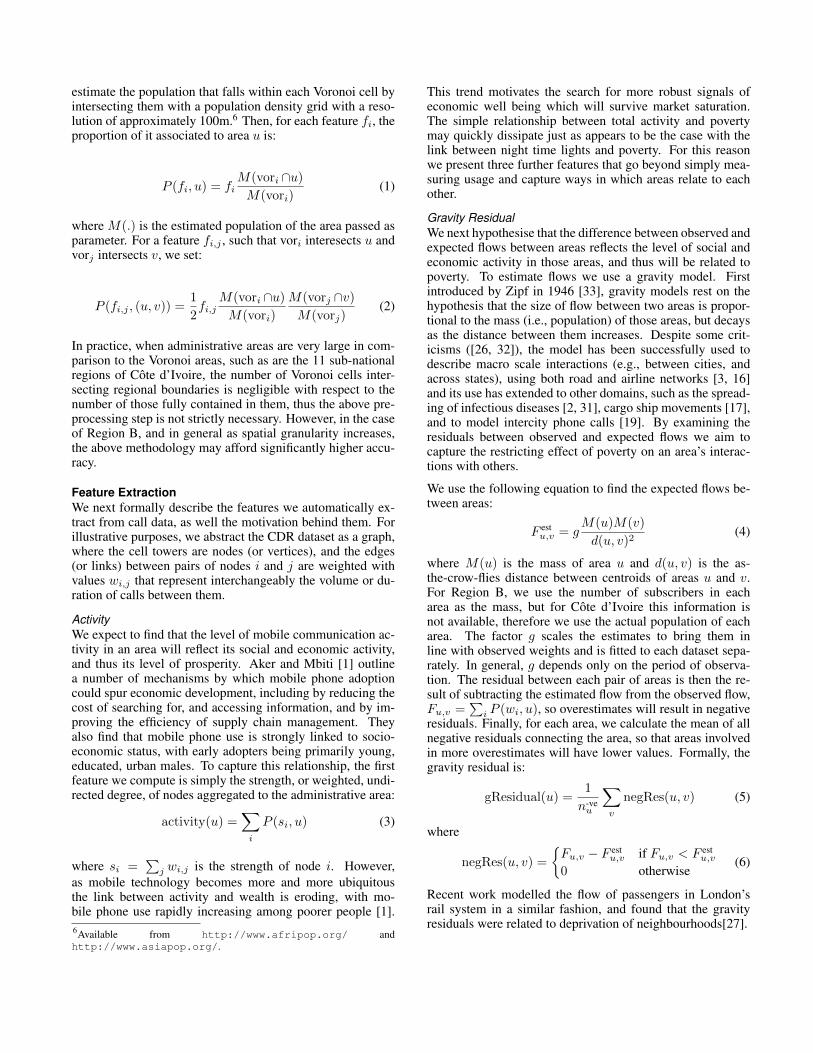
For Region B, we constructed an assets-based index, derivedfrom 2011 census data. The census data contains 14 variablespertaining to household ownership of assets such as laptops,mobile phones and various kinds of vehicles. A single asset-based index was then derived, using Principal Component
(a) Cote d’Ivoire (b) Region B
Figure 3. Map of Cote d’Ivoire and Region B showing relative povertyrate and assets index respectively. Darker shades indicate poorer areas.
Analysis (PCA), following a methodology similar to [21].We elected to construct such custom index since no specificpoverty data was available at an appropriate level of spatialgranularity. For convenience, we may allude to the ‘povertylevel’ of Region B in the remainder of the paper, althoughwe are always referring to the assets-based index. Figures3(a) and 3(b) show the geographical distribution of povertyin Cote d’Ivoire and the assets-based index in Region B, re-spectively, at the finest level of spatial granularity currentlypossible.
METHODOLOGYIn this section we describe the features that we propose to au-tomatically compute from CDRs. We provide both a formaldefinition of each feature, as well as the motivating interpre-tation of the way each feature may reflect an area’s incidenceof poverty.
Spatial aggregation of call dataBefore discussing what features we have extracted fromCDRs, we need to define a spatial unit of granularity at whichwe will operate. The raw data we start from contains locationinformation (as latitude/longitude coordinates) of each celltower. The finest level of spatial granularity that our method-ology could operate upon is that of the Voronoi areas asso-ciated to the cell tower locations. By definition, the Voronoiarea of a seed point (i.e., a cell tower) on a plane contains ev-ery location that is closer to that point than it is to any otherseed point (i.e., any other cell tower). The Voronoi areas ofthe two regions under exam can be seen in Figures 2(a) and2(b). As shown, such level of granularity is extremely finegrained; indeed, no socio-economic data is presently avail-able at this resolution. To be able to later validate our method-ology against available socio-economic data, we aggregatecall data (and thus the features we will extract from it) at acoarser level of granularity as follows.
The features we will extract from call data are of two types:pertaining to a single tower i (e.g., the number of incom-ing/outgoing calls from i), or pertaining pairs of towers i andj (e.g., the flow of calls between them). We generally refer tofeatures of the former type as fi, and to features of the lattertype as fi,j . When operating at a coarser level of granularitythan Voronoi cells vori, we associate features to such coarserareas u in a way that is proportional to the population withineach area of the intersection vori ∩ u. To this end, we first
estimate the population that falls within each Voronoi cell byintersecting them with a population density grid with a reso-lution of approximately 100m.6 Then, for each feature fi, theproportion of it associated to area u is:
P (fi, u) = fiM(vori ∩u)M(vori)
(1)
where M(.) is the estimated population of the area passed asparameter. For a feature fi,j , such that vori interesects u andvorj intersects v, we set:
P (fi,j , (u, v)) =1
2fi,j
M(vori ∩u)M(vori)
M(vorj ∩v)M(vorj)
(2)
In practice, when administrative areas are very large in com-parison to the Voronoi areas, such as are the 11 sub-nationalregions of Cote d’Ivoire, the number of Voronoi cells inter-secting regional boundaries is negligible with respect to thenumber of those fully contained in them, thus the above pre-processing step is not strictly necessary. However, in the caseof Region B, and in general as spatial granularity increases,the above methodology may afford significantly higher accu-racy.
Feature ExtractionWe next formally describe the features we automatically ex-tract from call data, as well the motivation behind them. Forillustrative purposes, we abstract the CDR dataset as a graph,where the cell towers are nodes (or vertices), and the edges(or links) between pairs of nodes i and j are weighted withvalues wi,j that represent interchangeably the volume or du-ration of calls between them.
ActivityWe expect to find that the level of mobile communication ac-tivity in an area will reflect its social and economic activity,and thus its level of prosperity. Aker and Mbiti [1] outlinea number of mechanisms by which mobile phone adoptioncould spur economic development, including by reducing thecost of searching for, and accessing information, and by im-proving the efficiency of supply chain management. Theyalso find that mobile phone use is strongly linked to socio-economic status, with early adopters being primarily young,educated, urban males. To capture this relationship, the firstfeature we compute is simply the strength, or weighted, undi-rected degree, of nodes aggregated to the administrative area:
activity(u) =∑i
P (si, u) (3)
where si =∑
j wi,j is the strength of node i. However,as mobile technology becomes more and more ubiquitousthe link between activity and wealth is eroding, with mo-bile phone use rapidly increasing among poorer people [1].6Available from http://www.afripop.org/ andhttp://www.asiapop.org/.
This trend motivates the search for more robust signals ofeconomic well being which will survive market saturation.The simple relationship between total activity and povertymay quickly dissipate just as appears to be the case with thelink between night time lights and poverty. For this reasonwe present three further features that go beyond simply mea-suring usage and capture ways in which areas relate to eachother.
Gravity ResidualWe next hypothesise that the difference between observed andexpected flows between areas reflects the level of social andeconomic activity in those areas, and thus will be related topoverty. To estimate flows we use a gravity model. Firstintroduced by Zipf in 1946 [33], gravity models rest on thehypothesis that the size of flow between two areas is propor-tional to the mass (i.e., population) of those areas, but decaysas the distance between them increases. Despite some crit-icisms ([26, 32]), the model has been successfully used todescribe macro scale interactions (e.g., between cities, andacross states), using both road and airline networks [3, 16]and its use has extended to other domains, such as the spread-ing of infectious diseases [2, 31], cargo ship movements [17],and to model intercity phone calls [19]. By examining theresiduals between observed and expected flows we aim tocapture the restricting effect of poverty on an area’s interac-tions with others.
We use the following equation to find the expected flows be-tween areas:
F estu,v = g
M(u)M(v)
d(u, v)2(4)
where M(u) is the mass of area u and d(u, v) is the as-the-crow-flies distance between centroids of areas u and v.For Region B, we use the number of subscribers in eacharea as the mass, but for Cote d’Ivoire this information isnot available, therefore we use the actual population of eacharea. The factor g scales the estimates to bring them inline with observed weights and is fitted to each dataset sepa-rately. In general, g depends only on the period of observa-tion. The residual between each pair of areas is then the re-sult of subtracting the estimated flow from the observed flow,Fu,v =
∑i P (wi, u), so overestimates will result in negative
residuals. Finally, for each area, we calculate the mean of allnegative residuals connecting the area, so that areas involvedin more overestimates will have lower values. Formally, thegravity residual is:
gResidual(u) =1
n-veu
∑v
negRes(u, v) (5)
where
negRes(u, v) =
{Fu,v − F est
u,v if Fu,v < F estu,v
0 otherwise(6)
Recent work modelled the flow of passengers in London’srail system in a similar fashion, and found that the gravityresiduals were related to deprivation of neighbourhoods[27].
Network AdvantageOur next set of features aims to capture the opportunity foreconomic development afforded by an advantageous positionin the network with respect to the flow of information. Instudying a social network represented by a fixed-line tele-phone call dataset, Eagle et al. [8] showed that the averagenormalised entropy (referred to as diversity) of the social tiesof people living in a neighbourhood correlates strongly withthe level of socio-economic deprivation (a concept closely re-lated to poverty) in that neighbourhood. In this work we areconstrained by the aggregation of the call records to cell towerand are unable to look directly at the underlying individualsocial network. Instead, we hypothesise that the structure ofa cell tower’s links will also reflect the poverty level in itslocation. We thus extract two measures of a cell tower’s net-work advantage: the degree of the cell tower after discardinglinks with a weight below a certain threshold, and the nor-malised entropy. For the former, if links of any weight areconsidered, the cell tower network is extremely dense and thedegree distribution is largely uniform; we therefore drop linkswith weight below the median, denoted kmed
i in order to mag-nify actual heterogeneity in degree distribution. For the latter,normalised entropy is computed using the following formulafrom [8]:
Si =−∑
j qi,j log qi,j
log(ki)(7)
where qi,j = wi,j/wi is the fraction of cell tower i’s totalweight on its link with j, and ki is the degree of i. Then ourarea level features are:
entropy(u) =1
nu
∑i
P (Si, u) (8)
and
medDegree(u) =1
nu
∑i
P (kmedi , u) (9)
IntroversionFinally, we hypothesise that an area’s level of introversionmay be a signal of its poverty level. In other words, if an areahas relatively low volume of traffic to other areas comparedto the traffic within it, the less likely it will be able to benefitfrom new sources of opportunity arising further afield. Thisis similar in spirit to the theory of open economies, albeiton a different scale, which expects nations that close theirborders to international trade to fare less well than those thatare more open [25]. It is also related to the idea of networkadvantage, except that we now explicitly take into accountgeography and consider only a binary property of flow, thatis, whether it is internal or external to the area. A caveat tothe above hypothesis is that we may expect denser areas tonaturally exhibit higher introversion given that there will bea higher likelihood of communications taking place withinthe vicinity. However, since density of cell towers tends tofollow population density, the size of Voronoi cells in denseareas is smaller, thus mitigating somewhat against the higherlikelihood of internal communications. We first calculate the
introversion of cell towers with the following equation:
Hi =wi,i∑i 6=j wi,j
(10)
We then compute the average introversion of all cell towerswithin each region and define the feature:
introversion(u) =1
nu
∑i
P (Hi, u) (11)
Intuitively, introversion values below 1 indicate more intro-verted areas (i.e., internal flow is higher than external flow),and conversely, values above 1 indicate more extroverted ar-eas.
To see that these last three features are not simply alterna-tive ways to measure overall usage, consider that activity lev-els could be flat across the entire region and yet the otherfeatures could vary greatly. For example, an area might bemaking/receiving many fewer calls than expected and thushave a very large gravity residual, and its neighbours mightreceive/make more calls and have a smaller residual. We nextestablish the potential for each of these features to be used asproxies for poverty rate.
RESULTS
Feature ValidationFor the two regions under exam (Cote d’Ivoire and Region B),we compute Pearson correlation coefficients between each ofthe previously extracted features and their poverty rates. Ta-ble 2 shows the overall results. Note that we are measuringproperties of an aggregated network, for which we would notnecessarily expect to find the same correlations as in an in-dividual call network. For example, human networks tend tohave very low edge density (proportion of all possible edgespresent in the network) and the degree of nodes will be a tinyfraction of the total number of nodes. Subsequently, the aver-age degree of individuals within an area will also be small,and indeed, a correlation between degree and poverty willbe retained when averaging. In contrast, the aggregated celltower network is extremely dense and the degree of each nodetends to be much closer to the total number of nodes. Thisis because as we aggregate we reduce the number of nodeswhilst accumulating all the edges. We cannot therefore as-sume that a correlation between individual degree and povertywill also be present between the degree of cell towers and av-erage poverty (or poverty rate) of the area. Similar argumentsapply to other network properties.
ActivityTo begin with, we see strong negative correlations betweenthe total volume and total duration of calls within an area andits poverty level, both in Cote d’Ivoire and Region B. Thisconfirms that aggregated communication activity provides asimple proxy for poverty level; however, as mentioned in theprevious section, this relationship may depend in part on thematurity of the mobile telecoms market. Therefore we areparticularly interested in the results of the remaining featuressince these are potentially more robust in the face of marketsaturation.
Hypothesis Country Feature Pearson’s r 95% Conf. Int. p-value
ActivityRegion B activity: volume −.776 .561, .893 < 1e−5
activity: duration −.775 .560, .892 < 1e−5
Cote d’Ivoire activity: volume −.834 −.956, −.469 .001activity: duration −.830 −.955, −.458 .002
Gravity ResidualRegion B gResidual: volume .686 .848, .407 < .001
gResidual: duration .701 .856, .430 < 1e−4
Cote d’Ivoire gResidual: volume .831 .460, .955 .002gResidual: duration .830 .458, .955 .002
Network AdvantageRegion B entropy: volume −.746 −.877, −.511 < 1e−5
entropy: duration −.726 −.867, −.478 < 1e−4medDegree: volume −.440 −.702, −.072 .021medDegree: duration −.430 −.696, −.059 .025
Cote d’Ivoire entropy: volume −.774 −.938, −.326 .005entropy: duration −.750 −.931, −.273 .008medDegree: volume −.801 −.946, −.388 .003medDegree: duration −.797 −.945, −.379 .003
Introversion Region B introversion: volume −.784 −.897, −.575 < 1e−5introversion: duration −.782 −.896, −.573 < 1e−5
Cote d’Ivoire introversion: volume .710 .190, .918 .015introversion: duration .644 .072, .897 .032
Table 2. Correlations between features derived from mobile phone data and poverty level at the presently available (coarse) spatial granularity.
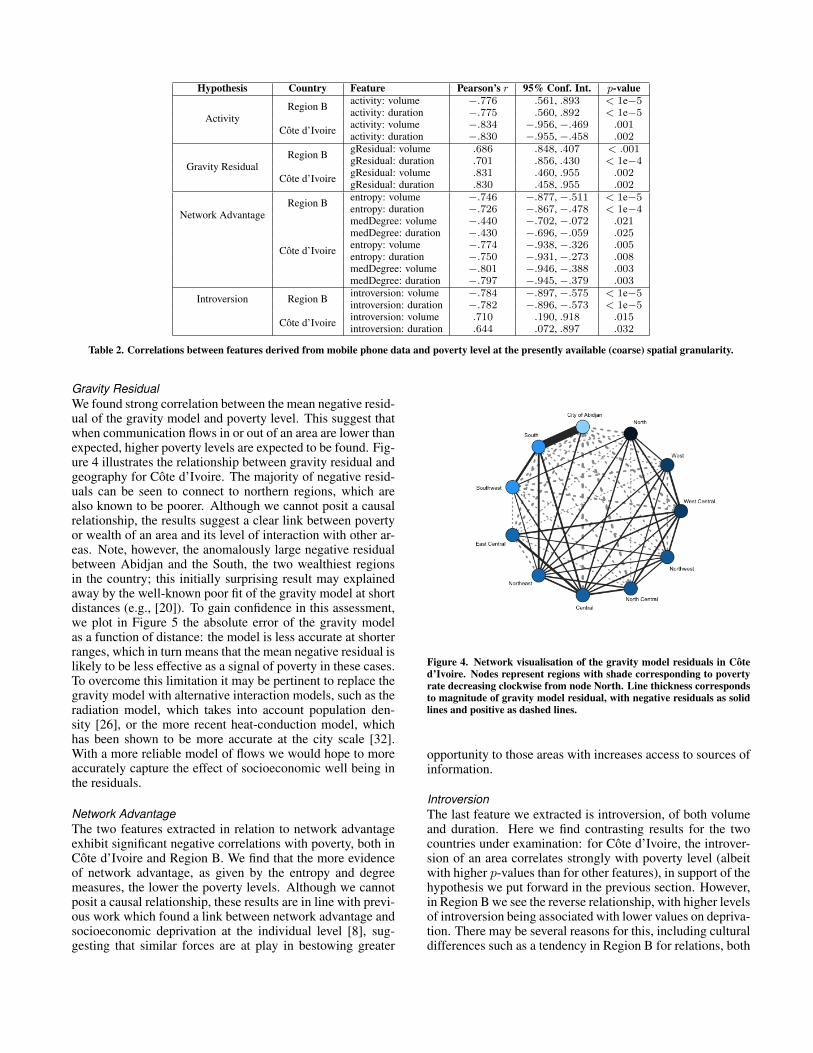
Gravity ResidualWe found strong correlation between the mean negative resid-ual of the gravity model and poverty level. This suggest thatwhen communication flows in or out of an area are lower thanexpected, higher poverty levels are expected to be found. Fig-ure 4 illustrates the relationship between gravity residual andgeography for Cote d’Ivoire. The majority of negative resid-uals can be seen to connect to northern regions, which arealso known to be poorer. Although we cannot posit a causalrelationship, the results suggest a clear link between povertyor wealth of an area and its level of interaction with other ar-eas. Note, however, the anomalously large negative residualbetween Abidjan and the South, the two wealthiest regionsin the country; this initially surprising result may explainedaway by the well-known poor fit of the gravity model at shortdistances (e.g., [20]). To gain confidence in this assessment,we plot in Figure 5 the absolute error of the gravity modelas a function of distance: the model is less accurate at shorterranges, which in turn means that the mean negative residual islikely to be less effective as a signal of poverty in these cases.To overcome this limitation it may be pertinent to replace thegravity model with alternative interaction models, such as theradiation model, which takes into account population den-sity [26], or the more recent heat-conduction model, whichhas been shown to be more accurate at the city scale [32].With a more reliable model of flows we would hope to moreaccurately capture the effect of socioeconomic well being inthe residuals.
Network AdvantageThe two features extracted in relation to network advantageexhibit significant negative correlations with poverty, both inCote d’Ivoire and Region B. We find that the more evidenceof network advantage, as given by the entropy and degreemeasures, the lower the poverty levels. Although we cannotposit a causal relationship, these results are in line with previ-ous work which found a link between network advantage andsocioeconomic deprivation at the individual level [8], sug-gesting that similar forces are at play in bestowing greater
Figure 4. Network visualisation of the gravity model residuals in Coted’Ivoire. Nodes represent regions with shade corresponding to povertyrate decreasing clockwise from node North. Line thickness correspondsto magnitude of gravity model residual, with negative residuals as solidlines and positive as dashed lines.
opportunity to those areas with increases access to sources ofinformation.
IntroversionThe last feature we extracted is introversion, of both volumeand duration. Here we find contrasting results for the twocountries under examination: for Cote d’Ivoire, the introver-sion of an area correlates strongly with poverty level (albeitwith higher p-values than for other features), in support of thehypothesis we put forward in the previous section. However,in Region B we see the reverse relationship, with higher levelsof introversion being associated with lower values on depriva-tion. There may be several reasons for this, including culturaldifferences such as a tendency in Region B for relations, both

Figure 5. Absolute error of gravity model as a function of distance.The regression lines show the general trend for residuals to be largerat shorter distances.
social and economic, to remain within social strata, whichcould in turn affect the spatial distribution of such relations.Alternatively, we could also attribute the contrasting results todifferences in the representativeness of the datasets, with thedataset of Region B containing a smaller proportion of the to-tal number of mobile phone users compared to Cote d’Ivoire.Speculations aside, these results highlight the importance ofplacing the results in a local context, as opposed to relying ona ‘black box’ predictor.
The above correlation analysis suggests that the features wehave extracted from aggregated call data are indeed meaning-ful and could be used as relatively easy-to-interpret proxiesof poverty rates in the developing regions under focus. Wealso claim that despite the fact that correlations are lower forthe latter three features, their inclusion is valuable since theycan in combination increase confidence in the ability of ourpredictions to accurately track poverty. Whereas in isolationwe could be less confident since each suffers from potentialconfounds. Thus these results represent significant progresstowards developing robust metrics.
Next we discuss in more detail the practical implications thatfollow from the above methodology and the limitations ofthese results.
DISCUSSIONWe have outlined and tested a methodology for estimatingpoverty levels that has the potential to impact the practicesof policymakers and NGOs working to improve the livingstandards of people in countries that lack the resources tomanually collect socio-economic data on a frequent basis andat sample rates that would allow fine spatial disaggregation.Tools built upon these results would be relatively low costto implement and could provide interpretable results (in con-trast to a black-box machine learning approach) to act uponin a timely manner. Furthermore, we enable disaggregation atmultiple levels of spatial granularity thus potentially influenc-ing policy implemented at different levels, from neighbour-hood to region. The results also benefit mobile phone usersby protecting their privacy from the outset, thus removing abarrier to wider adoption of this approach.
(a) Cote d’Ivoire (b) Region B
Figure 6. Map of Cote d’Ivoire and Region B showing relative povertyrate and assets index respectively. Darker shades indicate poorer areas.
In discussion with the United Nations Population Fund(UNFPA) to determine how to put the methodology to actualuse, an important need identified is the availabilty of mapsat different levels of spatial granularity, so to provide infor-mation as required for different purposes. For example, na-tional governments determining the allocation of a develop-ment budget to regional governments would require coarsergrained information at the level of the administrative divi-sion in question. At the other end of the scale, regenerationor aid projects implemented at the local level for the bene-fit of small communities would require much finer resolutionpoverty maps to ensure the most needy areas are targetted.The methodology we have presented provides for both sit-uations, with the ability to aggregate data at multiple levelsof granularity, unlike sparsely sampled survey data that mustbe aggregated to a certain minimum (and often impracticallycoarse) level in order to achieve statistical significance.
To demonstrate this, we estimate poverty at the level of 255sub-prefectures in Cote d’Ivoire, and of 176 areas at the nextadministrative level down in Region B, by deriving a sim-ple linear model from the features above, using ordinary leastsquares regression. To visualise the granularity of informa-tion that such a model would give governments and agen-cies, we provide an estimated poverty map for Cote d’Ivoirein Figure 6(a), and for Region B in Figure 6(b). Notice thedramatic change in the spatial pattern of poverty information,compared to the regional maps previously shown in Figures3(a) and 3(b) respectively. The coarser grained map of Coted’Ivoire depicts poverty increasing as we radiate out from thecity of Abidjan. Instead, our finer grained estimates compli-cate the picture, suggesting that the south-east of the coun-try may contain areas of high poverty near Abidjan and con-versely the north-west may contain areas of low poverty. Sim-ilarly in Region B we see areas estimated to be low on theassets index adjacent to areas estimated to be high.
LIMITATIONS AND FUTURE WORKDifficulty in obtaining CDR data currently prevents us fromestablishing the global applicability of our work, but by repli-cating results in two developing economies that differ greatlyin contextual factors, such as culture, migration patterns andsocial and family relationships, we are able to claim that ourresults are not simply chance correlations. This represents asignificant advance towards general application compared to
related work. It might be suggested that validity is threatenedby variation in adoption rates, but rather, this is a factor whichwill partly determine the values of the properties we derive(others being individual usage, infrastructure, etc.). Conse-quently, use of our metrics would not disadvantage groupswith low adoption rates, but in fact they would show up asblack spots in our models (most intuitively when measuringactivity, i.e., low adoption will mean low activity, but also inthe other features) and would thus be identified much soonerthan with traditional methods.
The lack of up to date and spatially accurate socio-economicground truth data also represents a significant hurdle towarda rigorous evaluation of the results. In order to be confidentthat the features we extract can be used to accurately trackpoverty in a timely and spatially accurate manner, we initiallyrequire knowledge of real poverty rates that also fulfil theseconstraints. Instead we have a lag of 4 years in Cote d’Ivoireand 2 years in Region B between the socio-economic data weuse as ground truth and the mobile phone data from which wederive our proxies. Although this temporal lag will undoubt-edly affect the accuracy of predictive models based on ourproxies, such as the simple linear model we present above,we argue that the legitimacy of the methodology we have de-veloped is not compromised. Rather, we would expect its ac-curacy and utility to increase were this lag removed. In futurework we will take steps towards overcoming these limitationsby acquiring ground truth data that is both more recent andhas a more precise level of geo-location. This will allow usto fully investigate the relationship between geographical hi-erarchies and validate estimates at finer granularity.
Further practical usages of our methodology identified in-clude the potential for identifying trends, thereby providingearly warning of conditions worsening in specific areas, andthe ability to evaluate the effect of policy and projects in areasonable time frame (i.e., as soon as changes occur and be-fore policy is due for renewal). Indeed, tools built upon themethods we have described would be a useful augmentationto socio-economic data collection processes in any country.The cost of producing estimates from passively and automat-ically collected communication data is negligible comparedto that of manual surveying, thus a main barrier to obtainingup to date poverty estimates has been removed. Cote d’Ivoireis a perfect example of a country in which timely and ac-curate information regarding poverty is severely lacking. Incases such as this, the ability to obtain estimates of povertylevels on a continuous basis would represent a vast improve-ment. UNFPA has stressed the value that any indicative es-timates would provide in certain situations where none arecurrently available; even if they carried with them a signifi-cant level of uncertainty such estimates would still representa large improvement in many cases. Indeed, novel methodsto provide low cost poverty indicators would represent sig-nificant value to many governments and NGOSs working toimprove people’s lives. Limited resources could be allocatedin much more efficient manner thereby helping to alleviatesome of the detrimental effects of poverty and inequality.
ACKNOWLEDGMENTSWe would like to thank Sabrina Juran of UNFPA, Olivia DeBacker, Miguel Luengo-Oroz and Rene Clausen Nielsen ofUN Global Pulse for their helpful feedback on previous ver-sions of this document. This research was funded by a GoogleEurope Doctoral Fellowship in Data Mining and Intel Collab-orative Research Institute: Cities.
REFERENCES1. Aker, J. C., and Mbiti, I. M. Mobile Phones and
Economic Development in Africa. Journal of EconomicPerspectives 24, 3 (2010), 207–232.
2. Balcan, D., Colizza, V., Goncalves, B., Hu, H.,Ramasco, J. J., and Vespignani, A. Multiscale mobilitynetworks and the spatial spreading of infectiousdiseases. Proceedings of the National Academy ofSciences of the United States of America 106, 51 (Dec.2009), 21484–9.
3. Barrat, A., Barthelemy, M., Pastor-Satorras, R., andVespignani, A. The architecture of complex weightednetworks. Proceedings of the National Academy ofSciences of the United States of America 101, 11 (Mar.2004), 3747–52.
4. Blondel, V. D., Esch, M., Chan, C., Clerot, F., Deville,P., Huens, E., Morlot, F., Smoreda, Z., and Ziemlicki, C.Data for Development: the D4D Challenge on MobilePhone Data. 10.
5. Blumenstock, J., and Eagle, N. Mobile divides: gender,socioeconomic status, and mobile phone use in rwanda.In Proceedings of the 4th ACM/IEEE InternationalConference on Information and CommunicationTechnologies and Development, ACM (2010), 6.
6. Burke, M., Marlow, C., and Lento, T. Social networkactivity and social well-being. In Proceedings of theSIGCHI Conference on Human Factors in ComputingSystems, CHI ’10, ACM (New York, NY, USA, 2010),1909–1912.
7. Doll, C. H., Muller, J.-P., and Elvidge, C. D. Night-timeimagery as a tool for global mapping of socioeconomicparameters and greenhouse gas emissions. AMBIO: aJournal of the Human Environment 29, 3 (2000),157–162.
8. Eagle, N., Macy, M., and Claxton, R. Network diversityand economic development. Science (New York, N.Y.)328, 5981 (May 2010), 1029–31.
9. Ebener, S., Murray, C., Tandon, A., and Elvidge, C. C.From wealth to health: modelling the distribution ofincome per capita at the sub-national level usingnight-time light imagery. International Journal ofHealth Geographics 4, 1 (2005), 5.
10. Elvidge, C. D., Baugh, K. E., Kihn, E. A., Kroehl,H. W., and Davis, E. R. Mapping city lights withnighttime data from the dmsp operational linescansystem. Photogrammetric Engineering and RemoteSensing 63, 6 (1997), 727–734.
11. Frias-martinez, V., Soto, V., Virseda, J., andFrias-martinez, E. Computing Cost-Effective CensusMaps From Cell Phone Traces. In Pervasive UrbanApplications (PURBA) (Newcastle, 2012).
12. Frias-Martinez, V., and Virseda, J. On the relationshipbetween socio-economic factors and cell phone usage.In Fifth International Conference on Information andCommunication Technologies and Development (ICTD’12), ACM Press (New York, New York, USA, Mar.2012).
13. Frias-Martinez, V., Virseda-Jerez, J., and Frias-Martinez,E. On the relation between socio-economic status andphysical mobility. Information Technology forDevelopment 18, 2 (Apr. 2012), 91–106.
14. Gutierrez, T., Krings, G., and Blondel, V. D. Indicatorsof wealth, economic diversity and segregation in cøtedivoire using mobile phone datasets. In Netmob 2013Book of Abstracts (2013).
15. International Monetary Fund. Cote divoire: Povertyreduction strategy paper. Tech. rep., 2009.
16. Jung, W., and Wang, F. Gravity model in the Koreanhighway. Europhysics Letters 81 (2008).
17. Kaluza, P., Kolzsch, A., Gastner, M. T., and Blasius, B.The complex network of global cargo ship movements.Journal of the Royal Society, Interface / the RoyalSociety 7, 48 (July 2010), 1093–103.
18. Kramer, A. D. I. An Unobtrusive Behavioral Model ofGross National Happiness. In Proceedings of the 28thACM CHI, ACM Press (New York, New York, USA,Apr. 2010), 287–290.
19. Krings, G., Calabrese, F., Ratti, C., and Blondel, V. D.Urban gravity: a model for inter-city telecommunicationflows. Journal of Statistical Mechanics: Theory andExperiment 2009, 07 (May 2009), L07003.
20. Masucci, A. P., Serras, J., Johansson, A., and Batty, M.Gravity vs radiation model : on the importance of scaleand heterogeneity in commuting flows.
21. Noor, A. M., Alegana, V. a., Gething, P. W., Tatem,A. J., and Snow, R. W. Using remotely sensednight-time light as a proxy for poverty in Africa.Population health metrics 6 (Jan. 2008), 5.
22. Parate, A., and Miklau, G. A framework for safelypublishing communication traces. In Proceedings of the
18th ACM Conference on Information and KnowledgeManagement (2009), 1469–1472.
23. Quercia, D., Ellis, J., Capra, L., and Crowcroft, J.Tracking Gross Community Happiness from Tweets. InProceedings of ACM CSCW 2012 (2012).
24. Quercia, D., Seaghdha, D. O., and Crowcroft, J. Talk ofthe City : Our Tweets , Our Community Happiness. InProc.of AAAI ICWSM (2012).
25. Sachs, J. D., and Warner, A. M. Source of Slow Growthin African Economies. Journal of African Economics 6,3 (1997), 335–376.
26. Simini, F., Gonzalez, M. C., Maritan, A., and Barabasi,A.-L. A universal model for mobility and migrationpatterns. Nature 484, 7392 (Apr. 2012), 96–100.
27. Smith, C., Quercia, D., and Capra, L. Finger on thepulse. In Proceedings of the 2013 conference onComputer supported cooperative work - CSCW ’13,ACM Press (Feb. 2013), 683.
28. Soto, V., and Frıas-Martınez, E. Automated land useidentification using cell-phone records. In Proceedingsof the 3rd ACM international workshop on MobiArch,ACM (2011), 17–22.
29. Soto, V., Frias-Martinez, V., Virseda, J., andFrias-Martinez, E. Prediction of socioeconomic levelsusing cell phone records. User Modeling, Adaption andPersonalization (2011), 377–388.
30. Sutton, P., Roberts, D., Elvidge, C., and Baugh, K.Census from heaven: an estimate of the global humanpopulation using night-time satellite imagery.International Journal of Remote Sensing 22, 16 (2001),3061–3076.
31. Viboud, C., Bjø rnstad, O. N., Smith, D. L., Simonsen,L., Miller, M. A., and Grenfell, B. T. Synchrony, waves,and spatial hierarchies in the spread of influenza.Science (New York, N.Y.) 312, 5772 (Apr. 2006), 447–51.
32. Yan, X.-y., Zhao, C., Fan, Y., Di, Z., and Wang, W.-x.Universal Predictability of Mobility Patterns in Cities.1–19.
33. Zipf, G. The P 1 P 2/D hypothesis: On the intercitymovement of persons. American Sociological Review11, 6 (1946), 677–686.