Embed Size (px)
Citation preview
POVERTY IN TUCSON FIELD WORKSHOP
COMMUNITY FORUM
School of SociologyCollege of Social and Behavioral Sciences
University Libraries
May 15, 2015; Habitat for Humanity Tucson
2
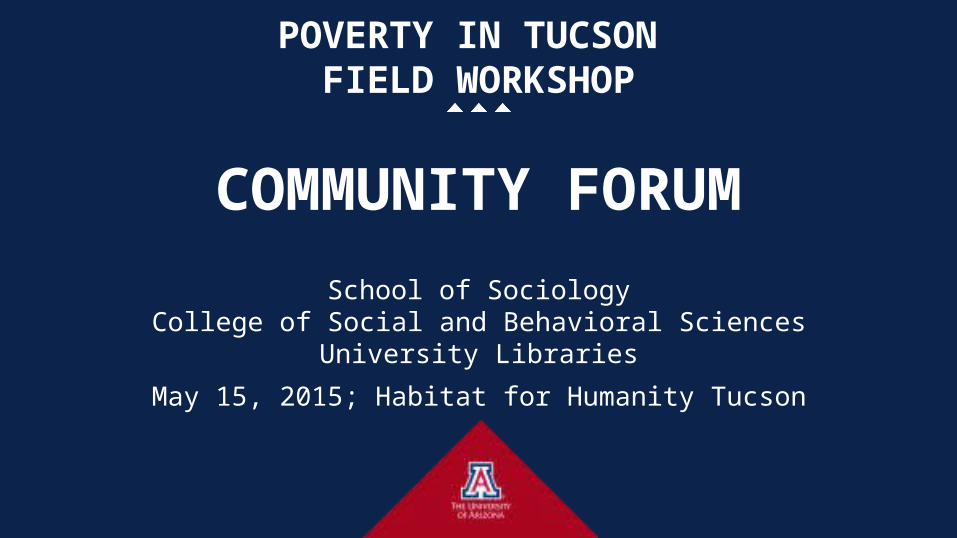
Where Did We Go?
Stratified Sample of 8 High Poverty Census Tracts
4 Highest Poverty Rates
4 at City Average of Poverty Rates
Randomly Selected & Screened for Earning Less than 200% of Poverty Threshold
257 Valid SurveysConcentrated
Poverty (poverty rate 40+%)
Above average poverty rate (25.2 –
39.9%)

Who Did We Talk To?
3
Men; 41.5%
Women, 58.5%
Gender
Full-Time; 30.2%
Part-Time, 12.5%
Student; 10.6%
Unem-ployed; 17.3%
Retired/Other; 29.4%
Employment
< HS; 17.1%
HS, 25.3%
Some College; 39.3%
BA/BS; 9.7%
Education
4
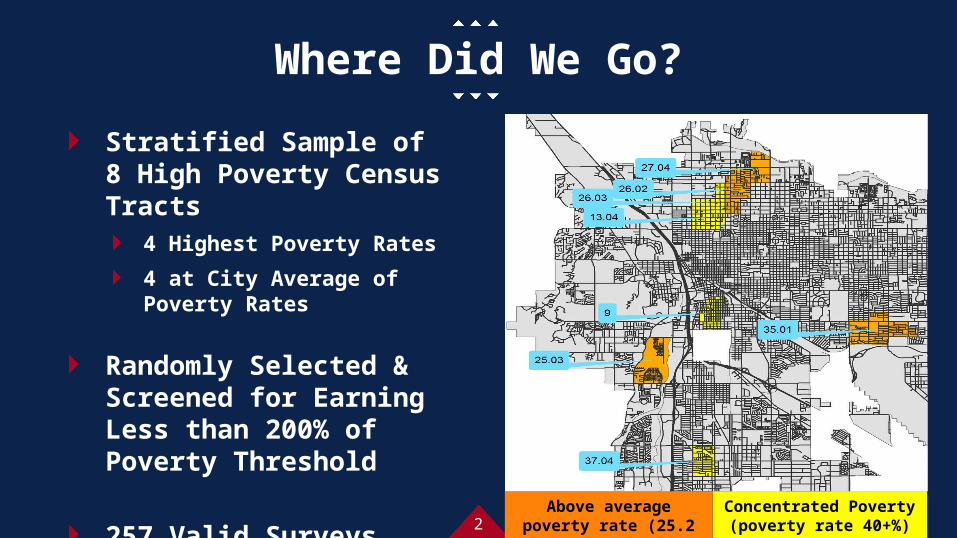
Family Structure
Single Single Parent Cohabitating Married Divorced, Widowed, or
Other
0%
5%
10%
15%
20%
25%
30%
35% 32.3%
10.7%7.2%
23.9%25.9%
5
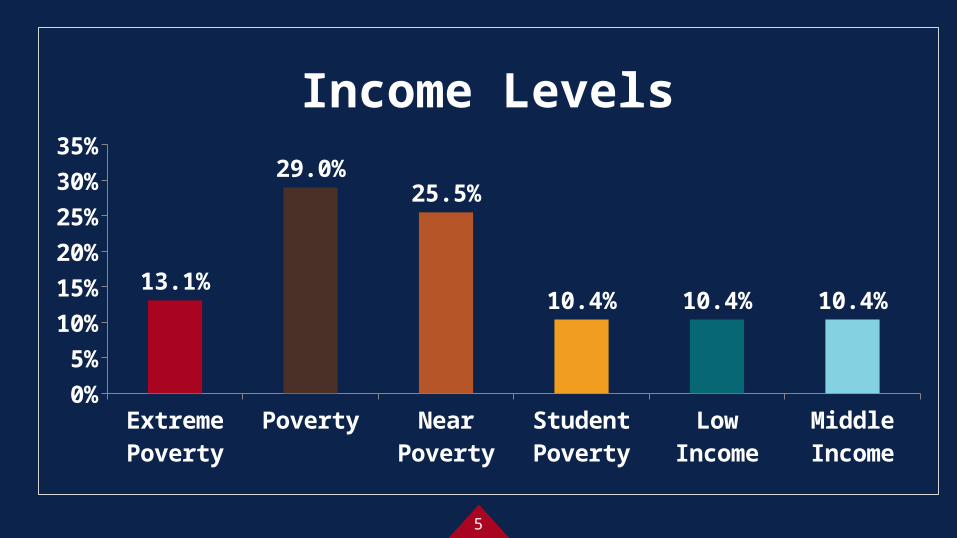
Extreme Poverty
Poverty Near Poverty
Student Poverty
Low Income Middle Income
0%
5%
10%
15%
20%
25%
30%
35%
13.1%
29.0%25.5%
10.4% 10.4% 10.4%
Income Levels
6
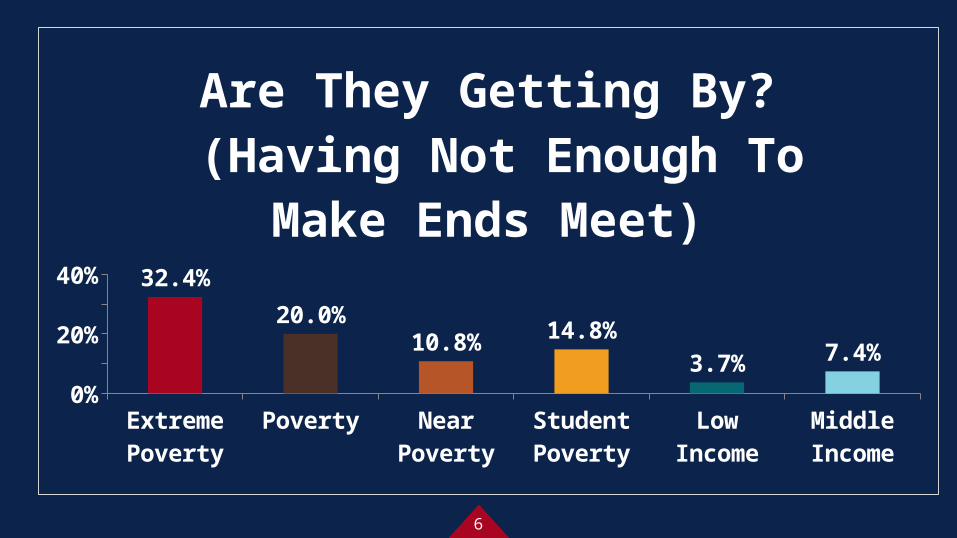
Extreme Poverty
Poverty Near Poverty
Student Poverty
Low Income Middle Income
0%5%
10%15%20%25%30%35% 32.4%
20.0%
10.8%14.8%
3.7%7.4%
Are They Getting By? (Having Not Enough To Make Ends
Meet)
7
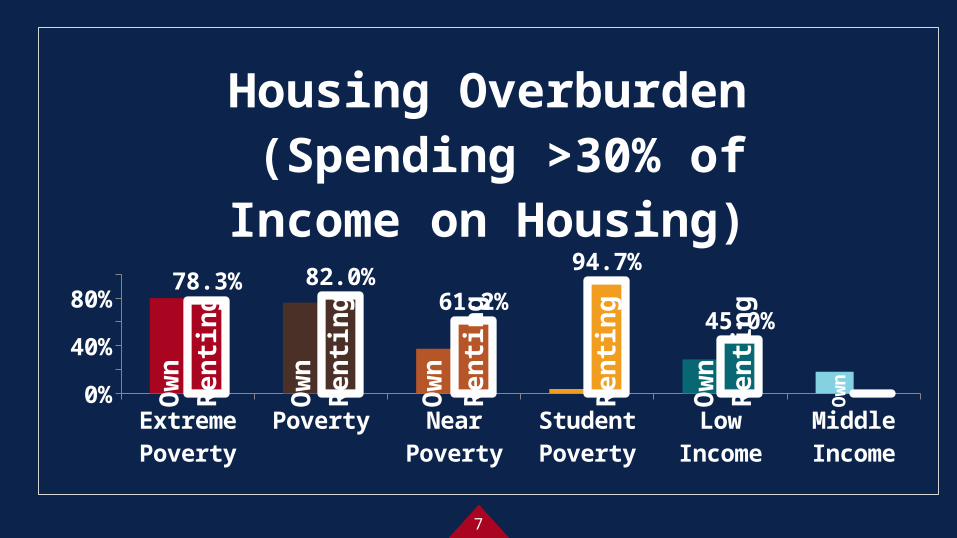
Extreme Poverty
Poverty Near Poverty
Student Poverty
Low Income Middle Income
0%
20%
40%
60%
80%
100%78.3% 82.0%
61.2%
94.7%
45.0%
Housing Overburden (Spending >30% of Income on
Housing)R
enti
ng
Ren
tin
g
Ren
tin
g
Ren
tin
g
Ren
tin
g
Ow
n
Ow
n
Ow
n
Ow
n
Ow
n
8
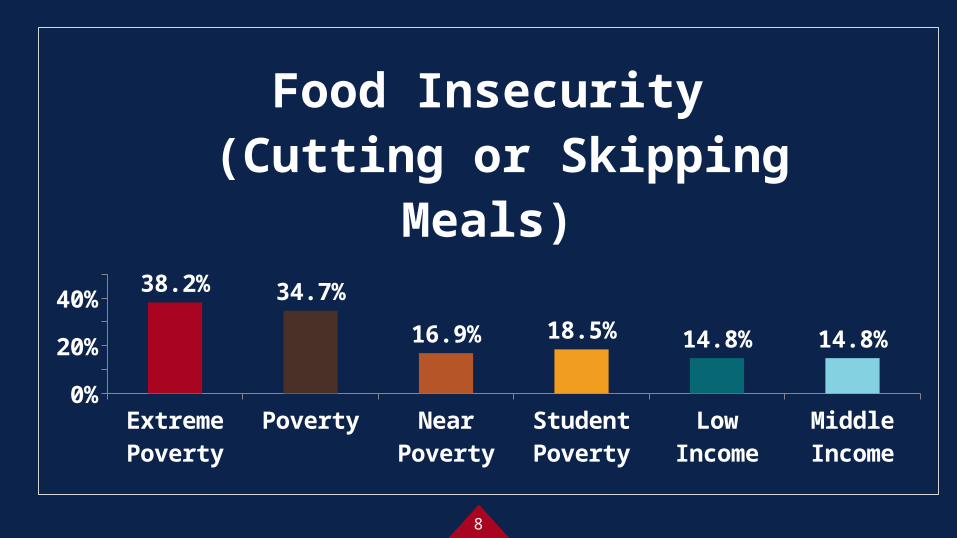
Extreme Poverty
Poverty Near Poverty
Student Poverty
Low Income Middle Income
0%5%
10%15%20%25%30%35%40%45%
38.2%34.7%
16.9% 18.5%14.8% 14.8%
Food Insecurity (Cutting or Skipping Meals)
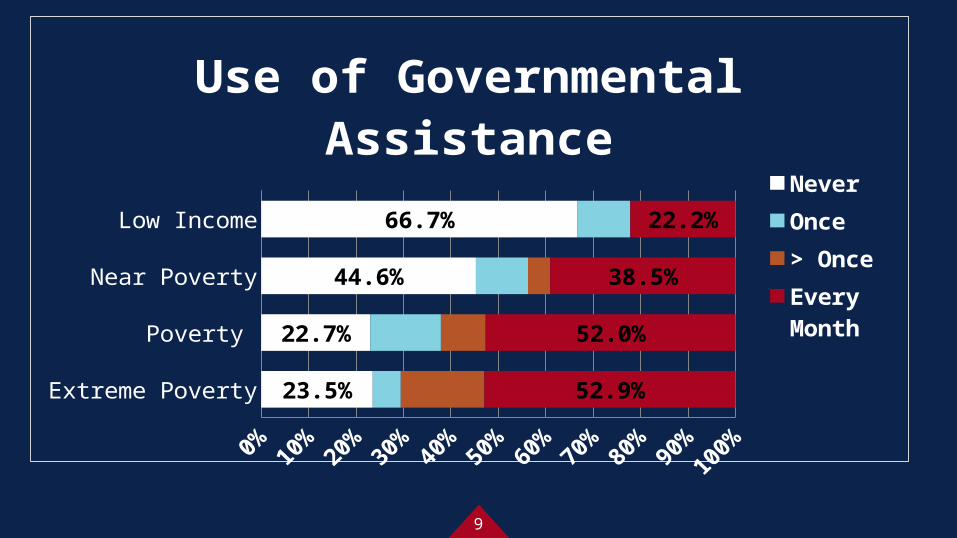
9
Extreme Poverty
Poverty
Near Poverty
Low Income
0% 10% 20% 30% 40% 50% 60% 70% 80% 90%100%
23.5%
22.7%
44.6%
66.7%
52.9%
52.0%
38.5%
22.2%
Use of Governmental Assistance
Never
Once
> Once
Every Month
10
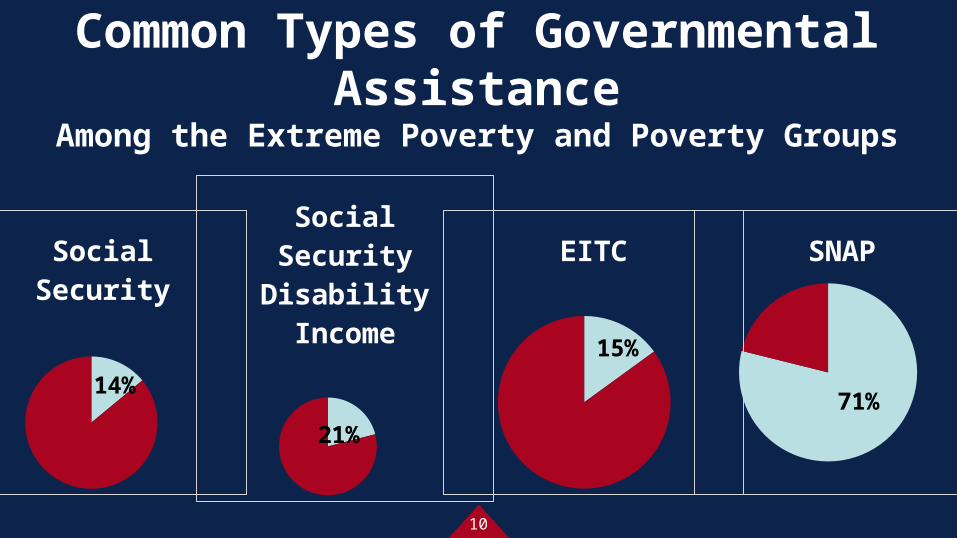
14%
Social Security
71%
SNAP
21%
Social Security Disability Income
15%
EITC
Common Types of Governmental AssistanceAmong the Extreme Poverty and Poverty Groups
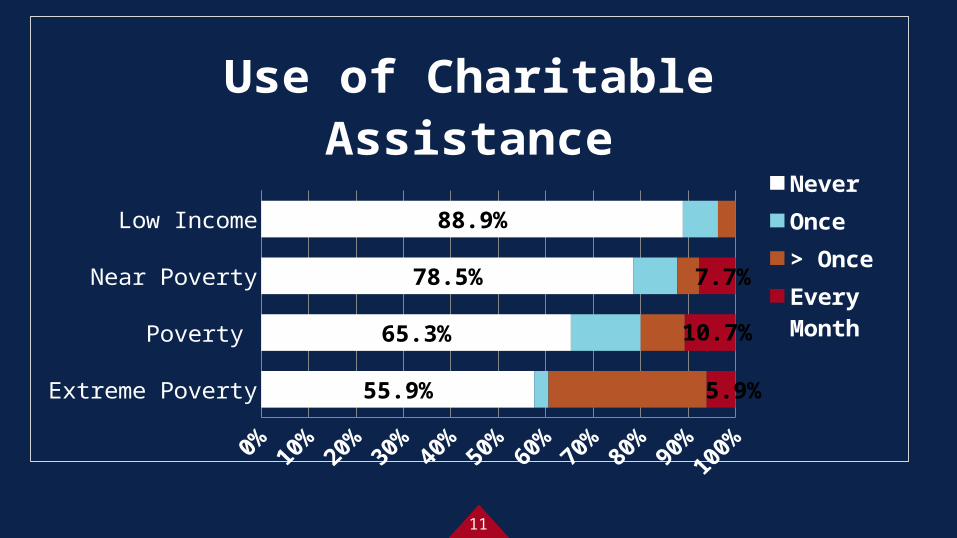
11
Extreme Poverty
Poverty
Near Poverty
Low Income
0% 10% 20% 30% 40% 50% 60% 70% 80% 90%100%
55.9%
65.3%
78.5%
88.9%
5.9%
10.7%
7.7%
Use of Charitable Assistance
Never
Once
> Once
Every Month
12
THANK YOU!
To View All the Poster Presentations, Please Visit:
tinyurl.com/TucsonPoverty