Embed Size (px)
Citation preview
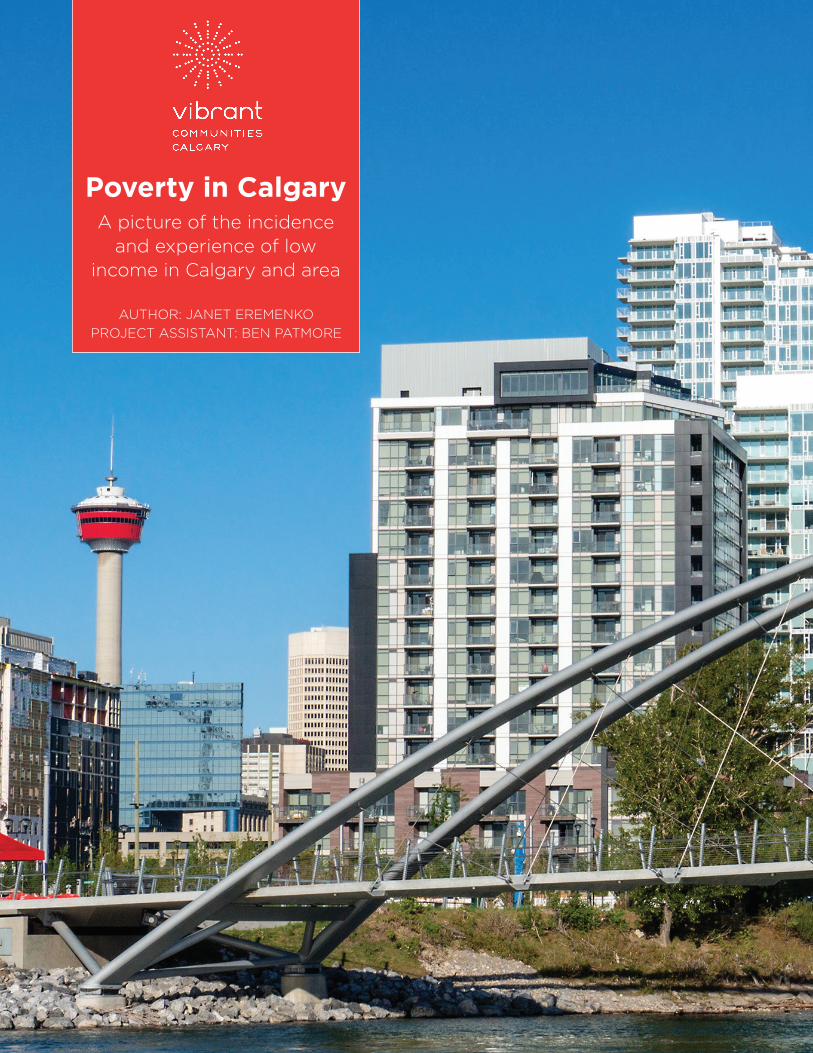
AUTHOR: JANET EREMENKO
PROJECT ASSISTANT: BEN PATMORE
Poverty in CalgaryA picture of the incidence
and experience of low income in Calgary and area

BackgroundVibrant Communities Calgary (VCC) is the
backbone organization to a collective impact
initiative in Calgary, Alberta. The mandate of VCC
is to guide the implementation of Enough for All,
Calgary’s poverty reduction strategy. One of the
roles of the backbone organization is to advance
policy and build public will. It is with these roles in
mind that VCC has decided to produce a collation
of statistics reflecting the incidence of low income
and the experience of poverty in Calgary, and
where identified, Calgary Census Metropolitan
Area, or CMA1.
As poverty reduction advocates and voting
citizens of our community, we expect our
government officials and administration to
make evidence-informed decisions. We trust the
collation of statistics in this report will provide
evidence to inform government as well as our
own practices and programs.
Poverty is different than low income. Enough
for All defines poverty as the condition of a
human being who is deprived of the resources,
means, choices and power to acquire and
maintain self sufficiency while being able to be
an active participant in society. Low Income
is based exclusively on one indicator; income.
This report focuses primarily on the incidence
of low income and the ways in which low
income may be manifested or developed (e.g.,
under employment or unemployment). Adding
to the complexity, there are three different
measures of low income used in Canada;
Market Basket Measure, Low Income Cut-Off
and Low Income Measure. For the purpose of
this report, we have included the definition of
the second and third measurements:
• Low Income Measure (LIM) is a relative
measure, where it is a fixed percentage
(50%) of median adjusted income per given
economic family size. LIM is a national
concept, and therefore does not change
based on geographic classification.
• The Low Income Cut-Off, or LICO, is a
measure of expenditures relative to others
as a percentage of income, whereby families
or persons not in economic families spend
20 percentage points more of their income
than the average family on food, shelter
and clothing. Based on the 1992 Family
Expenditure Survey, families spent 43%, on
average. Therefore, the income threshold
was set to 63%, and adjusted to the
Consumer Price Index inflation rate. LICO
before and after-tax levels are defined by
family size and area of residence.
Poverty is complex. What do we include in our
Poverty in Calgary 2018 report?
Living in low-income can be a stifling and
lonely experience. As a social issue, poverty is
immense. To provide some guidance for content
of this report, we looked to poverty reduction
experts and Enough for All’s current body
of work. The three documents to which we
referred for content areas were:
• Enough for All 2016 Evaluation Report,
• Enough for All 2018 Implementation Plan2,
and
• Poverty Policy by Sherri Torjman3 of the
former Caledon Institute, now archived with
the Maytree Foundation
1 See Appendix A for geographic boundaries of Calgary and Calgary Census Metropolitan Area (CMA) according to Statistics
Canada.
2 Both of these Enough for All documents can be found at http://enoughforall.ca/publications-reports/
3 Torjman, S. (2008) Poverty Policy. Ottawa: Caledon Institute. Retrieved from https://maytree.com/wp-content/
uploads/720ENG.pdf
Poverty in Calgary 2018 1
Next StepsAs we ask today’s governments to make
evidence-informed decisions, so should we,
as poverty reduction advocates, base our
own policy recommendations on evidence.
This report is therefore the first publication
to inform second and third complementary
policy recommendations. Additionally,
the data included here will be considered
in future strategic planning for Vibrant
Communities Calgary and Enough for All,
alongside the essential input from the voice
of lived experience, VCC’s Board of Directors,
Indigenous Advisory Committee, PovertyTalks!,
partners and stakeholders.
Incidence of Low IncomeAdding to the complexity of poverty and low
income is the lack of consensus concerning a
universal measurement of low income, however
most poverty reduction organizations, programs
using income threshold eligibility criteria and
government services and supports use either
Low Income Cut-Off (LICO) or Low Income
Measure (LIM). These are further broken down
by before- and after-tax categories.
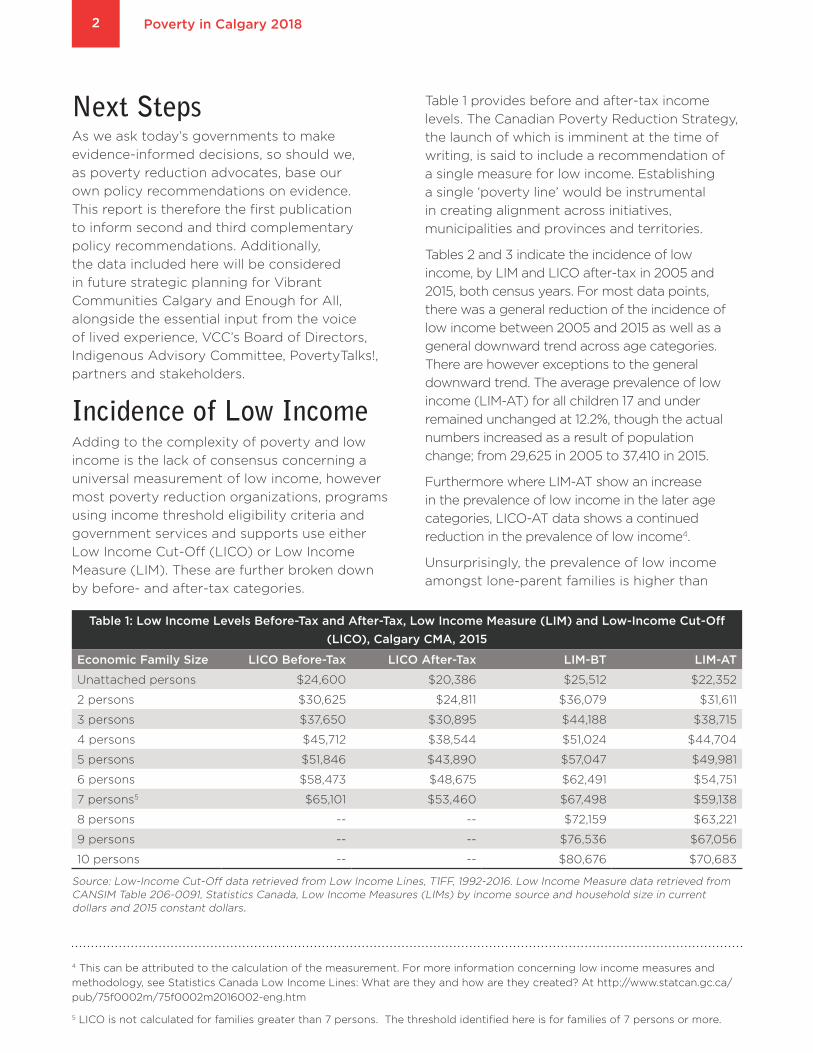
Table 1 provides before and after-tax income
levels. The Canadian Poverty Reduction Strategy,
the launch of which is imminent at the time of
writing, is said to include a recommendation of
a single measure for low income. Establishing
a single ‘poverty line’ would be instrumental
in creating alignment across initiatives,
municipalities and provinces and territories.
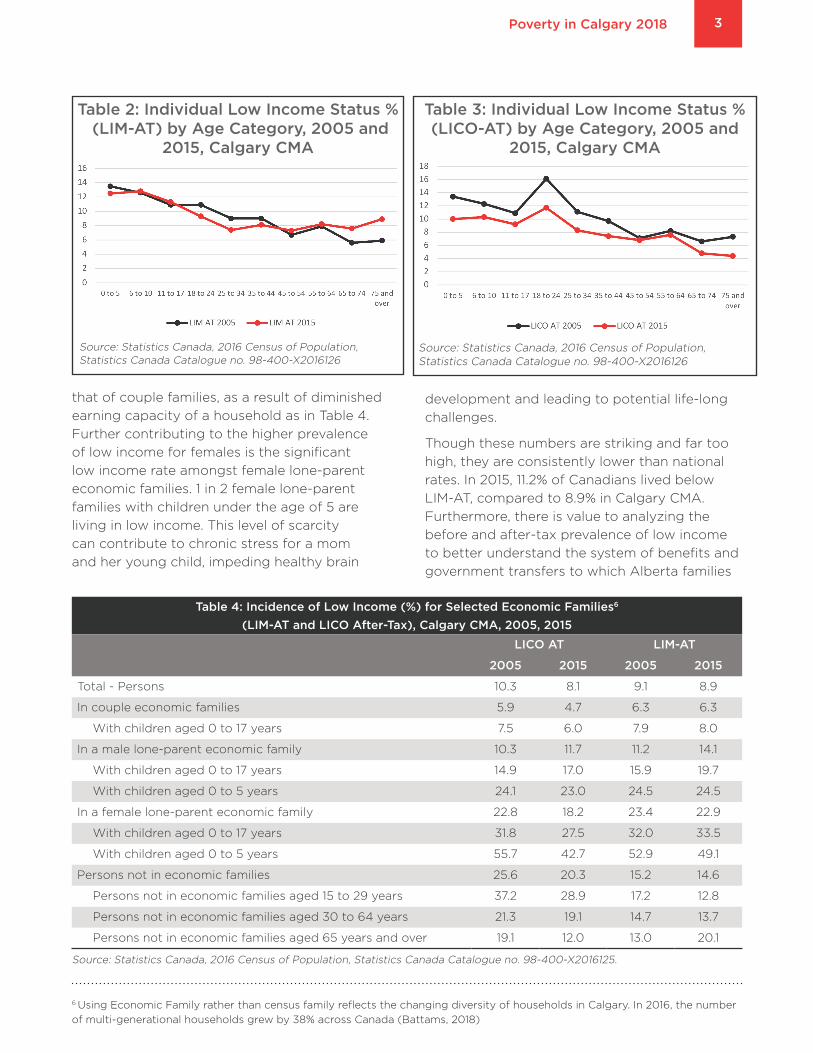
Tables 2 and 3 indicate the incidence of low
income, by LIM and LICO after-tax in 2005 and
2015, both census years. For most data points,
there was a general reduction of the incidence of
low income between 2005 and 2015 as well as a
general downward trend across age categories.
There are however exceptions to the general
downward trend. The average prevalence of low
income (LIM-AT) for all children 17 and under
remained unchanged at 12.2%, though the actual
numbers increased as a result of population
change; from 29,625 in 2005 to 37,410 in 2015.
Furthermore where LIM-AT show an increase
in the prevalence of low income in the later age
categories, LICO-AT data shows a continued
reduction in the prevalence of low income4.
Unsurprisingly, the prevalence of low income
amongst lone-parent families is higher than
Table 1: Low Income Levels Before-Tax and After-Tax, Low Income Measure (LIM) and Low-Income Cut-Off
(LICO), Calgary CMA, 2015
Economic Family Size LICO Before-Tax LICO After-Tax LIM-BT LIM-AT
Unattached persons $24,600 $20,386 $25,512 $22,352
2 persons $30,625 $24,811 $36,079 $31,611
3 persons $37,650 $30,895 $44,188 $38,715
4 persons $45,712 $38,544 $51,024 $44,704
5 persons $51,846 $43,890 $57,047 $49,981
6 persons $58,473 $48,675 $62,491 $54,751
7 persons5 $65,101 $53,460 $67,498 $59,138
8 persons -- -- $72,159 $63,221
9 persons -- -- $76,536 $67,056
10 persons -- -- $80,676 $70,683
Source: Low-Income Cut-Off data retrieved from Low Income Lines, T1FF, 1992-2016. Low Income Measure data retrieved from CANSIM Table 206-0091, Statistics Canada, Low Income Measures (LIMs) by income source and household size in current dollars and 2015 constant dollars.
4 This can be attributed to the calculation of the measurement. For more information concerning low income measures and
methodology, see Statistics Canada Low Income Lines: What are they and how are they created? At http://www.statcan.gc.ca/
pub/75f0002m/75f0002m2016002-eng.htm
5 LICO is not calculated for families greater than 7 persons. The threshold identified here is for families of 7 persons or more.
Poverty in Calgary 20182
that of couple families, as a result of diminished
earning capacity of a household as in Table 4.
Further contributing to the higher prevalence
of low income for females is the significant
low income rate amongst female lone-parent
economic families. 1 in 2 female lone-parent
families with children under the age of 5 are
living in low income. This level of scarcity
can contribute to chronic stress for a mom
and her young child, impeding healthy brain
development and leading to potential life-long
challenges.
Though these numbers are striking and far too
high, they are consistently lower than national
rates. In 2015, 11.2% of Canadians lived below
LIM-AT, compared to 8.9% in Calgary CMA.
Furthermore, there is value to analyzing the
before and after-tax prevalence of low income
to better understand the system of benefits and
government transfers to which Alberta families
6 Using Economic Family rather than census family reflects the changing diversity of households in Calgary. In 2016, the number
of multi-generational households grew by 38% across Canada (Battams, 2018)
Table 4: Incidence of Low Income (%) for Selected Economic Families6
(LIM-AT and LICO After-Tax), Calgary CMA, 2005, 2015
LICO AT LIM-AT
2005 2015 2005 2015
Total - Persons 10.3 8.1 9.1 8.9
In couple economic families 5.9 4.7 6.3 6.3
With children aged 0 to 17 years 7.5 6.0 7.9 8.0
In a male lone-parent economic family 10.3 11.7 11.2 14.1
With children aged 0 to 17 years 14.9 17.0 15.9 19.7
With children aged 0 to 5 years 24.1 23.0 24.5 24.5
In a female lone-parent economic family 22.8 18.2 23.4 22.9
With children aged 0 to 17 years 31.8 27.5 32.0 33.5
With children aged 0 to 5 years 55.7 42.7 52.9 49.1
Persons not in economic families 25.6 20.3 15.2 14.6
Persons not in economic families aged 15 to 29 years 37.2 28.9 17.2 12.8
Persons not in economic families aged 30 to 64 years 21.3 19.1 14.7 13.7
Persons not in economic families aged 65 years and over 19.1 12.0 13.0 20.1
Source: Statistics Canada, 2016 Census of Population, Statistics Canada Catalogue no. 98-400-X2016125.
Source: Statistics Canada, 2016 Census of Population, Statistics Canada Catalogue no. 98-400-X2016126
Table 2: Individual Low Income Status % (LIM-AT) by Age Category, 2005 and
2015, Calgary CMA
Source: Statistics Canada, 2016 Census of Population, Statistics Canada Catalogue no. 98-400-X2016126
Table 3: Individual Low Income Status % (LICO-AT) by Age Category, 2005 and
2015, Calgary CMA
Poverty in Calgary 2018 3
are eligible. For couple families, the difference
in the prevalence of low income (LIM) between
before and after-tax varies between 1.4% and
2.1% (meaning the benefits and transfers bring
between 1.4 and 2.1% of families above this line).
Benefits and transfers for lone-parent families
have a greater change; for female lone-parent
families with children under the age of 5, the
prevalence of low income drops from 55.2%
before-tax to 49.1% after-tax. The greatest
change between before- and after-tax rates is for
unattached persons over the age of 65. For this
group, prevalence of low income is reduced by
11.6%, from 31.7% before-tax to 20.1% after-tax7.
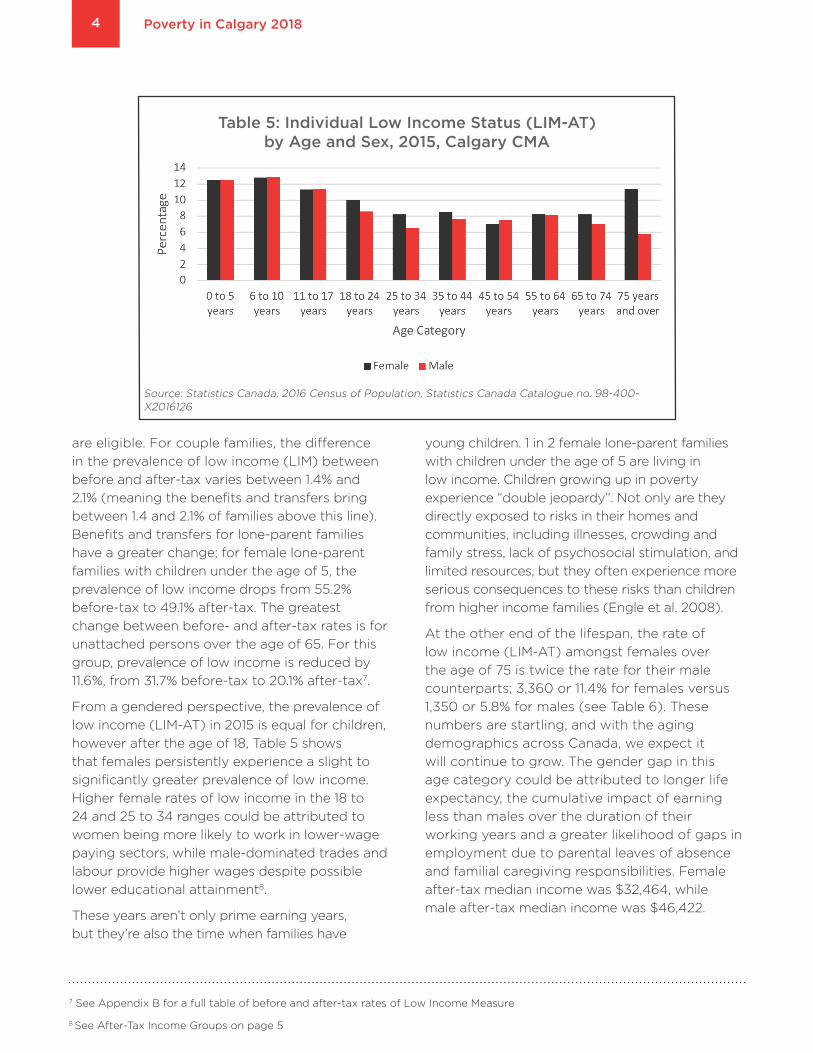
From a gendered perspective, the prevalence of
low income (LIM-AT) in 2015 is equal for children,
however after the age of 18, Table 5 shows
that females persistently experience a slight to
significantly greater prevalence of low income.
Higher female rates of low income in the 18 to
24 and 25 to 34 ranges could be attributed to
women being more likely to work in lower-wage
paying sectors, while male-dominated trades and
labour provide higher wages despite possible
lower educational attainment8.
These years aren’t only prime earning years,
but they’re also the time when families have
young children. 1 in 2 female lone-parent families
with children under the age of 5 are living in
low income. Children growing up in poverty
experience “double jeopardy”. Not only are they
directly exposed to risks in their homes and
communities, including illnesses, crowding and
family stress, lack of psychosocial stimulation, and
limited resources, but they often experience more
serious consequences to these risks than children
from higher income families (Engle et al. 2008).
At the other end of the lifespan, the rate of
low income (LIM-AT) amongst females over
the age of 75 is twice the rate for their male
counterparts; 3,360 or 11.4% for females versus
1,350 or 5.8% for males (see Table 6). These
numbers are startling, and with the aging
demographics across Canada, we expect it
will continue to grow. The gender gap in this
age category could be attributed to longer life
expectancy, the cumulative impact of earning
less than males over the duration of their
working years and a greater likelihood of gaps in
employment due to parental leaves of absence
and familial caregiving responsibilities. Female
after-tax median income was $32,464, while
male after-tax median income was $46,422.
7 See Appendix B for a full table of before and after-tax rates of Low Income Measure
8 See After-Tax Income Groups on page 5
Source: Statistics Canada, 2016 Census of Population, Statistics Canada Catalogue no. 98-400-X2016126
Table 5: Individual Low Income Status (LIM-AT) by Age and Sex, 2015, Calgary CMA
Poverty in Calgary 20184
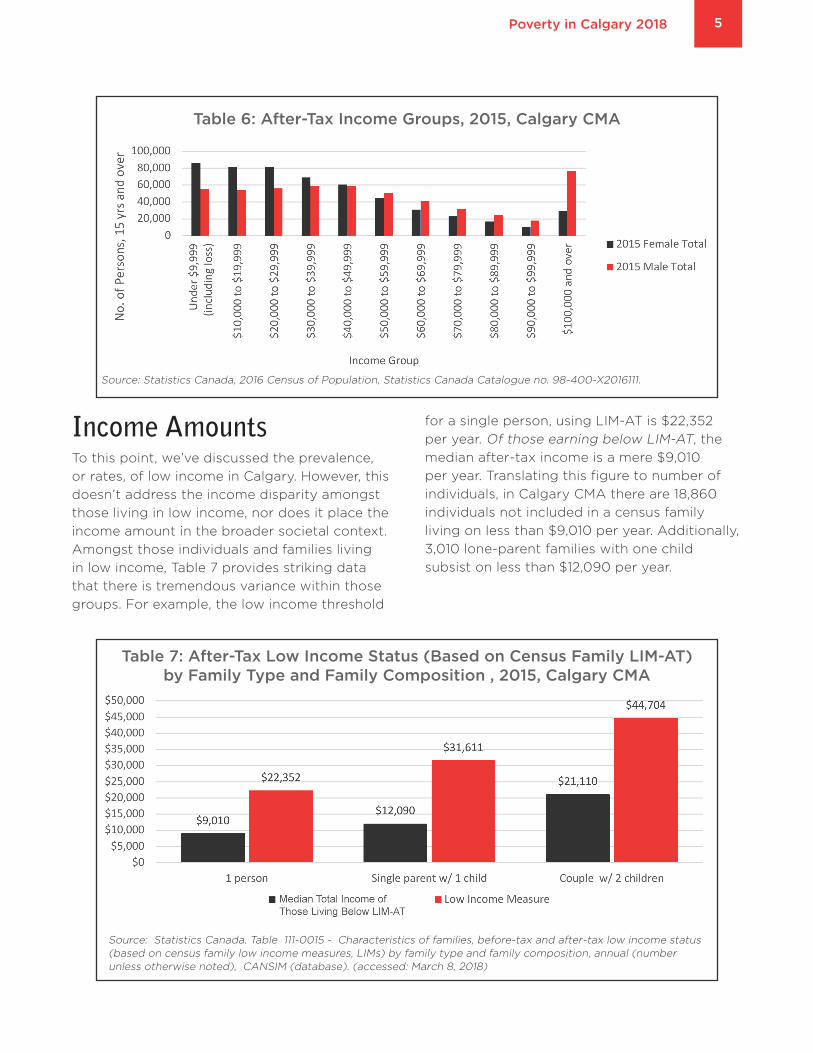
Income AmountsTo this point, we’ve discussed the prevalence,
or rates, of low income in Calgary. However, this
doesn’t address the income disparity amongst
those living in low income, nor does it place the
income amount in the broader societal context.
Amongst those individuals and families living
in low income, Table 7 provides striking data
that there is tremendous variance within those
groups. For example, the low income threshold
for a single person, using LIM-AT is $22,352
per year. Of those earning below LIM-AT, the
median after-tax income is a mere $9,010
per year. Translating this figure to number of
individuals, in Calgary CMA there are 18,860
individuals not included in a census family
living on less than $9,010 per year. Additionally,
3,010 lone-parent families with one child
subsist on less than $12,090 per year.
Source: Statistics Canada, 2016 Census of Population, Statistics Canada Catalogue no. 98-400-X2016111.
Table 6: After-Tax Income Groups, 2015, Calgary CMA
Source: Statistics Canada. Table 111-0015 - Characteristics of families, before-tax and after-tax low income status (based on census family low income measures, LIMs) by family type and family composition, annual (number unless otherwise noted), CANSIM (database). (accessed: March 8, 2018)
Table 7: After-Tax Low Income Status (Based on Census Family LIM-AT) by Family Type and Family Composition , 2015, Calgary CMA
Poverty in Calgary 2018 5
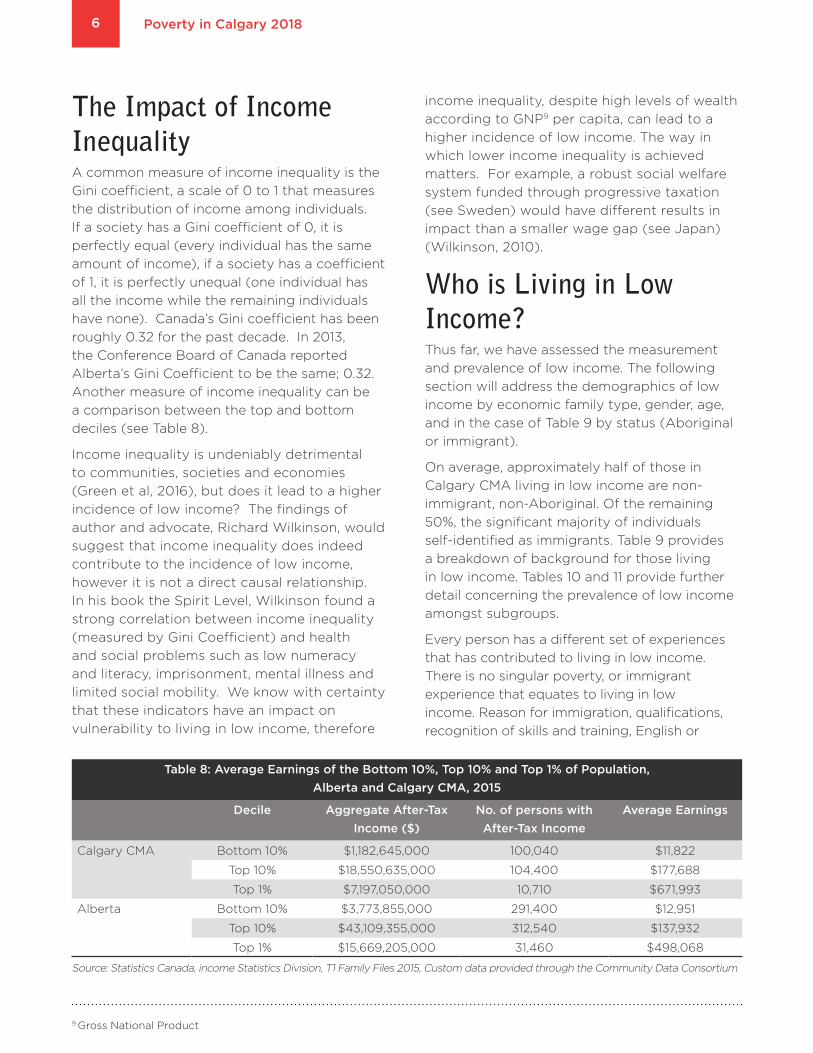
Table 8: Average Earnings of the Bottom 10%, Top 10% and Top 1% of Population,
Alberta and Calgary CMA, 2015
Decile Aggregate After-Tax
Income ($)
No. of persons with
After-Tax Income
Average Earnings
Calgary CMA Bottom 10% $1,182,645,000 100,040 $11,822
Top 10% $18,550,635,000 104,400 $177,688
Top 1% $7,197,050,000 10,710 $671,993
Alberta Bottom 10% $3,773,855,000 291,400 $12,951
Top 10% $43,109,355,000 312,540 $137,932
Top 1% $15,669,205,000 31,460 $498,068
Source: Statistics Canada, income Statistics Division, T1 Family Files 2015, Custom data provided through the Community Data Consortium
The Impact of Income InequalityA common measure of income inequality is the
Gini coefficient, a scale of 0 to 1 that measures
the distribution of income among individuals.
If a society has a Gini coefficient of 0, it is
perfectly equal (every individual has the same
amount of income), if a society has a coefficient
of 1, it is perfectly unequal (one individual has
all the income while the remaining individuals
have none). Canada’s Gini coefficient has been
roughly 0.32 for the past decade. In 2013,
the Conference Board of Canada reported
Alberta’s Gini Coefficient to be the same; 0.32.
Another measure of income inequality can be
a comparison between the top and bottom
deciles (see Table 8).
Income inequality is undeniably detrimental
to communities, societies and economies
(Green et al, 2016), but does it lead to a higher
incidence of low income? The findings of
author and advocate, Richard Wilkinson, would
suggest that income inequality does indeed
contribute to the incidence of low income,
however it is not a direct causal relationship.
In his book the Spirit Level, Wilkinson found a
strong correlation between income inequality
(measured by Gini Coefficient) and health
and social problems such as low numeracy
and literacy, imprisonment, mental illness and
limited social mobility. We know with certainty
that these indicators have an impact on
vulnerability to living in low income, therefore
income inequality, despite high levels of wealth
according to GNP9 per capita, can lead to a
higher incidence of low income. The way in
which lower income inequality is achieved
matters. For example, a robust social welfare
system funded through progressive taxation
(see Sweden) would have different results in
impact than a smaller wage gap (see Japan)
(Wilkinson, 2010).
Who is Living in Low Income?Thus far, we have assessed the measurement
and prevalence of low income. The following
section will address the demographics of low
income by economic family type, gender, age,
and in the case of Table 9 by status (Aboriginal
or immigrant).
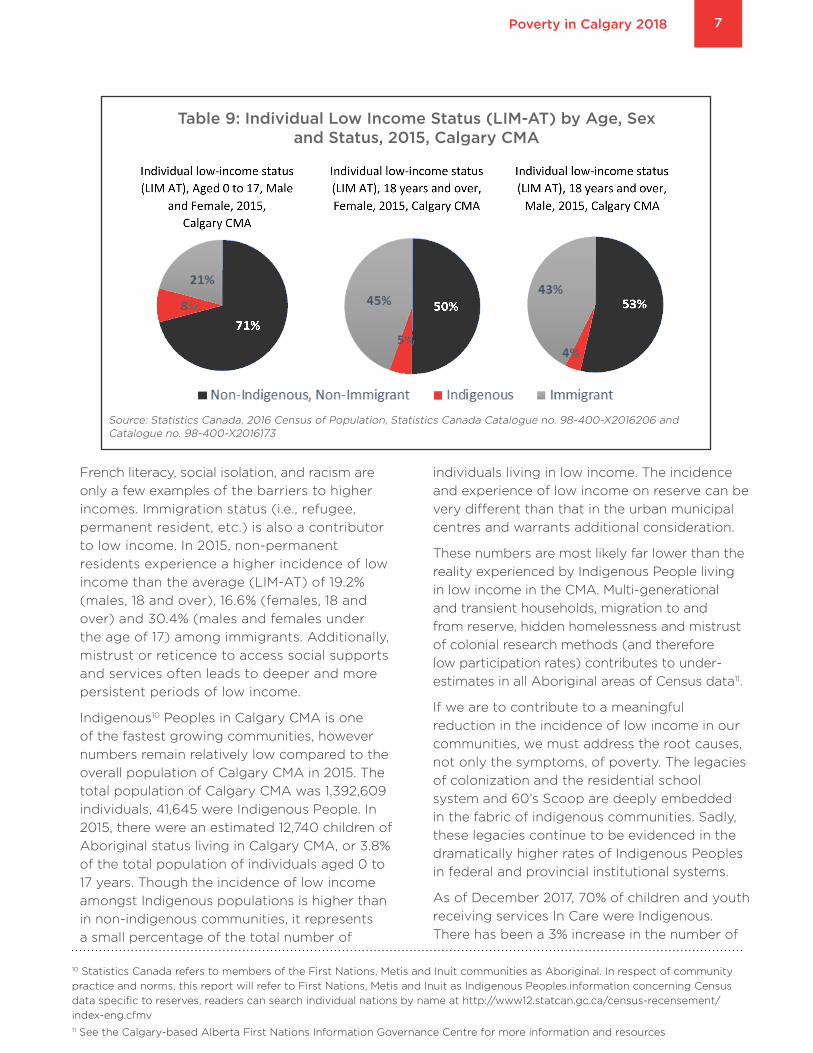
On average, approximately half of those in
Calgary CMA living in low income are non-
immigrant, non-Aboriginal. Of the remaining
50%, the significant majority of individuals
self-identified as immigrants. Table 9 provides
a breakdown of background for those living
in low income. Tables 10 and 11 provide further
detail concerning the prevalence of low income
amongst subgroups.
Every person has a different set of experiences
that has contributed to living in low income.
There is no singular poverty, or immigrant
experience that equates to living in low
income. Reason for immigration, qualifications,
recognition of skills and training, English or
9 Gross National Product
Poverty in Calgary 20186
French literacy, social isolation, and racism are
only a few examples of the barriers to higher
incomes. Immigration status (i.e., refugee,
permanent resident, etc.) is also a contributor
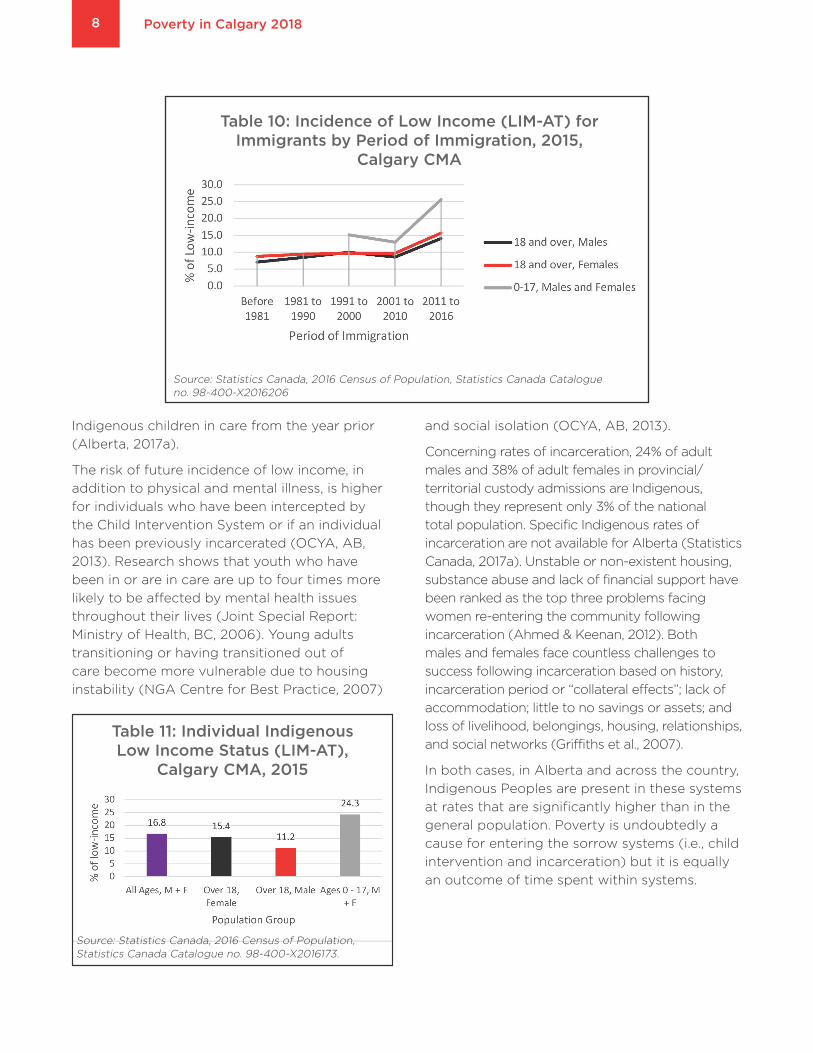
to low income. In 2015, non-permanent
residents experience a higher incidence of low
income than the average (LIM-AT) of 19.2%
(males, 18 and over), 16.6% (females, 18 and
over) and 30.4% (males and females under
the age of 17) among immigrants. Additionally,
mistrust or reticence to access social supports
and services often leads to deeper and more
persistent periods of low income.
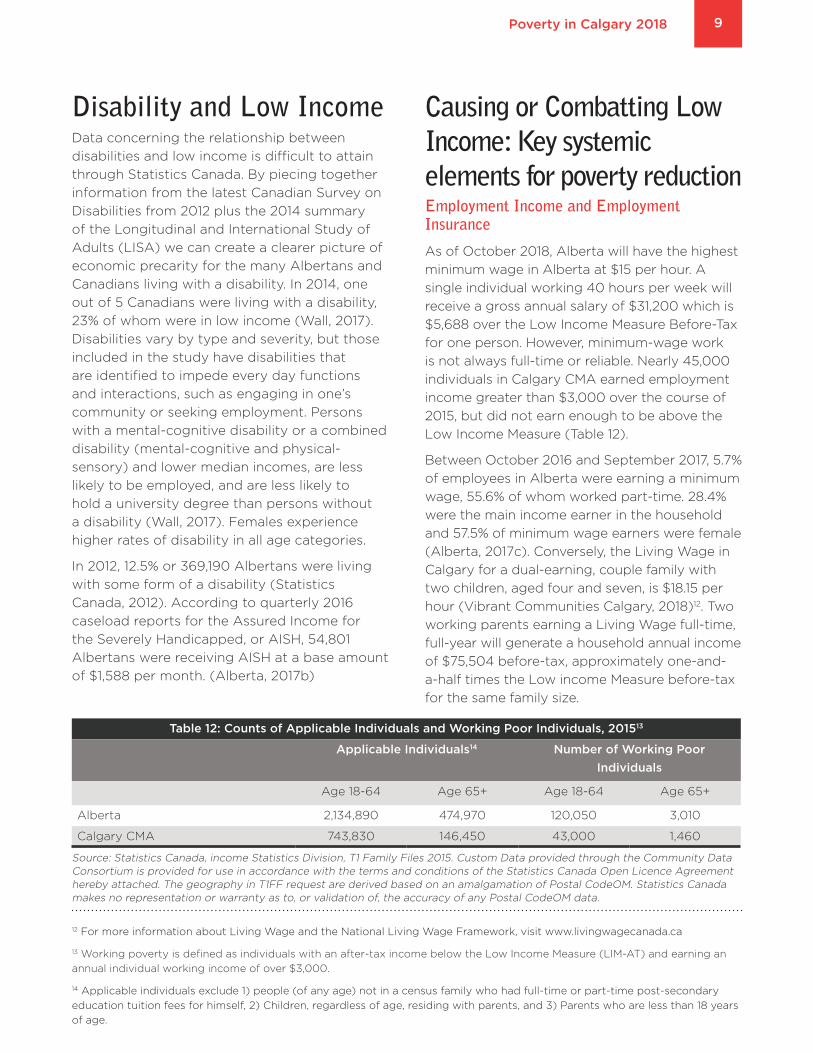
Indigenous10 Peoples in Calgary CMA is one
of the fastest growing communities, however
numbers remain relatively low compared to the
overall population of Calgary CMA in 2015. The
total population of Calgary CMA was 1,392,609
individuals, 41,645 were Indigenous People. In
2015, there were an estimated 12,740 children of
Aboriginal status living in Calgary CMA, or 3.8%
of the total population of individuals aged 0 to
17 years. Though the incidence of low income
amongst Indigenous populations is higher than
in non-indigenous communities, it represents
a small percentage of the total number of
individuals living in low income. The incidence
and experience of low income on reserve can be
very different than that in the urban municipal
centres and warrants additional consideration.
These numbers are most likely far lower than the
reality experienced by Indigenous People living
in low income in the CMA. Multi-generational
and transient households, migration to and
from reserve, hidden homelessness and mistrust
of colonial research methods (and therefore
low participation rates) contributes to under-
estimates in all Aboriginal areas of Census data11.
If we are to contribute to a meaningful
reduction in the incidence of low income in our
communities, we must address the root causes,
not only the symptoms, of poverty. The legacies
of colonization and the residential school
system and 60’s Scoop are deeply embedded
in the fabric of indigenous communities. Sadly,
these legacies continue to be evidenced in the
dramatically higher rates of Indigenous Peoples
in federal and provincial institutional systems.
As of December 2017, 70% of children and youth
receiving services In Care were Indigenous.
There has been a 3% increase in the number of
10 Statistics Canada refers to members of the First Nations, Metis and Inuit communities as Aboriginal. In respect of community
practice and norms, this report will refer to First Nations, Metis and Inuit as Indigenous Peoples.information concerning Census
data specific to reserves, readers can search individual nations by name at http://www12.statcan.gc.ca/census-recensement/
index-eng.cfmv11 See the Calgary-based Alberta First Nations Information Governance Centre for more information and resources
Source: Statistics Canada, 2016 Census of Population, Statistics Canada Catalogue no. 98-400-X2016206 and Catalogue no. 98-400-X2016173
Table 9: Individual Low Income Status (LIM-AT) by Age, Sex and Status, 2015, Calgary CMA
Poverty in Calgary 2018 7
Indigenous children in care from the year prior
(Alberta, 2017a).
The risk of future incidence of low income, in
addition to physical and mental illness, is higher
for individuals who have been intercepted by
the Child Intervention System or if an individual
has been previously incarcerated (OCYA, AB,
2013). Research shows that youth who have
been in or are in care are up to four times more
likely to be affected by mental health issues
throughout their lives (Joint Special Report:
Ministry of Health, BC, 2006). Young adults
transitioning or having transitioned out of
care become more vulnerable due to housing
instability (NGA Centre for Best Practice, 2007)
and social isolation (OCYA, AB, 2013).
Concerning rates of incarceration, 24% of adult
males and 38% of adult females in provincial/
territorial custody admissions are Indigenous,
though they represent only 3% of the national
total population. Specific Indigenous rates of
incarceration are not available for Alberta (Statistics
Canada, 2017a). Unstable or non-existent housing,
substance abuse and lack of financial support have
been ranked as the top three problems facing
women re-entering the community following
incarceration (Ahmed & Keenan, 2012). Both
males and females face countless challenges to
success following incarceration based on history,
incarceration period or “collateral effects”; lack of
accommodation; little to no savings or assets; and
loss of livelihood, belongings, housing, relationships,
and social networks (Griffiths et al., 2007).
In both cases, in Alberta and across the country,
Indigenous Peoples are present in these systems
at rates that are significantly higher than in the
general population. Poverty is undoubtedly a
cause for entering the sorrow systems (i.e., child
intervention and incarceration) but it is equally
an outcome of time spent within systems.
Source: Statistics Canada, 2016 Census of Population, Statistics Canada Catalogue no. 98-400-X2016206
Table 10: Incidence of Low Income (LIM-AT) for Immigrants by Period of Immigration, 2015,
Calgary CMA
Source: Statistics Canada, 2016 Census of Population, Statistics Canada Catalogue no. 98-400-X2016173.
Table 11: Individual Indigenous Low Income Status (LIM-AT),
Calgary CMA, 2015
Poverty in Calgary 20188
Disability and Low IncomeData concerning the relationship between
disabilities and low income is difficult to attain
through Statistics Canada. By piecing together
information from the latest Canadian Survey on
Disabilities from 2012 plus the 2014 summary
of the Longitudinal and International Study of
Adults (LISA) we can create a clearer picture of
economic precarity for the many Albertans and
Canadians living with a disability. In 2014, one
out of 5 Canadians were living with a disability,
23% of whom were in low income (Wall, 2017).
Disabilities vary by type and severity, but those
included in the study have disabilities that
are identified to impede every day functions
and interactions, such as engaging in one’s
community or seeking employment. Persons
with a mental-cognitive disability or a combined
disability (mental-cognitive and physical-
sensory) and lower median incomes, are less
likely to be employed, and are less likely to
hold a university degree than persons without
a disability (Wall, 2017). Females experience
higher rates of disability in all age categories.
In 2012, 12.5% or 369,190 Albertans were living
with some form of a disability (Statistics
Canada, 2012). According to quarterly 2016
caseload reports for the Assured Income for
the Severely Handicapped, or AISH, 54,801
Albertans were receiving AISH at a base amount
of $1,588 per month. (Alberta, 2017b)
Causing or Combatting Low Income: Key systemic elements for poverty reductionEmployment Income and Employment Insurance
As of October 2018, Alberta will have the highest
minimum wage in Alberta at $15 per hour. A
single individual working 40 hours per week will
receive a gross annual salary of $31,200 which is
$5,688 over the Low Income Measure Before-Tax
for one person. However, minimum-wage work
is not always full-time or reliable. Nearly 45,000
individuals in Calgary CMA earned employment
income greater than $3,000 over the course of
2015, but did not earn enough to be above the
Low Income Measure (Table 12).
Between October 2016 and September 2017, 5.7%
of employees in Alberta were earning a minimum
wage, 55.6% of whom worked part-time. 28.4%
were the main income earner in the household
and 57.5% of minimum wage earners were female
(Alberta, 2017c). Conversely, the Living Wage in
Calgary for a dual-earning, couple family with
two children, aged four and seven, is $18.15 per
hour (Vibrant Communities Calgary, 2018)12. Two
working parents earning a Living Wage full-time,
full-year will generate a household annual income
of $75,504 before-tax, approximately one-and-
a-half times the Low income Measure before-tax
for the same family size.
12 For more information about Living Wage and the National Living Wage Framework, visit www.livingwagecanada.ca
13 Working poverty is defined as individuals with an after-tax income below the Low Income Measure (LIM-AT) and earning an
annual individual working income of over $3,000.
14 Applicable individuals exclude 1) people (of any age) not in a census family who had full-time or part-time post-secondary
education tuition fees for himself, 2) Children, regardless of age, residing with parents, and 3) Parents who are less than 18 years
of age.
Table 12: Counts of Applicable Individuals and Working Poor Individuals, 201513
Applicable Individuals14 Number of Working Poor
Individuals
Age 18-64 Age 65+ Age 18-64 Age 65+
Alberta 2,134,890 474,970 120,050 3,010
Calgary CMA 743,830 146,450 43,000 1,460
Source: Statistics Canada, income Statistics Division, T1 Family Files 2015. Custom Data provided through the Community Data Consortium is provided for use in accordance with the terms and conditions of the Statistics Canada Open Licence Agreement hereby attached. The geography in T1FF request are derived based on an amalgamation of Postal CodeOM. Statistics Canada makes no representation or warranty as to, or validation of, the accuracy of any Postal CodeOM data.
Poverty in Calgary 2018 9
Social Assistance
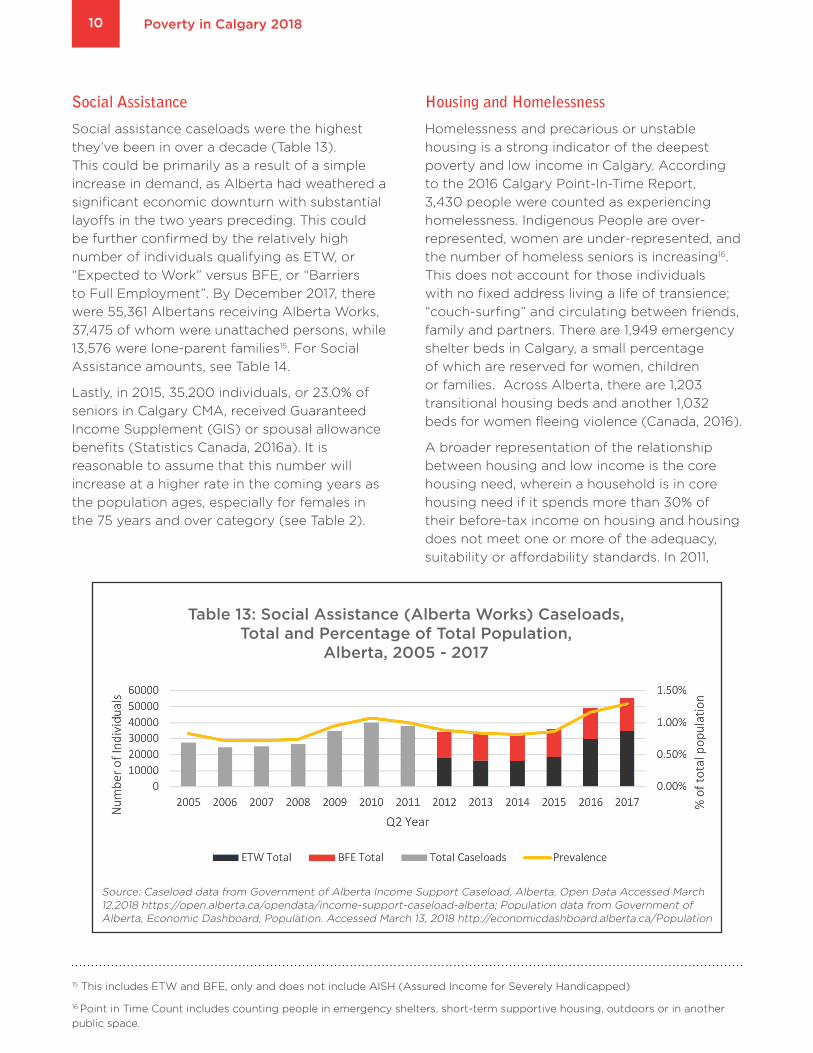
Social assistance caseloads were the highest
they’ve been in over a decade (Table 13).
This could be primarily as a result of a simple
increase in demand, as Alberta had weathered a
significant economic downturn with substantial
layoffs in the two years preceding. This could
be further confirmed by the relatively high
number of individuals qualifying as ETW, or
“Expected to Work” versus BFE, or “Barriers
to Full Employment”. By December 2017, there
were 55,361 Albertans receiving Alberta Works,
37,475 of whom were unattached persons, while
13,576 were lone-parent families15. For Social
Assistance amounts, see Table 14.
Lastly, in 2015, 35,200 individuals, or 23.0% of
seniors in Calgary CMA, received Guaranteed
Income Supplement (GIS) or spousal allowance
benefits (Statistics Canada, 2016a). It is
reasonable to assume that this number will
increase at a higher rate in the coming years as
the population ages, especially for females in
the 75 years and over category (see Table 2).
Housing and Homelessness
Homelessness and precarious or unstable
housing is a strong indicator of the deepest
poverty and low income in Calgary. According
to the 2016 Calgary Point-In-Time Report,
3,430 people were counted as experiencing
homelessness. Indigenous People are over-
represented, women are under-represented, and
the number of homeless seniors is increasing16.
This does not account for those individuals
with no fixed address living a life of transience;
“couch-surfing” and circulating between friends,
family and partners. There are 1,949 emergency
shelter beds in Calgary, a small percentage
of which are reserved for women, children
or families. Across Alberta, there are 1,203
transitional housing beds and another 1,032
beds for women fleeing violence (Canada, 2016).
A broader representation of the relationship
between housing and low income is the core
housing need, wherein a household is in core
housing need if it spends more than 30% of
their before-tax income on housing and housing
does not meet one or more of the adequacy,
suitability or affordability standards. In 2011,
15 This includes ETW and BFE, only and does not include AISH (Assured Income for Severely Handicapped)
16 Point in Time Count includes counting people in emergency shelters, short-term supportive housing, outdoors or in another
public space.
Source: Caseload data from Government of Alberta Income Support Caseload, Alberta, Open Data Accessed March 12,2018 https://open.alberta.ca/opendata/income-support-caseload-alberta; Population data from Government of Alberta, Economic Dashboard, Population. Accessed March 13, 2018 http://economicdashboard.alberta.ca/Population
Table 13: Social Assistance (Alberta Works) Caseloads, Total and Percentage of Total Population,
Alberta, 2005 - 2017
Poverty in Calgary 201810
9.2% of Albertans were living in households
in core housing need (CMHC, 2011). Canada
Mortgage and Housing Corporation (“CMHC”)
reports that the rental vacancy rate fell in 2017
to 6.3%, with average rent across all units down
by 1.7% resulting in an average rent for a one-
bedroom unit in Calgary CMA of $1,025 per
month (CMHC 2017).
Calgary’s proportion of non-market housing
rentals is 3.6%, or 16,702. Co-operative housing
and affordable housing ownership are 0.1% and
0.2%, respectively. As of April 2016, there were
3,934 households on the waitlist for Calgary
Housing Company (Calgary, 2016). To be eligible
for community housing subsidies, a household
must fall below a given income threshold;
$39,000 for a bachelor unit, $46,000 for a one-
bedroom unit and $55,000 for a two-bedroom
unit. Renting a low-end apartment in Calgary
costs a typical single parent living on social
assistance 66% of their monthly income in 2015.
A couple with two children renting a low-end
two-bedroom apartment spend 55% of their
monthly social assistance income17 (University of
Calgary, 2017).
Early Childhood Development
Though Early Learning and Child Care is not
the only aspect we must consider concerning
ECD, it represents one of the most prominent
set of policies that have a direct, and often
immediate impact on children and families. When
considering child care fees, it is not unreasonable
to assume that some families face child care
costs that rival mortgage or rent payments. In
Calgary, child care median monthly fees (2017)
for infants is $1,250 (22 out of 28 of the major
cities, ascending in cost), for toddlers is $1,050
(16th out of 28), and for preschoolers is $1,000
(21st out of 28) (Macdonald, 2017). To be eligible
to receive child care subsidy, a couple family
must earn no more than $50,000 gross income
per year. A lone-parent family must earn no more
than $25,000 gross, per year. The maximum
subsidy amount is $546 per month for licensed,
full-time day care and $437 per month for
approved family day home (Alberta, 2018). With
the introduction of Alberta’s $25-per-day Early
Learning Centres (100 non-profit centres at the
time of writing) a family may possibly pay no
child care fees at all if they attend a participating
centre and receive the full subsidy amount.
A recent opinion piece by well-known experts in
the area of early childhood education and care
stated that gender equality in Canada would
remain elusive until a robust, public funding
model for child care is created (Friendly et al.,
2018). Early Learning and Child Care is only one
aspect of a system of policy and programming
that can help all of Alberta’s children develop
to their fullest potential. Like child intervention
and incarceration discussed earlier, low income
can be a powerful determinant for poor
developmental outcomes in the early years (e.g.,
toxic stress, unstable housing) and can often
lead to future periods of low income across
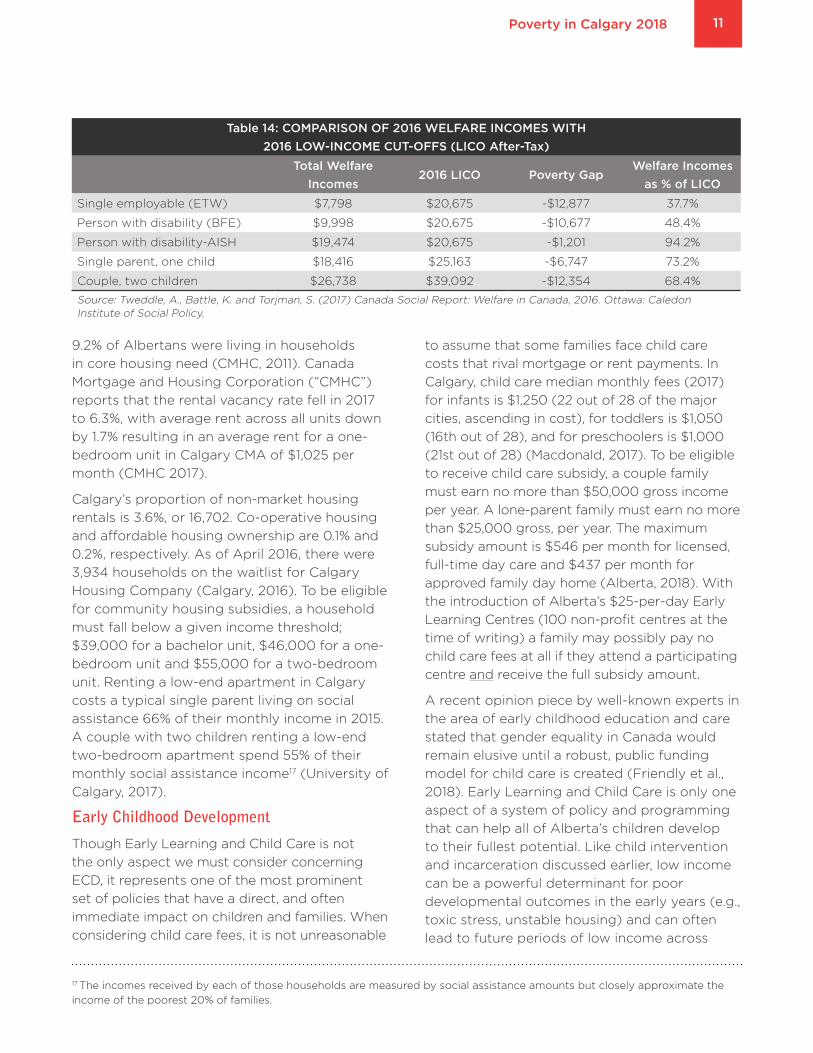
Table 14: COMPARISON OF 2016 WELFARE INCOMES WITH
2016 LOW-INCOME CUT-OFFS (LICO After-Tax)
Total Welfare
Incomes2016 LICO Poverty Gap
Welfare Incomes
as % of LICO
Single employable (ETW) $7,798 $20,675 -$12,877 37.7%
Person with disability (BFE) $9,998 $20,675 -$10,677 48.4%
Person with disability-AISH $19,474 $20,675 -$1,201 94.2%
Single parent, one child $18,416 $25,163 -$6,747 73.2%
Couple, two children $26,738 $39,092 -$12,354 68.4%
Source: Tweddle, A., Battle, K. and Torjman, S. (2017) Canada Social Report: Welfare in Canada, 2016. Ottawa: Caledon Institute of Social Policy.
17 The incomes received by each of those households are measured by social assistance amounts but closely approximate the
income of the poorest 20% of families.
Poverty in Calgary 2018 11
the lifetime of an individual (due to poor health
and lower education attainment, for example)18.
Scientific research shows that the early years
(from before birth to age five) are the most
critical period of human development and
that children’s early environments shape the
structure of their rapidly growing brains (ECD
Mapping Project, 2014).
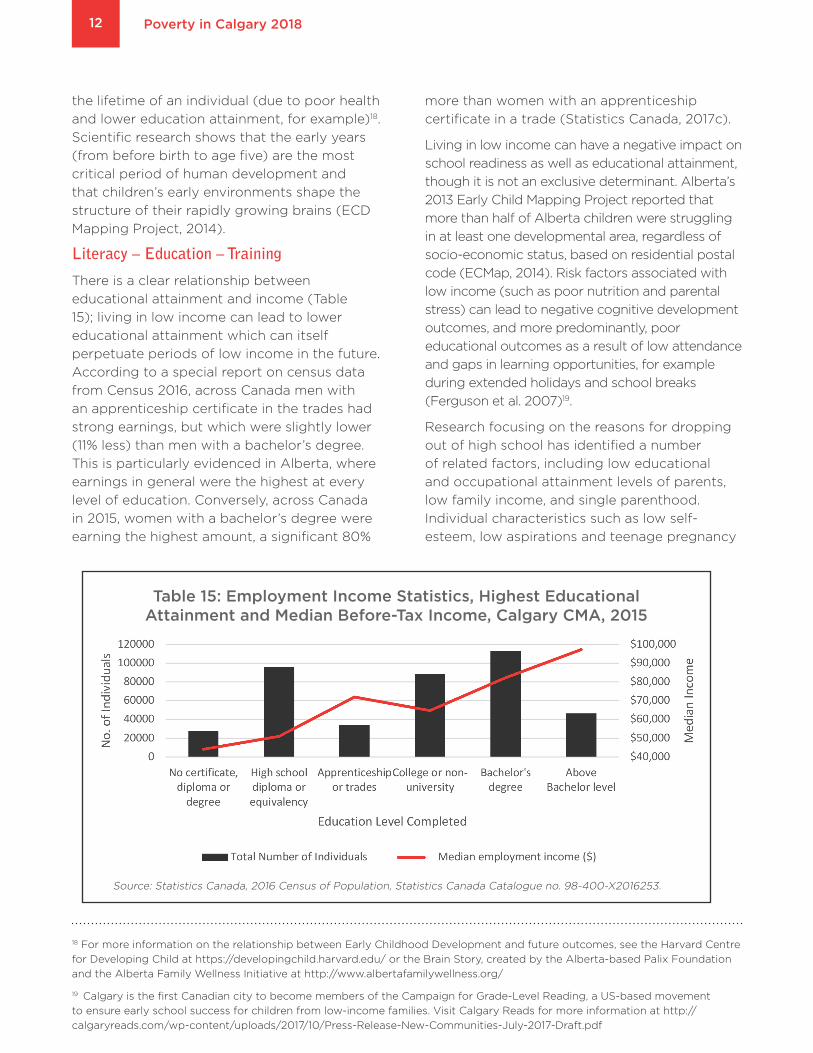
Literacy – Education – Training
There is a clear relationship between
educational attainment and income (Table
15); living in low income can lead to lower
educational attainment which can itself
perpetuate periods of low income in the future.
According to a special report on census data
from Census 2016, across Canada men with
an apprenticeship certificate in the trades had
strong earnings, but which were slightly lower
(11% less) than men with a bachelor’s degree.
This is particularly evidenced in Alberta, where
earnings in general were the highest at every
level of education. Conversely, across Canada
in 2015, women with a bachelor’s degree were
earning the highest amount, a significant 80%
more than women with an apprenticeship
certificate in a trade (Statistics Canada, 2017c).
Living in low income can have a negative impact on
school readiness as well as educational attainment,
though it is not an exclusive determinant. Alberta’s
2013 Early Child Mapping Project reported that
more than half of Alberta children were struggling
in at least one developmental area, regardless of
socio-economic status, based on residential postal
code (ECMap, 2014). Risk factors associated with
low income (such as poor nutrition and parental
stress) can lead to negative cognitive development
outcomes, and more predominantly, poor
educational outcomes as a result of low attendance
and gaps in learning opportunities, for example
during extended holidays and school breaks
(Ferguson et al. 2007)19.
Research focusing on the reasons for dropping
out of high school has identified a number
of related factors, including low educational
and occupational attainment levels of parents,
low family income, and single parenthood.
Individual characteristics such as low self-
esteem, low aspirations and teenage pregnancy
18 For more information on the relationship between Early Childhood Development and future outcomes, see the Harvard Centre
for Developing Child at https://developingchild.harvard.edu/ or the Brain Story, created by the Alberta-based Palix Foundation
and the Alberta Family Wellness Initiative at http://www.albertafamilywellness.org/
19 Calgary is the first Canadian city to become members of the Campaign for Grade-Level Reading, a US-based movement
to ensure early school success for children from low-income families. Visit Calgary Reads for more information at http://
calgaryreads.com/wp-content/uploads/2017/10/Press-Release-New-Communities-July-2017-Draft.pdf
Source: Statistics Canada, 2016 Census of Population, Statistics Canada Catalogue no. 98-400-X2016253.
Table 15: Employment Income Statistics, Highest Educational Attainment and Median Before-Tax Income, Calgary CMA, 2015
Poverty in Calgary 201812
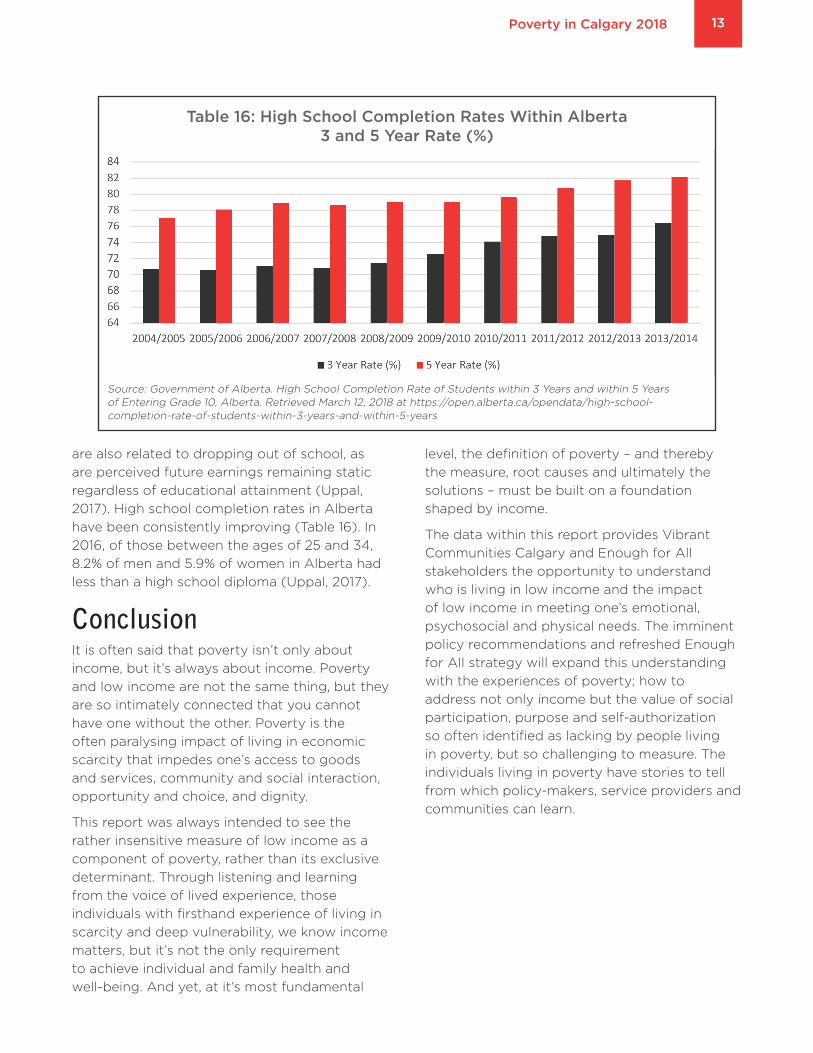
are also related to dropping out of school, as
are perceived future earnings remaining static
regardless of educational attainment (Uppal,
2017). High school completion rates in Alberta
have been consistently improving (Table 16). In
2016, of those between the ages of 25 and 34,
8.2% of men and 5.9% of women in Alberta had
less than a high school diploma (Uppal, 2017).
ConclusionIt is often said that poverty isn’t only about
income, but it’s always about income. Poverty
and low income are not the same thing, but they
are so intimately connected that you cannot
have one without the other. Poverty is the
often paralysing impact of living in economic
scarcity that impedes one’s access to goods
and services, community and social interaction,
opportunity and choice, and dignity.
This report was always intended to see the
rather insensitive measure of low income as a
component of poverty, rather than its exclusive
determinant. Through listening and learning
from the voice of lived experience, those
individuals with firsthand experience of living in
scarcity and deep vulnerability, we know income
matters, but it’s not the only requirement
to achieve individual and family health and
well-being. And yet, at it’s most fundamental
level, the definition of poverty – and thereby
the measure, root causes and ultimately the
solutions – must be built on a foundation
shaped by income.
The data within this report provides Vibrant
Communities Calgary and Enough for All
stakeholders the opportunity to understand
who is living in low income and the impact
of low income in meeting one’s emotional,
psychosocial and physical needs. The imminent
policy recommendations and refreshed Enough
for All strategy will expand this understanding
with the experiences of poverty; how to
address not only income but the value of social
participation, purpose and self-authorization
so often identified as lacking by people living
in poverty, but so challenging to measure. The
individuals living in poverty have stories to tell
from which policy-makers, service providers and
communities can learn.
Source: Government of Alberta. High School Completion Rate of Students within 3 Years and within 5 Years of Entering Grade 10, Alberta. Retrieved March 12, 2018 at https://open.alberta.ca/opendata/high-school-completion-rate-of-students-within-3-years-and-within-5-years
Table 16: High School Completion Rates Within Alberta 3 and 5 Year Rate (%)
Poverty in Calgary 2018 13
ReferencesAhmed, R. and Keenan, L. (2012) Beyond Survival: A qualitative study of the impact of homelessness and incarceration on Women’s Health. Edmonton: Homeward Trust.
Alberta (2017a) Child Intervention Statistics. Human Services, Government of Alberta. Retrieved March 12, 2018 from http://www.humanservices.alberta.ca/abuse-bullying/17395.html
Alberta (2017b). Quarterly AISH Profile, July 2017 to September 2017. Community and Social Services, Government of Alberta. Retrieved March 18 from https://www.alberta.ca/assets/documents/aish-caseload-profile-q2.pdf
Alberta (2017c). Alberta Minimum Wage Profile, October 2016 – September 2017. Jobs, Skills, Training and Labour: Government of Alberta. Retrieved April 12, 2018 from https://open.alberta.ca/dataset/3027b65e-16f4-4442-bfa4-0ea73a73ec49/resource/3805bf58-b21d-499e-b9e3-15c41cf9ce4c/download/alberta-minimum-wage-profile.pdf
Alberta (2017d). 2016 Core Needs Income Thresholds. Seniors and Housing: Government of Alberta. Retrieved April 11, 2018 from http://www.seniors-housing.alberta.ca/documents/2016%20Core%20Need%20Income%20Thresholds.pdf
Alberta (2018). Child Care Subsidy. Human Services, Government of Alberta. Retrieved March 2, 2018 from http://www.humanservices.alberta.ca/financial-support/15104.html
Battams, N. 2018. “A Snapshot of Family Diversity in Canada.” Statistical Snapshots. The Vanier Institute of the Family. Retrieved March 20, 2018 from www.vanierinstitute.ca/snapshot-family-diversity-canada-february-2018/
Calgary Interfaith Food Bank (2017) Primary Income Source, 2014 – 2017 Quarterly Breakdown. Data provided January 30, 2018.
Canada (2016) Shelter Capacity Report 2016 - Emergency Shelters and shelter beds by community. Employment and Social Development Canada, Government of Canada. Retrieved February 26, 2018 from https://www.canada.ca/en/employment-social-development/programs/communities/homelessness/publications-bulletins/shelter-capacity-2016.html#h2.5
Canada and Mortgage Housing Corporation (2011) Core Housing Need Status for the Population, by Selected Characteristics and Gender, Canada, Provinces, Territories, Metropolitan Areas, 2006, 2011, Alberta. Retrieved April 11, 2018 from https://www.cmhc-schl.gc.ca/en/hoficlincl/observer/observer_044.cfm
Canada and Mortgage Housing Corporation (2017) Rental Market Report, Calgary.
Canadian Payroll Association (2017) Survey of Employed Canadians. Retrieved March 15, 2018 from https://www.newswire.ca/news-releases/canadian-payroll-associations-2017-survey-finds-albertans-are-burdened-by-debt-despite-feeling-hopeful-about-economy-642856673.html
City of Calgary (2016) Housing in Calgary: An inventory of Housing Supply, 2015-2016. Retrieved March 12, 2018 from from http://www.calgary.ca/CSPS/CNS/Documents/Housing-in-Calgary-inventory-housing-supply.pdf
Conference Board of Canada (2013) Provincial and Territorial Ranking: Income Inequality. Retrieved May 4, 2018 from http://wtww.conferenceboard.ca/hcp/provincial/society/income-inequality.aspx
Early Child Development Mapping Project. (2014). How are our young children doing? Community profiles of early childhood development in Alberta. Edmonton, AB: ECMap, Community-University Partnership for the Study of Children, Youth and Families, University of Alberta.
Engle, P. L., & Black, M. M. (June 2008). The Effect of Poverty on Child Development and Educational Outcomes. Annals of the New York Academy of Sciences,1136(1), 243-256.
Ferguson, H., Bovaird, S., and Mueller, M. (2007) The Impact of Poverty on Educational Outcomes for Children. Paediatrics and Child Health, 2007 October, 12(8), 701-706.
Food Banks Canada (2016). HungerCount 2016. Toronto: Food Banks Canada.
Friendly, M., Prentice, S. and Ballantyne, M. (2018, March 8) No equality without universal child care. Policy Options. Retrieved April 12, 2018 from http://policyoptions.irpp.org/magazines/march-2018/no-equality-without-universal-child-care/?mc_cid=71504a540f&mc_eid=2986789d7a
Poverty in Calgary 201814
Green, D., Riddell, C., and St-Hilaire, F., (2016) Income Inequality in Canada: Driving Forces, Outcomes and Policy. In The Art of the State Volume V: Income Inequality: The Canadian Story. Montreal: Institute for Research on Public Policy.
Griffiths, C., Dandurand, Y., Murdoch D., (2007) Social Reintegration of Offenders and Crime Prevention. Ottawa: National Crime Prevention Centre.
MacDonald, D and Friendly, M. (2017) Time Out: Child Care Fees in Canada. Toronto: Canadian Centre for Policy Alternatives.
Ministry of Health (2006). Joint Special Report: Health and Well-being of Children in Care in British Columbia Report 1 on Health Services Utilization and Child Mortality. Office of Provincial Health Officer and Child and Youth Officer for British Columbia.
National Governors Association Centre for Best Practices, (2007). Issue Brief: State Policies to Help Youth Transition Out of Foster Care.
Office of the Child and Youth Advocate (2013) Where Do We Go From Here: Youth aging out of care, Special Report. Edmonton: Government of Alberta.
Social Policy Trends (2017) Housing Affordability for Families with Low Income Across Canada. Calgary, AB: The School of Public Policy, University of Calgary.
Statistics Canada (2012) Canadian Survey on Disability. Prevalence of disability for adults, by sex and age group, Alberta, 2012, Table 1.10.
Statistics Canada (2016a) Census of Population. Income Sources and Taxes (34) and Income Statistics (5A) for the Population Aged 15 Years and Over in Private Households of Census Metropolitan Areas, Tracted Census Agglomerations and Census Tracts. Statistics Canada Catalogue no. 98-400-X2016122.
Statistics Canada (2016) Distributions of household economic accounts, wealth indicators, Canada, regions and provinces annual. CANSIM Table 378-0155. Retrieved March 15, 2018.
Statistics Canada (2017) Table 111-0015 Characteristics of families, before-tax and after-tax low income status (based on census family low income measures, LIMs) by family type and family composition, annual. CANSIM (database).
Statistics Canada (2017a) Indigenous overrepresentation in the criminal justice system. Justfacts: Research and Statistics Division. Retrieved April 11, 2018 from http://www.justice.gc.ca/eng/rp-pr/jr/jf-pf/2017/jan02.html
Statistics Canada (2017c) Does education pay? A comparison of earnings by level of education in Canada and its provinces and territories. Census in Brief: Census 2016. Retrieved April 12, 2018 from http://www12.statcan.gc.ca/census-recensement/2016/as-sa/98-200-x/2016024/98-200-x2016024-eng.cfm?wbdisable=true
Uppal, S. (2017) Young Men and Women Without a High School Diploma. Statistics Canada: Insights on Canadian Society. Retrieved April 15, 2018 from http://www.statcan.gc.ca/pub/75-006-x/2017001/article/14824-eng.pdf
Vibrant Communities Calgary (2017) Calgary’s Living Wages: An Opportunity to reduce poverty. Retrieved March 20, 2018 from http://enoughforall.ca/wp-content/uploads/2017/06/LivingWageBrief_062117.pdf
Wall, K. (2017) Low Income Among Persons with a Disability in Canada. Ottawa: Statistics Canada. Retrieved April 11, 2018 from http://www.statcan.gc.ca/pub/75-006-x/2017001/article/54854-eng.htm
Wilkinson, R. G., & Pickett, K. (2010) The Sprit Level: Why greater equality makes societies stronger. New York: Bloomsbury Press.
Poverty in Calgary 2018 15
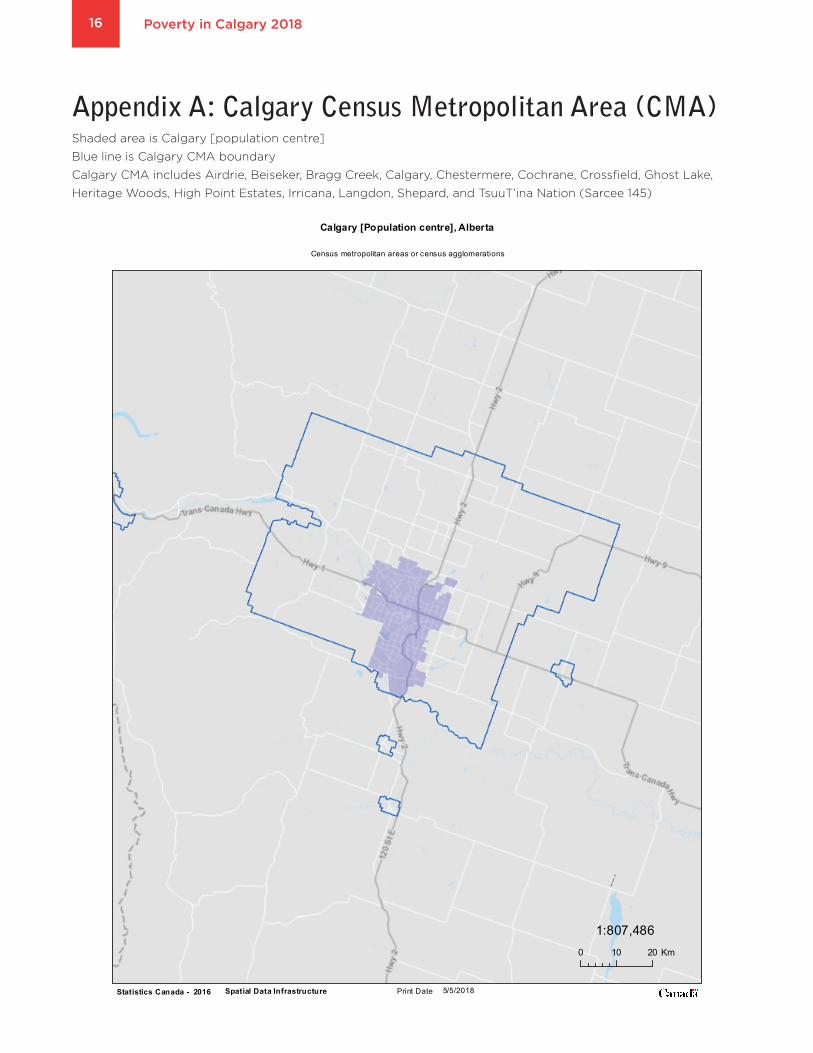
Appendix A: Calgary Census Metropolitan Area (CMA)Shaded area is Calgary [population centre]
Blue line is Calgary CMA boundary
Calgary CMA includes Airdrie, Beiseker, Bragg Creek, Calgary, Chestermere, Cochrane, Crossfield, Ghost Lake,
Heritage Woods, High Point Estates, Irricana, Langdon, Shepard, and TsuuT’ina Nation (Sarcee 145)
Print Date 5/5/2018
Census metropolitan areas or census agglomerations
Calgary [Population centre], Alberta
2016Statistics Canada - Spatial Data Infrastructure
0 10 20 Km
1:807,486
³
Poverty in Calgary 201816
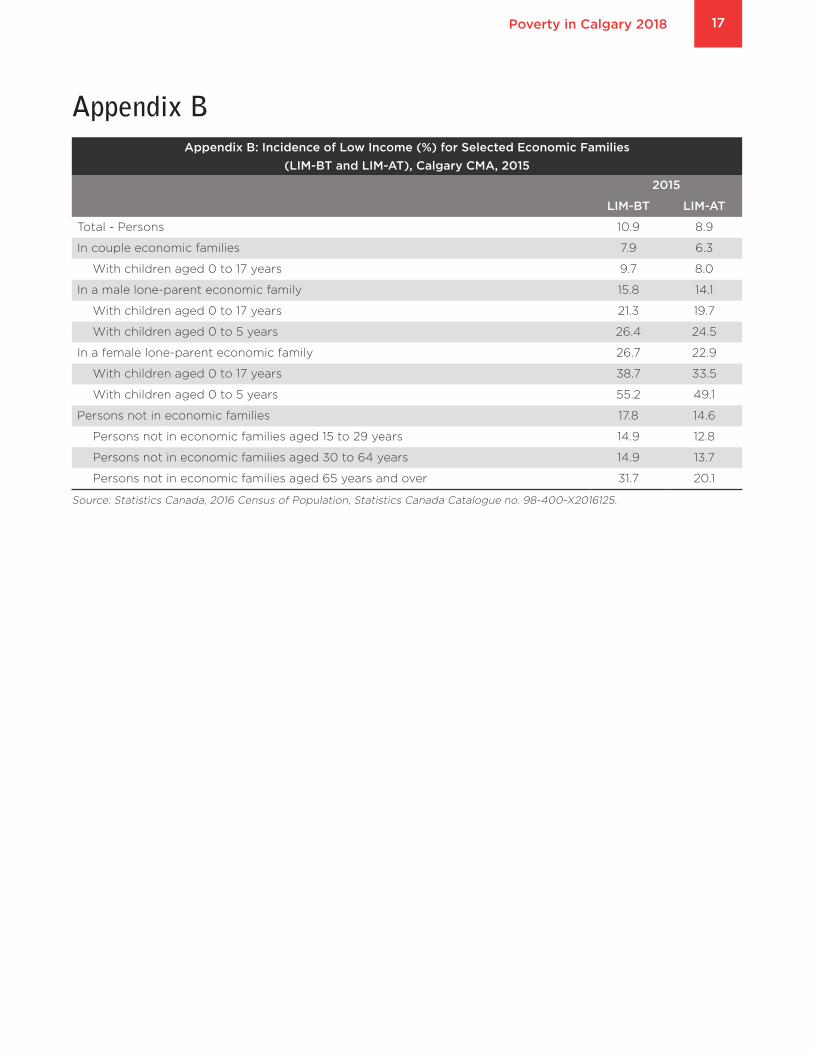
Appendix BAppendix B: Incidence of Low Income (%) for Selected Economic Families
(LIM-BT and LIM-AT), Calgary CMA, 2015
2015
LIM-BT LIM-AT
Total - Persons 10.9 8.9
In couple economic families 7.9 6.3
With children aged 0 to 17 years 9.7 8.0
In a male lone-parent economic family 15.8 14.1
With children aged 0 to 17 years 21.3 19.7
With children aged 0 to 5 years 26.4 24.5
In a female lone-parent economic family 26.7 22.9
With children aged 0 to 17 years 38.7 33.5
With children aged 0 to 5 years 55.2 49.1
Persons not in economic families 17.8 14.6
Persons not in economic families aged 15 to 29 years 14.9 12.8
Persons not in economic families aged 30 to 64 years 14.9 13.7
Persons not in economic families aged 65 years and over 31.7 20.1
Source: Statistics Canada, 2016 Census of Population, Statistics Canada Catalogue no. 98-400-X2016125.
Poverty in Calgary 2018 17

This report was written May, 2018 based
primarily on Census 2016 data.
400, 119 – 14 Street NW Calgary, Alberta T2N 1Z6
vibrantcalgary.com | [email protected]
Vibrant Communities Calgary (VCC) is a
non-profit organization seeking to engage
Calgarians in advocating long-term
strategies that address the root causes of
poverty in Calgary.
VCC is also the steward of Enough for All,
Calgary’s poverty reduction strategy.