Embed Size (px)
DESCRIPTION
Â
Citation preview
fact sheet
Poverty
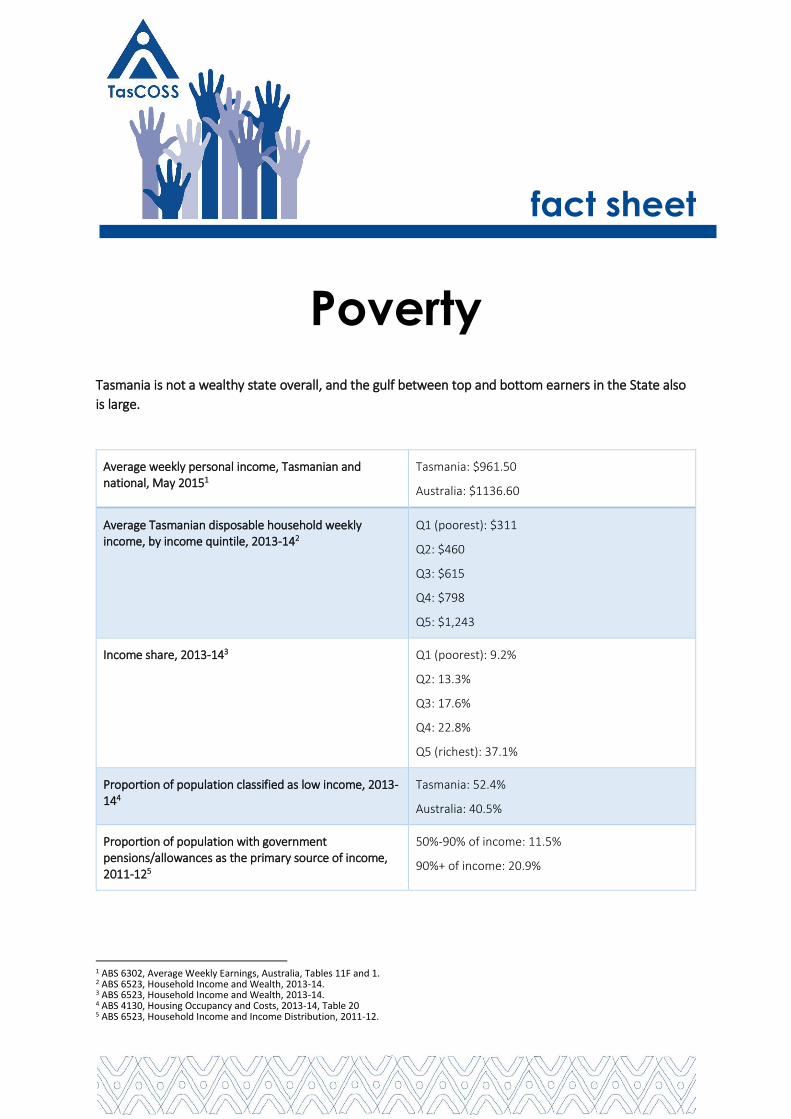
Tasmania is not a wealthy state overall, and the gulf between top and bottom earners in the State also
is large.
Average weekly personal income, Tasmanian and national, May 20151
Tasmania: $961.50
Australia: $1136.60
Average Tasmanian disposable household weekly income, by income quintile, 2013-142
Q1 (poorest): $311
Q2: $460
Q3: $615
Q4: $798
Q5: $1,243
Income share, 2013-143 Q1 (poorest): 9.2%
Q2: 13.3%
Q3: 17.6%
Q4: 22.8%
Q5 (richest): 37.1%
Proportion of population classified as low income, 2013-144
Tasmania: 52.4%
Australia: 40.5%
Proportion of population with government pensions/allowances as the primary source of income, 2011-125
50%-90% of income: 11.5%
90%+ of income: 20.9%
1 ABS 6302, Average Weekly Earnings, Australia, Tables 11F and 1. 2 ABS 6523, Household Income and Wealth, 2013-14. 3 ABS 6523, Household Income and Wealth, 2013-14. 4 ABS 4130, Housing Occupancy and Costs, 2013-14, Table 20 5 ABS 6523, Household Income and Income Distribution, 2011-12.
2
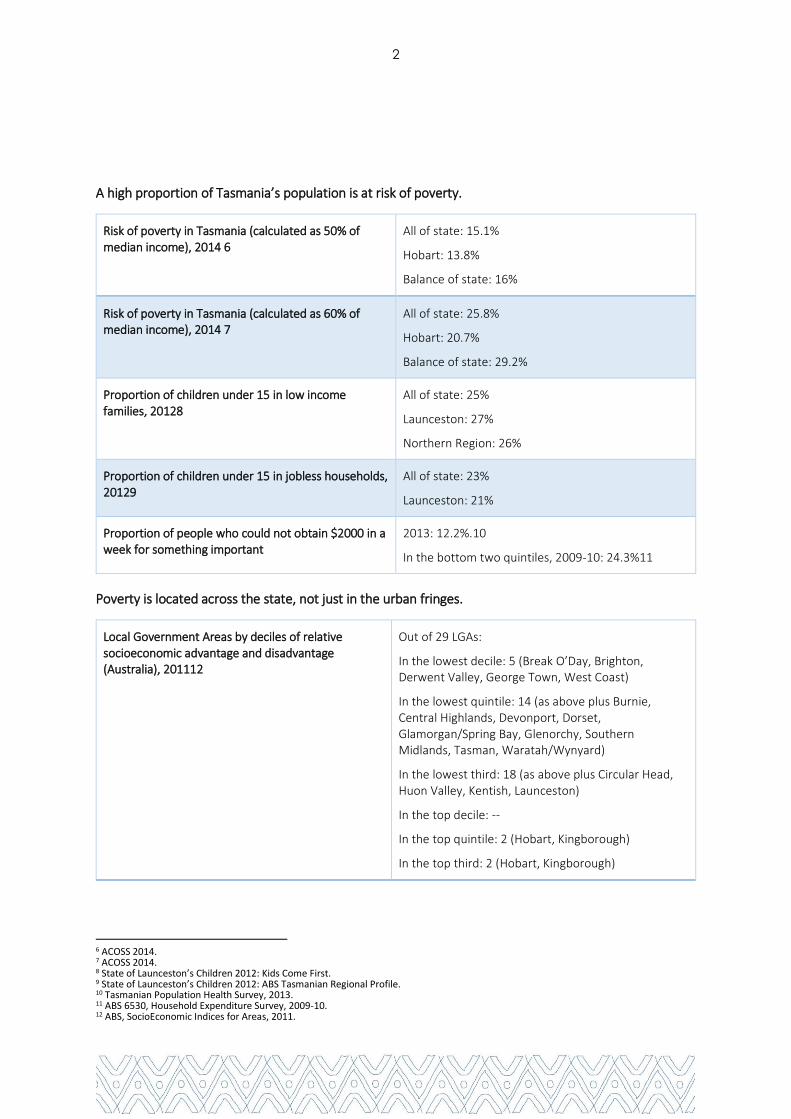
A high proportion of Tasmania’s population is at risk of poverty.
Risk of poverty in Tasmania (calculated as 50% of median income), 2014 6
All of state: 15.1%
Hobart: 13.8%
Balance of state: 16%
Risk of poverty in Tasmania (calculated as 60% of median income), 2014 7
All of state: 25.8%
Hobart: 20.7%
Balance of state: 29.2%
Proportion of children under 15 in low income families, 20128
All of state: 25%
Launceston: 27%
Northern Region: 26%
Proportion of children under 15 in jobless households, 20129
All of state: 23%
Launceston: 21%
Proportion of people who could not obtain $2000 in a week for something important
2013: 12.2%.10
In the bottom two quintiles, 2009-10: 24.3%11
Poverty is located across the state, not just in the urban fringes.
Local Government Areas by deciles of relative socioeconomic advantage and disadvantage (Australia), 201112
Out of 29 LGAs:
In the lowest decile: 5 (Break O’Day, Brighton, Derwent Valley, George Town, West Coast)
In the lowest quintile: 14 (as above plus Burnie, Central Highlands, Devonport, Dorset, Glamorgan/Spring Bay, Glenorchy, Southern Midlands, Tasman, Waratah/Wynyard)
In the lowest third: 18 (as above plus Circular Head, Huon Valley, Kentish, Launceston)
In the top decile: --
In the top quintile: 2 (Hobart, Kingborough)
In the top third: 2 (Hobart, Kingborough)
6 ACOSS 2014. 7 ACOSS 2014. 8 State of Launceston’s Children 2012: Kids Come First. 9 State of Launceston’s Children 2012: ABS Tasmanian Regional Profile. 10 Tasmanian Population Health Survey, 2013. 11 ABS 6530, Household Expenditure Survey, 2009-10. 12 ABS, SocioEconomic Indices for Areas, 2011.

3
Some groups are at a much higher risk of poverty than the average.
Personal and household weekly income by indigenous status, 2011
Median total personal income
Indigenous households: $395
Non-indigenous households: $503
Indigenous to non-indigenous ratio: 0.79
Median total household income:
Indigenous: $923
Non-indigenous: $949
Indigenous to non-indigenous ratio: 0.97
Persons per household:
Indigenous: 3.0
Non-indigenous: 2.4
If you on a low income, you are more likely to find it difficult to:
Find and stay in housing
Percentage of rental properties affordable to low-income renters, April 201513
1842 properties in total, of which were affordable:
For people on Newstart and Youth Allowance, including single parents with youngest children over 8: Between 4 and 12 properties in total across the state.
For parents with youngest children under 8: Between 1% (27) and 5% (85) properties across the state.
For people receiving the Aged Pension: Between 7% (128) and 15% (270) of properties across the state.
Proportion of low income renters paying more than 30% of income on housing, 2014. 14
33.8%
Seek medical help
Proportion of population deferring medical care due to cost, 201415
GP visit: 6.9%
Prescription medication: 8.0%
13 Anglicare Rental Affordability Snapshot 2015. 14 Report on Government Services 2015: Housing, Sector Overview, 2015, Table GA.5. 15 Report on Government Services 2015: Health, Sector Overview, Table E.5

4
If you live in a poor area, you are more likely to:
Be unwell and die earlier
Estimated rate per population aged 15+ with fair or poor self-assessed health, by quintile of socioeconomic disadvantage of area, 201116
Q1 (richest): 12.4%
Q5 (poorest): 26.9%
Estimated proportion of population with high or very high levels of psychological distress, 201117
Q1 (richest): 6.4%
Q5 (poorest): 13.0%
Median age at death, 201118 Q1 (richest): 82
Q5 (poorest): 78
Be unemployed or have parents who are unemployed
Unemployment, 201119 Q1 (richest): 3.5%
Q5 (poorest): 14.5%
Long-term (6+ months) unemployment, 201120 Q1 (richest): 3%
Q5 (poorest): 10.8%
Proportion of children in jobless households, 201121 Q1 (richest): 9.6%
Q5 (poorest): 26.6%
Have a child who is developmentally vulnerable, who is not participating in school full-time, or
who is not fully engaged in either education or work
Proportion of children classified as developmentally vulnerable on 2+ developmental domains, 201222
Q1 (richest): 7.6%
Q5 (poorest): 17.2%
Full-time participation in secondary school education at age 16, 201123
Q1 (richest): 78.7%
Q5 (poorest): 60.5%
Proportion of population aged 15-19 fully engaged in education or work24
Q1 (richest): 83.7%
Q5 (poorest): 73.5%
16 PHIDU 2015, Monitoring Inequality in Australia: Tasmania. 17 PHIDU 2015, Monitoring Inequality in Australia: Tasmania. 18 PHIDU 2015, Monitoring Inequality in Australia: Tasmania. 19 PHIDU 2015, Monitoring Inequality in Australia: Tasmania. 20 PHIDU 2015, Monitoring Inequality in Australia: Tasmania. 21 PHIDU 2012: 2011 Census. 22 www.aedc.gov.au/data, 2012 23 PHIDU 2015, Monitoring Inequality in Australia: Tasmania. 24 PHIDU 2015, Monitoring Inequality in Australia: Tasmania.

5
Unemployment by LGA, highest to lowest, March 201525
Brighton: 11.9%
Derwent Valley: 11.6%
Tasman: 11.5%
Break O’Day: 11.3%
George Town: 10.6%
Burnie: 9.7%
Glenorchy: 9.5%
West Coast: 9.3%
Devonport: 9.2%
Huon Valley: 9.2%
Central Highlands: 8.8%
Launceston: 8.4%
Kentish: 7.6%
Southern Midlands: 7.2%
Waratah/Wynyard: 7.1%
Glamorgan/Spring Bay: 6.9%
Flinders: 6.8%
Dorset: 6.7%
Central Coast: 6.5%
Sorell: 5.7%
Clarence: 5.4%
Northern Midlands: 5.2%
Latrobe: 5.2%
Circular Head: 4.9%
West Tamar: 4.7%
Meander Valley: 4.6%
Hobart: 4.3%
Kingborough: 3.8%
King Island: 2.8%
25 Department of Employment, Small Area Labour Markets, LGA data tables, March 2015.