Embed Size (px)
Citation preview

A National Statistics publication for Scotland
EQUALITY, POVERTY AND SOCIAL SECURITY
Poverty and Income Inequalityin Scotland: 2013/14

1
This publication presents annual estimates of the percentage and number of people, children, working age adults and pensioners living in low income households in Scotland. The estimates are used to monitor progress towards UK and Scottish Government targets to reduce poverty and income inequality. The data published for the first time here are for the financial year April 2013 to March 2014.
Poverty in 2013/14
Relative poverty in Scotland, before housing costs, decreased in 2013/14. Rates for children are the lowest since this series started in 1994/95. This reflects more people moving into employment, and increases in hours worked. In particular there was a shift from part-time employment to full-time employment for those on the lowest incomes.
However, after housing costs are accounted for poverty in Scotland has not decreased to the same extent. This is particularly true for families with children. This reflects rent values increasing at a faster rate than income, combined with changes to housing benefit eligibility, meaning little improvement in the standard of living.
Median income increased in Scotland in 2013/14 and was higher than UK median income. However, inflation continued to grow at a faster pace than earnings and the uprating of most benefits. Therefore increases in income have not necessarily resulted in improvements in people’s standard of living, and combined low income and child material deprivation has continued to increase.
Key points
All individuals:
14 per cent of people in Scotland were living in relative poverty, before housing costs (BHC), in 2013/14, a decrease from 16 per cent the previous year. This equates to 730 thousand people, 90 thousand fewer than in 2012/13.
After housing costs (AHC), 18 per cent of people in Scotland were living in relative poverty, a decrease from 19 per cent in 2012/13. This equates to 940 thousand, 60 thousand fewer than in 2012/13.
The decrease in 2013/14 continues the downward trend in relative poverty BHC in Scotland seen over the last decade, following the increase in 2012/13.
However, the rate of relative poverty AHC, remains above the level in 2010/11.

2
Child poverty:
14 per cent of children in Scotland were living in relative poverty BHC in 2013/14, a decrease from 19 per cent the previous year. This equates to 140 thousand children, 40 thousand fewer than in 2012/13.
After housing costs, 22 per cent of children in Scotland were living in relative poverty, unchanged from the previous year. This equates to 210 thousand children living in relative poverty AHC, 10 thousand fewer than in 2012/13.
The decrease in 2013/14 continues the downward trend in relative child poverty BHC over the last decade, following an increase in 2012/13. The rate of relative child poverty BHC is now at the lowest level since 1994/95.
However, there has been no change in the rate of relative child poverty after housing costs. While incomes have increased, standards of living have not necessarily improved.
In 2013/14, 13 per cent of children were living in combined low income and material deprivation, an increase from 11 per cent the previous year. This equates to 130 thousand children living in material deprivation, 20 thousand more than the previous year.
After housing costs, 14 per cent of children were living in combined low income and material deprivation, an increase from 12 per cent the previous year. This equates to 140 thousand children living in material deprivation, 20 thousand more than the previous year.
This increase continues the upward trend in child material deprivation seen over recent years.
Working age adult poverty:
14 per cent of working age adults in Scotland were living in relative poverty BHC in 2013/14, a decrease from 15 per cent the previous year. This equates to 440 thousand working age adults living in relative poverty BHC, 40 thousand fewer than in 2012/13.
After housing costs, 19 per cent of working age adults in Scotland were living in relative poverty, a decrease from 21 per cent the previous year. This equates to 600 thousand working age adults living in relative poverty AHC, 60 thousand fewer than in 2012/13.
The decrease in relative poverty BHC continues the gradual downward trend seen over the recent past, following an increase in working age poverty in 2012/13.
Relative working age poverty AHC, although recording a decrease, remains at levels seen in 2009/10. There have been changes to housing benefit eligibility since 2011/12, and rent values increasing faster than income, meaning standard of living has not necessarily improved for working age adults.

3
Pensioner poverty:
15 per cent of pensioners in Scotland were living in relative poverty BHC in 2013/14, unchanged from the previous year. This equates to 160 thousand pensioners in Scotland living in relative poverty BHC, 10 thousand more than in 2012/13.
After housing costs, 12 per cent of pensioners in Scotland were living in relative poverty, an increase from 11 per cent the previous year. This equates to 120 thousand pensioners were living in relative poverty AHC, the same number as the previous year.
In-work poverty:
In 2013/14, 48 per cent of working age adults in poverty BHC were living in working households, as were 56 per cent of children in poverty.
After housing costs, 50 per cent of working age adults in poverty were living in working households, as were 56 per cent of children.
While employment remains the best route out of poverty, employment is no longer a protection against poverty. While in-work poverty for working age adults and children showed a small decrease in 2013/14, the rate of in-work poverty remains at levels seen in recent years.
Income Inequality:
Median income in Scotland in 2013/14 was £24,000, equivalent to £460 per week. Median income in Scotland has increased in 2013/14, following three years of decreases.
In terms of income inequality, the percentage of income received by the lowest 3 income deciles in 2013/14 was 14 per cent, unchanged from 2012/13. There has been very little change in this measure of income inequality since 1998/99.
The Gini coefficient, which measures the degree of inequality in the household income distribution, in 2013/14 was 30. This is a decrease from 31 in 2012/13. Income inequality, as measured by the Gini coefficient, has remained at these levels over the last four years.

4
Poverty in Scotland - A headline measure:
To date, the Scottish Government have focused on poverty before housing costs as the headline measure of poverty in Scotland. This was because these were the measures set in the Child Poverty Act (2010).
The way in which housing costs are treated when measuring income has some important implications for poverty analysis and conclusions about the anti-poverty effects of policy reforms. This is because the number of people counted as poor (e.g. with income falling below a threshold) depends crucially on the income concept adopted. This publication presents relative and absolute poverty before and after housing costs, material deprivation before and after housing costs, and in-work poverty before and after housing costs.
The Scottish Government will talk with stakeholders over the summer to gather views on which poverty measure should be the headline measure for poverty in Scotland.
Please Note:
In this publication, all statistics are based on net income. That is, income after taxes and including benefits. Income is calculated at the household level, and reflects the income available to the household after taxes (including council tax) are paid and all benefits and tax credits have been received. Unless otherwise stated, incomes for previous years are in 2013/14 prices (real prices).
All figures in this publication are rounded to the nearest 10 thousand individuals or whole percentage point. In some cases calculations based on the unrounded figures do not match those based on the rounded ones. Unless specifically stated, annual changes in the numbers and percentages of people in poverty presented in the body of this report are not statistically significant.
Poverty is measured at the household level. If household income is below the poverty threshold, all people within the household are in poverty. This is based on the assumption that income is shared equally across all members of the household, and they have the same standard of living.
The estimates presented in this publication are based on a sample survey and are therefore subject to sampling error. Confidence intervals are a measure of sampling error. A 95 per cent confidence interval for an estimate is the range that contains the ‘true’ figure on average 19 times out of 20 if sampling error were the only source of errors. Many of the changes referred to in this publication are within the width of the confidence limits and caution should be exercised when looking at year on year comparisons, with longer term trends often giving a clearer picture. More information can be found here:
Scottish Government - Income and Poverty Statistics - Methodology

5
Presentation of key points and definitions
Each section starts with a magenta box providing the key facts for that section. Where relevant, additional information is provided in a blue box at the end of each section. This includes important definitions and links to National Indicators relating to poverty and income inequality on Scotland Performs.
Changes to statistics 2013/14:
This publication includes changes to the statistics compared with previous publications:
1. Personal Independence Payment (PIP): 2013/14 is the first year of data that includes the receipt of PIP. PIP is a benefit to help with the extra costs caused by living with long-term ill health or a disability, for those aged between 16 and 64. The amount of benefit received depends how the condition affects the recipient rather than the condition itself.
2. Pensioners are defined as all those adults above State Pension age. Working age adults are defined as all adults up to the state pension age. Prior to April 2010, women reached the state pension age at 60. Between April 2010 and March 2016 the state pension age for women is increasing to 63 and will then increase to 65 between April 2016 to November 2018. At this point the state pension age for men and women will be the same. The changes do not affect the state pension age for men, which remains at 65. Therefore, as with the previous three reports, the age groups covered by the analysis of working age adults and pensioners will change for the 2013/14 report. The pensioner material deprivation statistics will continue to be based on pensioners aged 65 and over.
Changes to the publication 2013/14:
This publication includes statistics not included in previous publications. Combined low income and child material deprivation and in-work poverty estimates after housing costs have been included in the 2013/14 publication for the first time.

6
Contents
Key points ................................................................................................................ 1
Poverty before and after housing costs ................................................................ 8
Chapter 1: Poverty ................................................................................................ 10
1.1 People in poverty ........................................................................................... 10
1.2 Child poverty .................................................................................................. 14
1.3 Working age adult poverty ............................................................................. 21
1.4 Pensioner poverty .......................................................................................... 24
1.5 In-work relative poverty.................................................................................. 29
Chapter 2: Income Inequality and the distribution of income .......................... 31
2.1 Income Inequality – the Gini coefficient ......................................................... 31
2.2 Income distribution......................................................................................... 32
2.3 Income thresholds ......................................................................................... 34
2.4 Trends in income distributions ....................................................................... 37
Chapter 3: Household characteristics and income distribution ...................... 43
3.1 Household composition ................................................................................. 43
3.2 Household economic status .......................................................................... 45
Annexes .................................................................................................................. 47
Annex 1: Tables ................................................................................................... 48
Annex 2: Data Sources and Definitions .............................................................. 62
Data sources .................................................................................................... 62
What does the HBAI measure? ....................................................................... 62
Housing Costs ................................................................................................. 63
Definitions ........................................................................................................ 63
Annex 3: Welfare Reform in 2013/14 .................................................................. 69
Annex 4: Where to Find More Information .......................................................... 74

7
8
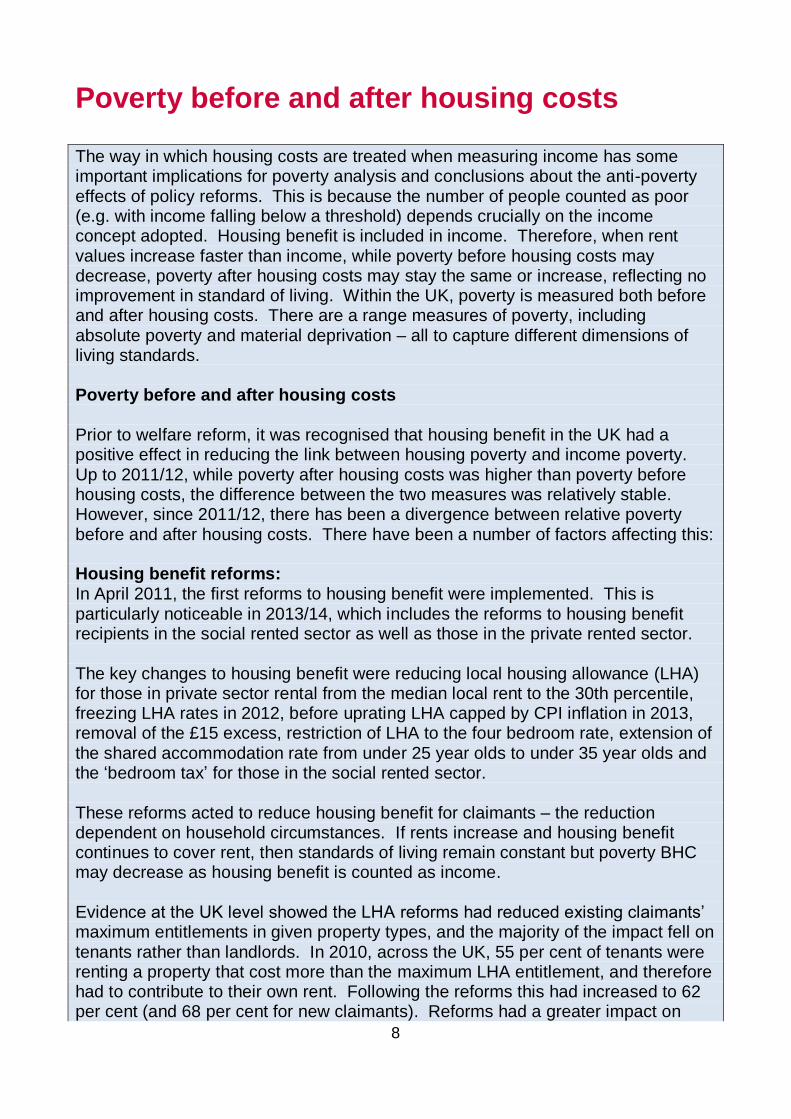
Poverty before and after housing costs
The way in which housing costs are treated when measuring income has some important implications for poverty analysis and conclusions about the anti-poverty effects of policy reforms. This is because the number of people counted as poor (e.g. with income falling below a threshold) depends crucially on the income concept adopted. Housing benefit is included in income. Therefore, when rent values increase faster than income, while poverty before housing costs may decrease, poverty after housing costs may stay the same or increase, reflecting no improvement in standard of living. Within the UK, poverty is measured both before and after housing costs. There are a range measures of poverty, including absolute poverty and material deprivation – all to capture different dimensions of living standards. Poverty before and after housing costs Prior to welfare reform, it was recognised that housing benefit in the UK had a positive effect in reducing the link between housing poverty and income poverty. Up to 2011/12, while poverty after housing costs was higher than poverty before housing costs, the difference between the two measures was relatively stable. However, since 2011/12, there has been a divergence between relative poverty before and after housing costs. There have been a number of factors affecting this: Housing benefit reforms: In April 2011, the first reforms to housing benefit were implemented. This is particularly noticeable in 2013/14, which includes the reforms to housing benefit recipients in the social rented sector as well as those in the private rented sector. The key changes to housing benefit were reducing local housing allowance (LHA) for those in private sector rental from the median local rent to the 30th percentile, freezing LHA rates in 2012, before uprating LHA capped by CPI inflation in 2013, removal of the £15 excess, restriction of LHA to the four bedroom rate, extension of the shared accommodation rate from under 25 year olds to under 35 year olds and the ‘bedroom tax’ for those in the social rented sector. These reforms acted to reduce housing benefit for claimants – the reduction dependent on household circumstances. If rents increase and housing benefit continues to cover rent, then standards of living remain constant but poverty BHC may decrease as housing benefit is counted as income. Evidence at the UK level showed the LHA reforms had reduced existing claimants’ maximum entitlements in given property types, and the majority of the impact fell on tenants rather than landlords. In 2010, across the UK, 55 per cent of tenants were renting a property that cost more than the maximum LHA entitlement, and therefore had to contribute to their own rent. Following the reforms this had increased to 62 per cent (and 68 per cent for new claimants). Reforms had a greater impact on

9
those who had higher entitlements to start with. These include claimants in higher rent areas, lone parents, 25-34 year olds included in the extended scope of the Shared Accommodation Rate (SAR), and those affected by the national LHA caps and the abolition of the five-room rate. Increases in rental values: For households in employment, and so not in receipt of full housing benefit, poverty after housing costs increases if rent increases more quickly than earnings. In Scotland over the period 2010/11 to 2013/14, private sector rents (for a 2 bedroom property) have increased by 9 per cent, while those in social rented sector (registered social landlords only) have increased by 11 per cent. These increases in rental values are significantly higher than increases in gross annual earnings (slightly less than 6 per cent increase over the same period), and most working age benefits have been uprated in line with earnings in recent years. However, it is important to note the level of social rents remains significantly below the level of private rents, so social rents are still helping households to be better off than if they were in the private sector. Little change in mortgage interest rates: Households further up the income distribution are more likely to own their own homes – either outright or with a mortgage. Mortgage interest rates have remained flat over the period. As relative poverty measures whether the standard of living for low income households (who are more likely to be in rented accommodation) is keeping pace with middle income households, tenure affects this. Housing costs for those in rental accommodation have been increasing at a faster rate than mortgage interest rates and income, meaning housing costs for low income households have been increasing more quickly than those for middle income households.

10
Chapter 1: Poverty
1.1 People in poverty
Key points:
Relative Poverty before housing costs:
• 14 per cent of people in Scotland were living in relative poverty BHC, in
2013/14, a decrease from 16 per cent the previous year.
• In 2013/14, there were 730 thousand people in Scotland living in relative
poverty BHC, 90 thousand fewer than in 2012/13. After housing costs are taken into account:
• 18 per cent of people in Scotland were living in relative poverty, a decrease
from 19 per cent in 2012/13.
• In 2012/13, there were 940 thousand people living in relative poverty AHC, 60
thousand fewer than in 2012/13.
Chart 1A – Relative Poverty – All Individuals
Source: HBAI dataset, DWP. See Annex 1 (Tables A1 and A2) for the figures behind these charts.
Confidence intervals for relative can be found in Confidence Intervals Surrounding Key Poverty Estimates.
0
5
10
15
20
25
30
35
Pe
rce
nta
ge
of
Ind
ivid
ua
ls
After Housing Costs
Before Housing Costs
18
14

11
Relative poverty BHC for all individuals decreased to 14 per cent in 2013/14.
The change in the number and percentage of people in relative poverty BHC between 2012/13 and 2013/14 is not statistically significant. Longer term trends often offer a better indication of significant changes. Following a decrease from 18 per cent in 2003/04, poverty rates BHC remained unchanged at 17 per cent from 2004/05 to 2009/10. The level of relative poverty BHC then decreased to 14 per cent over the two years to 2011/12. Following an increase to 16 per cent in 2012/13, the rate of relative poverty BHC for all people in 2013/14 has returned to levels seen in 2011/12.
After Housing Costs have been taken into account, 18 per cent of people in Scotland were in relative poverty.
The change in the number and percentage of people in relative poverty AHC between 2012/13 and 2013/14 is not statistically significant. Relative poverty AHC had followed a similar trend to relative poverty BHC, remaining relatively unchanged between 2003/04 and 2009/10, followed by a decrease from 19 per cent to 16 over the two years to 2011/12. Relative poverty AHC also decreased in 2013/14, following an increase in 2012/13, but the gap between relative poverty before and after housing costs has widened and is now larger than it has been for more than decade (4 percentage points).
Chart 1B – Absolute Poverty – All Individuals
Source: HBAI dataset, DWP. See Annex 1 (Tables A1 and A2) for the figures behind these charts.
Confidence intervals for relative and absolute poverty can be found in Confidence Intervals Surrounding Key Poverty
Estimates.
0
5
10
15
20
25
30
35
Pe
rce
nta
ge
of
Ind
ivid
ua
ls
After Housing Costs
Before Housing Costs
20
15

12
Absolute poverty BHC, a measure of whether the lowest income households are keeping pace with inflation, has decreased to 15 per cent in 2013/14, a 2 percentage point decrease compared with 2012/13. In 2013/14 there were 800 thousand people living in absolute poverty BHC, 80 thousand fewer than the previous year. As absolute poverty is based on the poverty threshold in 2010/11, and incomes have decreased in real terms since then, absolute poverty rates are higher than relative poverty rates.
Absolute poverty after housing costs are taken into account has also decreased. In 2013/14, 20 per cent of people in Scotland were in absolute poverty AHC, a 1 percentage point decrease compared with 2012/13. In 2013/14, there were 1.03 million people living in absolute poverty AHC in Scotland, 70 thousand fewer than the previous year.
The gap between absolute poverty before and after housing costs has widened to 5 percentage points in 2013/14, an increase from 2 percentage points in 2010/11.
Commentary:
Relative poverty BHC decreased in 2013/14. This reflects increases in employment in Scotland and particularly increases in hours worked. There was a move into employment with increases in the number of working households in Scotland. For those already in employment, there has been a shift from part-time employment to full-time employment. 2013/14 also saw increases in hourly wages across Scotland, especially for those in lower-paid employment.
There was an increase in the personal tax allowance in 2013/14, and increases in working age benefits were largely in line with increases in earnings (but below inflation).
These factors have a varying impact on the rate of poverty with some, such as increasing the personal tax allowance, mitigating the impact of others, such as welfare reform implemented over the last three years. The net effect however is a decrease in relative poverty, following a move into employment and increases in hours worked.
There was an increase in median income in Scotland in 2013/14 compared with the previous year and most incomes deciles also saw either an increase or no change; the exception being the top decile, which decreased. The largest increases in 2013/14 were for those in the bottom two income deciles.

13
The Scottish Government currently uses two main indicators of low-income poverty, both of which reveal slightly different information about changes in poverty over time. These indicators are relative and absolute poverty. Relative poverty: Relative poverty is a measure of whether the incomes of the poorest are increasing in line with middle income households. In this report, individuals are said to be in relative poverty if they are living in households whose equivalised income is below 60 per cent of UK median income in that year. Relative low income rates fall if household income for the poorest households increases faster than median income. In 2013/14, the relative poverty threshold for a couple with no children was an income of £272 per week BHC from all sources (see Annex 2 for further information on income definitions). For a couple with children the threshold would be higher and for a single person (without children) the threshold would be lower. After housing costs, the relative poverty threshold in 2013/14 was £232 per week. Absolute poverty: Absolute poverty is a measure of whether income for the lowest income households are keeping pace with inflation. Individuals are said to be living in absolute poverty if they are living in households whose equivalised income is below 60 per cent of the (inflation adjusted) median income in 2010/11. In 2013/14 the absolute poverty threshold for a couple with no children was an income of £280 per week BHC from all sources (see Annex 2 for further information on income definitions). After housing costs, the absolute poverty threshold in 2013/14 was £242 per week. Scotland Performs: The Scottish Government’s National Indicator 35 is to “decrease the proportion of individuals living in poverty”: http://www.gov.scot/About/Performance/scotPerforms/indicator/poverty This is measured using relative poverty before housing costs.

14
1.2 Child poverty
Key points: Relative Poverty before housing costs:
• 14 per cent of children in Scotland were living in relative poverty BHC in
2013/14, a decrease from 19 per cent the previous year. This decrease is statistically significant.
• In 2013/14, there were 140 thousand children in Scotland living in relative
poverty BHC, 40 thousand fewer than in 2012/13. After housing costs are taken into account:
• After housing costs, 22 per cent of children in Scotland were living in relative
poverty, unchanged from the previous year.
• In 2013/14, there were 210 thousand children living in relative poverty AHC, 10
thousand fewer than in 2012/13. Low Income and Material Deprivation:
• In 2013/14, 13 per cent of children were living in combined low income BHC
and material deprivation, an increase from 11 per cent the previous year. This equates to 130 thousand, 20 thousand more than the previous year.
• This increase continues the upward trend in child material deprivation seen over
recent years.
• After housing costs, 14 per cent of children in Scotland were living in combined
low income AHC and material deprivation, an increase from 12 per cent the previous year. This equates to 140 thousand children, 20 thousand more than the previous year.

15
Chart 2A – Relative Poverty - Children
Source: HBAI dataset, DWP. See Annex 1 (Table A1) for the figures behind these charts.
Notes:
1. A version of these charts showing the Child Poverty Act targets can be found in Annex 1, Chart A1.
2. Confidence intervals for relative child poverty can be found in Confidence Intervals Surrounding Key Poverty Estimates.
Relative child poverty BHC decreased to 14 per cent in 2013/14.
The change in the number and percentage of children in relative poverty BHC between 2012/13 and 2013/14 is statistically significant. Relative child poverty BHC saw a decreasing trend from 23 per cent in 2003/04 to 15 per cent in 2011/12. Following an increase to 19 per cent in 2012/13, child poverty in Scotland has fallen to 14 per cent in 2013/14. This is the lowest level of child poverty recorded by this series, which started in 1994/95.
After Housing Costs have been taken into account, 22 per cent of children in Scotland were in relative poverty.
Relative child poverty AHC had followed a similar trend to relative child poverty BHC, showing a decreasing trend from 26 per cent in 2003/04 to 19 per cent in 2011/12. However, following an increase to 22 per cent in 2012/13, relative child poverty AHC has remained at that level and did not see the decrease in the latest year that is seen before housing costs are taken into consideration. Because of this, the gap between relative child poverty before and after housing costs is now 8 percentage points, an increase from 3 percentage points the previous year.
0
5
10
15
20
25
30
35
40
Pe
rce
nta
ge
of
Ch
ild
ren
After Housing Costs
Before Housing Costs
22
14

16
Chart 2B – Absolute Poverty – Children
Source: HBAI dataset, DWP. See Annex 1 (Table A2) for the figures behind these charts.
Confidence intervals for absolute child poverty can be found in Confidence Intervals Surrounding Key Poverty Estimates.
Absolute child poverty BHC has decreased to 16 per cent in 2013/14, a 4 percentage point decrease compared with 2012/13. In 2013/14 there were150 thousand children living in absolute poverty BHC, 50 thousand fewer than the previous year.
Absolute child poverty has also decreased after housing costs are taken into account. In 2013/14, 24 per cent of children in Scotland were in absolute poverty AHC, a 1 percentage point decrease compared with 2012/13. In 2013/14, there were 240 thousand children living in absolute poverty AHC in Scotland, 10 thousand fewer than the previous year.
As with relative child poverty, the gap between absolute poverty before and after housing costs has widened. In 2013/14, the gap was 8 percentage points, an increase from 5 percentage points in 2012/13.
0
5
10
15
20
25
30
35
40
Pe
rce
nta
ge
of
Ch
ild
ren
After Housing Costs
Before Housing Costs
24
16

17
Chart 2C – Material deprivation and low income BHC combined and relative poverty before housing costs - Children
Source: HBAI dataset, DWP. See Annex 1 (Tables A1 and A3) for the figures behind these charts.
Notes:
1. A version of these charts showing the Child Poverty Act targets can be found in Annex 1, Chart A1.
2. Changes in the material deprivation questions in 2010/11 created a break in the series. Data for 2010/11 onwards is not
directly comparable with that prior to 2010/11. Further information is available in Annex_2.
0
5
10
15
20
25
30
35
40
Pe
rce
nta
ge
of
Ch
ild
ren
Child poverty before housing costs
Material Deprivation BHC (old indicator)
Material Deprivation BHC (new indicator)
14
13

18
Chart 2D –Material deprivation and low income AHC combined and relative poverty after housing costs - Children
Source: HBAI dataset, DWP. See Annex 1 (Tables A1 and A4) for the figures behind these charts.
Notes:
1. A version of these charts showing the Child Poverty Act targets can be found in Annex 1, Chart A1.
2. Changes in the material deprivation questions in 2010/11 created a break in the series. Data for 2010/11 onwards is not
directly comparable with that prior to 2010/11. Further information is available in Annex_2.
In 2013/14, 13 per cent of children in Scotland were living in combined low income BHC and material deprivation. This continues the increasing trend over recent years, with 40 thousand more children living in combined low income BHC and material deprivation than in 2011/12.
14 per cent of children in Scotland were living in combined low income AHC and material deprivation. This continues the increasing trend in child material deprivation and low income AHC seen over recent years, with 30 thousand more children living in combined low income AHC and material deprivation than in 2011/12.
Commentary:
Despite decreases in child poverty before housing costs, poverty after housing costs remains high and there is a trend emerging of increasing material deprivation for those on low incomes.
0
5
10
15
20
25
30
35
40
Pe
rce
nta
ge
of
Ch
ild
ren
Child poverty after housing costs
Material Deprivation AHC (old indicator)
Material Deprivation AHC (new indicator)
22
14

19
Over the last decade, the proportion of children in Scotland living in relative poverty BHC had decreased by 8 percentage points from 23 per cent in 2003/04 to 15 per cent in 2011/12, before increasing to 19 per cent in 2012/13. This has decreased to 14 per cent in 2013/14.
Much of the fall in relative child poverty before housing costs in 2013/14 reflects the improved economic circumstances. The latest year has seen increases in employment and a shift from part-time employment to full-time employment. There has also been an increase in lone parent employment rates in Scotland. Employment remains the best route out of poverty, and increases in employment, particularly full-time employment, have increased household income for families with children.
While benefits and earnings increased at about the same rate, but below inflation, increases in employment, particularly for families with children, have increased household income. Additionally, the increase in the personal tax allowance increased net income for those in employment (and earning above the threshold).
However, despite increases in income, child poverty rates after housing costs have not decreased in 2013/14. Changes to housing benefit and increases in both private sector and social sector rents greater than increases in earnings mean that while incomes increased, there was not necessarily any improvement in standards of living.

20
Material Deprivation and Low Income Combined Poverty Indicator:
Combined low income and child material deprivation is an additional way of measuring living standards and refers to the inability of households to afford basic goods and activities that are seen as necessities in society. It is a more direct measure of poverty than income alone, as it captures changes in standard of living. Material deprivation is calculated from a suite of questions in the Family Resources Survey about whether people can afford to buy certain items and participate in leisure or social activities. This measure is applied to households with incomes below 70 per cent of UK median income (£317 per week) to create the 'material deprivation and low income combined' indicator. This indicator aims to provide a measure of children's living standards which, unlike relative and absolute poverty, is not solely based on income. For more detail about this indicator see Annex 2. Child Poverty Act:
The 2010 Child Poverty Act, which the UK parliament is required to report on, includes 4 indicators of child poverty. Included in this section are 3 of these indicators at Scotland level: • relative poverty BHC, • absolute poverty BHC, • material deprivation and low income BHC combined. There is also a persistent poverty indicator in the Act. It is expected that statistics to measure this target will be available at the end of 2015. Information on the targets for the Child Poverty Act can be found in Annex 1. Scotland Performs: The Scottish Government’s National Indicator 36 is to “reduce children’s deprivation”: http://www.gov.scot/About/Performance/scotPerforms/indicator/childdeprivation This is measured using the material deprivation and low income BHC combined poverty indicator.

21
1.3 Working age adult poverty
Key points: Relative Poverty before housing costs:
• 14 per cent of working age adults in Scotland were living in relative poverty
BHC in 2013/14, a decrease from 15 per cent the previous year.
• In 2013/14, there were 440 thousand working age adults in Scotland living in
relative poverty BHC, 40 thousand fewer than in 2012/13. After housing costs are taken into account:
• 19 per cent of working age adults in Scotland were living in relative poverty, a
decrease from 21 per cent the previous year.
• In 2013/14, there were 600 thousand working age adults living in relative
poverty AHC, 60 thousand fewer than in 2012/13.
Chart 3A - Relative Poverty – Working Age Adults
Source: HBAI dataset, DWP. These figures are also presented in Annex 1 (Table A1).
Confidence intervals for relative working age adult poverty can be found in Confidence Intervals Surrounding Key Poverty
Estimates.
Relative poverty BHC for working age adults decreased to 14 per cent in 2013/14. The change in the number and percentage of working age adults in relative poverty BHC between 2012/13 and 2013/14 is not statistically significant. The trend for working age adults in relative poverty BHC has been gradually
0
5
10
15
20
25
30
35
Perc
en
tag
e o
f W
ork
ing
Ag
e A
du
lts
After Housing Costs
Before Housing Costs
19
14

22
decreasing over the last decade with poverty rates before housing costs decreasing from 16 per cent a decade ago to 13 per cent in 2011/12, before increasing again.
After Housing Costs have been taken into account, 19 per cent of working age adults in Scotland were in relative poverty. The change in the number and percentage of working age adults in relative poverty AHC between 2012/13 and 2013/14 is not statistically significant. Relative poverty AHC had followed a similar trend to relative poverty BHC, remaining between 17 and 19 per cent between 2003/04, before increasing to 21 per cent in 2012/13. In 2013/14, it has returned to 19 per cent. As with relative poverty for other groups, the gap between poverty rates before and after housing costs has increased in recent years. The gap had been 3 percentage points for the 3 years to 2009/10 before widening to 6 percentage points in 2012/13. The gap decreased to 5 percentage points in 2013/14.
Chart 3B - Absolute Poverty – Working Age Adults
Source: HBAI dataset, DWP. These figures are also presented in Annex 1 (Table A2).
Confidence intervals for absolute working age adult poverty can be found in Confidence Intervals Surrounding Key Poverty
Estimates.
Absolute poverty for working age adults BHC has decreased to 15 per cent in 2013/14, a 1 percentage point decrease compared with 2012/13. In 2013/14 there were 480 thousand working age adults living in absolute poverty BHC, 30 thousand fewer than the previous year.
Absolute poverty after housing costs are taken into account has also decreased. In 2013/14, 20 per cent of people in Scotland were in absolute poverty AHC, a 2 percentage point decrease compared with 2012/13. In 2013/14, there were 650 thousand people living in absolute poverty AHC in Scotland, 60 thousand fewer than the previous year.
0
5
10
15
20
25
30
35
Perc
en
tag
e o
f W
ork
ing
Ag
e A
du
lts
After Housing Costs
Before Housing Costs
20
15
23
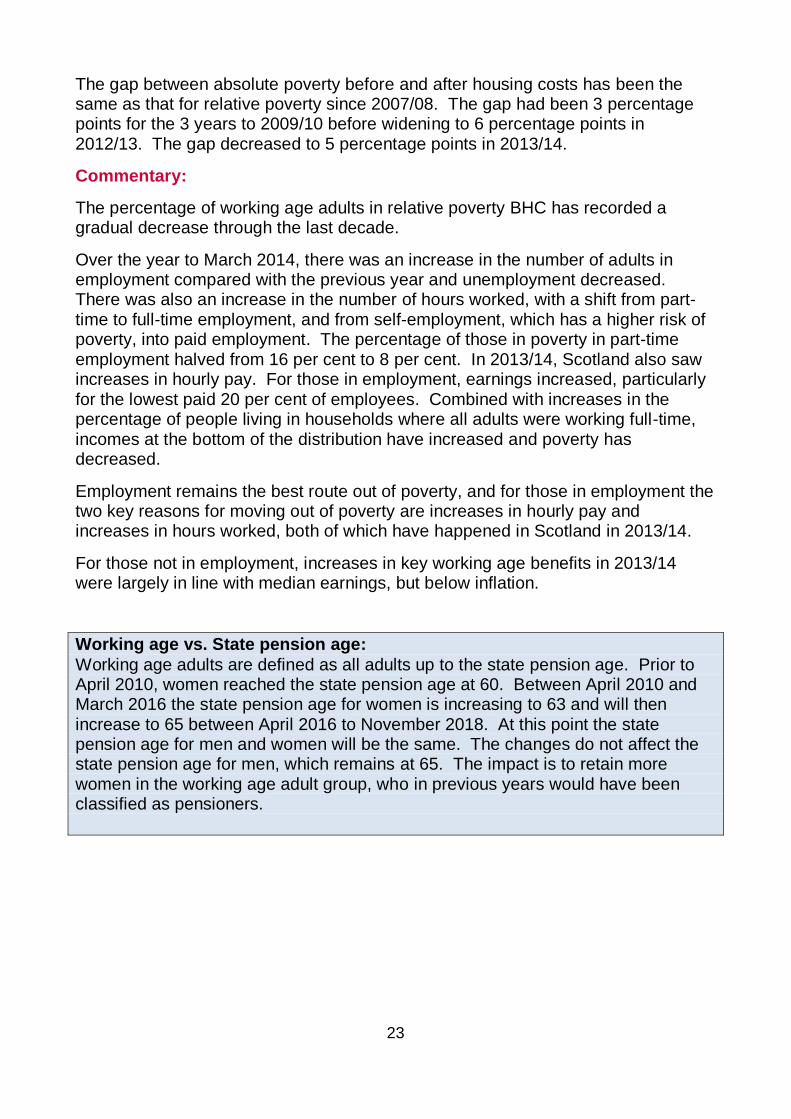
The gap between absolute poverty before and after housing costs has been the same as that for relative poverty since 2007/08. The gap had been 3 percentage points for the 3 years to 2009/10 before widening to 6 percentage points in 2012/13. The gap decreased to 5 percentage points in 2013/14.
Commentary:
The percentage of working age adults in relative poverty BHC has recorded a gradual decrease through the last decade.
Over the year to March 2014, there was an increase in the number of adults in employment compared with the previous year and unemployment decreased. There was also an increase in the number of hours worked, with a shift from part-time to full-time employment, and from self-employment, which has a higher risk of poverty, into paid employment. The percentage of those in poverty in part-time employment halved from 16 per cent to 8 per cent. In 2013/14, Scotland also saw increases in hourly pay. For those in employment, earnings increased, particularly for the lowest paid 20 per cent of employees. Combined with increases in the percentage of people living in households where all adults were working full-time, incomes at the bottom of the distribution have increased and poverty has decreased.
Employment remains the best route out of poverty, and for those in employment the two key reasons for moving out of poverty are increases in hourly pay and increases in hours worked, both of which have happened in Scotland in 2013/14.
For those not in employment, increases in key working age benefits in 2013/14 were largely in line with median earnings, but below inflation.
Working age vs. State pension age:
Working age adults are defined as all adults up to the state pension age. Prior to April 2010, women reached the state pension age at 60. Between April 2010 and March 2016 the state pension age for women is increasing to 63 and will then increase to 65 between April 2016 to November 2018. At this point the state pension age for men and women will be the same. The changes do not affect the state pension age for men, which remains at 65. The impact is to retain more women in the working age adult group, who in previous years would have been classified as pensioners.

24
1.4 Pensioner poverty
Key points: Relative Poverty before housing costs:
• 15 per cent of pensioners in Scotland were living in relative poverty BHC in
2013/14, unchanged from the previous year.
• In 2013/14, there were 160 thousand pensioners in Scotland living in relative
poverty BHC, 10 thousand more than in 2012/13. After housing costs are taken into account:
• 12 per cent of pensioners in Scotland were living in relative poverty AHC, an
increase from 11 per cent the previous year.
• In 2013/14, 120 thousand pensioners were living in relative poverty AHC, the
same number as the previous year. Material Deprivation:
• In 2013/14, 9 per cent of pensioners were living in material deprivation, an
increase from 8 per cent the previous year. In 2013/14, there were 80 thousand pensioners in Scotland living in material deprivation, 10 thousand more than the previous year.
The majority of pensioners own their own home, so for this reason the preferred measure of low income for pensioners is based on incomes measured AHC. Examining pensioners’ incomes compared to others after deducting housing costs allows for more meaningful comparisons of income between working age people and pensioners, and the pensioner population over time.

25
Chart 4A – Relative Poverty and Material Deprivation - Pensioners
Source: HBAI dataset, DWP. These figures are also presented in Annex 1 (Tables A1 and A5).
Confidence intervals for relative pensioner poverty can be found in Confidence Intervals Surrounding Key Poverty
Estimates.
Notes:
1. Pensioner material deprivation is not solely based on affordability and so should not be compared directly with
measures of income-related poverty.
2. Pensioner material deprivation is included for those aged 65 and over only and therefore is not the same population as
relative and absolute poverty measures.
Relative poverty BHC for pensioners was 15 per cent in 2013/14.
The change in the number of pensioners in relative poverty BHC between 2012/13 and 2013/14 is not statistically significant. Pensioner relative poverty BHC decreased from 22 per cent in 2003/04 to a low of 14 per cent in 2011/12 and has remained stable since then.
After Housing Costs have been taken into account, 12 per cent of pensioners in Scotland were in relative poverty.
The change in the percentage of pensioners in relative poverty AHC between 2012/13 and 2013/14 is not statistically significant. Relative pensioner poverty AHC, having been higher than relative poverty BHC in 2002/03, decreased faster than relative pensioner poverty BHC. Relative pensioner poverty AHC decreased from 25 per cent in 2002/03 to 11 per cent in 2008/09 and has been lower than relative poverty BHC since 2003/04. It has remained stable since 2008/09.
Pensioner material deprivation increased to 9 per cent in 2013/14, a 1 percentage point increase on the previous year. Having decreased from 10 per cent in 2009/10 to 7 per cent in 2010/11, there has been a small increase since then to 2013/14, but still below the level seen in 2009/10.
0
5
10
15
20
25
30
35
40P
erc
en
tag
e o
f P
en
sio
ne
rs After Housing Costs
Before Housing Costs
Material Deprivation
12
15
9

26
Chart 4B - Absolute Poverty – Pensioners
Source: HBAI dataset, DWP. These figures are also presented in Annex 1 (Table A2).
Confidence intervals for absolute pensioner poverty can be found in Confidence Intervals Surrounding Key Poverty
Estimates.
Absolute pensioner poverty BHC has increased to 17 per cent in 2013/14, a 1 percentage point increase compared with 2012/13. In 2013/14 there were 170 thousand pensioners living in absolute poverty BHC, the same as in 2012/13.
Absolute poverty after housing costs are taken into account has also increased. In 2013/14, 14 per cent of pensioners in Scotland were in absolute poverty AHC, a 1 percentage point increase compared with 2012/13. In 2013/14, there were 140 thousand pensioners living in absolute poverty AHC in Scotland, the same as in 2012/13.
Unlike for other groups of the population, the gap between absolute poverty before and after housing costs has narrowed in recent years to 3 percentage points in 2013/14, a decrease from 7 percentage points in 2007/08. Between 2004/05 and 2009/10, absolute pensioner poverty AHC was between 5 and 7 percentage points lower than absolute pebsioner poverty BHC. This gap narrowed from 2010/11 onwards.
Commentary:
Over the last decade, the proportion of pensioners in Scotland in relative poverty BHC has fallen 7 percentage points from 22 per cent in 2003/04 to 15 per cent in 2013/14. However, poverty rates for pensioners have been relatively stable since 2008/09.
Households containing pensioners at the lower end of the income distribution generally received a larger proportion of their income from benefits and a smaller proportion from other sources. The Basic State Pension (BSP) increased by 2.5
0
5
10
15
20
25
30
35
40P
erc
en
tag
e o
f P
en
sio
ne
rs After Housing Costs
Before Housing Costs
14
17

27
per cent and Pension Credit Guarantee Credit increased by 1.9 per cent, larger than increases in other benefits and tax credits but still below the level of RPI inflation in 2013/14 (2.9 per cent). While increases in earnings contributed to the decrease in poverty rates for other groups, pensioner poverty remained unchanged due to the relative importance of BSP and other benefits to pensioner incomes at the bottom of the income distribution.
Median income BHC for families with children has decreased every year since 2009/10. While median income BHC for pensioners has also shown decreases over the same period, the decreases have been smaller than that for families with children. Median income for families with children has fallen by 11 per cent since 2009/10, compared with a 5 per cent fall in pensioner median income, meaning in 2013/14 median income for families with children was similar to that for pensioners.
State pension age: Pensioners are defined as all those adults above State Pension age. Prior to April 2010, women reached the state pension age at 60. Between April 2010 and March 2016 the state pension age for women is increasing to 63 and will then increase to 65 between April 2016 to November 2018. At this point the state pension age for men and women will be the same. The changes do not affect the state pension age for men, which remains at 65. Therefore, as with the previous three reports, the age groups covered by the analysis pensioner poverty will change for the 2013/14 report. The impact is that more women will remain in the working age adult group, who in previous years would have been classified as pensioners. The pensioner material deprivation statistics will continue to be based on pensioners aged 65 and over.

28
Pensioner Material Deprivation Indicator:
Pensioner material deprivation is an additional way of measuring living standards for pensioners. It focuses on access to specific goods, services and experiences. It is used to explore a broader definition of pensioner poverty and captures both financial and non-financial reasons for being in material deprivation. Pensioner material deprivation captures whether it is health or disability, or if someone is available to help them, that prevents access to goods and services, rather than solely low income. This measure is based on a set of goods, services and experiences, judged using academic research to be the best discriminators of deprivation. Pensioners are asked if they have an item (or access to a service) and to give a reason if they do not have it. Their responses are then used to judge whether or not they are materially deprived. It is similar to the child material deprivation and low income combined indicator (which is presented in Charts 2C and 2D) but has some important differences:
• Differences in the set of items asked about, e.g. pensioners are not asked if
they can afford school trips.
• Pensioners are presented with a greater variety of reasons for not having a
particular item, whereas households with children are simply asked whether they can afford an item they do not have. Pensioners are able to say if they are prevented from having it due to ill health, disability or lack of support from other people. These additions reflect that deprivation can occur because of ill health, disability or social isolation, and not just for financial reasons.
• The pensioner “material deprivation” indicator is not combined with household
income information to produce a combined indicator, as is done with the child deprivation indicator. This is because for pensioners, the concept of material deprivation is broad and very different from low income, so it is appropriate to present it as a separate measure.
For these reasons, pensioner material deprivation cannot be directly compared to the child material deprivation and low income measure. More background on pensioner material deprivation is given in Annex 2, and the following technical note on the DWP website gives further information, including the list of questions which are asked to pensioners: https://www.gov.uk/government/publications/households-below-average-income-hbai-technical-note-on-pensioner-material-deprivation.

29
1.5 In-work relative poverty
Key points:
• In 2013/14, 48 per cent of working age adults in poverty BHC were living in
working households, as were 56 per cent of children in poverty.
• In 2013/14, 50 per cent of working age adults in poverty AHC were living in
working households, as were 56 per cent of children in poverty.
Chart 5A – Percentage of children and working age adults in poverty BHC, living in a household with at least one adult in employment
Source: HBAI dataset, DWP. These figures are also presented in Annex 1 (Table A6).
0
10
20
30
40
50
60
70
Pe
rce
nta
ge
of
tho
se
in
po
ve
rty
Children
Working Age Adults
48
56

30
Chart 5B – Percentage of children and working age adults in poverty AHC, living in a household with at least one adult in employment
Source: HBAI dataset, DWP. These figures are also presented in Annex 1 (Table A7).
Commentary:
In-work poverty BHC in Scotland decreased in 2013/14, with 210 thousand working age adults in in-work poverty BHC - a decrease of 40 thousand compared with 2012/13. Just under half (48 per cent) of working age adults in poverty BHC were living in working households in 2013/14.
The number of children living in poverty BHC who were in working households has also decreased in the latest year, with 80 thousand children in Scotland living in working households in 2013/14. There were 30 thousand fewer children in in-work poverty BHC in 2013/14 compared with the previous year, returning to the number seen in 2011/12. However, over half (56 per cent) of children in poverty BHC in Scotland in 2013/14 were living in working households.
In-work poverty AHC decreased for working age adults but not for children. In 2013/14, child in-work poverty AHC remained at 56 per cent while working age adult in-work poverty BHC decreased from 56 to 50 per cent.
While the overall number of children living in relative poverty BHC has fallen over recent years, a greater proportion were living in working households. The fact that there remain 80 thousand children in in-work poverty BHC despite the overall number dropping means they make up a larger percentage of those in poverty BHC.
0
10
20
30
40
50
60
70
Pe
rce
nta
ge
of
tho
se
in
po
ve
rty
Children
Working Age Adults
50
56
31
The two key reasons for moving out of in-work poverty are increases in hourly pay and increases in hours worked. In 2013/14, there were increases in hourly pay, particularly for the lowest paid 20 per cent of employees, and a shift from part-time employment to full-time employment, particularly for women. For men there has been a shift from self-employment, which has a higher risk of poverty, to paid employment.
In-work poverty:
‘In-work poverty’ refers to those individuals living in households where at least one member of the household is working (either full or part-time) but where the household income is below the relative poverty threshold. This measure is calculated on income before housing costs and after housing costs. This group contains non-working household members such as children and non-working partners.
Chapter 2: Income Inequality and the
distribution of income
2.1 Income Inequality – the Gini coefficient
Key points:
• The Gini coefficient, which measures the degree of inequality in household
income, was 30 in 2013/14. This is a decrease from 31 in 2012/13, mainly due to increases in incomes at the bottom of the distribution and decreases at the top.
• Income inequality, as measured by the Gini coefficient, has remained largely
unchanged over the last four years.
The Gini coefficient is a measure of how equally income is distributed across the population. It takes a value between 0 and 100 with 0 representing perfect equality where every person has the same income. The larger the Gini coefficient, the more people towards the top of the income distribution have a greater share of overall income with a value of 100 representing the case where one individual has all the income. In practice, the proportion of overall income going to each individual increases gradually across the income distribution.
For Scotland, the Gini coefficient has been between 30 and 34 over the last decade. In 2013/14, the Gini coefficient for Scotland was 30, a 1 percentage point decrease compared with 2012/13.

32
Chart 6 – Inequality of household income as measured by the Gini coefficient
Source: HBAI dataset, DWP. These figures are also presented in Annex 1 (Table A14).
Income inequality in Scotland increased gradually until the onset of the recession. In 2010/11, income for the top 10 per cent fell, resulting in a reduction in income inequality. It has remained largely flat since then, with a small decrease in 2013/14 due to increases in incomes at the bottom of the distribution and decreases at the top.
2.2 Income distribution
Key points:
• The percentage of income received by the lowest 3 income deciles in 2013/14
was 14 per cent, unchanged from 2012/13. There has been very little change in this measure of income inequality since 1998/99.
0
10
20
30
40
30

33
This section provides information that relates to the Scottish Government’s Solidarity Purpose Target which is “to increase overall income and the proportion of income earned by the three lowest income deciles as a group by 2017”. More information can be found at the following link:
http://www.gov.scot/About/Performance/scotPerforms/purpose/solidarity
Chart 7 shows the percentage of total income received by the three lowest income deciles (the thirty per cent of the population with the lowest incomes), from 1998/99 to 2013/14. It also shows the percentage of total income received by the three highest income deciles. This is another measure of how equally income is distributed across the population.
Chart 7 – Percentage of income going to the bottom and top three deciles
Source: HBAI dataset, DWP.
Commentary:
In 2013/14, the percentage of income received by households in the bottom 3 deciles was 14 per cent, unchanged from the previous 2 years.
Having dropped from 53 per cent to 51 per cent between 2009/10 and 2010/11, the percentage of income received by households in the top three income deciles has remained unchanged since then.
There has been no significant change in income inequality between 2012/13 and 2013/14 using this measure. Over the longer term it can be seen that there has been very little change in this indicator since 1998/99, with the percentage of income received by the bottom 3 deciles remaining between 13 and 15 per cent.
14 13 13 14 14 14 14 14 14 13 13 13 15 14 14 14
51 53 53 51 51 51 50 51 52 53 53 53 51 51 51 51
0
10
20
30
40
50
60
70
80
90
100
Pe
rce
nta
ge
of
pe
op
le
Top 3 Deciles
Middle 4 Deciles
Bottom 3 Deciles

34
Deciles / decile points:
Deciles (or decile points) are the income values which divide the Scottish population, when ranked by income, into ten equal-sized groups. Therefore nine decile points are needed in order to form the ten groups. Decile is also often used as a shorthand term for decile group; for example ‘the bottom decile’ is used to describe the bottom ten per cent of the income distribution. Decile groups: These are groups of the population defined by the decile points. The lowest decile group is the ten per cent of the population with the lowest incomes. The second decile group contains individuals with incomes above the lowest decile point but below the second decile point.
2.3 Income thresholds
Key points:
• Median income in Scotland in 2013/14 was £24,000, equivalent to £460 per
week. Median income in Scotland has increased in 2013/14, following three years of decreases.
• The poverty threshold BHC in 2013/14 was £14,200, equivalent to £272 per
week. This was the same as the previous two years, meaning any changes in relative poverty reflect genuine changes in income and are not due to changes in UK median income.
• A couple with no children with a combined income of over £36,300 (after tax
and benefits) would be in the highest income 20 per cent of the population. With an income over £44,300 they would be in the top 10 per cent.
Most of the income figures in this publication are based on equivalised income. One consequence of the equivalisation process is that there are different poverty thresholds for households of different sizes and compositions. To help readers understand the figures in this publication, Table 1 below presents some commonly used income thresholds, before equivalisation, for households of different sizes. The incomes presented elsewhere in this report use the value for “Couple with no children” as the standard, and all other household types are adjusted to reflect their different household composition. Table 2 shows the same information after housing costs have been taken into account.

35
Table 1 - Income thresholds (£) for different household types before housing costs (income after tax and transfers) – 2013/14
Single person
with no children Couple with no
children
Single person with children
aged 5 and 14
Couple with children aged 5
and 14 weekly annual weekly annual weekly annual weekly annual
UK median income (before housing costs) 304 15,800 453 23,600 544 28,400 693 36,100 Scottish median income (before housing costs) 308 16,100 460 24,000 551 28,800 703 36,700 60% of UK median income (before housing costs) - relative poverty threshold
182 9,500 272 14,200 326 17,000 416 21,700
60% of inflation adjusted 2010/11 UK median income (before housing costs) - absolute poverty threshold
188 9,800 280 14,600 336 17,500 428 22,300
Scottish 1st income decile 163 8,500 243 12,700 292 15,200 372 19,400 Scottish 2nd income decile 202 10,500 301 15,700 361 18,800 460 24,000 Scottish 3rd income decile 234 12,200 350 18,200 420 21,900 535 27,900 Scottish 4th income decile 267 13,900 399 20,800 479 25,000 611 31,800 Scottish 5th income decile 308 16,100 460 24,000 551 28,800 703 36,700 Scottish 6th income decile 350 18,300 523 27,300 628 32,700 800 41,700 Scottish 7th income decile 401 20,900 599 31,200 719 37,500 917 47,800 Scottish 8th income decile 466 24,300 695 36,300 834 43,500 1064 55,500 Scottish 9th income decile 569 29,700 849 44,300 1019 53,100 1299 67,700
Source: HBAI dataset, DWP.
Note: to create ten decile groups only nine decile points are needed to split the population.

36
Table 2 - Income thresholds (£) for different household types after housing costs (income after tax and transfers) – 2013/14
Single person
with no children Couple with no
children
Single person with children
aged 5 and 14
Couple with children aged 5
and 14 weekly annual weekly annual weekly annual weekly annual
UK median income (after housing costs) 259 13,500 386 20,100 464 24,200 591 30,800 Scottish median income (after housing costs) 275 14,300 411 21,400 493 25,700 628 32,800 60% of UK median income (after housing costs) - relative poverty threshold
155 8,100 232 12,100 278 14,500 355 18,500
60% of inflation adjusted 2010/11 UK median income (after housing costs) - absolute poverty threshold
162 8,500 242 12,600 291 15,100 370 19,300
Scottish 1st income decile 119 6,200 178 9,300 213 11,100 272 14,200 Scottish 2nd income decile 163 8,500 244 12,700 292 15,200 373 19,400 Scottish 3rd income decile 198 10,300 296 15,400 355 18,500 453 23,600 Scottish 4th income decile 234 12,200 349 18,200 419 21,800 534 27,800 Scottish 5th income decile 275 14,300 411 21,400 493 25,700 628 32,800 Scottish 6th income decile 313 16,300 468 24,400 561 29,300 715 37,300 Scottish 7th income decile 361 18,800 539 28,100 646 33,700 824 43,000 Scottish 8th income decile 423 22,100 631 32,900 757 39,500 966 50,400 Scottish 9th income decile 532 27,700 794 41,400 953 49,700 1215 63,300
Source: HBAI dataset, DWP.
Note: to create ten decile groups only nine decile points are needed to split the population.

37
2.4 Trends in income distributions
Key points:
• Median household income increased in 2013/14, following three years of
decreases.
• Median household income for working age adults increased in 2013/14,
following three years of decreases. However median income for households with children decreased in 2013/14, the fourth consecutive annual decrease. Pensioner median household income decreased in 2013/14, following an increase in the previous year.
• In 2013/14, the bottom two deciles saw the largest increase in income
compared to the previous year. However, they were still lower than in 2011/12 due to the large decreases in 2012/13.
• Incomes increased or stayed the same at all deciles apart from the top decile,
which decreased in 2013/14. The top decile returned to the same level as in 2011/12 having seen the largest increase in 2012/13.
Chart 8A – Median weekly household income in Scotland (in 2013/14 prices)
Source: HBAI dataset, DWP. These figures are also presented in Annex 1 (Table A8).
0
100
200
300
400
500
600
£
Before Housing Costs
After Housing Costs
£411
£460

38
Chart 8B – Median weekly household income BHC in Scotland for
children, working age adults and pensioners (in 2013/14 prices)
Chart 8C – Median weekly household income AHC in Scotland for
children, working age adults and pensioners (in 2013/14 prices)
Source: HBAI dataset, DWP. These figures are also presented in Annex 1 (Table A9).
0
100
200
300
400
500
600
£
Working Age Adults
Children
Pensioners
£501
£402
£403
0
100
200
300
400
500
600
£
Working Age Adults
Pensioners
Children
£439
£348
£392
39
In 2013/14, median household income was £460 per week, an increase of £6 compared with 2012/13. This is the first increase in median income in Scotland since 2009/10. Median income had been increasing for the 10 years to 2009/10 , then decreased for three years to 2012/13. The increase in median income in 2013/14 brings it back to the level seen in 2003/04 but still below the peak in 2009/10. All incomes are quoted in 2013/14 prices.
Commentary:
There was a gradual increase in median equivalised weekly household income BHC in Scotland to £489 in 2009/10. This was followed by 3 years of decreasing median incomes to £454 in 2012/13. Median income then increased to £460 in 2013/14 but this was smaller than the decrease in 2012/13 so the median income remained below the level of 2011/12.
The pattern is similar for median equivalised weekly household income AHC in Scotland, which was £343 in 1998/99, increasing to £442 in 2009/10, followed by annual decreases to 2012/13. Median income AHC increased in 2013/14 to £411, above the level in 2011/12 but below the level in 2010/11.
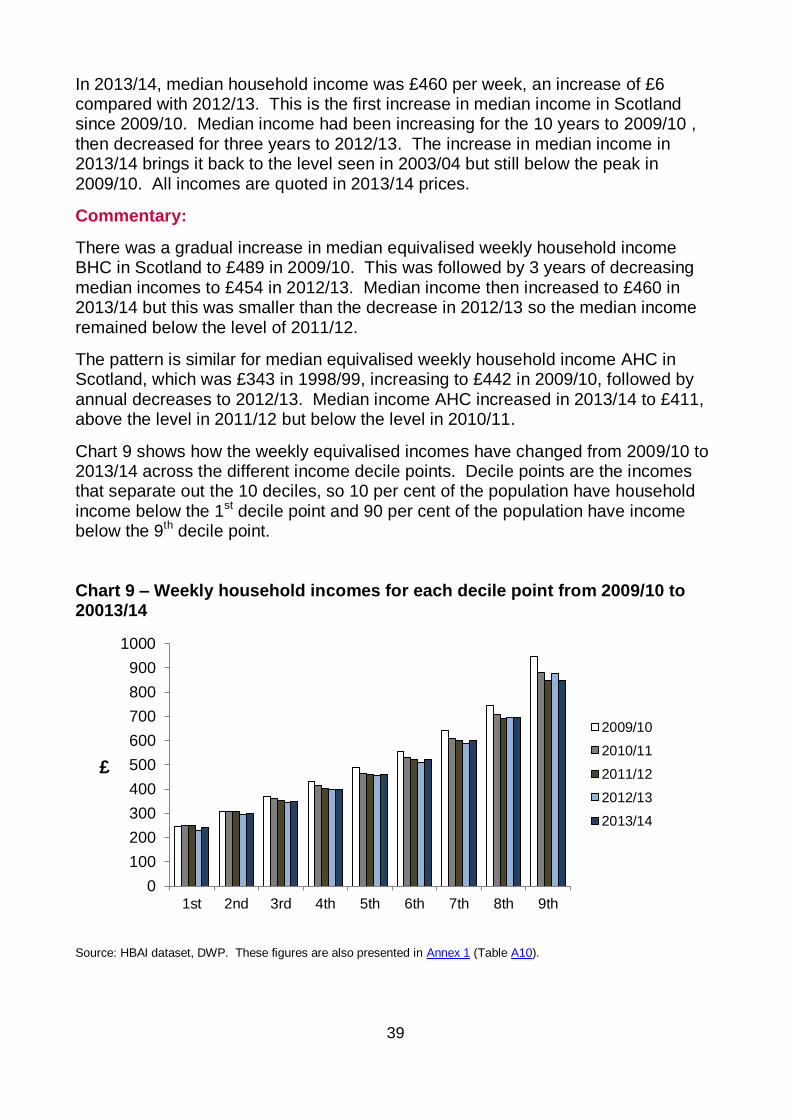
Chart 9 shows how the weekly equivalised incomes have changed from 2009/10 to 2013/14 across the different income decile points. Decile points are the incomes that separate out the 10 deciles, so 10 per cent of the population have household income below the 1st decile point and 90 per cent of the population have income below the 9th decile point.
Chart 9 – Weekly household incomes for each decile point from 2009/10 to 20013/14
Source: HBAI dataset, DWP. These figures are also presented in Annex 1 (Table A10).
0
100
200
300
400
500
600
700
800
900
1000
1st 2nd 3rd 4th 5th 6th 7th 8th 9th
£
2009/10
2010/11
2011/12
2012/13
2013/14

40
Incomes increased or saw no change at all deciles apart from the top decile in 2013/14. The top decile decreased to the same level as in 2011/12 having seen the largest increase in 2012/13. The bottom two deciles saw the largest increases, with little or no change for households across the middle of the income dostribution.
Chart 10 – Percentage change in each decile point between 2012/13 and 2013/14 (in real prices)
Source: HBAI dataset, DWP.
In 2013/14, the bottom two deciles saw the largest percentage increases. However they were still below the level of 2011/12 due to the decreases in 2012/13 being larger than the increases in the most recent year.
The only deciles that were at or above the level of 2011/12 were the top 4 deciles. The decrease in income at the top decile offset the increase in 2012/13, and so this has returned to the level seen in 2011/12, £849 per week (£44,300 per year).
Chart 11 below shows the distribution of weekly income across Scotland in 2013/14. The shaded area shows the shape of the 2013/14 income distribution and the black lines show the Scottish median income (£460) and the relative poverty threshold BHC (£272). The dark blue line superimposed shows the 2012/13 income distribution for comparison.
7%
3%
2%
0%
1%
2% 2%
0%
-3% -4
-2
0
2
4
6
8
10
1st 2nd 3rd 4th 5th 6th 7th 8th 9th
Pe
rce
nta
ge
Ch
an
ge

41
Chart 11 – Distribution of weekly household income with Scottish median and relative poverty threshold BHC - 2013/14
for children, working age adults and pensioners
Source: HBAI dataset, DWP.
0
50
100
150
200
250
300
350
400
450
0 100 200 300 400 500 600 700 800 900
Num
be
r o
f in
div
idu
als
(th
ou
sa
nd
s)
Equivalised weekly household income (£)
Scottish
Median 2013/14
Poverty
Threshold 2013/14
2012/13
Income Distribution

42
Chart 12 shows the same distribution with income deciles for Scotland marked with black lines.
Chart 12 – Distribution of weekly household income with income decile points
Source: HBAI dataset, DWP.
The relative poverty threshold BHC is based on the UK median equivalised household income. As the UK median income fell in 2011/12, the poverty threshold also fell in 2011/12. In 2012/13 and 2013/14, the UK median remained unchanged, as did the poverty threshold. In 2013/14 the poverty threshold BHC therefore remained at £272 per week (for a couple with no children). Median income in Scotland was higher than the UK median in 2011/12 but in 2012/13, it had dropped to almost the same level (£454 compared to £453 for the UK). In 2013/14 median income in Scotland increased to £460 while median income for the UK remained at £453.
0
50
100
150
200
250
300
350
400
450
0 100 200 300 400 500 600 700 800 900
Nu
mb
er
of
ind
ivid
ua
ls (
tho
usa
nd
s)
Equivalised weekly household income (£)
1 3 2 9 8 7 6 5 4

43
Chapter 3: Household characteristics and
income distribution
3.1 Household composition
Key points:
• Lone parents saw the largest decrease in relative poverty BHC, decreasing by
12 percentage points to 16 per cent. As a result, single people, both pensioners and working age adults, now have a higher risk of relative poverty BHC than lone parents.
• The bottom four deciles all saw an increase in the percentage of households
where all adults were in full-time employment and a decrease in households with adults in part-time employment only.
• The bottom decile saw the largest decrease in the percentage in part-time
employment, from 18 per cent to 7 per cent. This was accompanied by an increase in those in full-time employment but also by those in households with no adults in employment.
• 62 per cent of those in the bottom decile are in households with no adults in
employment, an increase of 3 percentages points on the previous year.
• However, families with someone in employment make up 46 per cent of those in
the bottom three deciles, the same as in 2012/13.

44
Chart 13 – Risk of poverty BHC by household type – 2013/14
Source: HBAI dataset, DWP. These figures are also presented in Annex 1 (Table A11).
Commentary:
Lone parents saw the largest decrease in relative poverty BHC, decreasing by 12 percentage points to 16 per cent in 2013/14. As a result, single people, both pensioners and working age adults, now have a higher risk of relative poverty BHC than lone parents.
There were a higher percentage of single adult households (both with and without children) towards the lower end of the income distribution. Single people without dependent children make up 30 per cent of those in the lowest decile, and around 20 per cent or less in the other deciles. Similarly, single parent households are concentrated in the lower income deciles, with more than half in the bottom three income deciles.
However there has been a decrease in the percentage of single parent families in the bottom two deciles with increases in deciles 3 and 4, accompanied by a decrease in the rate of relative poverty BHC for single parent families. This reflects the increase in the number of lone parent families in employment in 2013/14. 16 per cent of people in single parent families were in relative poverty BHC in 2013/14 compared to 28 per cent in 2012/13, a decrease of 12 percentage points. This is a decrease of 50 thousand people.
There were also more pensioners towards the lower end of the income distribution. This is particularly true for single pensioners with 15 per cent in the bottom decile compared to less than 4 per cent in each of the top 3 deciles. Relative poverty BHC for single pensioners increased to 21 per cent, a 1 percentage point increase.
0
5
10
15
20
25
Singlepensioner
Singlewithout
dependentchildren
Single withdependent
children
Couple withdependent
children
Pensionercouple
Couplewithout
dependentchildren
Perc
en
tag
e i
n p
ov
ert
y
21 21
16
13 12
8

45
In 2013/14, single pensioners are now the family type most likely to be in relative poverty BHC. In 2012/13, this was single parent families but with the decrease in poverty rates for this group, single pensioner poverty is now higher.
Single working age people without children were also over-represented in the bottom decile with 16 per cent having incomes in the bottom 10 per cent of the distribution. They were more evenly distributed across the rest of the distribution.
Couple households without children were the most likely to be at the top end of the income distribution, while those with children are evenly spread across all deciles. Couple households may be more able to increase household income than single person households. Households without children may be more able to work more hours and have greater flexibility in the labour market, as well as their income not being shared with direct dependants. Households without children are also able to move out of the welfare system quickly, at which point any increases in earnings do not trigger decreases in benefit income.
3.2 Household economic status
Chart 14 below shows the employment characteristics of households in each decile. Each bar represents the percentage of people in that decile living in each of the households types: at least one adult in full-time employment, part-time employment only, no adults in employment (whether due to unemployment, not actively seeking employment, or retirement).
Chart 14 – Economic status of household, composition of each decile in 2013/14
Source: HBAI dataset, DWP. These figures are also presented in Annex 1 (Table A13).
0
10
20
30
40
50
60
70
80
90
100
1st 2nd 3rd 4th 5th 6th 7th 8th 9th 10th
Perc
en
tag
e o
f each
decile
At least one full timeor self employed
No full time, one ormore part time
No adults inemployment

46
Commentary:
Households where no-one is working either through unemployment, retirement or economic inactivity (those who are neither in work, nor looking for work) were more common towards the bottom of the income distribution. Over half (54 per cent) of people in the bottom three income deciles were in households where no-one is in employment, compared to 11 per cent in the top three deciles.
Having an adult in the household in full-time employment (including those who are self-employed) greatly reduces the risk of poverty. In 2013/14, only 7 per cent of people living in a household with an adult in full-time employment were in relative poverty BHC, unchanged from the previous year. Relative poverty AHC for households with an adult in full-time employment increased to 9 per cent, an increase of 1 percentage point, but still represents a lower risk of poverty for those in full-time employment.
While employment remains the best route out of poverty, employment is no longer a protection against poverty. In 2013/14, 48 per cent of working age adults in relative poverty BHC were living in working households, as were 56 per cent of children. People in households where at least one adult is working full-time (including those who are self-employed) made up 83 per cent of those in the top three deciles. However, households where at least one adult is working full-time still made up 36 per cent of those in the bottom three deciles, an increase of 5 percentage points on the previous year. This may reflect that more people in the bottom 3 deciles are now working full-time and as such, the level of income for the bottom 3 deciles has increased compared to the median.
62 per cent of those in the bottom decile were in households with no adults in employment, an increase of 3 percentage points on the previous year. Unemployment continues to pose the highest risk of poverty with 61 per cent of those living in an unemployed household being in relative poverty BHC in 2013/14.
Households where adults are in part-time employment only are spread across the income distribution, although they were more likely to be in the bottom half of the distribution. The percentage of those in the bottom decile in part-time employment decreased to 7 per cent, a decrease of 11 percentage points, accompanied by a 7 percentage point increase in those working full-time.

47
Annexes
Annex 1: Tables 48
Annex 2: Data Sources and Definitions 62
Annex 3: Welfare Reform in 2013/14 69
Annex 4: Where to Find More Information 74

48
Annex 1: Tables
Table A1: Relative poverty (below 60% of UK median income in the same year) in Scottish households: 1994/95 to 2013/14
All individuals Children Working Age Adults Pensioners
Before Housing Costs
After Housing Costs
Before Housing Costs
After Housing Costs
Before Housing Costs
After Housing Costs
Before Housing Costs
After Housing Costs
% 000s % 000s % 000s % 000s % 000s % 000s % 000s % 000s
1994/95 21 1,040 23 1,140 28 310 30 330 17 510 18 560 26 220 29 250
1995/96 20 980 23 1,160 27 300 32 360 14 440 18 540 28 240 31 270
1996/97 22 1,090 25 1,230 31 340 33 360 16 490 19 580 30 260 33 290
1997/98 20 1,000 22 1,120 30 330 31 330 16 470 18 540 24 210 28 250
1998/99 20 980 23 1,130 28 300 31 330 15 450 19 570 26 230 27 230
1999/00 21 1,050 24 1,200 28 300 32 350 17 510 20 600 27 240 28 250
2000/01 21 1,040 24 1,220 27 280 32 340 18 540 22 650 24 210 25 220
2001/02 19 960 22 1,110 27 280 31 330 16 490 19 570 21 190 24 210
2002/03 20 1,000 22 1,120 24 250 27 280 18 530 20 610 23 210 25 230
2003/04 18 910 20 1,010 23 240 26 270 16 480 18 560 22 200 20 180
2004/05 17 860 19 960 21 210 25 250 15 460 18 560 20 180 16 150
2005/06 17 870 20 980 21 210 24 240 15 470 19 590 20 180 16 150
2006/07 17 840 19 940 22 210 25 250 14 440 18 550 19 180 15 140
2007/08 17 870 19 960 20 190 24 240 15 470 18 570 21 210 15 150
2008/09 17 860 19 960 21 210 26 250 16 490 19 600 16 160 11 110
2009/10 17 870 19 970 20 200 24 240 16 500 19 600 16 170 12 120
2010/11 15 770 17 900 17 170 21 210 14 440 18 570 16 160 12 120
2011/12 14 710 16 860 15 150 19 190 13 410 17 550 14 140 12 120
2012/13 16 820 19 1,000 19 180 22 220 15 480 21 660 15 150 11 120
2013/14 14 730 18 940 14 140 22 210 14 440 19 600 15 160 12 120
Source: HBAI dataset, DWP.

49
Table A2: Absolute poverty (below 60 per cent of inflation adjusted 2010/11 UK median income) in Scottish households: 1994/95 to 2013/14
All individuals Children Working Age Adults Pensioners
Before Housing Costs
After Housing Costs
Before Housing Costs
After Housing Costs
Before Housing Costs
After Housing Costs
Before Housing Costs
After Housing Costs
% 000s % 000s % 000s % 000s % 000s % 000s % 000s % 000s
1994/95 32 1,580 34 1,720 38 420 42 460 24 740 28 840 48 420 48 420
1995/96 32 1,610 36 1,810 42 470 47 520 24 720 28 860 48 420 49 420
1996/97 31 1,550 35 1,740 40 440 46 500 23 700 27 820 47 410 48 420
1997/98 28 1,400 31 1,570 39 420 43 470 22 650 25 750 37 320 40 350
1998/99 28 1,390 30 1,520 36 390 39 420 22 660 25 750 39 340 39 340
1999/00 27 1,330 30 1,480 34 360 38 410 22 650 24 740 36 310 38 330
2000/01 25 1,220 27 1,360 31 330 35 380 20 620 24 730 31 270 29 260
2001/02 22 1,070 24 1,210 30 310 34 360 18 530 20 610 25 220 27 240
2002/03 20 1,010 23 1,120 25 250 27 280 18 540 20 620 24 220 25 230
2003/04 19 930 20 990 24 240 26 260 16 490 18 550 22 200 19 180
2004/05 17 860 18 920 21 210 24 240 15 460 18 540 20 180 14 130
2005/06 17 860 18 900 21 210 23 230 15 470 18 560 19 180 13 120
2006/07 16 800 17 840 21 210 22 220 14 430 16 500 17 170 12 120
2007/08 16 830 17 880 19 190 22 220 14 450 17 530 20 190 13 130
2008/09 16 820 18 900 20 200 24 240 15 470 18 570 15 150 10 100
2009/10 15 790 17 890 18 180 22 220 15 470 18 570 15 150 10 100
2010/11 15 770 17 900 17 170 21 210 14 440 18 570 16 160 12 120
2011/12 15 780 18 950 17 170 22 220 14 450 18 590 16 160 14 140
2012/13 17 880 21 1,100 20 200 25 250 16 510 22 710 16 170 13 140
2013/14 15 800 20 1,030 16 150 24 240 15 480 20 650 17 170 14 140
Source: HBAI dataset, DWP.

50
Table A3: Children in combined material deprivation and low income BHC (below 70 per cent of UK median income in the same year) in Scottish households: 2004/05 to 2013/14
% 000s % 000s
2004/05 17 170 2004/05 - -
2005/06 13 130 2005/06 - -
2006/07 16 160 2006/07 - -
2007/08 16 160 2007/08 - -
2008/09 16 160 2008/09 - -
2009/10 15 150 2009/10 - -
2010/11 13 130 2010/11 12 120
2011/12 - - 2011/12 9 90
2012/13 - - 2012/13 11 110
2013/14 - - 2013/14 13 130
Source: HBAI dataset, DWP.
Table A4: Children in combined material deprivation and low income AHC (below 70 per cent of UK median income in the same year) in Scottish households: 2004/05 to 2013/14
% 000s % 000s
2004/05 18 180 2004/05 - -
2005/06 13 130 2005/06 - -
2006/07 16 160 2006/07 - -
2007/08 16 160 2007/08 - -
2008/09 16 160 2008/09 - -
2009/10 16 160 2009/10 - -
2010/11 15 150 2010/11 13 130
2011/12 - - 2011/12 11 110
2012/13 - - 2012/13 12 120
2013/14 - - 2013/14 14 140
Source: HBAI dataset, DWP.

51
Table A5: Pensioners over 65 in material deprivation in Scotland: 2009/10 to 2013/14
% 000s
2009/10 10 80
2010/11 7 60
2011/12 8 70
2012/13 8 70
2013/14 9 80
Source: HBAI dataset, DWP.
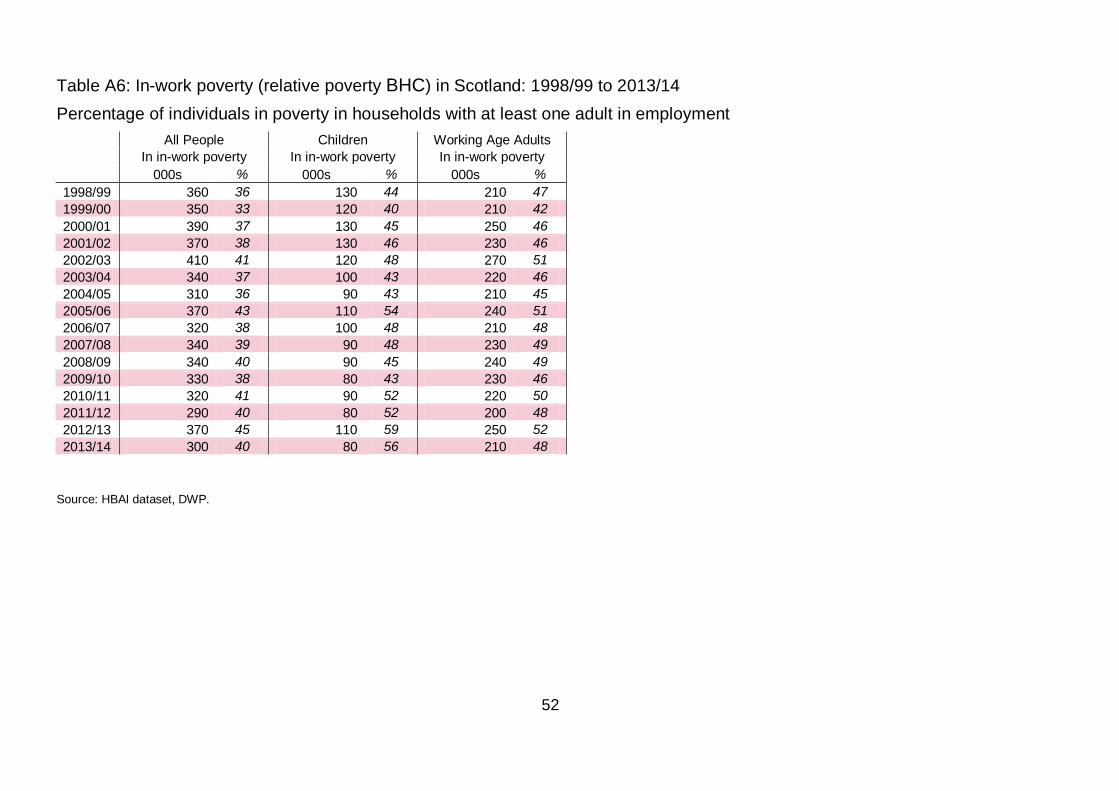
52
Table A6: In-work poverty (relative poverty BHC) in Scotland: 1998/99 to 2013/14
Percentage of individuals in poverty in households with at least one adult in employment
All People Children Working Age Adults
In in-work poverty In in-work poverty In in-work poverty
000s % 000s % 000s %
1998/99 360 36 130 44 210 47
1999/00 350 33 120 40 210 42
2000/01 390 37 130 45 250 46
2001/02 370 38 130 46 230 46
2002/03 410 41 120 48 270 51
2003/04 340 37 100 43 220 46
2004/05 310 36 90 43 210 45
2005/06 370 43 110 54 240 51
2006/07 320 38 100 48 210 48
2007/08 340 39 90 48 230 49
2008/09 340 40 90 45 240 49
2009/10 330 38 80 43 230 46
2010/11 320 41 90 52 220 50
2011/12 290 40 80 52 200 48
2012/13 370 45 110 59 250 52
2013/14 300 40 80 56 210 48
Source: HBAI dataset, DWP.

53
Table A7: In-work poverty (relative poverty AHC) in Scotland: 1998/99 to 2013/14
Percentage of individuals in poverty in households with at least one adult in employment
All People Children Working Age Adults
In in-work poverty In in-work poverty In in-work poverty
000s % 000s % 000s %
1998/99 440 39 150 45 280 49
1999/00 430 36 150 42 260 44
2000/01 500 41 160 48 330 50
2001/02 470 42 160 50 290 51
2002/03 480 43 140 50 330 54
2003/04 400 39 120 43 270 48
2004/05 400 41 110 45 280 49
2005/06 470 48 130 55 320 55
2006/07 410 43 120 49 280 50
2007/08 430 45 110 48 300 53
2008/09 450 47 130 52 310 52
2009/10 440 45 120 48 310 51
2010/11 430 48 110 55 300 54
2011/12 380 45 100 51 270 50
2012/13 510 51 130 56 370 56
2013/14 430 46 120 56 300 50
Source: HBAI dataset, DWP.
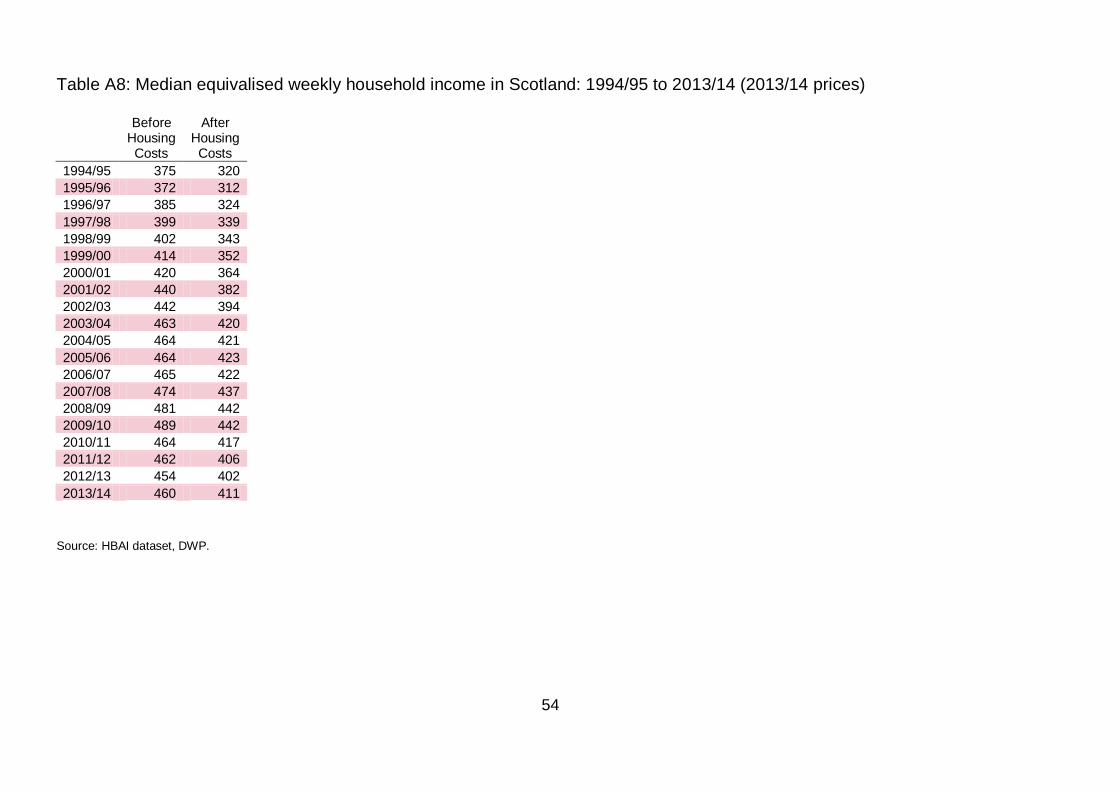
54
Table A8: Median equivalised weekly household income in Scotland: 1994/95 to 2013/14 (2013/14 prices)
Before Housing Costs
After Housing Costs
1994/95 375 320
1995/96 372 312
1996/97 385 324
1997/98 399 339
1998/99 402 343
1999/00 414 352
2000/01 420 364
2001/02 440 382
2002/03 442 394
2003/04 463 420
2004/05 464 421
2005/06 464 423
2006/07 465 422
2007/08 474 437
2008/09 481 442
2009/10 489 442
2010/11 464 417
2011/12 462 406
2012/13 454 402
2013/14 460 411
Source: HBAI dataset, DWP.

55
Table A9: Median equivalised weekly household income in Scotland: 1994/95 to 2012/13 (2013/14 prices)
Children, working age adults and pensioners
Children Working Age Adults Pensioners
Before Housing Costs
After Housing Costs
Before Housing Costs
After Housing Costs
Before Housing Costs
After Housing Costs
1994/95 334 277 432 364 284 250
1995/96 319 258 422 351 289 248
1996/97 325 263 442 372 287 253
1997/98 337 271 450 380 317 287
1998/99 360 300 448 384 329 288
1999/00 349 291 460 393 333 299
2000/01 365 317 455 393 354 322
2001/02 376 327 490 430 362 341
2002/03 401 346 494 434 362 338
2003/04 431 378 505 454 375 354
2004/05 418 361 515 460 389 374
2005/06 427 375 515 462 389 381
2006/07 419 373 520 466 386 382
2007/08 437 390 520 475 394 399
2008/09 429 372 529 476 414 415
2009/10 452 397 534 482 425 410
2010/11 424 372 503 444 414 400
2011/12 413 360 494 432 408 390
2012/13 407 350 485 418 416 400
2013/14 403 348 501 439 402 392
Source: HBAI dataset, DWP.

56
Table A10: Equivalised weekly household income (BHC) in Scotland: 1994/95 to 2013/14 (2013/14 prices)
Scottish 1st
income decile
Scottish 2nd
income decile
Scottish 3rd
income decile
Scottish 4th
income decile
Scottish 5th
income decile
Scottish 6th
income decile
Scottish 7th
income decile
Scottish 8th
income decile
Scottish 9th
income decile
1994/95 186 224 270 323 375 437 497 596 724
1995/96 192 229 269 322 372 425 497 586 730
1996/97 192 230 276 325 385 444 509 604 740
1997/98 197 241 288 339 399 455 531 624 783
1998/99 201 246 294 349 402 460 542 631 799
1999/00 206 249 298 350 414 476 550 659 823
2000/01 213 257 307 359 420 475 550 656 823
2001/02 228 275 327 381 440 504 576 674 890
2002/03 220 276 329 385 442 505 581 676 848
2003/04 232 289 351 409 463 524 597 700 850
2004/05 237 297 349 402 464 528 606 713 863
2005/06 235 296 351 408 464 528 605 719 890
2006/07 244 300 352 411 465 534 613 722 902
2007/08 237 303 357 412 474 542 621 740 933
2008/09 239 306 361 416 481 555 635 747 944
2009/10 247 309 368 432 489 557 640 743 946
2010/11 250 309 362 413 464 530 606 707 882
2011/12 248 308 354 404 462 522 599 692 849
2012/13 227 293 344 399 454 511 587 696 875
2013/14 243 301 350 399 460 523 599 695 849
Source: HBAI dataset, DWP.
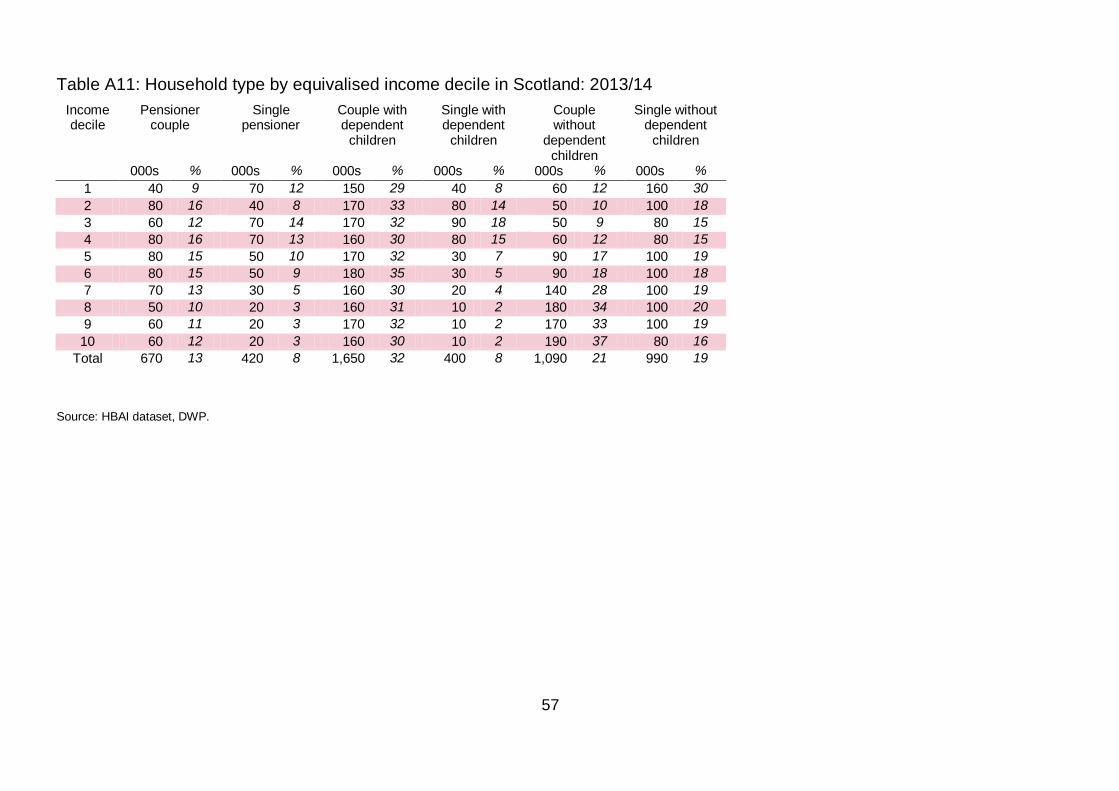
57
Table A11: Household type by equivalised income decile in Scotland: 2013/14
Income decile
Pensioner couple
Single pensioner
Couple with dependent
children
Single with dependent
children
Couple without
dependent children
Single without dependent
children
000s % 000s % 000s % 000s % 000s % 000s %
1 40 9 70 12 150 29 40 8 60 12 160 30
2 80 16 40 8 170 33 80 14 50 10 100 18
3 60 12 70 14 170 32 90 18 50 9 80 15
4 80 16 70 13 160 30 80 15 60 12 80 15
5 80 15 50 10 170 32 30 7 90 17 100 19
6 80 15 50 9 180 35 30 5 90 18 100 18
7 70 13 30 5 160 30 20 4 140 28 100 19
8 50 10 20 3 160 31 10 2 180 34 100 20
9 60 11 20 3 170 32 10 2 170 33 100 19
10 60 12 20 3 160 30 10 2 190 37 80 16
Total 670 13 420 8 1,650 32 400 8 1,090 21 990 19
Source: HBAI dataset, DWP.

58
Table A12: Economic status of households by equivalised income decile in Scotland: 2013/14
Income decile
One or more self-employed
Single/couple all in full-time work
Couple/one in full-time, one
part-time
Couple, one full-time one not
working
No full-time, one or more part-
time
No adult in employment,
head or spouse aged 60 or over
No adult in employment,
head or spouse unemployed
No adult in employment, other inactive
000s % 000s % 000s % 000s % 000s % 000s % 000s % 000s %
1 70 14 40 7 20 4 30 6 40 7 130 24 100 19 100 19 2 40 7 40 8 30 5 70 14 50 10 130 25 40 7 130 24 3 30 5 60 11 40 8 90 18 70 13 140 26 20 3 80 16 4 40 7 100 19 70 13 60 11 60 12 140 27 10 1 50 10 5 40 8 110 21 90 17 60 11 60 11 120 23 10 2 30 6 6 30 7 150 29 100 18 50 10 50 9 110 21 10 1 30 5 7 40 8 200 39 90 17 60 12 30 6 80 15 0 0 20 3 8 40 7 290 56 60 12 30 6 30 6 50 10 0 0 20 3 9 50 9 270 52 60 12 50 9 40 8 40 8 0 0 10 2
10 90 18 230 44 90 17 30 6 30 6 40 8 0 0 0 1 Total 470 9 1,500 29 640 12 540 10 450 9 980 19 180 3 470 9
Source: HBAI dataset, DWP.
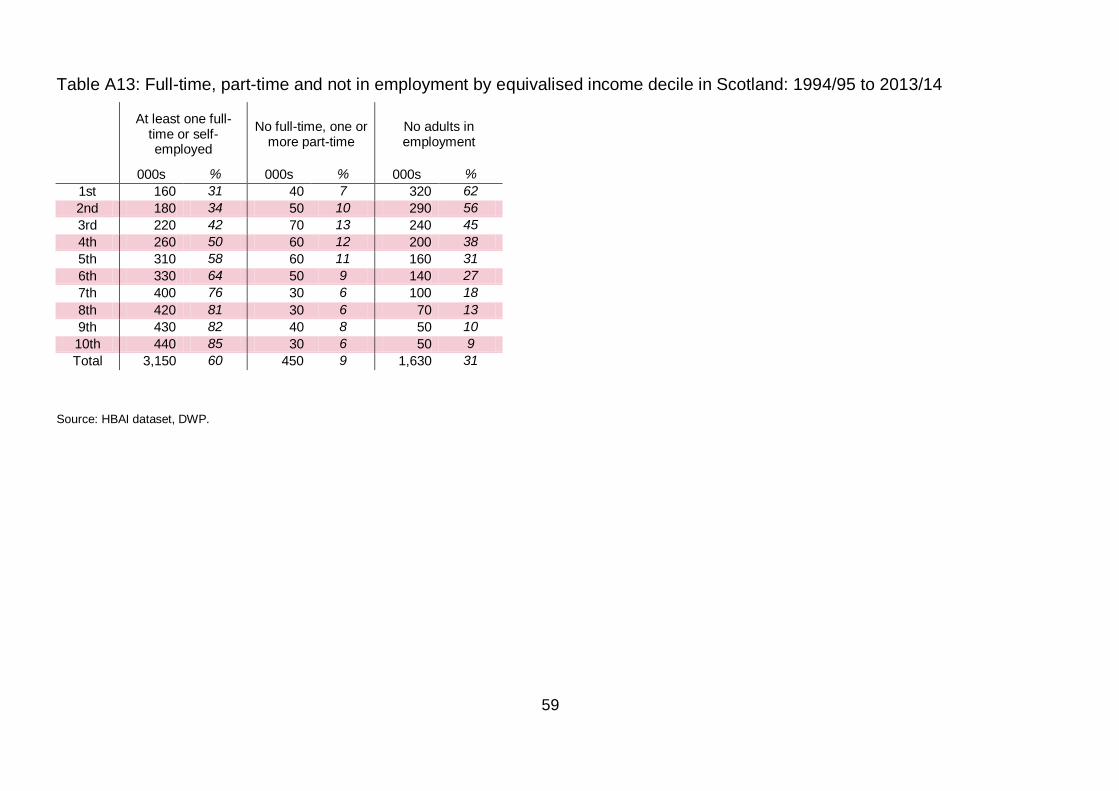
59
Table A13: Full-time, part-time and not in employment by equivalised income decile in Scotland: 1994/95 to 2013/14
At least one full-time or self-employed
No full-time, one or more part-time
No adults in employment
000s % 000s % 000s %
1st 160 31 40 7 320 62
2nd 180 34 50 10 290 56
3rd 220 42 70 13 240 45
4th 260 50 60 12 200 38
5th 310 58 60 11 160 31
6th 330 64 50 9 140 27
7th 400 76 30 6 100 18
8th 420 81 30 6 70 13
9th 430 82 40 8 50 10
10th 440 85 30 6 50 9
Total 3,150 60 450 9 1,630 31
Source: HBAI dataset, DWP.

60
Table A14: Gini coefficient for Scotland: 1994/95 to 2013/14
Year Gini coefficient
1994/95 31
1995/96 30
1996/97 30
1997/98 32
1998/99 31
1999/00 33
2000/01 34
2001/02 31
2002/03 31
2003/04 31
2004/05 30
2005/06 31
2006/07 32
2007/08 33
2008/09 34
2009/10 33
2010/11 30
2011/12 31
2012/13 31
2013/14 30
Source: HBAI dataset, DWP.
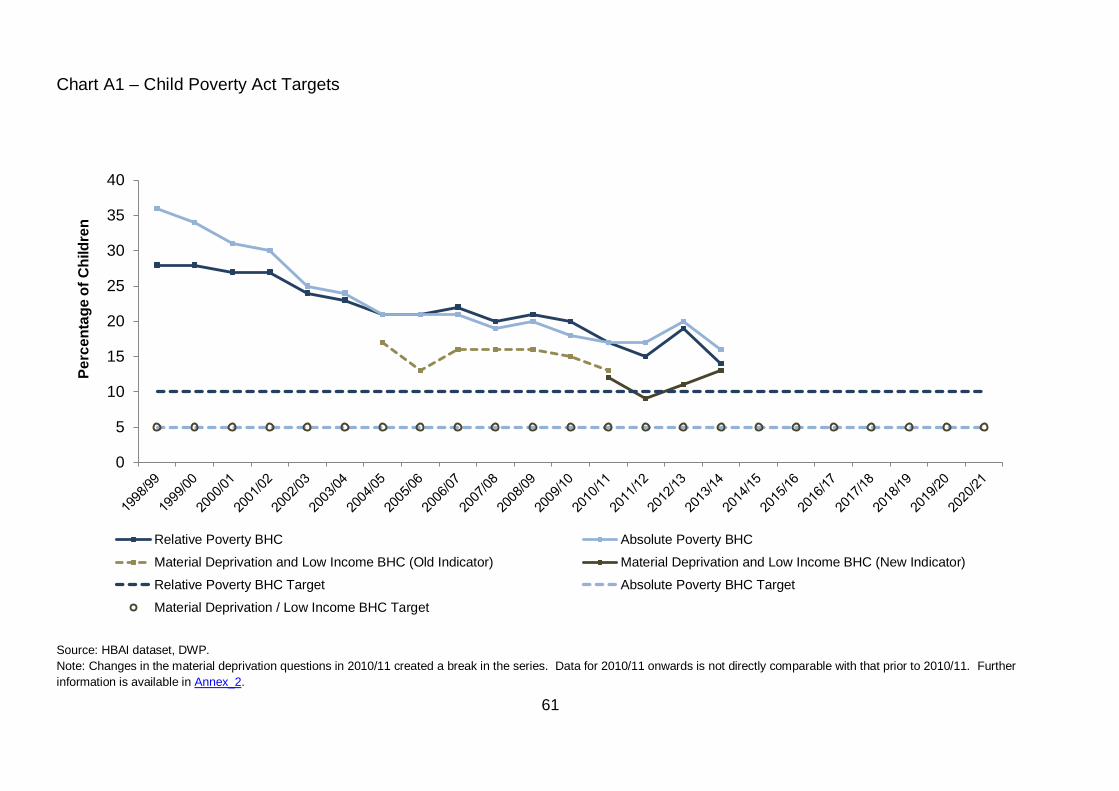
61
Chart A1 – Child Poverty Act Targets
Source: HBAI dataset, DWP.
Note: Changes in the material deprivation questions in 2010/11 created a break in the series. Data for 2010/11 onwards is not directly comparable with that prior to 2010/11. Further
information is available in Annex_2.
0
5
10
15
20
25
30
35
40
Pe
rce
nta
ge
of
Ch
ild
ren
Relative Poverty BHC Absolute Poverty BHC
Material Deprivation and Low Income BHC (Old Indicator) Material Deprivation and Low Income BHC (New Indicator)
Relative Poverty BHC Target Absolute Poverty BHC Target
Material Deprivation / Low Income BHC Target

62
Annex 2: Data Sources and Definitions
Data sources
Family Resources Survey, Households Below Average Income (HBAI) dataset:
All the figures in this publication come from the Department for Work and Pensions' (DWP) Households Below Average Income dataset which is produced from the Family Resources Survey. UK figures are published by DWP in ‘Households Below Average Income: 2013/14’ on the same day as ‘Poverty and Income Inequality in Scotland: 2013/14’. For the UK figures, as well as more detail about the way these figures are collected and calculated, see the DWP website:
https://www.gov.uk/government/collections/households-below-average-income-hbai--2
Further analysis of these figures will be published on the Scottish Government income and poverty statistics website. This will include figures on the interaction between income, poverty, disability and housing tenure.
http://www.gov.scot/Topics/Statistics/Browse/Social-Welfare/IncomePoverty
Future plans for updating persistent poverty figures
Data on Persistent Poverty has previously been obtained from the British Household Panel Survey (BHPS) and figures are published here:
http://www.gov.scot/Topics/Statistics/Browse/Social-Welfare/IncomePoverty/Publications.
The BHPS has been subsumed into the larger Understanding Society survey from the start of 2009. These figures will be updated when the new data becomes available later in 2015. For more detail see www.understandingsociety.org.uk.
What does the HBAI measure?
Households Below Average Income (HBAI) uses household disposable incomes, adjusted for the household size and composition, as a proxy for material living standards. More precisely, it is a proxy for the level of consumption of goods and services that people could attain given the disposable income of the household in which they live.
The unit of analysis is the individual, so the populations and percentages in the tables are numbers and percentages of individuals – both adults and children.
The living standards of an individual depend not only on his or her own income, but also on the income of others in the household. Consequently, the analyses are based on total household income: the equivalised income of a household is taken to represent the income level of every individual in the household. Equivalisation, a technique that allows comparison of incomes between households of different sizes and compositions, is explained below. Thus, all members of any one household will appear at the same point in the income distribution.
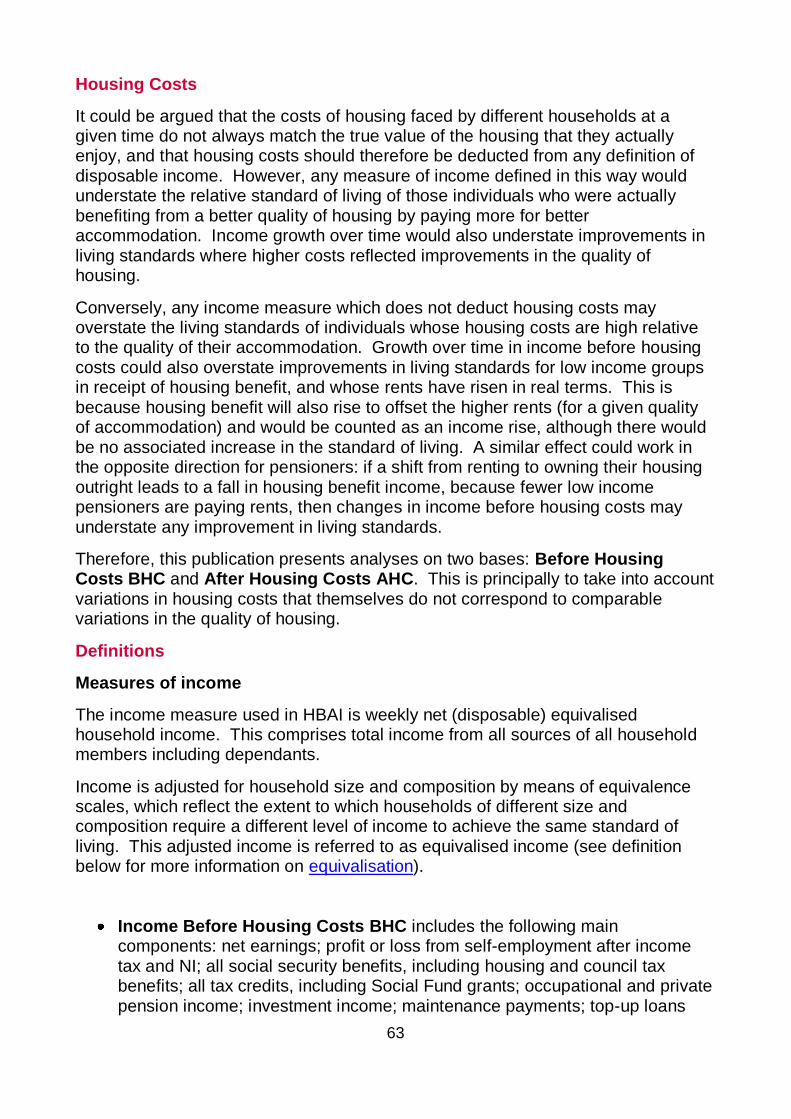
63
Housing Costs
It could be argued that the costs of housing faced by different households at a given time do not always match the true value of the housing that they actually enjoy, and that housing costs should therefore be deducted from any definition of disposable income. However, any measure of income defined in this way would understate the relative standard of living of those individuals who were actually benefiting from a better quality of housing by paying more for better accommodation. Income growth over time would also understate improvements in living standards where higher costs reflected improvements in the quality of housing.
Conversely, any income measure which does not deduct housing costs may overstate the living standards of individuals whose housing costs are high relative to the quality of their accommodation. Growth over time in income before housing costs could also overstate improvements in living standards for low income groups in receipt of housing benefit, and whose rents have risen in real terms. This is because housing benefit will also rise to offset the higher rents (for a given quality of accommodation) and would be counted as an income rise, although there would be no associated increase in the standard of living. A similar effect could work in the opposite direction for pensioners: if a shift from renting to owning their housing outright leads to a fall in housing benefit income, because fewer low income pensioners are paying rents, then changes in income before housing costs may understate any improvement in living standards.
Therefore, this publication presents analyses on two bases: Before Housing Costs BHC and After Housing Costs AHC. This is principally to take into account variations in housing costs that themselves do not correspond to comparable variations in the quality of housing.
Definitions
Measures of income
The income measure used in HBAI is weekly net (disposable) equivalised household income. This comprises total income from all sources of all household members including dependants.
Income is adjusted for household size and composition by means of equivalence scales, which reflect the extent to which households of different size and composition require a different level of income to achieve the same standard of living. This adjusted income is referred to as equivalised income (see definition below for more information on equivalisation).
Income Before Housing Costs BHC includes the following main components: net earnings; profit or loss from self-employment after income tax and NI; all social security benefits, including housing and council tax benefits; all tax credits, including Social Fund grants; occupational and private pension income; investment income; maintenance payments; top-up loans

64
and parental contributions for students, educational grants and payments; the cash value of certain forms of income in kind such as free school meals, free welfare milk and free school milk and free TV licences for the over 75s (where data is available). Income is net of: income tax payments; National Insurance contributions; contributions to occupational, stakeholder and personal pension schemes; council tax; maintenance and child support payments made; and parental contributions to students living away from home.
Income After Housing Costs AHC is derived by deducting a measure of housing costs from the above income measure.
Housing Costs include the following: rent (gross of housing benefit); water rates; mortgage interest payments; structural insurance premiums; ground rent and service charges.
Real prices
Unless otherwise stated, all figures relating to income are in 2013/14 prices. Values from previous years are uprated to account for inflation using the Retail Price Index (RPI).
All BHC incomes in this publication have been adjusted for inflation using a bespoke index supplied by the Office for National Statistics (ONS), consisting of the Retail Prices Index excluding Council Tax, while all AHC incomes in this publication have been adjusted for inflation using the Retail Prices Index excluding housing.
RPI measures the average price change on the basis of the changed expenditure of maintaining the consumption pattern of households and the composition of the consumer population in the base or reference period.
Equivalisation is the process by which household income is adjusted to take into account variations in the size and composition of the households in which individuals live. This reflects the common sense notion that, in order to enjoy a comparable standard of living, a household of, for example, three adults will need a higher income than a single person living alone. The process of adjusting income in this way is known as equivalisation and is needed in order to make sensible income comparisons between households.
Equivalence scales conventionally take an adult couple without children as the reference point, with an equivalence value of one. The process then increases relatively the income of single person households (since their incomes are divided by a value of less than one) and reduces relatively the incomes of households with three or more persons, which have an equivalence value of greater than one.
Consider a single person, a couple with no children, and a couple with two children aged fourteen and ten, all having unadjusted weekly household incomes of £200 (Before Housing Costs). The process of equivalisation, as conducted in HBAI, gives an equivalised income of £299 to the single person, £200 to the couple with no children, but only £131 to the couple with children.
The equivalence scales used here are the modified OECD scales. Two separate scales are used, one for income Before Housing Costs (BHC) and one for income

65
After Housing Costs (AHC). Modified OECD rescaled to couple without children, BHC is as follows:
First Adult 0.67
Spouse 0.33
Other Second Adult 0.33
Third Adult 0.33
Subsequent Adults 0.33
Children aged under 14 years 0.20
Children aged 14 years and over 0.33
The construction of household equivalence values from these scales is quite straightforward. For example, the BHC equivalence value for a household containing a couple with a fourteen year old and a ten year old child together with one other adult would be 1.86 from the sum of the scale values:
0.67 + 0.33 + 0.33 + 0.33 + 0.20 = 1.86
This is made up of 0.67 for the first adult, 0.33 for their spouse, the other adult and the fourteen year old child and 0.20 for the ten year old child. The total income for the household would then be divided by 1.86 in order to arrive at the measure of equivalised household income used in HBAI analysis.
Further information on equivalisation can be found in the following report on the Scottish Government website:
http://www.gov.scot/Topics/Statistics/Browse/Social-Welfare/IncomePoverty/equivalence-scales-paper
Poverty measurement from the Family Resources Survey
Individuals are defined as being in poverty if their equivalised net disposable household income is below 60 per cent of the UK median. The median is the income value which divides a population, when ranked by income, into two equal sized groups. Since the mean is influenced considerably by the highest incomes, median income thresholds are widely accepted as a better benchmark when considering a derived measure for low income. Sixty per cent of the median is the most commonly used low income measure.
For a couple with no children, the UK median income BHC in 2013/14 was £453 per week, which in real terms is unchanged since 2012/13. After housing costs the UK median was also unchanged at £386.
Consequently, the 60 per cent low income threshold, which is used to derive the low income household figures, has remained the same in real terms, before and after housing costs.
66
Relative and absolute poverty
Absolute poverty - individuals living in households whose equivalised income is below 60 per cent of inflation adjusted median income in 2010/11. This is a measure of whether those in the lowest income households are seeing their incomes rise in real terms.
Relative poverty - individuals living in households whose equivalised income is below 60 per cent of median income in the same year. This is a measure of whether those in the lowest income households are keeping pace with the growth of incomes in the economy as a whole.
Material deprivation for Children
A suite of questions designed to capture the material deprivation experienced by households with children has been included in the Family Resources Survey since 2004/05. Respondents are asked whether they have 21 goods and services, including child, adult and household items. The list of items was identified by independent academic analysis. See McKay, S. and Collard, S. (2004). Together, these questions form the best discriminator between those households that are deprived and those that are not. If they do not have a good or service, they are asked whether this is because they do not want them or because they cannot afford them.
These questions are used as an additional way of measuring living standards for children and their households.
A prevalence weighted approach has been used, in combination with a relative low income threshold. The income threshold is 70 per cent of the median income. Prevalence weighting is a technique of scoring deprivation in which more weight in the deprivation measure is given to households lacking those items that most already have. This means a greater importance, when an item is lacked, is assigned to those items that are more commonly owned in the population.
Changes to measuring material deprivation in 2011/12
The 21 items in the suite of questions used to measure material deprivation are designed to reflect the items and activities people in the UK believe to be necessary. These items are reviewed periodically to ensure the measure remains a relative measure of poverty. In 2010/11 four new questions about additional items were included in the FRS to be used in the future calculation of material deprivation scores, replacing the four existing items that were identified by research as potentially out of date partly because the proportion of the population considering them necessary had fallen. As such, there is a break in the series for child low income/material deprivation and estimates from 2011/12 onwards cannot be compared to those from before 2010/11.
In the 2010/11 FRS, both the new and the old questions were asked. As such, estimates are presented based on both sets of questions for this year.
For further information about material deprivation see the DWP Households Below Average Income publication.

67
Material Deprivation for Pensioners
A suite of questions designed to capture the material deprivation experienced by pensioner households has been included in the Family Resources Survey since May 2008. Respondents are asked whether they have access to 15 goods and services. The list of items was identified by independent academic analysis. See:
Legard, R., Gray, M. and Blake, M. (2008), Cognitive testing: older people and the FRS material deprivation questions, Department for Work and Pensions Working Paper Number 55. Available at: http://www.bristol.ac.uk/poverty/downloads/keyofficialdocuments/FRS%20cognitive%20testing%20of%20older%20people%20dep%20questions.pdf and;
McKay, S. (2008), Measuring material deprivation among older people: Methodological study to revise the Family Resources Survey questions, Department for Work and Pensions Working Paper Number 54. Available at: http://www.bristol.ac.uk/poverty/downloads/keyofficialdocuments/FRS%20Older%20people%20deprivation%20questions%20report.pdf
Together, these questions form the best discriminator between those pensioner households that are deprived and those that are not.
Where they do not have a good or service, pensioner households are asked whether this is because: they do not have the money for this; it is not a priority on their current income; their health / disability prevents them; it is too much trouble or tiring; they have no one to do this with or help them; it is not something they want; it is not relevant to them; other. Where a pensioner lacks one of the material deprivation items for one of the following reasons - they do not have the money for this; it is not a priority for them on their current income; their health / disability prevents them; it is too much trouble or tiring; they have no one to do this with or help them; other - they are counted as being deprived for that item.
The exception to this is for the unexpected expense question, where the follow up question was asked to explore how those who responded ‘yes’ would cover this cost. Options were: use own income but cut back on essentials; use own income but not need to cut back on essentials; use savings; use a form of credit; get money from friends or family; other. Pensioners are counted as materially deprived for this item if and only if they responded ‘no’ to the initial question.
The same prevalence weighted approach has been used to that for children, in determining a deprivation score. Prevalence weighting is a technique of scoring deprivation in which more weight in the deprivation measure is given to households lacking those items that most already have. This means a greater importance, when an item is lacked, is assigned to those items that are more commonly owned in the pensioner population.
For children, material deprivation is presented as an indicator in combination with a low income threshold. However for pensioners, the concept of material deprivation is broad and very different from low income; therefore, it is appropriate to present it as a separate measure.

68
A technical note given a full explanation of the pensioner material deprivation measure is available at https://www.gov.uk/government/publications/households-below-average-income-hbai-technical-note-on-pensioner-material-deprivation.
Population Coverage
The FRS is a survey of private households. This means that people in residential institutions, such as nursing homes, barracks, prisons or university halls of residence, and also homeless people are excluded from the scope of the analysis presented here. The area of Scotland north of the Caledonian Canal was included in the FRS for the first time in the 2001/02 survey year, and from the 2002/03 survey year, the FRS was extended to include a 100 per cent boost of the Scottish sample. This has increased the sample size available for analysis at the Scottish level. Between 2002/03, the sample size has been around 5 thousand. However, following cost savings introduced to the FRS in 2010, the sample size in Scotland has reduced. It was approximately 3.5 thousand in 2013/14. For further information see the DWP Households Below Average Income publication.
Reliability of estimates
The figures are estimates based on sample surveys and are therefore subject to sampling variation. Caution should be exercised in the interpretation of small year-on-year fluctuations. Identification of trends should be based on data for several years. Estimates for the confidence intervals around the key figures presented here will be available on the Income and poverty statistics website after publication via the following link: http://www.gov.scot/Topics/Statistics/Browse/Social-Welfare/IncomePoverty/Methodology
The Family Resources Survey publication:
https://www.gov.uk/government/collections/family-resources-survey--2
contains information on topics such as:
Sample design, non-response biases, weighting
Item non-response, imputation and editing
Accuracy of income data
Detailed HBAI definitions and methodology
More detailed information on definitions and methodology can be found in Appendix 1 and 2 of DWP’s publication:
https://www.gov.uk/government/collections/households-below-average-income-hbai--2

69
Annex 3: Welfare Reform in 2013/14
Welfare reform In 2013/14, further welfare reform was implemented. In particular, the ‘bedroom tax’ for housing benefit recipients in the social rented sector, the 1 per cent cap on benefit uprating for most working age benefits, uprating of local housing allowance by CPI rather than local rent levels, and the introduction of personal independence payments. Welfare reforms have been implemented since April 2011, and these statistics now capture the majority of reforms announced by the UK Government since April 2011. The full implementation of Universal Credit has been delayed, so is not fully reflected in these statistics. A full list of welfare reforms implemented between April 2011 and March 2014 is below. As welfare reform has been phased in, individual benefits and groups of recipients have been affected over a three year period. For example, changes to housing benefit affected new claimants from April 2011 and existing claimants were mostly affected between January and December 2012. In 2013/14, Scottish Government Ministers have increased welfare mitigation spending. In April 2013, responsibility for Discretionary Housing Payments (DHPs) was transferred to Scottish Government Ministers. In 2013/14, Scottish Government Ministers added an additional £20 million to the £18 million allocated by the UK Government. Prior to the introduction of the ‘bedroom tax’ in April 2013, DHP expenditure in Scotland was around £4 million. In 2013/14, £29.3 million was spent on DHPs in Scotland. The Scottish Government also established the Scottish Welfare Fund (SWF), incorporating funding previously spent by Department for Work and Pensions in Scotland on two elements of the Social Fund, which were abolished. In 2013/14, £29 million was spent through the SWF.

70
Welfare reforms implemented in 2013/14:
Introduction of the ‘bedroom tax’ for HB recipients in the social rented sector, for working age claimants.
1 per cent cap on benefit uprating.
The introduction of the benefit cap limited the total amount of benefit that most people aged 16 to 64 could receive to £500 per week for couples and lone parents, and £350 per week for single adults. Those living in households eligible for Working Tax Credits or in receipt of certain prescribed benefits were not affected by the benefit cap.
Increase working age benefits and tax credits by nominal 1 per cent.
Child Benefit frozen.
Disability Living Allowance: reform gateway from 2013/14 (introduction of Personal Independence Payment, PIP).
Uprating of Local Housing Allowance rates capped by CPI inflation. LHA rates were frozen in 2012/13, prior to uprating by CPI.
Reduce Pension Credit Savings Credit in cash terms.
Basic State pension uprated by 2.5 per cent in line with the triple guarantee.
Increase Pension Credit Guarantee Credit by same cash amount as Basic State Pension.
Freeze basic and 30-hour elements of Working Tax Credit in cash terms.
Child benefit, along with elements of tax credits, frozen in cash terms. Tax credit elements for disabled adults and children were uprated at between 2.2 per cent and 2.5 per cent.
Disability benefits (Disability Living Allowance and Attendance Allowance) were uprated by 2.2 per cent.
Universal Credit was introduced in April 2013 for claimants in certain areas in England, progressively rolling it out nationally from October 2013. Given the relatively low caseloads in 2013/14, this is unlikely to have had an impact on the statistics in this publication.
High income child benefit tax charge was introduced in January 2013. Individuals earning more than £60,000 per year lost entitlement to child benefit, as did their partner if they were entitled to child benefit. Individuals earning between £50,000 and £60,000 per year lost a proportion of child benefit, as did their partner if they were entitled to child benefit. For couples who both earn over £50,000 per year, only the highest earner lost part of their entitlement to child benefit.

71
Personal taxes:
Increase personal allowance by £1,335 to £9,440 for those aged under 65, and was frozen at £10,500 for those aged 65 to 74 years and at £10,660 for those aged 75 or older.
Reduce additional marginal income tax rate from 50 per cent to 45 per cent on income above £150,000.
The threshold for the 40 per cent higher rate of income tax fell to £41,450 from £42,475.
CPI-index some National Insurance thresholds.
Welfare reforms implemented in 2012/13:
Taper the family element of Child Tax Credit immediately after the child element is withdrawn from April 2012.
Remove the 50-plus element of Working Tax Credit in April 2012.
Increase the Working Tax Credit working hours requirement for couples with children from 16 to 24 hours in April 2012.
Freeze the basic and 30-hour elements of Working Tax Credit at 2010/11 rates from 2011/12 to 2013/14 inclusive, and then uprate by 1 per cent for two years from April 2014.
Freeze the couple and lone parent elements of Working Tax Credit in 2012/13.
Freeze Child Benefit at 2010/11 rates from 2011/12 to 2013/14 inclusive, and then uprate by 1 per cent for two years from April 2014.
Taper Child Benefit away from families containing someone earning more than £50,000 in January 2013.
Uprate the Basic State Pension by the maximum of CPI inflation, earnings growth and 2.5 per cent from April 2012, and uprate with RPI inflation in April 2011.
Increase minimum guarantee for Pension Credit by the cash increase in Basic State Pension in April 2011, April 2012 and April 2013.
Freeze maximum award of Savings Credit at 2010/11 rates from 2011/12 to 2014/15 inclusive, with reductions in April 2012 and April 2013.
Time-limit contributory Employment and Support Allowance to one year from April 2012.
Local Housing Allowance: remove the £15 excess that can be claimed above rent, set local reference rates at the 30th percentile of local rents rather than the median, cap all rates at the four-bedroom rate and introduce national caps on all local reference rates in April 2011 (new claimants) or January to December 2012 (existing claimants); increase the age below which single people can only claim the shared-room rate from 25 to 35 in April 2012.

72
Personal taxes:
Increase the income tax personal allowance above indexation: cash increases of £1,000 in April 2011, £630 in April 2012 and £1,335 in April 2013.
Freeze age-related allowances and restrict them to existing recipients from April 2013.
All reductions in the basic-rate limit and necessary adjustments to keep the upper earnings/profits in line with the higher rate threshold: £2,500 in April 2011, £630 in April 2012 and £2,125 in April 2013.
Uprate some direct tax thresholds in line with CPI from April 2012, with all direct tax thresholds uprated in line with CPI from April 2016.
Welfare reforms implemented in 2011/12:
Uprating of most benefits in line with the CPI instead of RPI.
Basic State Pension uprating was governed by a ‘triple guarantee’ where the increase is the highest of earnings, prices or 2.5 per cent.
The standard minimum income guarantee in Pension Credit was increased in April 2011 by the cash rise in a full basic State Pension.
Child Benefit Frozen.
The following reforms impacted HB recipients in the private rented sector subject to Local Housing Allowance (LHA) calculations: the removal of the £15 excess, overall caps on LHA rates, the restriction to the four bedroom rate and reducing the level at which LHA rates are set to the 30th percentile of market rents rather than the median. Nine months transitional protection was afforded to existing customers from the anniversary of their claim. In January 2012, the shared accommodation rate in LHA (for claimants under the age of 25) was extended to claimants under 35 years old. The Government increased its contribution to local authorities’ funding for Discretionary Housing Payments by £10 million in 2011/12, and it started to include an additional bedroom within the size criteria used to assess HB claims in the private rented sector where a disabled person, or someone with a long term health condition, has a proven need for overnight care and it is provided by a non-resident carer. There were also increases in non-dependent deductions for those in receipt of HB and renting in the private or social rented sectors.
Restricted eligibility to the Sure Start Maternity Grant to the first child only and abolished the Health in Pregnancy Grant from January 2011.
The family element of the Child Tax Credit previously payable to families with an income of up to £50,000 was reduced to incomes of £40,000 from April 2011.
Increased the rate at which tax credits are withdrawn once household incomes rise.
The baby element of Child Tax Credit was removed from 2011-12.

73
The basic and 30 hour element of working tax credits were frozen.
Reduction from 80 per cent to 70 per cent of eligible childcare costs.
The level of in-year rises of income disregarded from calculations of tax credit entitlement decreased from £25,000 to £10,000.
People aged over 60 qualified for Working Tax Credit if they worked at least 16 hours a week, rather than 30 as previously.
Personal taxes:
There was a £1,000 cash increase in the income tax personal allowance, with a corresponding decrease in the levels at which the 40 per cent higher rate of tax and the 2 per cent rate of NICs are paid, for those aged under 65.
The main employee and self-employed NICs rate was increased by 1 per cent in 2011/12. The additional employee and self-employed NICs rate was increased by 1 per cent, from 1 per cent to 2 per cent. The primary threshold and lower profits limit were increased, whilst the upper earnings limit and upper profits limit were reduced.
74
Annex 4: Where to Find More Information
Supplementary analysis: This publication contains the headline poverty and income inequality statistics. Supplementary analysis based on the FRS and HBAI datasets is published by the Scottish Government during the year at: http://www.gov.scot/Topics/Statistics/Browse/Social-Welfare/IncomePoverty/CoreAnalysis This provides further disaggregation of the headline statistics at sub-population level: poverty in urban and rural areas, poverty in deprived areas, poverty by disability, gender, and ethnicity, poverty by household tenure, household income distributions, trends in median income, income source, savings and assets, and income inequality. Supplementary analysis themes are based on the needs of users. If you have any suggestions for future supplementary analysis please email: [email protected] or phone 0131 244 7045
Scottish Government websites:
Income and Poverty statistics website
http://www.gov.scot/Topics/Statistics/Browse/Social-Welfare/incomepoverty
Scotland Performs website (for further information about the SG Solidarity Target and National Indicators)
http://www.gov.scot/About/scotPerforms
Uses of the data: In response to the UK Statistics Authority’s (UKSA) report http://www.statisticsauthority.gov.uk/assessment/assessment/assessment-reports/index.html the Scottish Government were required to identify and document the ways in which these statistics are used. More information on this can be found via the following link: http://www.gov.scot/Topics/Statistics/Browse/Social-Welfare/IncomePoverty/income-data-sources
Scottish Government Welfare and Tackling Poverty website includes information about what the Scottish Government is doing to reduce poverty and income inequality.
http://www.gov.scot/Topics/People/welfarereform
Confidence limits surrounding Scotland poverty estimates:

75
http://www.gov.scot/Topics/Statistics/Browse/Social-Welfare/IncomePoverty/Methodology
High Level Summary of Statistics (Social and Welfare) http://www.gov.scot/Topics/Statistics/Browse/Social-Welfare
For further information on all Scottish Government statistics
http://www.gov.scot/topics/statistics/
UK Government websites:
Family Resources Survey, Department for Work and Pensions
https://www.gov.uk/government/collections/family-resources-survey--2
Households Below Average Income, Department for Work and Pensions (methodology and UK estimates)
https://www.gov.uk/government/collections/households-below-average-income-hbai--2
UK Government action on child poverty
https://www.gov.uk/government/groups/the-child-poverty-unit
Local Authority level analysis and other geographies in Scotland:
The figures presented here are from a sample survey which limits the analysis possible at smaller geographical areas. A few analyses are published for areas below Scotland level, (e.g. poverty in rural and urban areas and in deprived areas), however it is not possible to produce reliable estimates at Local Authority level from this source. Estimates of poverty in rural and urban areas and in deprived areas will be updated on the income and poverty statistics website soon after publication of this report.
http://www.gov.scot/Topics/Statistics/Browse/Social-Welfare/IncomePoverty/CoreAnalysis
The Scottish Government are aware of the demand for Local Authority (LA) level poverty figures and are carrying out work to improve the quality of income information recorded by the Scottish Household Survey with the aim of producing LA level estimates. Initial estimates were published from this work in August 2010 and are classified as “data being developed” because they are undergoing quality assurance work and are published for the purpose of helping in this QA work and should not be treated as official statistics. For further detail and to comment on these data, see the Relative poverty across Scottish local authorities publication or contact the income and poverty statistics team on 0131 244 7045 or [email protected].
Academics from Heriot-Watt University have recently completed a project to develop a methodology for modelling income and poverty at local area levels in

76
Scotland. Results are published on the Improvement Service website: http://www.improvementservice.org.uk/income-modelling-project/ .
On the income and poverty website there is also a data sources and suitability page which discusses some of the main data sources available to researchers interested in income and poverty in Scotland and their strengths and weaknesses. This discusses some of the indicators which are currently available at local authority level to find out about income and poverty in Scotland.

77
A National Statistics publication for Scotland The United Kingdom Statistics Authority has designated these statistics as National Statistics, in accordance with the Statistics and Registration Service Act 2007 and signifying compliance with the Code of Practice for Official Statistics. Designation can be interpreted to mean that the statistics: meet identified user needs; are produced, managed and disseminated to high standards; and are explained well.
Correspondence and enquiries For enquiries about this publication please contact: Stephen Smith Communities Analytical Services Telephone: 0131 244 7045, e-mail: [email protected] For general enquiries about Scottish Government statistics please contact: Office of the Chief Statistician, Telephone: 0131 244 0442, e-mail: [email protected]
How to access background or source data The data collected for this <statistical bulletin / social research publication>: ☒ cannot be made available by Scottish Government for further analysis as Scottish Government is not the data controller.
Complaints and suggestions If you are not satisfied with our service or have any comments or suggestions, please write to the Chief Statistician, 3WR, St Andrews House, Edinburgh, EH1 3DG, Telephone: (0131) 244 0302, e-mail [email protected]. If you would like to be consulted about statistical collections or receive notification of publications, please register your interest at www.gov.scot/scotstat Details of forthcoming publications can be found at www.gov.scot/statistics ISBN: 978-1-78544-497-5 (web only) ISBN: 978-1-78544-503-3 (Mobi) ISBN: 978-1-78544-504-0 (ebook) APS Group Scotland PPDAS52254 (06/15)

78
Crown Copyright
You may use or re-use this information (not including logos) free of charge in any format or medium, under the terms of the Open Government Licence. See: www.nationalarchives.gov.uk/doc/open-government-licence/ 01