Embed Size (px)
Citation preview
E C O L O G I C A L E C O N O M I C S 6 2 ( 2 0 0 7 ) 9 3 – 1 0 1
ava i l ab l e a t www.sc i enced i r ec t . com
www.e l sev i e r. com/ loca te / eco l econ
ANALYSIS
Poverty and biodiversity: Measuring the overlap of humanpoverty and the biodiversity hotspots
Brendan Fisher ⁎, Treg ChristopherGund Institute for Ecological Economics, University of Vermont, Burlington, VT 05405, USA
A R T I C L E I N F O
⁎ Corresponding author. Tel.: +1 802 656 2978E-mail address: [email protected] (B. Fishe
0921-8009/$ - see front matter © 2006 Elsevidoi:10.1016/j.ecolecon.2006.05.020
A B S T R A C T
Article history:Received 13 October 2005Received in revised form17 April 2006Accepted 26 May 2006Available online 17 August 2006
In an effort to prioritize conservation efforts, scientists have developed the concept ofbiodiversity hotspots. Since most hotspots occur in countries where poverty is widespread,the success of conservation efforts depends upon the recognition that poverty can be asignificant constraint on conservation, and at the same time conservation is an importantcomponent to the alleviation of long-term poverty. In this paper we present five key socio-economic poverty indicators (access to water, undernourishment, potential populationpressure, number living below poverty line and debt service) and integrate them with anecologically based hotspots analysis in order to illustrate magnitude of the overlap betweenbiological conservation and poverty. The analysis here suggests that the overlap betweensevere, multifaceted poverty and key areas of global biodiversity is great and needs to beacknowledged. Understanding the magnitude of overlap and interactions among poverty,conservation and macroeconomic processes is crucial for identifying illusive, yet possible,win–win solutions.
© 2006 Elsevier B.V. All rights reserved.
Keywords:Biodiversity hotspotsPovertyConservationEconomic poverty
1. Introduction
The need for an interdisciplinary approach to science hasbecome obvious in recent years and is perhapsmost pertinentin the fields of conservation and sustainable development.Due to the linkages between socio-economic systems andecological systems, issues such as development, povertyeradication, and biodiversity conservation need to beaddressed not as individual phenomena but rather as complexdynamic systems. Addressing these systemswill require inputfrom social and natural scientists, as well as policy makersand practitioners (Sanderson, 2005). In this paper we addressthe interconnectivity of global biodiversity conservationpriorities with human poverty issues. These issues representkey areas of focus for major global initiatives such as theUnited Nation's Millennium Development Goals, the Conven-
; fax: +1 802 656 2995.r).
er B.V. All rights reserved
tion on Biological Diversity and Make Poverty Historycampaign.
The starting point for this analysis is the 2000Nature articleby Myers et al. entitled “Biodiversity hotspots for conservationpriorities”. In this landmark paper, Myers et al. developed astrategy for prioritizing areas of biodiversity by providing aranking of hotspots in order to assist planners in the face ofinsufficient funding. The authors focused their analysis onand defined ‘hotspots’ as areas having “exceptional concen-trations of endemic species and experiencing exceptional lossof habitat”. They defined 25 original hotspots, but this list wasrecently expanded to 34 hotspots and has become the majorfocus of Conservation International's (CI) work. By focusing onthese hotspots, the authors estimate it may be possible toprotect 44% of all vascular plant species and 35% of 4 majorvertebrate group in only 1.4% of the earth's surface (Myers et
.
94 E C O L O G I C A L E C O N O M I C S 6 2 ( 2 0 0 7 ) 9 3 – 1 0 1
al., 2000). This was, and continues to be, an important andtimely effort due to the growing evidence of human drivenecosystem degradation and species loss (Vitousek, 1997).While an excellent endeavor to help prioritize funding forconservation, their paper does not address the fact that thesuccess of conservation initiatives is largely dependent on thesocio-economic conditions of the areas where these hotspotsoccur.
Adams et al. (2004) recently reviewed the controversysurrounding the link between biodiversity conservation andpoverty alleviation. In their article they developed a typologyfor this relationship, which spanned the range of opinions.The four categories they developed are:
1. Poverty and conservation are separate policy realms.2. Poverty is a constraint on conservation.3. Conservation should not compromise poverty reduction.4. Poverty reduction depends on living resource conservation.
These categories do not preclude the necessity of bothpoverty alleviation and conservation, but rather expressdifferent viewpoints (or prioritizations) of these complexsystems. The Myers et al. (2000) endeavor was excellent foridentifying hotspots, but it is a category 1 strategy ofmaintaining the separation between conservation prioritiesand poverty alleviation. While conservation and poverty datahave seldom been fully integrated (Snel, 2004), Cincotta et al.(2000) have expanded the analysis of hotspots by including theinteractions with population densities and growth rates.Smith et al. (2003) have examined governance corruptionwith respect to hotspots. There have also been severalattempts at integrating socio-economic data into conservationprioritization in an effort to move away from this category 1framework (Sisk et al. 1994; Balmford et al., 2003; Veech, 2003;O'connor et al., 2003). These papers all base their prioritysetting on conservation costs and threats, and their analysiswould generally fall in Adams et al.'s categories 2–3.
While the socio-economic indicators we use could supportviewpoints in categories 2–4, the function of this paper is toprovide analysis for practitioners to show the geographicoverlap of key areas for both poverty alleviation and biodi-versity conservation. This analysis could be useful to any ofthe typology viewpoints, but the discussion that follows theanalysis focuses primarily on the category four viewpoint,which is becoming increasingly common in the literature.
Previous attempts are laudable calls to the conservationcommunity to prioritize initiatives based on possible successin light of socio-economic conditions. Our work on the otherhand uses vital poverty statistics, such as access to cleanwater, food scarcity and national debt service, in acknowl-edgment of the fact that organizations working on povertyissues face critical constraints but continue towork on literallylife and death issues. In doing this, we move beyondconservation prioritization, and point to the large scale atwhich poverty alleviation and biodiversity conservation con-cerns overlap. We highlight the innate linkages betweenconservation and poverty by assessing socio-economic pov-erty indicators that have an impact on, and feedback into,conservation. We also provide a ranking of the criticalhotspots and countries based on these indicators. This work
recognizes the fact that conservation in general does notautomatically translate to protection of high levels of biodi-versity, but the linkage between these two is in recognition ofthe strong and well documented link that ecosystem destruc-tion leads to species loss (Ehrlich and Ehrlich, 1981; Tilman etal., 1994; Czech et al., 2000).
2. Methods
We disaggregated CI's 34 hotspots into their constituentcountries within a Geographic Information System. Hotspots(obtained from Conservation International's website at: http://www.biodiversityhotspots.org/xp/Hotspots/resources/maps.xml) were clipped to a map of the world's countries (obtainedfrom USGS VMap, Level 0 Project). These files were combinedin order to determine which hotspots overlapped with whichcountry and to select all countries with at least 100,000 ha ofoverlapping hotspots. This resulted in 125 countries forfurther analysis. We chose the minimum area somewhatarbitrarily but felt that such a large area was needed becauseof the coarseness of the political boundaries and because theactual hotspots only comprise between 3% and 30% of theecoregions to which they are assigned (Myers et al., 2000). (SeeTable 1A in the Appendix for a list of these 125 countries andtheir associated hotspot area.)
We chose critical socio-economic indicators relating topoverty that show this category 4 interaction between povertyand conservation threats. We used traditional economicmetrics of poverty: national debt service and percentage of peopleliving below the national poverty line. We also included a broaderrange of poverty indicators (undernourishment, access to cleanwater and potential population pressure) not based solely onmarket-identified poverty. Due to their innate connectionwithlife-supporting ecosystems, we call these ecological povertyindicators.
3. Ecological poverty indicators
3.1. Undernourishment
According to the 2003 State of Food Insecurity (SOFI) report ofthe Food and Agriculture Organization (FAO) there are842 million people considered ‘food insecure’ in our world.Three-fourths of these people live in rural areas, the over-whelmingmajority in thedevelopingworld. The rural poor relyheavily on local ecosystems for primary goods and servicesand therefore the importance of biodiversity to food security inthe developing world cannot be overstated (Snel, 2004). In theother direction, growing rural populations in the developingworld may further burden already degraded food productionsystems (FAO, 2003). In light of this it is important to recognizehow food security may affect and be affected by conservationinitiatives.
Weused figures from the SOFI 2003 report on the percentageof the population considered ‘undernourished’ to integrate thisproblem with biodiversity conservation. Table 1 (column A)shows thehotspot countrieswith the largestpercentageof theirpopulations considered undernourished. Where data was
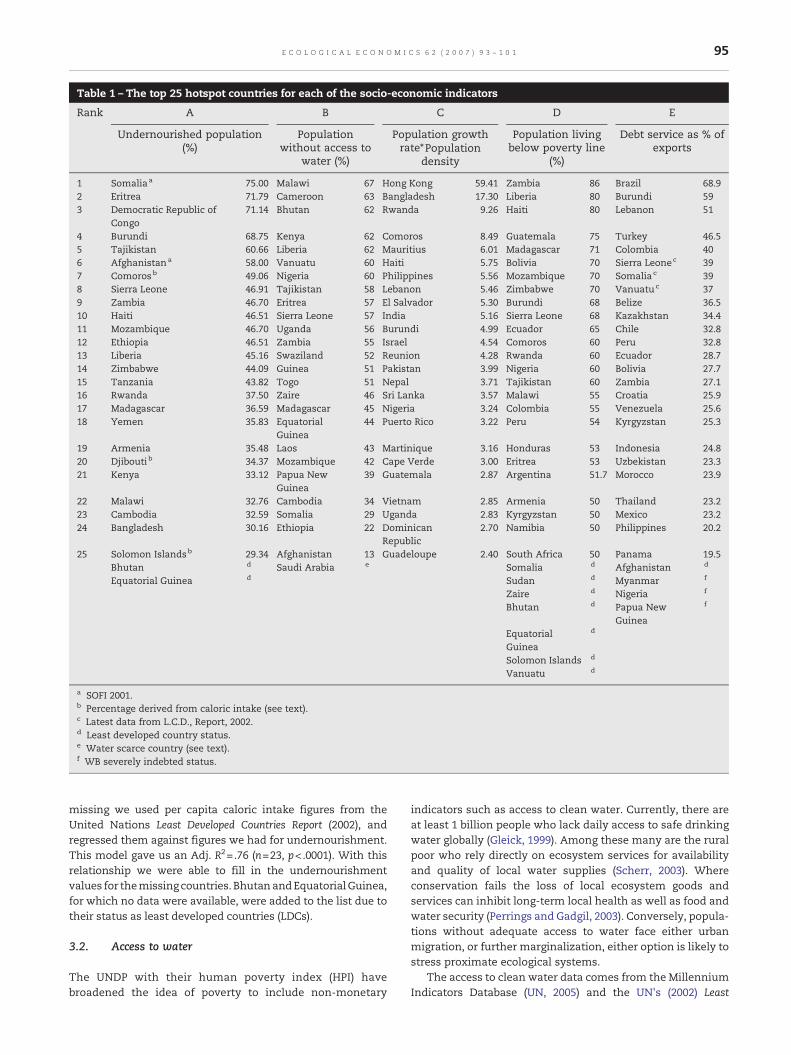
Table 1 – The top 25 hotspot countries for each of the socio-economic indicators
Rank A B C D E
Undernourished population(%)
Populationwithout access to
water (%)
Population growthrate⁎Population
density
Population livingbelow poverty line
(%)
Debt service as % ofexports
1 Somaliaa 75.00 Malawi 67 Hong Kong 59.41 Zambia 86 Brazil 68.92 Eritrea 71.79 Cameroon 63 Bangladesh 17.30 Liberia 80 Burundi 593 Democratic Republic of
Congo71.14 Bhutan 62 Rwanda 9.26 Haiti 80 Lebanon 51
4 Burundi 68.75 Kenya 62 Comoros 8.49 Guatemala 75 Turkey 46.55 Tajikistan 60.66 Liberia 62 Mauritius 6.01 Madagascar 71 Colombia 406 Afghanistana 58.00 Vanuatu 60 Haiti 5.75 Bolivia 70 Sierra Leonec 397 Comorosb 49.06 Nigeria 60 Philippines 5.56 Mozambique 70 Somaliac 398 Sierra Leone 46.91 Tajikistan 58 Lebanon 5.46 Zimbabwe 70 Vanuatuc 379 Zambia 46.70 Eritrea 57 El Salvador 5.30 Burundi 68 Belize 36.510 Haiti 46.51 Sierra Leone 57 India 5.16 Sierra Leone 68 Kazakhstan 34.411 Mozambique 46.70 Uganda 56 Burundi 4.99 Ecuador 65 Chile 32.812 Ethiopia 46.51 Zambia 55 Israel 4.54 Comoros 60 Peru 32.813 Liberia 45.16 Swaziland 52 Reunion 4.28 Rwanda 60 Ecuador 28.714 Zimbabwe 44.09 Guinea 51 Pakistan 3.99 Nigeria 60 Bolivia 27.715 Tanzania 43.82 Togo 51 Nepal 3.71 Tajikistan 60 Zambia 27.116 Rwanda 37.50 Zaire 46 Sri Lanka 3.57 Malawi 55 Croatia 25.917 Madagascar 36.59 Madagascar 45 Nigeria 3.24 Colombia 55 Venezuela 25.618 Yemen 35.83 Equatorial
Guinea44 Puerto Rico 3.22 Peru 54 Kyrgyzstan 25.3
19 Armenia 35.48 Laos 43 Martinique 3.16 Honduras 53 Indonesia 24.820 Djibouti b 34.37 Mozambique 42 Cape Verde 3.00 Eritrea 53 Uzbekistan 23.321 Kenya 33.12 Papua New
Guinea39 Guatemala 2.87 Argentina 51.7 Morocco 23.9
22 Malawi 32.76 Cambodia 34 Vietnam 2.85 Armenia 50 Thailand 23.223 Cambodia 32.59 Somalia 29 Uganda 2.83 Kyrgyzstan 50 Mexico 23.224 Bangladesh 30.16 Ethiopia 22 Dominican
Republic2.70 Namibia 50 Philippines 20.2
25 Solomon Islandsb 29.34 Afghanistan 13 Guadeloupe 2.40 South Africa 50 Panama 19.5Bhutan d Saudi Arabia e Somalia d Afghanistan d
Equatorial Guinea d Sudan d Myanmar f
Zaire d Nigeria f
Bhutan d Papua NewGuinea
f
EquatorialGuinea
d
Solomon Islands d
Vanuatu d
a SOFI 2001.b Percentage derived from caloric intake (see text).c Latest data from L.C.D., Report, 2002.d Least developed country status.e Water scarce country (see text).f WB severely indebted status.
95E C O L O G I C A L E C O N O M I C S 6 2 ( 2 0 0 7 ) 9 3 – 1 0 1
missing we used per capita caloric intake figures from theUnited Nations Least Developed Countries Report (2002), andregressed them against figures we had for undernourishment.This model gave us an Adj. R2=.76 (n=23, p<.0001). With thisrelationship we were able to fill in the undernourishmentvalues for themissingcountries. BhutanandEquatorialGuinea,for which no data were available, were added to the list due totheir status as least developed countries (LDCs).
3.2. Access to water
The UNDP with their human poverty index (HPI) havebroadened the idea of poverty to include non-monetary
indicators such as access to clean water. Currently, there areat least 1 billion people who lack daily access to safe drinkingwater globally (Gleick, 1999). Among these many are the ruralpoor who rely directly on ecosystem services for availabilityand quality of local water supplies (Scherr, 2003). Whereconservation fails the loss of local ecosystem goods andservices can inhibit long-term local health as well as food andwater security (Perrings and Gadgil, 2003). Conversely, popula-tions without adequate access to water face either urbanmigration, or further marginalization, either option is likely tostress proximate ecological systems.
The access to clean water data comes from the MillenniumIndicators Database (UN, 2005) and the UN's (2002) Least
96 E C O L O G I C A L E C O N O M I C S 6 2 ( 2 0 0 7 ) 9 3 – 1 0 1
Developed Countries Report (UN, 2002). This data represents thepercentage of the population with access to a clean watersource. For the few countries for which there was no data wechecked Gardner-Outlaw and Engelman's (1997) work onfuture water scarcity. This forced us to consider Saudi Arabiafor analysis, and although water scarcity and access to waterare different indicators it seemed prudently conservative toinclude it. Table 1 (column B) shows the hotspot countrieswith the poorest access to water.
3.3. Potential population pressure
Populations in areas of high biodiversity will continue toincrease globally and these populations will be heavily reliantupon local food production and resource extraction (Scherr,2003). Population growth in areas of high resource extractionhas an obvious pressure effect on ecosystems, like increasedfuelwood extraction (McNeely and Scherr, 2003). Deacon (1994)found deforestation rates to be positively affected by popula-tion growth (with some lag effects). The ‘proximate’ causes ofecological degradation are often local pressures such as woodextraction and land clearing for agriculture (Geist and Lambin,2002). However, it has beenwell argued that population effectsare secondary and driven by macro-scale economic processes(Shiva, 1993; Geist and Lambin, 2002). Further, in somesystems, like dryland farming systems, population increaseshave had little to no causal effects on degradation (Adams,2001). The population growth–ecosystem degradation debateis much more nuanced, however even if local pressure is asecondary effect of larger scale processes it still makes a usefulproxy to ‘potential pressure’. In light of this, it is essential thatconservation strategies consider population dynamics (Cin-cotta et al., 2000). Cincotta et al. (2000) show that within thebiodiversity hotspots, population growth and populationdensities are well above the world average.
In this analysis we define potential population pressure as thepopulation growth rate multiplied by the population density(population/ha of country) as in Cincotta et al. (2000). Thisindicator is in recognition that a high population growth ratemay not have a huge effect on local ecosystems if the initialpopulation density is low. Where Myers et al.'s analysis usedpast habitat destruction as a factor, this figure attempts to getat the possible future pressures. We used population andpopulation growth rates from the WB's World DevelopmentIndicators (2005). Missing data was incorporated from the CIAWorld Factbook (CIA, 2005).
Table 1 (column C) shows the hotspot countries with thegreatest potential population pressure.
4. Economic indicators
4.1. Poverty line
Currently 40% of the global population lives in low-incomecountries; roughly 3 billion people live on less than $2 a day;and 1.2 billion live below The World Bank's (2003) “extreme”poverty line of less than $1 per day. The often-studiedrelationship between poverty and environmental degradationcuts both ways, where conservation affects local livelihoods
and local livelihoods affect conservation efforts. This “bi-directional” relationship can have positive feedback effects,often described as a ‘vicious cycle’ where degradation andspecies loss affects local livelihoods in a negative way whichleads to further degradation and so on (Boyce, 1994). To this,local ecosystem services are critical to those mired in poverty(Dasgupta, 2002), and where broad scale ecological degrada-tion exists the poor suffer a large proportion of the costsincurred (Munasinghe, 1993).
Those who directly utilize biodiversity resources do sobecause they are displaced, marginalized and are likely to nothave alternatives (Pimm et al., 2001). This is a case where theshort-term incentives (food, materials) outweigh long-termstability (conservation). To avoid this social trap, economicpoverty must be considered in conservation schemes.
For this indicator we used the Millennium IndicatorsDatabase (UN, 2005). The figure used represents the numberof people living below the national poverty line.We found datafor 91 of the 125 countries. We attempted to regress WBcategorical status (e.g. Highly Indebted Poor Country) withpoverty data to find a relationship to fill in for missing datapoints, but this attempt yielded no significant results. Of themissing 34 data points, seven countries were on the UN's LeastDeveloped Countries list (2002). These seven were added toTable 1 (column D), which shows the countries with thegreatest number of people living below the poverty line.
4.2. Debt service
Debt service is considered a key macro-economic variablewhen examining development issues. This statistic is usuallymeasured in the amount of money spent to service loans as apercentage of gross domestic product or exports. The state of acountry's indebtedness can have serious consequences forconservation and poverty reduction initiatives.
For example, several studies have looked at how indebted-ness affects tropical deforestation. Capistrano and Kiker (1995)looked at deforestation in 45 tropical countries and concludedthat indirectly, through currency devaluation, debt servicewaslinked to deforestation. Owusu (1998) also found debt obliga-tion to be a major driver in Ghana's increased deforestation.And in countries considered ‘medium deforesting countries’debt service was found to be one of the main causes ofdeforestation (Mahapatra and Kant, 2005). In light of studieslike these, the debt service – environmental degradationrelationship was considered to be important for this analysis.
Data came from the WB's World Development Indicators(2005) and the UN's Least Developed Countries Report (UN, 2002),where debt service was measured as a percentage of totalexports. If a country for which we did not have numerical datawas categorically considered severely indebted by theWB it wasadded to the table. These additions were Afghanistan, Burma,Nigeria, and Papua New Guinea. Table 1 (column E) shows thehotspot countries with the poorest debt service status.
5. Re-ranking the hotspots
Table 1 shows the 25 poorest performers in each category. Wealso added some countries to this list when these countries
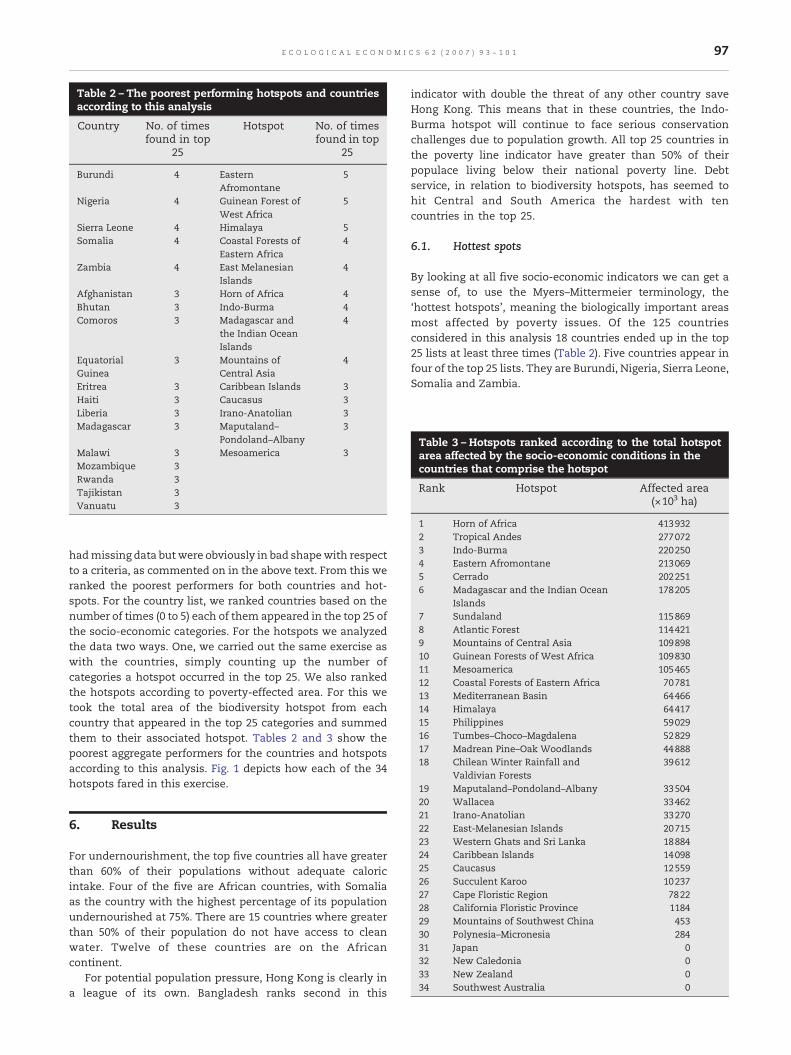
Table 2 – The poorest performing hotspots and countriesaccording to this analysis
Country No. of timesfound in top
25
Hotspot No. of timesfound in top
25
Burundi 4 EasternAfromontane
5
Nigeria 4 Guinean Forest ofWest Africa
5
Sierra Leone 4 Himalaya 5Somalia 4 Coastal Forests of
Eastern Africa4
Zambia 4 East MelanesianIslands
4
Afghanistan 3 Horn of Africa 4Bhutan 3 Indo-Burma 4Comoros 3 Madagascar and
the Indian OceanIslands
4
EquatorialGuinea
3 Mountains ofCentral Asia
4
Eritrea 3 Caribbean Islands 3Haiti 3 Caucasus 3Liberia 3 Irano-Anatolian 3Madagascar 3 Maputaland–
Pondoland–Albany3
Malawi 3 Mesoamerica 3Mozambique 3Rwanda 3Tajikistan 3Vanuatu 3
Table 3 – Hotspots ranked according to the total hotspotarea affected by the socio-economic conditions in thecountries that comprise the hotspot
Rank Hotspot Affected area(×103 ha)
1 Horn of Africa 4139322 Tropical Andes 2770723 Indo-Burma 2202504 Eastern Afromontane 2130695 Cerrado 2022516 Madagascar and the Indian Ocean
Islands178205
7 Sundaland 1158698 Atlantic Forest 1144219 Mountains of Central Asia 10989810 Guinean Forests of West Africa 10983011 Mesoamerica 10546512 Coastal Forests of Eastern Africa 7078113 Mediterranean Basin 6446614 Himalaya 6441715 Philippines 5902916 Tumbes–Choco–Magdalena 5282917 Madrean Pine–Oak Woodlands 4488818 Chilean Winter Rainfall and
Valdivian Forests39612
19 Maputaland–Pondoland–Albany 33504
97E C O L O G I C A L E C O N O M I C S 6 2 ( 2 0 0 7 ) 9 3 – 1 0 1
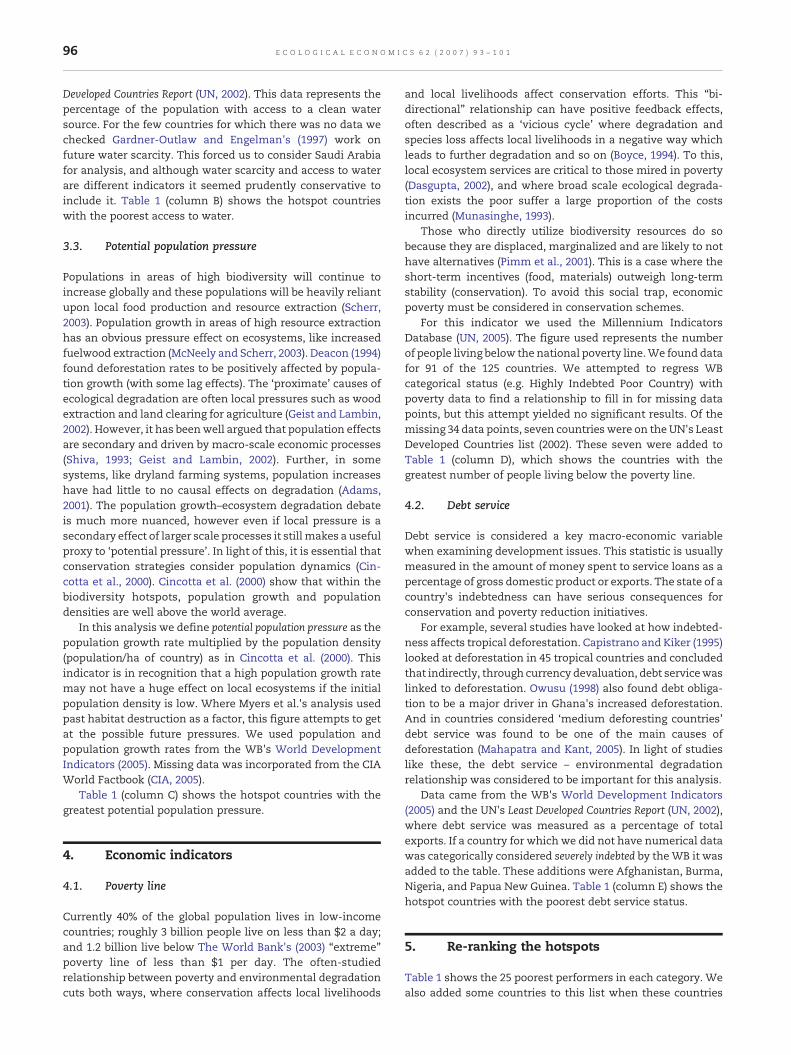
hadmissing data but were obviously in bad shapewith respectto a criteria, as commented on in the above text. From this weranked the poorest performers for both countries and hot-spots. For the country list, we ranked countries based on thenumber of times (0 to 5) each of them appeared in the top 25 ofthe socio-economic categories. For the hotspots we analyzedthe data two ways. One, we carried out the same exercise aswith the countries, simply counting up the number ofcategories a hotspot occurred in the top 25. We also rankedthe hotspots according to poverty-effected area. For this wetook the total area of the biodiversity hotspot from eachcountry that appeared in the top 25 categories and summedthem to their associated hotspot. Tables 2 and 3 show thepoorest aggregate performers for the countries and hotspotsaccording to this analysis. Fig. 1 depicts how each of the 34hotspots fared in this exercise.
20 Wallacea 3346221 Irano-Anatolian 3327022 East-Melanesian Islands 2071523 Western Ghats and Sri Lanka 1888424 Caribbean Islands 1409825 Caucasus 1255926 Succulent Karoo 1023727 Cape Floristic Region 782228 California Floristic Province 118429 Mountains of Southwest China 45330 Polynesia–Micronesia 28431 Japan 032 New Caledonia 033 New Zealand 034 Southwest Australia 0
6. Results
For undernourishment, the top five countries all have greaterthan 60% of their populations without adequate caloricintake. Four of the five are African countries, with Somaliaas the country with the highest percentage of its populationundernourished at 75%. There are 15 countries where greaterthan 50% of their population do not have access to cleanwater. Twelve of these countries are on the Africancontinent.
For potential population pressure, Hong Kong is clearly ina league of its own. Bangladesh ranks second in this
indicator with double the threat of any other country saveHong Kong. This means that in these countries, the Indo-Burma hotspot will continue to face serious conservationchallenges due to population growth. All top 25 countries inthe poverty line indicator have greater than 50% of theirpopulace living below their national poverty line. Debtservice, in relation to biodiversity hotspots, has seemed tohit Central and South America the hardest with tencountries in the top 25.
6.1. Hottest spots
By looking at all five socio-economic indicators we can get asense of, to use the Myers–Mittermeier terminology, the‘hottest hotspots’, meaning the biologically important areasmost affected by poverty issues. Of the 125 countriesconsidered in this analysis 18 countries ended up in the top25 lists at least three times (Table 2). Five countries appear infour of the top 25 lists. They are Burundi, Nigeria, Sierra Leone,Somalia and Zambia.
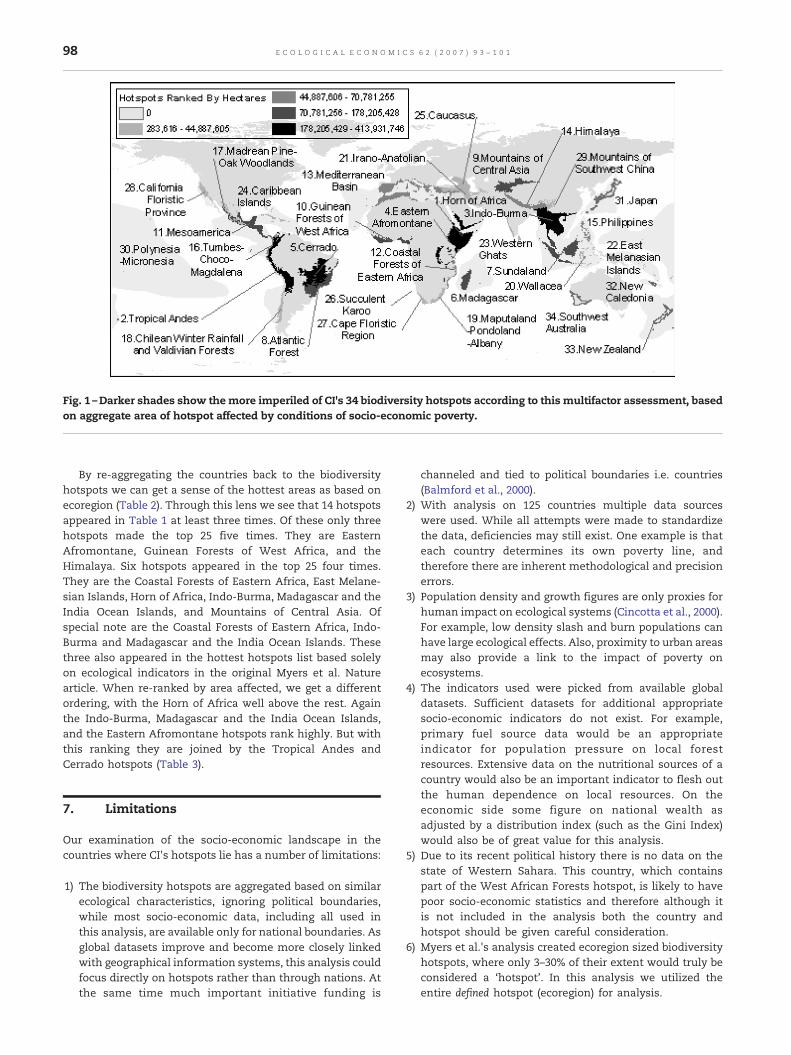
Fig. 1 –Darker shades show themore imperiled of CI's 34 biodiversity hotspots according to this multifactor assessment, basedon aggregate area of hotspot affected by conditions of socio-economic poverty.
98 E C O L O G I C A L E C O N O M I C S 6 2 ( 2 0 0 7 ) 9 3 – 1 0 1
By re-aggregating the countries back to the biodiversityhotspots we can get a sense of the hottest areas as based onecoregion (Table 2). Through this lens we see that 14 hotspotsappeared in Table 1 at least three times. Of these only threehotspots made the top 25 five times. They are EasternAfromontane, Guinean Forests of West Africa, and theHimalaya. Six hotspots appeared in the top 25 four times.They are the Coastal Forests of Eastern Africa, East Melane-sian Islands, Horn of Africa, Indo-Burma, Madagascar and theIndia Ocean Islands, and Mountains of Central Asia. Ofspecial note are the Coastal Forests of Eastern Africa, Indo-Burma and Madagascar and the India Ocean Islands. Thesethree also appeared in the hottest hotspots list based solelyon ecological indicators in the original Myers et al. Naturearticle. When re-ranked by area affected, we get a differentordering, with the Horn of Africa well above the rest. Againthe Indo-Burma, Madagascar and the India Ocean Islands,and the Eastern Afromontane hotspots rank highly. But withthis ranking they are joined by the Tropical Andes andCerrado hotspots (Table 3).
7. Limitations
Our examination of the socio-economic landscape in thecountries where CI's hotspots lie has a number of limitations:
1) The biodiversity hotspots are aggregated based on similarecological characteristics, ignoring political boundaries,while most socio-economic data, including all used inthis analysis, are available only for national boundaries. Asglobal datasets improve and become more closely linkedwith geographical information systems, this analysis couldfocus directly on hotspots rather than through nations. Atthe same time much important initiative funding is
channeled and tied to political boundaries i.e. countries(Balmford et al., 2000).
2) With analysis on 125 countries multiple data sourceswere used. While all attempts were made to standardizethe data, deficiencies may still exist. One example is thateach country determines its own poverty line, andtherefore there are inherent methodological and precisionerrors.
3) Population density and growth figures are only proxies forhuman impact on ecological systems (Cincotta et al., 2000).For example, low density slash and burn populations canhave large ecological effects. Also, proximity to urban areasmay also provide a link to the impact of poverty onecosystems.
4) The indicators used were picked from available globaldatasets. Sufficient datasets for additional appropriatesocio-economic indicators do not exist. For example,primary fuel source data would be an appropriateindicator for population pressure on local forestresources. Extensive data on the nutritional sources of acountry would also be an important indicator to flesh outthe human dependence on local resources. On theeconomic side some figure on national wealth asadjusted by a distribution index (such as the Gini Index)would also be of great value for this analysis.
5) Due to its recent political history there is no data on thestate of Western Sahara. This country, which containspart of the West African Forests hotspot, is likely to havepoor socio-economic statistics and therefore although itis not included in the analysis both the country andhotspot should be given careful consideration.
6) Myers et al.'s analysis created ecoregion sized biodiversityhotspots, where only 3–30% of their extent would truly beconsidered a ‘hotspot’. In this analysis we utilized theentire defined hotspot (ecoregion) for analysis.

99E C O L O G I C A L E C O N O M I C S 6 2 ( 2 0 0 7 ) 9 3 – 1 0 1
8. Discussion
Much work has been done on prioritization of global con-servation efforts based on ecosystem characteristics such asendemism (Myers et al., 2000), habitat type (Olson andDinerstein, 1998), adaptive variation (Smith et al., 2001), and/or threats to success like governance (Smith et al., 2003), cost(Balmford et al., 2000) and population (Cincotta et al., 2000).Our approach includes key social and economic povertyindicators that have been shown to drive land use change inthe ecologically sensitive areas of the world (Lambin et al.,2001; Geist and Lambin, 2002). These social and economicpoverty indicators provide metrics of human suffering all ofwhich have strong connections to conservation issues (asshown above).
Themain result of the analysis showswhich of the globallyimportant ecoregions for biodiversity are faced with deep andmultifaceted poverty. It demonstrates the magnitude of thisoverlap and points to the possibility of a vicious cycle betweenpoverty and biodiversity loss. This analysis does not implythat poverty is the underlying driver of the ecosystemdegradation that leads to biodiversity loss. Others havemade strong arguments for the connections between themacro-economic processes and policies of the developedworld as being the underlying drivers of ecosystem changein the developing world (Shiva, 1993; Geist and Lambin, 2002;Martinez-Alier, 2002).
Despite these large-scale drivers there have been manyattempts to integrate poverty alleviation and conservationprojects. Integrated Conservation and Development Projects(ICDPs) have tried multiple general goals like sustainingecosystems while simultaneously creating livelihoods forlocal people through projects like community forestry pro-grams and ecotourism initiatives. These projects have gen-erally been expensive, slow to show results and highlydependant upon local politics and perceptions (Adams, 345).It has been argued that these projects are rarely effective inachieving their multiple goals (Ferraro and Kiss, 2002). Like-wise, straight conservation projects have hindered the eco-nomic development of local people (Naidoo and Adamowicz,2005). The creation of national park and reserves has beenshown to generate social and economic dislocations in Kenya,Uganda, Tanzania and Sri Lanka among others (NortonGrif-fiths and Southey, 1995; Harper, 2002). However, the impactsof reserve creation on local livelihoods needs to be studiedfurther (Brockington et al., 2006; Wilkie et al., 2006).
Although projects attempting to incorporate poverty alle-viation and conservation have had many failures, there arealso examples of successful multiple goal initiatives (Scherr,2003; Adams et al., 2004). The POEMA (Poverty and Environ-ment in Amazonia) project provides farmers with high (local)income through farming amultilayer agroforestry system thatis biodiversity friendly (McNeely and Scherr, 2003). Likewise,villagers near Chitwan National Park in Nepal are entitled topark entrance fees, and funding for park-buffering communityforest systems (McNeely and Scherr, 2003).
Such indirect approaches to conservation and develop-ment are currently being complimented by direct paymentsfor conservation efforts. Ferraro and Kiss (2002) argue that
direct payments for conserving biodiversity benefit poor by“improving cash flows, providing a fungible store of wealthand diversifying sources of household income”. The mostestablished direct payments initiative is Costa Rica's Pay-ments for Ecosystem Services (PES) in which landowners arecompensated for providing ecosystem services such as waterregulation and carbon sequestration. Mexico's paymentscheme pays landowners to conserve forests in hydrologicallyimportant catchments, and similar systems are in place inEcuador and Colombia (Pagiola et al., 2005).
It has been argued that PES systems help to diversify rurallivelihood strategies while providing conservation successes(Rosa et al., 2004). Evidence from Costa Rica supports this aspayments attend to short-term cash constraints, as debt hasbeen shown to be a strong predictor for participation (Zbindenand Lee, 2005). At the same time, it is too early to make anystrong conclusions about the impact such systems have onpoverty alleviation (Pagiola et al., 2005). Such systems may infact intensify poverty in certain locals due to tentativeproperty rights, land take and exclusion and by ignoringtraditional lands uses (Rosa et al., 2004; Pagiola et al., 2005).Participants in Costa Rica's payment system tend to havelarger properties, higher institutional education, and live off-farm (Zbinden and Lee, 2005). This suggests that there mayalready exist market power and information asymmetries inthe PES system, which would hinder the appropriate alloca-tion of costs and benefits. On the other hand this may simplybe a function of the goal of the program, which is ecologicallybased, rather than socially based (poverty alleviation).
Both direct and indirect conservation–development initia-tives have their strengths and weaknesses. Empirically basedevaluations of these programs are increasing, and continue tooffer guiding insight for integrated solutions. While conserva-tion of ecosystems is not identical to the goal of protectingbiodiversity, ecosystem destruction is strongly and clearlylinked to species loss (Ehrlich and Ehrlich, 1981; Tilman et al.,1994; Czech et al., 2000).
9. Conclusion
Adam et al.'s typology demonstrates the range of viewpointssurrounding the conservation–poverty alleviation issue. Theanalysis here suggests that regardless of which viewpoint youhold, the overlap between severe, multifaceted poverty andkey areas of global biodiversity is great, and needs to beacknowledged. The goals of any project will dictate theapproach, but as pointed out here, biodiversity hotspotconservation (or poverty alleviation in and surrounding thehotspots) must consider the large interaction effects betweenconservation and poverty. These interactions are beginning tobe acknowledged more widely and currently many countriesare using poverty maps to prioritize projects, by examiningwhere impoverished areas overlap with degraded ecosystems(FAO, 2003).
This type of integration is crucial for identifying illusive, yetpossible, win–win solutions. Paul Farmer's (2001) “Infectionsand Inequalities” was a watershed work for moving the AIDSdiscourse from its focus on blaming individual behavior to amore holistic view linking AIDS to inequality, poverty and
100 E C O L O G I C A L E C O N O M I C S 6 2 ( 2 0 0 7 ) 9 3 – 1 0 1
political marginalization. The conservation–poverty issue isapproaching a similar revolution in perception. Understand-ing the magnitude of overlap and interactions among poverty,conservation and macroeconomic processes is an absolutenecessity for human wellbeing and ecological sustainability.
Acknowledgements
We thank Myers et al. for their seminal Hotspots paper; CI forthe GIS data layers; Kenneth Mulder and Daniel Lopez Dias fortheir comments on earlier drafts and two anonymousreviewers for their valuable comments. Any errors should beattributed solely to the authors.
Appendix A. Supplementary data
Supplementary data associated with this article can be found,in the online version, at doi:10.1016/j.ecolecon.2006.05.020.
R E F E R E N C E S
Adams, W.M., 2001. Green Development: Environment andSustainability in the Third World. Routledge, New York.
Adams, W.M., Aveling, R., et al., 2004. Biodiversity conservationand the eradication of poverty. Science 306 (5699), 1146–1149.
Balmford, A., Gaston, K.J., et al., 2000. Integrating costs ofconservation into international priority setting. ConservationBiology 14 (3), 597–605.
Balmford, A., Gaston, K.J., et al., 2003. Global variation in terrestrialconservation costs, conservation benefits, and unmetconservation needs. Proceedings of the National Academy ofSciences of the United States of America 100 (3), 1046–1050.
Boyce, J.K., 1994. Investing in human and natural capital. In:Jansson, A., Hammer, M., Folke, C., Costanza, R. (Eds.),Investing in Natural Capital: The Ecological EconomicsApproach to Sustainability. Island Press, Washington, DC.
Brockington, D., Igoe, J., et al., 2006. Conservation, human rights,and poverty reduction. Conservation Biology 20 (1), 250–252.
Capistrano, A., Kiker, C., 1995. Macroscale economics influenceson tropical forest depletion. Ecological Economics 14 (1),21–29.
CIA, 2005. TheWorldFactbook.http://www.cia.gov/cia/publications/factbook/.
Cincotta, R.P., Wisnewski, J., et al., 2000. Human population in thebiodiversity hotspots. Nature 404 (6781), 990–992.
Czech, B., Krausman, P.R., et al., 2000. Economic associationsamong causes of species endangerment in the United States.Bioscience 50 (7), 593–601.
Dasgupta, P., 2002. Economic Development, EnvironmentalDegradation, and the Persistence of Deprivation in PoorCountries. World Summit on Sustainable Development,Johannesburg.
Deacon, R.T., 1994. Deforestation and the rule of law in across-section of countries. Land Economics 70 (4), 414–430.
Ehrlich, P.R., Ehrlich, A.H., 1981. Extinction: The Causes andConsequences of the Disappearance of Species. RandomHouse, New York.
FAO, 2003. The State of Food Insecurity in the World. Food andAgriculture Organization of the United Nations.
Farmer, P., 2001. Infections and Inequalities: The Modern Plagues.University of California Press, Berkeley.
Ferraro, P., Kiss, A., 2002. Ecology – direct payments to conservebiodiversity. Science 298 (5599), 1718–1719.
Gardner-Outlaw, T., Engelman, R., 1997. Sustaining Water, EasingScarcity: A Second Update. Population Action International,Washington, DC.
Geist,H., Lambin, E., 2002. Proximate causes andunderlyingdrivingforces of tropical deforestation. Bioscience 52 (2), 143–150.
Gleick, P., 1999. The World's Water. Island Press, Washington, DC.Harper, J., 2002. Endangered Species: Health, Illness and Death
Among Madagascar's People of the Forest. Carolina AcademicPress, Durham, NC.
Lambin, E.F., Turner, B.L., et al., 2001. The causes of land-use andland-cover change: moving beyond the myths. GlobalEnvironmental Change – Human and Policy Dimensions 11 (4),261–269.
Mahapatra, K., Kant, S., 2005. Tropical deforestation: amultinomial logistic model and some country-specific policyprescriptions. Forest Policy and Economics 7 (1), 1–24.
Martinez-Alier, J., 2002. The Environmentalism of the Poor: AStudy of Ecological Conflicts and Valuation. Edward Elgar,Cheltenham, UK.
McNeely, J.A., Scherr, S.J., 2003. Ecoagriculture: Strategies to Feedthe World and Save Wild Biodiversity. Island Press,Washington.
Munasinghe, M., 1993. Environmental economics and biodiversitymanagement in developing-countries. Ambio 22 (2–3), 126–135.
Myers, N., Mittermeier, R.A., et al., 2000. Biodiversity hotspots forconservation priorities. Nature 403 (6772), 853–858.
Naidoo, R., Adamowicz, W.L., 2005. Economic benefits ofbiodiversity exceed costs of conservation at an Africanrainforest reserve. Proceedings of the National Academy ofSciences of the United States of America 102 (46), 16712–16716.
NortonGriffiths, M., Southey, C., 1995. The opportunity costs ofbiodiversity conservation in Kenya. Ecological Economics 12(2), 125–139.
O'connor, C., Marvier, M., et al., 2003. Biological vs. social,economic and political priority-setting in conservationEcology Letters 6 (8), 706–711.
Olson, D., Dinerstein, E., 1998. The global 200: a representationapproach to conserving the Earth's most biologically valuableecoregions. Conservation Biology 12 (3), 502–515.
Owusu, J., 1998. Current convenience, desperate deforestation:Ghana's adjustment program and the forestry sectorProfessional Geographer 50 (4), 418–436.
Pagiola, S., Arcenas, A., et al., 2005. Can payments forenvironmental services help reduce poverty? An exploration ofthe issues and the evidence to date from Latin America. WorldDevelopment 33 (2), 237–253.
Perrings, C., Gadgil, M., 2003. Conserving biodiversity: reconcilinglocal and global public benefits. In: Kaul, I., Conceicao, P., LeGoulven, K., Mendoza, R.U. (Eds.), Providing Global PublicGoods. Managing Globalization. United Nations DevelopmentProgramme. Oxford University Press, New York, pp. 532–555.
Pimm, S., Ayres, M., et al., 2001. Environment – can we defynature's end? Science 293 (5538), 2207–2208.
Rosa, H., Barry, D., et al., 2004. Compensation for EnvironmentalServices and Rural Communities: Lessons from the Americas.Political Economy Research Institute, Amherst.
Sanderson, S., 2005. Poverty and Conservation: The New Century's“Peasant Question”? World Development 33 (2), 323–332.
Scherr, S., 2003. Hunger, Poverty and Biodiversity in DevelopingCountries. Mexico Action Summit, Mexico.
Shiva, V., 1993. Monocultures of the Mind: Perspectives onBiodiversity and Biotechnology. Natraj Publishers, Dehra Dun.
Sisk, T.D., Launer, A.E., Switky, K.R., Ehrlich, P.R., 1994. Identifyingextinction threats. BioScience 44 (9), 592–604.
Smith, T., Kark, S., et al., 2001. Biodiversity hotspots and beyond:the need for preserving environmental transitions. Trends inEcology and Evolution 16 (8), 431.
101E C O L O G I C A L E C O N O M I C S 6 2 ( 2 0 0 7 ) 9 3 – 1 0 1
Smith, R., Muir, R., et al., 2003. Governance and the loss ofbiodiversity. Nature 426 (6962), 67–70.
Snel, M., 2004. Poverty–Conservation Mapping Applications. IUCNWorld Conservation Congress.
Tilman, D., May, R.M., et al., 1994. Habitat destruction and theextinction debt. Nature 371 (6492), 65–66.
UN, 2002. Least Developed Countries Report. United Nations, NewYork.
UN,2005.MillenniumIndicatorsDatabase.http://millenniumindicators.un.org/unsd/mi/mi_goals.asp.
Veech, J.A., 2003. Incorporating socioeconomic factors into theanalysis of biodiversity hotspots. Applied Geography 23 (1),73–88.
Vitousek, P., 1997. Human domination of Earth's ecosystems (vol277, pg 494, 1997). Science 278 (5335), 21.
Wilkie, D.S., Morelli, G.A., et al., 2006. Parks and people: assessingthe human welfare effects of establishing protected areas forbiodiversity conservation. Conservation Biology 20 (1), 247–249.
World Development Indicators, 2005. http://www.worldbank.org/data/, The World Bank.
World Development Report. The World Bank, Washington, DC.Zbinden, S., Lee, D.R., 2005. Paying for environmental services: an
analysis of participation in Costa Rica's PSA program. WorldDevelopment 33 (2), 255–272.