Embed Size (px)
Citation preview

Economic Affairs, Vol. 62, No. 1, pp. 185-197, March 2017DOI: 10.5958/0976-4666.2015.00104.7
©2017 New Delhi Publishers. All rights reserved
Poverty Alleviation through Wage Employment: Synergies and Trade-off with Agricultural ProductivityPushpa, Smita Sirohi, Bulbul G. Nagrale and Janailin Papang
Department of Dairy Economics Statistics & Management, National Dairy Research Institute, Karnal, India
Corresponding author: [email protected]
ABSTRACT
Poverty is pronounced deprivation in well-being, and comprises many dimensions. It includes low incomes and the inability to acquire the basic goods and services necessary for survival with dignity (according to World Bank). But according to a recent survey by an Indian government committee constituted to estimate poverty, nearly 38% of India’s population (380 million) is poor. This report is based on new methodology and the figure is 10% higher than the present poverty estimate of 28.5%. The committee headed by S.D. Tendulkar has used a different methodology to reach at the current figure. Such a high incidence of poverty is a matter of concern in view of the fact that poverty eradication has been one of the major objectives of the development planning process. The MNREGA is undoubtedly an innovative piece of legislation that has no parallel programme anywhere in the world. But there are some issues which need emphasis so that the real purpose of the wage employment schemes could be identified. This paper discusses the impact of MNREGA on society in terms of poverty reduction, agricultural production and how MNREGA is affecting the agricultural wage rate as well as cost of cultivation of field crops over the year. This study also tries to prove that there is a relationship between the agricultural crisis (labour crisis) and MNREGA Scheme.
Keywords: Agricultural wage rate, cost of cultivation MNREGA, poverty
On one hand MNREGA is snatching labourers from agriculture due to higher wage rate under MNREGA scheme, on the other it is the major cause for increasing the cost of cultivation for the crops because due to increment in MNREGA wages, agricultural wages are also increasing, which in turns increasing prices of farm produce which may create food inflation, and again the question will arise the people living under BPL how they will fulfil their basic consumption need. The major objective of MNREGA is to enhance the livelihood of rural poor by providing wage employment and alleviating poverty. But the ground reality is that due to continuous increase in cost of living, the real income of the people who are working under MNREGA is not increasing.Several studies on rural employment diversification in India (Kumar, 2009; Mukhopadhyay and Rajaraman, 2007; Chadha and Sahu, 2002; Visaria,
1995; Basant and Kumar, 1989 Chadha, 1993; Kumar et al., 2003; Samal et al., 2006; Bhakar et al., 2007, Rawal et al., 2008, Sawant and Achutan, 1995; Sawant, 1997; Singh et al., 1997; Chand, 1999; Ahluwalia, 2000; Mathur et al., 2006; Kumar and Elumalai, 2007; Bhalla and Singh, 2009) have concluded that the share of non-farm sector in rural employment has significantly grown over time and the capacity of the farm sector to absorb additional labour force has almost reached a plateau. Many studies have highlighted the role of non-farm sector in providing employment and improving income and standard of living of rural population (MoRD, 2012 cited by Gulati et al., 2013, Shah, 2009; Mukherjee and Sinha, 2011; Dutta et al., 2012; MoRD, 2012; Mann and Ramesh, 2013) while some have observed farming to be still a major source of income. However, the regional pattern of agricultural growth and development in India
Pushpa et al.
186
has been studied mostly at the state level (Harish et al., 2011; Narayanamoorthy and Alli, 2012; 2013; Gulati et al., 2013, Shah, 2009; Dutta et al., 2012; Berg et al., 2012; Gulati, 2013, although a few studies at district level exist (Dev, 1985; Bhalla and Alagh, 1979; Bhalla and Tyagi, 1989; Bhalla and Singh, 1997; Chand et al., 2009; Bhalla and Singh, 2010). It was increasingly argued in previous studies that this employment scheme has been seriously affecting the growth of agricultural sector, which has been passing through a serious crisis since early-1990s because of increased cost of cultivation and poor remuneration from crop cultivation.The big question here is that can MNREAG alone solve the problem of poverty alleviation? So the need of the hour is to strengthen synergy between NREGA and agriculture and work taken up under MGNREGA should be planned in such a way that labours are strictly employed for the scheme after the sowing and harvesting seasons of Rabi and Kharif crops are over. This planning has to be done at the panchayat, block and district levels depending upon the cropping pattern of the respective regions. MNREGA scheme should be based on the enhancement of agricultural production and creation of permanent assets like production of manures and bio pesticides unit, market infrastructure, construction of seed storage bins, shelter for cattle and poultry, irrigation channels and soil conservation activities etc. Because the real success of MNREGA will lie in raising agricultural productivity of those millions of farmers who will be able return once again to farming and no longer need to depend on the MNREGA for their survival.The NREGA is undoubtedly an innovative piece of legislation that has no parallel programme anywhere in the world. But there are some issues which need emphasis so that the real purpose of the wage employment schemes could be identified. This paper discusses the impact of MNREGA on society in terms of poverty reduction and agricultural production, means poverty has decreased or not and how MNREGA is affecting the agricultural wage rate, agricultural production and cost of cultivation of field crops over the year. This study also tries to show that there is a relationship between the agricultural crisis (labour crisis) and MNREGA Scheme.
Historical Perspective of Poverty Alleviation Programmes in India
Poverty eradication is considered an integral to humanity’s mission for sustainable development. Thus, reduction of poverty in India is vital for the attainment of international goals. The philosophy underlying the poverty alleviation programs is to tackle the rural poverty by endowing the poor with productive assets and training for raising their skills so that they are assured of a regular stream of employment and income in raising themselves above the poverty line. The Indian National Congress constituted a National Planning Committee in early 1938 which declared that the social objective should be “to ensure an adequate standard of living for the masses, in other words, to get rid of the appalling poverty to the people.”2 The importance of poverty alleviation and the provisions of other basic needs have been emphasized in all the successive plans particularly since Fifth Five Year Plan. The growth models used to suppose that overall economic growth, while benefitting the rich primarily, would allow trickle down of its fruits to the poor. But this has not happened due to much stress on modern sector and non agricultural pursuits which have resulted entirely rural growth and enhanced rural poverty. With this realization the government introduced a number of area and target oriented development programmes for the rural areas with an aim to reduce poverty and unemployment among the rural poor.These programmes in the First Five Year Plan are Community Development Programme (1952) and National Extension Scheme (1953), in Second Five Year Plan Khadi and Village Industries (1957), Multipurpose Tribal Development Blocks (1959) Package Programme (1960) and Intensive Agricultural District Development Programme (1960) were introduced.Three annual plans, the following important programmes were undertaken in the Third Five Year Plan, Rural Work Programme (1967), Tribal Development Block (1968), and Rural Man Power Programme (1969). Fourth five year plan initiated Drought Prone Area Programme (1970), Crash Scheme for Rural Employment (1971), Pilot Intensive Rural Development Employment Programme (1972), and Minimum Needs Programme (1972). Fifth Five
Poverty Alleviation through Wage Employment: Synergies and Trade-off with Agricultural Productivity
187
Year Plan focused on Training of Rural Youth for Self Employment (1979) and Integrated Rural Development Programme (1979). In Sixth Five Year Plan National Rural Employment Programme (1980) and Development of Women and Children in Rural Area (1983). Latter Rural Landless Employment Guarantee Programme, Jawahar Rozgar Yojana (1989), Swarna Jayanti Gram Swarozgar Yojana (1999), The Sampoorna Grameen Rozgar Yojana was launched on 25 September 2001 by merging the provisions of Employment Assurance Scheme (EAS) and Jawahar Gram Samridhi Yojana (JGSY). Government of India flooded huge amount of money to promote the rural employment through various programmes in order to eradicate poverty. These schemes were implemented to uplift the living conditions of the poor people but the results were not achieved as it was expected.
Progress of MNREGA
Through the data it was observed that the government had provided Employment to 4.5 crores households in 2010-11 up to Dec. 10. It is a great achievement by the Indian government. Among them Women constitute 47% while Scheduled Castes account for 28%, and Scheduled Tribes 24% of the workers under Mahatma Gandhi MNREGA in the year 2010-11. The average wages per day under MNREGA has gone up from ` 65 in 2006-07 to ` 100 in 2010-11. In union territory the salary level will be risen up to ` 170. Wage rates enhanced by 17-30% by linkage with Consumer Price Index for
Agricultural labour calculated on the basis of Rs. 100 or the actual wage rate. However it is very hard to open account in banks and post offices, but around 10 crores accounts of MNREGA beneficiaries opened in post offices and banks contributing to financial inclusion. The government has increases the allocation of funds for 2010-11 raised to ` 40,100 crores from 11300 crores for 2006-07 financial years. Water Conservation, irrigation and land development account for over 75% of work taken up in 2010-11. It is evidenced that so far more than 68 lakhs works has been taken up under MNREGA and Social Audits conducted in 73% Panchayats.
Efficacy of MNREGA in Poverty Alleviation
The MNREGA is undoubtedly an innovative piece of legislation that has no parallel programme anywhere in the world. From the available literature it is evidenced that MNREGA has created positive impact on generating employment, steaming migration from rural areas to urban areas, rural poverty reduction, augmenting income and employment, improving infrastructure in rural areas. Even though Indian government is facing various challenges like hunger, poverty, agricultural labour crisis, food inflation due to increase in cost of cultivation of crops and labour crisis in industrial sector also.The Act, in its five years of rapid expansion from 200 to 625 districts, has provided evidence of positive outcomes, even though its performance across the
Table 1: Progress of MNREGA
Features (FY 2006-07) 200 Districts
(FY 2007-08) 330 Districts
(FY 2008-09) 615 Districts
(FY 2009-10) 619 Districts
(FY 2010-11) 625 Districts Till
Dec. 2010Employment provided to households
(in cr)2.10 3.39 4.51 5.26 4.50
Total: [in ` Lakhs]: 90.5 143.59 216.32 283.59 145SCs : [in Per cent]: 25% 27% 29% 30% 24 %
STs: 36% 29% 25% 21% 28%Women: 40% 43% 48% 48% 47%
Budget Outlay: (In ` Crore) 11300 12000 30000 39,100 40,100Expenditure on wages (in Per cent) 66% 68% 67% 70% 71%
Average Wage per day (In `) ` 65 ` 75 ` 84 ` 90 ` 100Total works taken up (In Lakhs): 8.35 17.88 27.75 46.17 68.60
Pushpa et al.
188
country has been unequal. It is pertinent to look at the outcomes and trends because they prompt the questions discussed here – what factors have been facilitating and what factors have not. The average wage rate earned rose incrementally from ` 65 per day to ` 90 per day from 2006 to 2010. The NSSO round (64th) ratifies the Mahatma Gandhi NREGA MIS data on the wage rate, indicating a wage rate of ` 75 per day.
MNREGA Wages have increased or not?
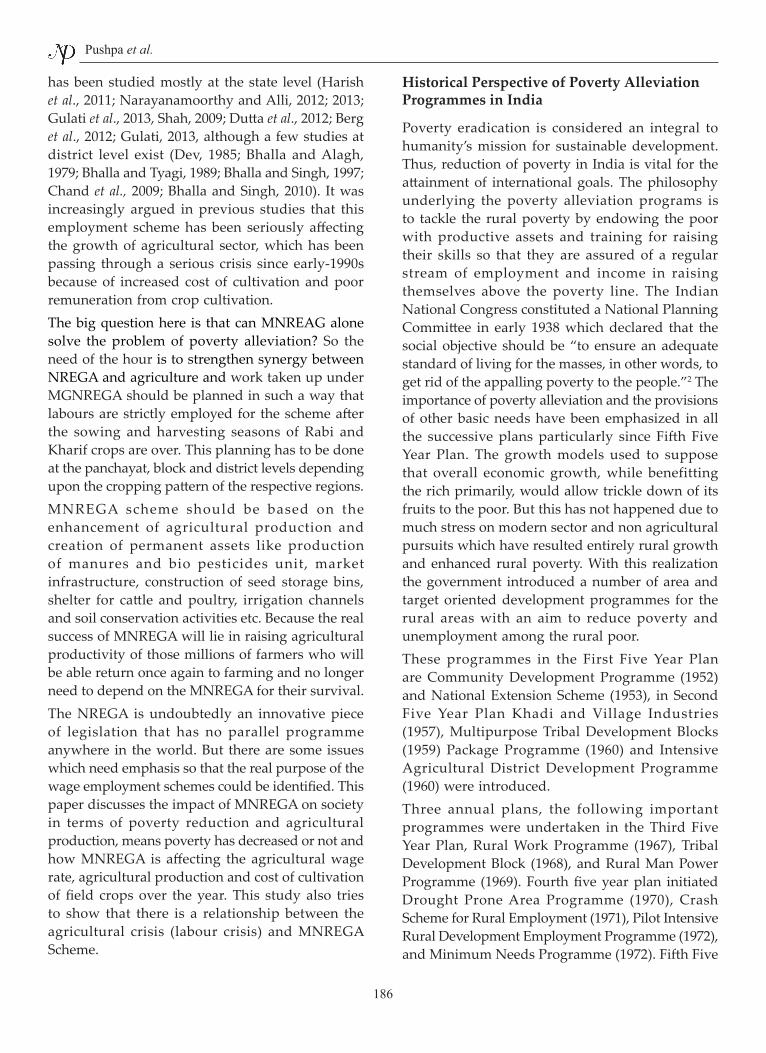
If we deflate MNREGA nominal income with consumer price index then we can find out the real income of the persons who are employed under MNREGA as it is clearly depicted in the table (Table 2). Although the nominal wages for MNREGA is continuously increasing but when we talk about the increment in real terms in is not at all increasing. The growth rate of real and nominal wages has been calculated to show that how real wages are decreasing over the year.
The given below table (Table 3) shows that there are 10 states where growth rate in terms of real wages are in negative magnitude, and out of these 10 states Andhra Pradesh, Kerala and Tamil Nadu are having lowest growth rate. If we compare these states growth rate (MNREGA real wage) with their poverty ratio, we will found that the poverty ratios of those respective states are higher than the other states except few states like Punjab as it is clearly depicted in the given below graph. On the bases of analysing these secondary data we can say that the whatever nominal increment government is giving to MNREGA employees all are observed by the increase in inflation, increasing cost of producing commodities which are demanded by the labour force.So in nominal term income is increasing but in real sense it is decreasing over the time period, and if income is not increasing then how MNREGA is reducing rural poverty.
Table 2: Real Wage Rate of MNREGA Deflated From CPIAL Base Year 1986-87 (`/day)
States 2005-06 2006-07 2007-08 2008-09 2009-10Andhra Pradesh 21.56 21.45 19.30 17.05 16.67
Assam 17.13 17.11 17.58 17.10 16.73Bihar 19.60 18.26 19.44 19.08 19.50
Meghalaya 13.55 13.77 15.14 14.75 16.60Haryana 25.27 23.95 27.79 24.04 25.68
Himachal Pradesh 20.41 18.75 20.05 18.25 24.07Jammu & Kashmir 12.53 15.31 18.16 19.87 19.08
Karnataka 18.48 18.12 17.81 17.69 16.65Kerala 35.11 32.30 29.16 26.43 25.95
Madhya Pradesh 16.76 15.23 15.41 15.95 15.94Maharashtra 12.77 25.80 20.76 15.73 16.76
Manipur 20.12 20.77 21.53 19.90 27.69Meghalaya 18.32 17.07 22.78 21.69 21.30
Orissa 16.47 15.53 19.25 15.82 21.41Punjab 26.58 23.98 22.66 22.08 21.08
Rajasthan 19.36 18.16 17.93 18.02 15.25Tamil Nadu 22.54 22.29 19.18 17.52 13.93
Tripura 16.52 15.17 22.75 23.83 21.35Uttar Pradesh 19.68 18.43 18.43 18.04 18.50West Bengal 19.59 19.18 20.00 18.10 17.92
India 15.75 16.34 17.79 18.25 17.02
Source: Real Wage Rate Calculated from Economic Survey 2010-11 and data available at official website of MNREGA www.nrega.nic.in; wage cost per day.

Poverty Alleviation through Wage Employment: Synergies and Trade-off with Agricultural Productivity
189
Table 3: Growth Rate of Nominal and Real Wages Under MNREGA in Different States from 2005-06 to
2009-10 (%)
States MNREGA WagesReal Wages Nominal Wages
Andhra Pradesh -7.2 2.4Assam -0.5 8.6Bihar 0.3 9.6
Gujarat 4.9 14.6Haryana 0.4 12.1
Himachal Pradesh 3.1 10.2Jammu & Kashmir 11.6 22.2
Karnataka -2.3 9.3Kerala -7.7 0.5
Madhya Pradesh -0.5 9.6Maharashtra 0.5 11.2
Manipur 6.1 15.5Meghalaya 5.5 15.0
Orissa 5.6 16.3Punjab -5.3 5.2
Rajasthan -4.7 5.4Tamil Nadu -11.3 -2.6
Tripura 10.1 18.0Uttar Pradesh -1.4 7.5West Bengal -2.3 7.3
India 2.7 13.0
Source: Real Wage Rate Calculated from Economic Survey 2010-11 and data available at official website of MNREGA www.nrega.nic.in; wage cost per day.
-20
-10
0
10
20
30
40
50
Andh
ra P
rade
sh
Assa
m
Biha
r Gu
jara
tGu
jara
t Ha
ryan
a Hi
mac
hal P
rade
sh
Jam
mu
& K
ashm
ir
Mnrega Re
Karn
atak
a Ke
rala
Mad
hya
Prad
esh
eal Wages Grow
Mah
aras
htra
M
anip
ur
Meg
hala
ya
Oris
sa
wth Rate
Oris
sa
Punj
ab
Raja
stha
n Ta
mil
Nad
u
Poverty Ratio
Trip
ura
Utt
ar P
rade
sh
Wes
t Ben
gal
o
Indi
a
Fig. 1: MNREGA Wage Rate and Poverty Ratio
On the bases of real wage growth rate we can divide whole states into three categories that is high, medium, and low wage growth rate respectively. Jammu & Kashmir, Tripura, Meghalaya, Manipur,
Meghalaya and Orissa are coming under high growth rate states whose growth rate in real wages is higher than the National average growth rate and on the other hand Tamil Nadu, Kerala, Andhra Pradesh, Karnataka, Uttar Pradesh, Punjab, Madhya Pradesh, Assam, Rajasthan and West Bengal these states are coming under low growth rate and their real wage growth rate is negative an magnitude as well as far below than the national average growth rate, which indicates that, the real income of the people who are employed under MNREGA is not at all increasing due to continuous increase in consumer price index and inflation.
Table 4: Classification of States on the Bases of Growth Rate of MNREGA Real Wages
Growth Rakning
States MNREGA WagesReal Nominal
HIGH Jammu & Kashmir 11.6 22.1Tripura 10.1 18.0
Manipur 6.1 15.5Orissa 5.6 10.3
Meghalaya 5.5 10.3MEDIUM Gujarat 4.9 14.6
Himachal Pradesh 3.1 10.1Haryana 0.4 12.1
Maharashtra 0.5 11.2Bihar 0.4 12.1
LOW Tamil Nadu -11.3 -2.6Kerala -7.7 0.5
Andhra Pradesh -7.2 2.4Punjab -5.3 5.2
Rajasthan -4.7 5.4West Bengal -2.3 7.3Karnataka -2.3 9.3
Uttar Pradesh -1.4 7.5Madhya Pradesh -0.5 9.6
Assam -0.5 8.6INDIA 2.7 13.0
Agricultural Wages have increased or not?
MNREGA has a great influence on the wages of agriculture, as the minimum wages for MNREGA is higher than the agricultural wages in almost all the states of India except few like Punjab and Haryana. Due to this continuous increase in MNREGA wages agricultural wages are also affected, as it is depicted in the given below table (Table 5) and graph

Pushpa et al.
190
also that how drastically agricultural wages had increased after the implementation of MNREGA.
Table 5: Growth Rate of Wages in Different States from 2005-06 to 2009-10 (%)
States MNREGA Wages
Agricultural Wages
Real Nominal Real NominalAndhra Pradesh -7.2 2.4 8.9 20.1
Assam -0.5 8.6 -1.2 7.8Bihar 0.3 9.6 -0.4 8.8
Gujarat 4.9 14.6 -1.8 7.3Haryana 0.4 12.1 0.8 12.6
Himachal Pradesh 3.1 10.2 8.4 15.9Jammu & Kashmir 11.6 22.2 7.1 17.2
Karnataka -2.3 9.3 -1.0 10.8Kerala -7.7 0.5 3.3 12.6
Madhya Pradesh -0.5 9.6 -1.2 8.9Maharashtra 0.5 11.2 -1.0 9.5
Manipur 6.1 15.5 -0.3 8.4Meghalaya 5.5 15.0 1.5 10.6
Orissa 5.6 16.3 -0.2 9.9Punjab -5.3 5.2 0.1 11.1
Rajasthan -4.7 5.4 1.5 12.2Tamil Nadu -11.3 -2.6 1.2 11.2
Tripura 10.1 18.0 2.1 9.4Uttar Pradesh -1.4 7.5 0.3 9.4West Bengal -2.3 7.3 -0.8 9.0
India 2.7 13.0 4.7 15.3
Source: Real Wage Rate Calculated from Economic Survey 2010-11 and data available at official website of MNREGA www.nrega.nic.in; wage cost per day, and Directorate of Economics and Statistics, Govt. of India.
48.58 52.99 58.90 69.50
86.35 56.4
63.4 74.2
84.3 90.2
0.00
50.00
100.00
150.00
200.00
2005-06 2006-07 2007-08 2008-09 2009-10
Agricultural Nominal Wages MNREGA Nominal Wage
Fig. 2: Increase in minimum wages for Agricultural labourers after MNREGA (`/day)
If we compare the growth rate of MNREGA Nominal wages and growth rate of agricultural wages we can find out that the growth rate for agricultural wages is much higher than the MNREGA wage growth rate, which indicates that as the wages for MNREGA is increasing agricultural wages are also increasing in the same magnitude or greater than the MNREGA growth rate.
Table 6: Correlation Between MNREGA Nominal Wages and Agricultural Wages
X X2 Y Y2 XY56.4 3180.96 48.58 2360.9 2739.9163.4 4019.56 52.99 2807.94 33559.5774.2 5505.64 58.90 3469.21 4370.3884.3 7106.49 69.50 4830.25 5858.8590.2 8136.04 86.35 7456.323 7788.77368.5 27948.7 316.32 20923.74 24117.5
Where,X= MNREGA Nominal Wages (All India Average
Wage Rate in `/day)Y= Agricultural Wages (All India Average Wage
Rate in `/day
2 2*
XYr
X Y
Σ=
Σ Σ
r = 0.947849
The correlation between the MNREGA nominal wages and agricultural wages shows that there is strong positive correlation between these two wages, as the given correlation coefficient value is 0.94, which indicates that as the MNREGA wages are increasing, Agricultural wages are also increasing in the same direction. Due to this drastic increase in MNREGA as well as agricultural wages there are some other issues which are very important to discuss hear.
MNRGA and Cost of Agricultural Production
Earlier we have discussed about that how agricultural wages had increased after the implementation of MNREGA scheme. Now we want to know that weather this increase in agricultural wages had any effect on cost of agricultural production. Although over the year cost of cultivation of field crops is increasing but one cannot say that this increase
Poverty Alleviation through Wage Employment: Synergies and Trade-off with Agricultural Productivity
191
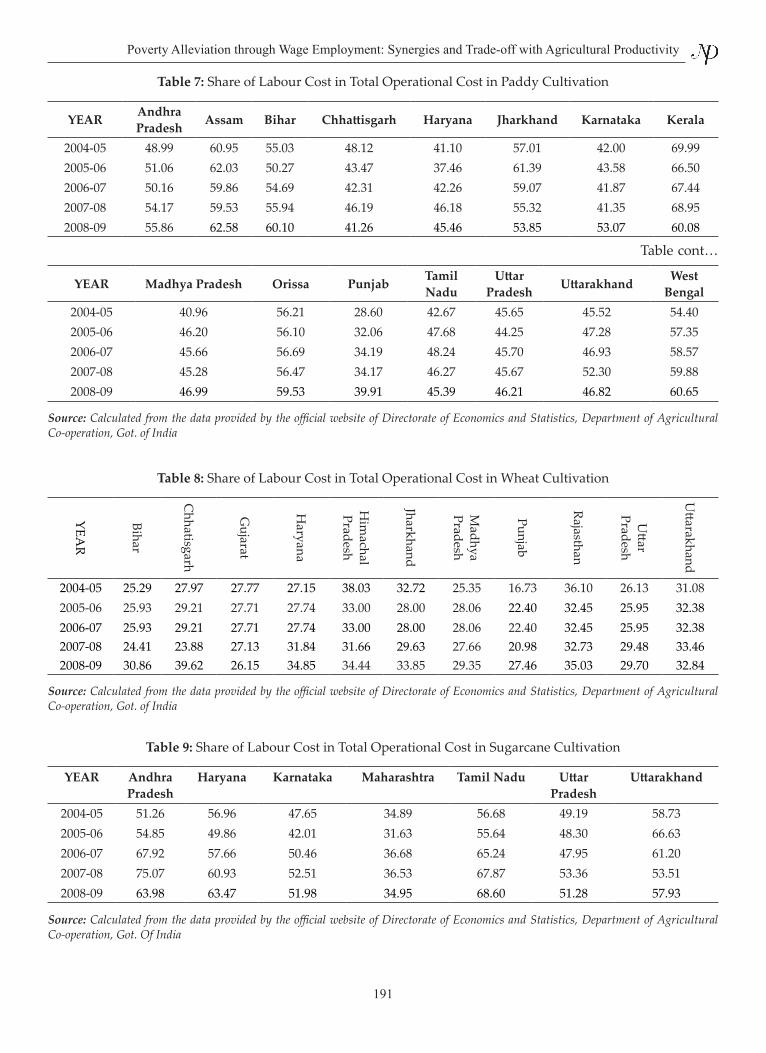
Table 7: Share of Labour Cost in Total Operational Cost in Paddy Cultivation
YEAR Andhra Pradesh Assam Bihar Chhattisgarh Haryana Jharkhand Karnataka Kerala
2004-05 48.99 60.95 55.03 48.12 41.10 57.01 42.00 69.992005-06 51.06 62.03 50.27 43.47 37.46 61.39 43.58 66.502006-07 50.16 59.86 54.69 42.31 42.26 59.07 41.87 67.442007-08 54.17 59.53 55.94 46.19 46.18 55.32 41.35 68.952008-09 55.86 62.58 60.10 41.26 45.46 53.85 53.07 60.08
Table cont…
YEAR Madhya Pradesh Orissa Punjab Tamil Nadu
Uttar Pradesh Uttarakhand West
Bengal2004-05 40.96 56.21 28.60 42.67 45.65 45.52 54.402005-06 46.20 56.10 32.06 47.68 44.25 47.28 57.352006-07 45.66 56.69 34.19 48.24 45.70 46.93 58.572007-08 45.28 56.47 34.17 46.27 45.67 52.30 59.882008-09 46.99 59.53 39.91 45.39 46.21 46.82 60.65
Source: Calculated from the data provided by the official website of Directorate of Economics and Statistics, Department of Agricultural Co-operation, Got. of India
Table 8: Share of Labour Cost in Total Operational Cost in Wheat Cultivation
YEAR
Bihar
Chhatisgarh
Gujarat
Haryana
Him
achal Pradesh
Jharkhand
Madhya
Pradesh
Punjab
Rajasthan
Uttar
Pradesh
Uttarakhand
2004-05 25.29 27.97 27.77 27.15 38.03 32.72 25.35 16.73 36.10 26.13 31.082005-06 25.93 29.21 27.71 27.74 33.00 28.00 28.06 22.40 32.45 25.95 32.382006-07 25.93 29.21 27.71 27.74 33.00 28.00 28.06 22.40 32.45 25.95 32.382007-08 24.41 23.88 27.13 31.84 31.66 29.63 27.66 20.98 32.73 29.48 33.462008-09 30.86 39.62 26.15 34.85 34.44 33.85 29.35 27.46 35.03 29.70 32.84
Source: Calculated from the data provided by the official website of Directorate of Economics and Statistics, Department of Agricultural Co-operation, Got. of India
Table 9: Share of Labour Cost in Total Operational Cost in Sugarcane Cultivation
YEAR Andhra Pradesh
Haryana Karnataka Maharashtra Tamil Nadu Uttar Pradesh
Uttarakhand
2004-05 51.26 56.96 47.65 34.89 56.68 49.19 58.732005-06 54.85 49.86 42.01 31.63 55.64 48.30 66.632006-07 67.92 57.66 50.46 36.68 65.24 47.95 61.202007-08 75.07 60.93 52.51 36.53 67.87 53.36 53.512008-09 63.98 63.47 51.98 34.95 68.60 51.28 57.93
Source: Calculated from the data provided by the official website of Directorate of Economics and Statistics, Department of Agricultural Co-operation, Got. Of India
Pushpa et al.
192
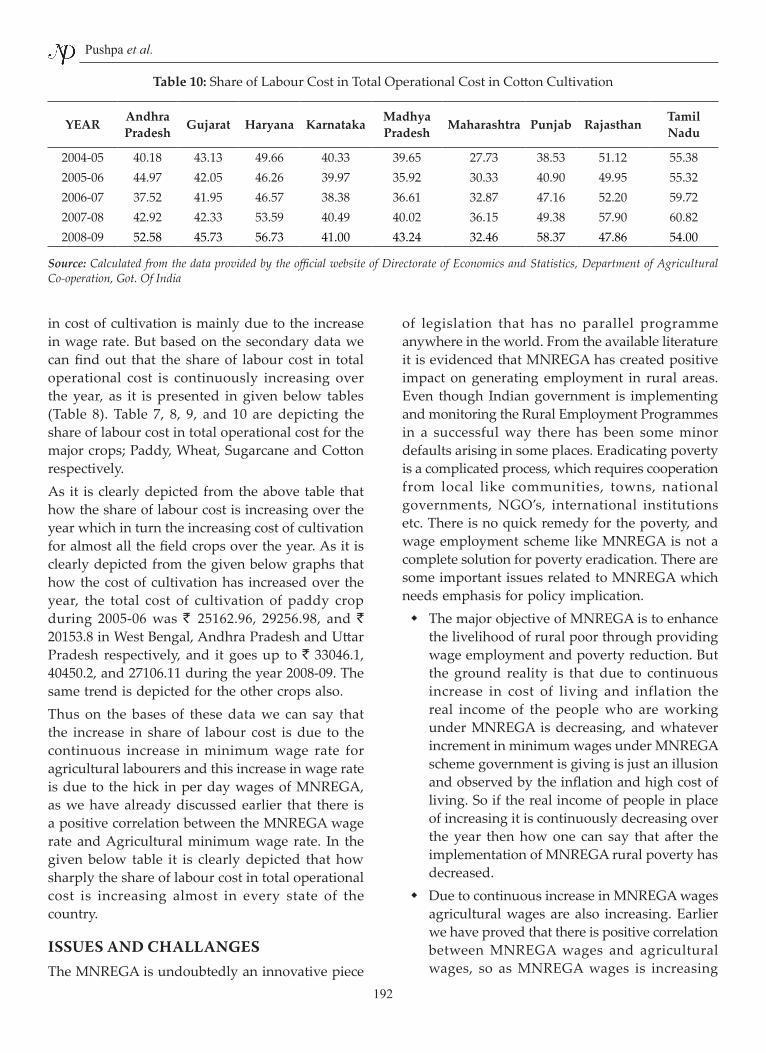
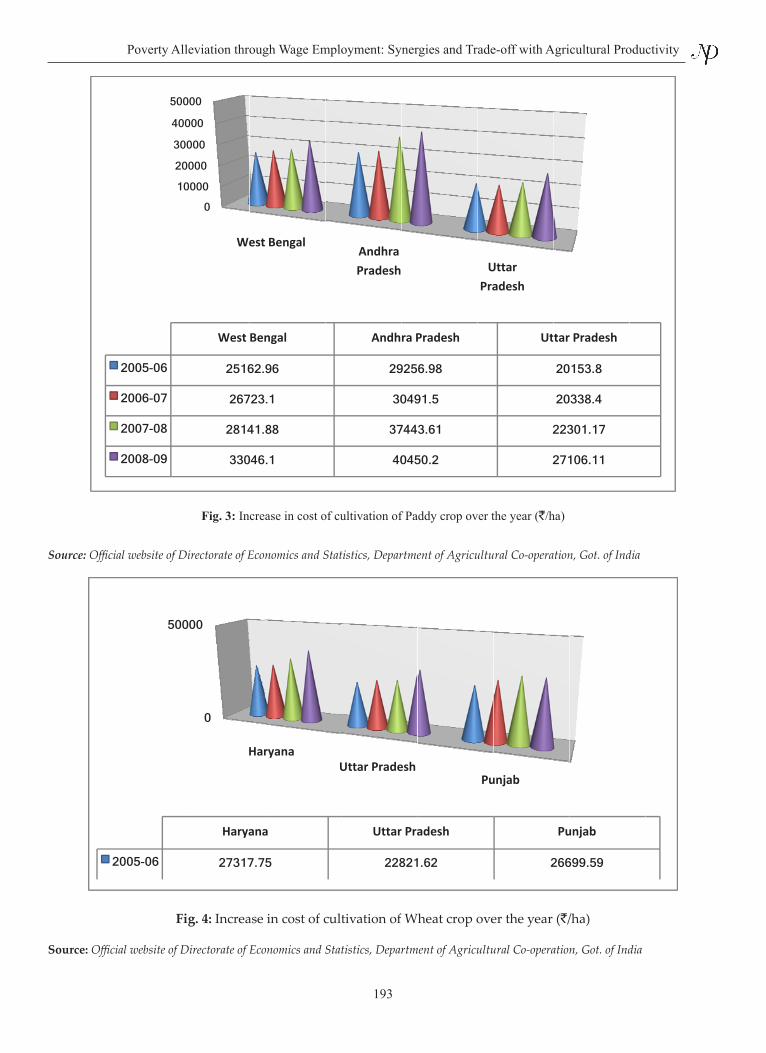
in cost of cultivation is mainly due to the increase in wage rate. But based on the secondary data we can find out that the share of labour cost in total operational cost is continuously increasing over the year, as it is presented in given below tables (Table 8). Table 7, 8, 9, and 10 are depicting the share of labour cost in total operational cost for the major crops; Paddy, Wheat, Sugarcane and Cotton respectively.As it is clearly depicted from the above table that how the share of labour cost is increasing over the year which in turn the increasing cost of cultivation for almost all the field crops over the year. As it is clearly depicted from the given below graphs that how the cost of cultivation has increased over the year, the total cost of cultivation of paddy crop during 2005-06 was ` 25162.96, 29256.98, and ` 20153.8 in West Bengal, Andhra Pradesh and Uttar Pradesh respectively, and it goes up to ` 33046.1, 40450.2, and 27106.11 during the year 2008-09. The same trend is depicted for the other crops also.Thus on the bases of these data we can say that the increase in share of labour cost is due to the continuous increase in minimum wage rate for agricultural labourers and this increase in wage rate is due to the hick in per day wages of MNREGA, as we have already discussed earlier that there is a positive correlation between the MNREGA wage rate and Agricultural minimum wage rate. In the given below table it is clearly depicted that how sharply the share of labour cost in total operational cost is increasing almost in every state of the country.
ISSUES AND CHALLANGESThe MNREGA is undoubtedly an innovative piece
of legislation that has no parallel programme anywhere in the world. From the available literature it is evidenced that MNREGA has created positive impact on generating employment in rural areas. Even though Indian government is implementing and monitoring the Rural Employment Programmes in a successful way there has been some minor defaults arising in some places. Eradicating poverty is a complicated process, which requires cooperation from local like communities, towns, national governments, NGO’s, international institutions etc. There is no quick remedy for the poverty, and wage employment scheme like MNREGA is not a complete solution for poverty eradication. There are some important issues related to MNREGA which needs emphasis for policy implication.
� The major objective of MNREGA is to enhance the livelihood of rural poor through providing wage employment and poverty reduction. But the ground reality is that due to continuous increase in cost of living and inflation the real income of the people who are working under MNREGA is decreasing, and whatever increment in minimum wages under MNREGA scheme government is giving is just an illusion and observed by the inflation and high cost of living. So if the real income of people in place of increasing it is continuously decreasing over the year then how one can say that after the implementation of MNREGA rural poverty has decreased.
� Due to continuous increase in MNREGA wages agricultural wages are also increasing. Earlier we have proved that there is positive correlation between MNREGA wages and agricultural wages, so as MNREGA wages is increasing
Table 10: Share of Labour Cost in Total Operational Cost in Cotton Cultivation
YEAR Andhra Pradesh Gujarat Haryana Karnataka Madhya
Pradesh Maharashtra Punjab Rajasthan Tamil Nadu
2004-05 40.18 43.13 49.66 40.33 39.65 27.73 38.53 51.12 55.382005-06 44.97 42.05 46.26 39.97 35.92 30.33 40.90 49.95 55.322006-07 37.52 41.95 46.57 38.38 36.61 32.87 47.16 52.20 59.722007-08 42.92 42.33 53.59 40.49 40.02 36.15 49.38 57.90 60.822008-09 52.58 45.73 56.73 41.00 43.24 32.46 58.37 47.86 54.00
Source: Calculated from the data provided by the official website of Directorate of Economics and Statistics, Department of Agricultural Co-operation, Got. Of India
Poverty Alleviation through Wage Employment: Synergies and Trade-off with Agricultural Productivity
193
45
2005-06
2006-07
2007-08
2008-09
0 10000 20000 30000 40000 50000
We
West
2516
267
2814
330
est Bengal
Bengal
62.96
723.1
41.88
046.1
Andhra Pradesh
Andh
29
30
37
40
ra Pradesh
9256.98
0491.5
7443.61
0450.2
Uttar Pradesh
Ut
2
2
tar Pradesh
20153.8
20338.4
22301.17
27106.11
Fig. 3: Increase in cost of cultivation of Paddy crop over the year (`/ha)
Source: Official website of Directorate of Economics and Statistics, Department of Agricultural Co-operation, Got. of India
2
500
2005-06
0
00
Har
Haryana
27317.7
ryana U
a
5
Uttar Pradesh
Uttar Pra
22821
Pu
adesh
1.62
unjab
Pu
266
unjab
699.59
Fig. 4: Increase in cost of cultivation of Wheat crop over the year (`/ha)
Source: Official website of Directorate of Economics and Statistics, Department of Agricultural Co-operation, Got. of India

Pushpa et al.
194
agricultural wages are also increasing, which in turns increasing cost of cultivation for field crops which again will enhance the prices of farm produce which may create food inflation, and again the question will arise the people living under BPL how they will fulfil their basic consumption requirement.
� On the other hand, due to continuous increase in MNREGA minimum wages more and more number of labourers is shifting from agriculture to MNREGA, which is creating scarcity of labours for agricultural operations. Various studies have already proved that how MNREGA is snatching labourers from farm. Majority of marginal, small farmers and landless farmers are going for job under MNREGA, and the fact is that more than 70% of our farmers are marginal and small farmers, so if all will go for working under MNREGA then Who will do agriculture?. Due to this shift it is oblivious agricultural production will get affected, and various studies had already proved that there is a positive relation between agricultural production and poverty reduction.
� One side MNREGA is snatching labourers from agriculture due to higher wage rate,
on the other side it also increasing the cost of cultivation for the crops because due to increment in MNREGA wages, agricultural wages are also increasing because for getting labour for agricultural operations farmer has to pay at least that minimum wages which is equivalent to MNREGA wage rate otherwise he won’t get labours, and automatically agricultural production will get affected. One can think that labour saving machineries and new technologies can solve the problem of labour scarcity, but it is not possible for all the categories of farmers and for all the states. As we all are aware that these machinery and equipments how costly they are, there cost of purchasing and then cost of maintenance is more than the human labour cost.
� The labour crunch is likely to fuel demand for expensive mechanical sowing devices, known as transplanters, among the already capital-intensive farmers of Punjab and Haryana. But their labour-saving advantage has to be weighed against the serious problem of “soil compaction” caused by heavy agricultural machinery. Over-use of tractors, harvesters and other machines in paddy fields has reduced
2005-06
2006-07
2007-08
2008-09
500010000
Maharas
84656
85102
85230
85801
0 00 00
shtara
6.89
2.02
0.01
.98
Tam
74
797
81
890
mil Nadu
476.5
793.97
091.9
025.29
Utttar Pradesh
41445.02
41193.2
40843.9
45239.51
Fig. 5: Increase in cost of cultivation of Sugarcane crop over the year (`/ha)
Source: Official website of Directorate of Economics and Statistics, Department of Agricultural Co-operation, Got. of India
Poverty Alleviation through Wage Employment: Synergies and Trade-off with Agricultural Productivity
195
soil fertility, enhanced erosion and reduced water and nutrient use-efficiency. Then again agriculture sector will be the sufferer, which will affect all the sectors and economy of the country.
These all issues are related with each other, which creates a viscous circle of poverty. Because if Government will implement such schemes like MNREGA for poverty alleviation and providing employment to rural poor, if the wages under these schemes is higher than the agricultural wages then it is oblivious that labourers will shift from agriculture to MNREGA which in turns labour shortage for agriculture. For getting back labourers from MNREGA, farmers has to pay more than MNREGA wages or at least equal to MNREGA wages, due to this increase in wages, the cost of cultivation will go up, which affect prices of farm produce. If the farm prices will go high then how vulnerable group or the people who are living under below poverty line how they will survive and again the problem of poverty will arise. The big question here is that can MNREAG alone solve the problem of poverty alleviation.
Policy Measures
� NREGA wages should be indexed to the price level, using the consumer price index for agricultural labourers (CPIAL).
� Works taken up under MGNREGA should be planned in such a way that labours are strictly employed for the scheme after the sowing and harvesting seasons of Rabi and Kharif crops are over. This planning has to be done at the panchayat, block and district levels depending upon the cropping pattern of the respective regions.
� Acute paucity of farm workers is also among the reasons why more and more farmers are quitting agriculture. Let us not forget that 60 per cent of those who seek guaranteed employment are marginal farmers owning small tract of tract of land. So there is the need to freeze MNREGA during peak periods of farm operations.
� MNREGA scheme should be based on the enhancement of agricultural production and creation of permanent assets like production
of manures and bio-pesticides unit, market infrastructure, construction of seed storage bins, shelter for cattle and poultry, irrigation channels and soil conservation activities etc.
REFERENCESAdhikari, Anindita and Kartika Bhatia 2010. “NREGA Wage
Payments: Can We Bank on the Banks”, Economic & Political Weekly, 45(1,2): 30-37.
Ambasta, Parmatesh, V.S.P.S. and Shah, M. 2008. “Two Years of NREGA: The Road Ahead”, Economic & Political Weekly, 43(8): 41-50.
Ashwani et al. 2011. Causes and consequences of supply- demand gap for labour in sugarcane in India Agricultural Economics Research Review, (Conference Number) 24: 401-407.
Akthar, Jawed, S.M. and Abdul Azeez, N.P. 2012. “Rural Employment Guarantee Programme and Migration”, Kurukshetra, 60(4): 11-15.
Azam, Mehtabul 2012. “The Impact of Indian Job Guarantee Scheme on Labour Market Outcomes: Evidence from a Natural Experiment”, World Bank and IZA, Discussion Paper No.6548 May 2012, available a, http://ftp.iza.org/dp6548.pdf.
Bardhan, Kalpana 2011. Rural employment wages and labour markets in India : A survey of research–III, Economic and Political Weekly, 12(28): 1101-1118.
Basant, R. and Kumar, B.L. 1989. Rural non-agricultural activities in India: A review of available evidence. Social Scientist, 17(1-2): 13-17.
Berg, E., Bhattacharyya, S., Durg, R. and Ramachandra, M. 2012. Can Rural Public Works Affect Agriculture Wage: Evidence from India. CSAE Working Paper WPS/2012-05, Centre for the Study of African Economies, University of Oxford, Oxford, UK.
Bhalla, G.S. and Singh, G. 2013. Economic Liberalisation and Indian Agriculture: A District-level Study. Sage Publications India Private Limited, New Delhi.
Burra, Neera 2007. “NREGA and its impact on child labour: field notes from Dungarpur”, available at http://www.levyinstitute.org/pubs/EFFE/NREGA_and_its_impact_on_child_labour.pdf.
Chadha, G.K. 2003. Rural employment: Current situation, challenges and potential for expansion: Issues in employment and poverty. A Discussion Paper, Recovery and Reconstruction Department, International Labour Office, Geneva.
Chadha, G.K. and Sahu, P.P. 2002. Post-reforms setbacks in employment: Issues and need for further scrutiny. Economic and Political Weekly, 37(21): 1998-2026.
Chandrasekar, C.P. and Ghosh, J. 2011. Public Works and Wages in India. January 11 (www.thehindubusinessline.com). C.P. 2010. Significant Dent in Rural Poverty Because of NREGA: Govt, Indian Express, Mon Apr 26, New Delhi Press Information Bureau, Government of India.
Pushpa et al.
196
Dutta, P., Murgai, R., Ravallion, M. and Van de Walle, D. 2012. Does India’s Employment Guarantee Scheme Guarantee Employment?. The World Bank, Washington, USA. Policy Research Working Paper No. 6003.
Datar, C. 2007. ‘Failure of National Rural Employment Guarantee Scheme in Maharashtra’, Economic and Political Weekly, 42(34): 3454-57.
Desai, S. and Dubey, A. 2011. ‘Caste in 21st Century India: Competing Narratives’, Economic and Political Weekly 46(11): 40-49.
Deshingkar, P. 2008. ‘Circular Internal Migration and Development in India’, in J. DeWind and J. Holdaway (eds.), Migration and Development Within and Across Borders: Research and Policy Perspectives on Internal and International Migration, Geneva and New York: International Organization of Migration; Social Science Research Council: 163-189.
Deshingkar, P. and Farrington, J. (eds) 2009. Circular Migration and Multi-locational Livelihood Strategies in Rural India, New Delhi: Oxford University Press.
Deshpande, R.S., Elumalai, K. and Lokesh, G.B. 2012. Growth and Investments in Agriculture. Policy and Institutional Options for Inclusive Agricultural Growth. National Agricultural Innovation Project (NAIP), New Delhi.
Dev, Mahendra, S. 2011. “NAREGA and Child Well-being”, IHD – UNICEF Working Paper Series Children of India: Rights and Oppurtunities Working Paper No.10.
Dey, Subhasish 2010. “Evaluating India’s National Rural Employment Guarantee Scheme: The Case of Birbhum District, West Bengal”, ISS Working Paper 490, International Institute of Social Studies (The Hague, The Netherlands: Erasmus University Rotterdam) Directorate of Economics and Statistics, Department of Agricultural Co-operation, Govt. of India, official website; www.agricoop.org.in.
Economic Survey 2010-11. Govt. of India, Ministry of Finance, Department of Economic Affairs, Economic Division.
Foster, A. and Rosenzweig, M. 2004. Agricultural productivity growth, rural economic diversity, and economic reforms: India, 1970-2000. Economic Development and Cultural Changes, 52: 509-542.
Goparaju, Srikanth and Samik Shome 2009. “Techniques in Innovative Policy Making Examples from India, available at, http://www.ilo.org/legacy/english/protection/travail/pdf/rdwpaper32a.pdf.
GoI (Government of India) 2012. Agricultural Statistics at a Glance: 2011-12. Ministry of Agriculture, New Delhi.
Government of India 2010a. “UID and NREGA”,UIDAI, Planning Commission, Version 1, dated 24 June 2010. Available online at http://uidai.gov.in/UID_PDF/Working_Papers/UIDandNREGA.pdf
Gulati, A., Jain, S. and Satija, N. 2013. Rising Farm Wages in India: The ‘Pull’ and ‘Push’ Factors, Discussion Paper No.5, Commission for Agricultural Costs and Prices, Department of Agriculture and Cooperation, Ministry of Agriculture, Government of India, New Delhi.
Harish, B.G. 2010. An Economic impact analysis of MGNREGA in Chikmagalur District of Karnataka. Master’s Thesis (Un-published). University of Agricultural Sciences, GKVK, Bangalore.
Harish, B.G., Nagaraj, N., Chandrakanth, M.G., Murthy, S.P.P., Chengappa, P.G. and Basavaraj, G. 2011. Impacts and implications of MGNREGA on labour supply and income generation for agriculture in central Dry Zone of Karnataka. Agricultural Economics Res. Rev., 24(5): 485-494.
Himanshu 2005. Wages in rural India: Sources, trends and comparability, Indian J. Labour Economics, 48(2).
Himanshu 2008. Agriculture and non-farm employment: Exploring the inter-linkages in rural India. Background paper prepared for India Poverty Assessment Report. New Delhi, Jawaharlal Nehru University.
IAMR 2008. “All-India Report on Evaluation of NREGA: A Survey of Twenty Districts”, Institute of Applied Manpower Research, http://planningcommission. gov.in/reports/genrep/rep_NREGA_
Jacob, Naomi 2008. “The Impact of NREGA on Rural-Urban Migration: Field survey of Villupuram District, Tamil Nadu”, available at, http://knowledge.nrega.net/653/1/NREGA-Paper-202.pdf.
Jeyashree, P., Subramaninan, N., Murali, N. and Peter, S.M. 2010. Economic analysis of MGNREGS: A study Southern Economist, 49(7): 13-16.
Jha, R., Bhattacharyya, S. and Gaiha, R. 2011. Social safety nets and nutrient deprivation: An analysis of the National Rural Employment Guarantee Program and the public distribution system in India. Journal of Asian Economics, 22: 189-201.
Jha, R., Bhattacharyya, S., Gaiha, R. and Shankar, S. 2009. Capture of anti-poverty programs: An analysis of the National Rural Employment Guarantee Program in India. J. Asian Economics, 20(4): 456-464.
Jobson, J. D. 1992. Applied Multivariate Data Analysis, Springer, New York, USA.
Kumar, P., Kumar, Anjani and Mittal, Surabhi 2004. Total factor productivity of the crop sector in the Indo- Gangetic Plains of India: Sustainability issues revisited. Indian Economic Rev., 39(1): 169-201.
Kumar, Anjani 2009. Rural employment diversification in eastern India: Trends and determinants. Agricultural Economics Res. Rev., 22(1): 47-60.
Kumar, Anjani and Elumalai, K. 2007. Agricultural growth and productivity in India: An inter-state variations. In: Economic Growth and Regional Balance: Recent Experiences and Implications in India. Eds: T.S. Papola, and Alakh N. Sharma, Institute for Human Development, New Delhi.
Kumar, A., Kumar, S., Singh, D.K. and Shivjee 2011. Rural employment diversification in India: Trends determinants and implications on poverty. Agricultural Economics Research Review, 24(Conference Issue): 361-372.
Kumar, R., Singh, N.P. and Singh, R.P. 2003. Non-farm employment for rural India: An analysis of shifting

Poverty Alleviation through Wage Employment: Synergies and Trade-off with Agricultural Productivity
197
paradigm, Agricultural Economics Res. Rev., 16 (Conference Issue): 20-30.
Lanjouw, Peter and Stern, Nocholas 1998. Economic Development in Palanpur over Five Decades, Powell’s Bookstores, Chicago, USA, p. 668.
Leelavathi, P. 2011. “Impact of Mahatma Gandhi National Rural Employment Guarantee Act on The Well-Being of The Rural Poor in Andhra Pradesh”, IASSI Quarterly: Contribution to Indian Social Science, 30(2): 1-10.
Lesschen, J.P., Verburg, P. H. and Steven, J.S. 2005. Statistical methods for analyzing the spatial dimension of changes in land use and farming systems. LUCC Reports Series No. 7. The International Livestock Research Institute, Nairobi, Kenya and LUCC Focus 3 Office Wageningen University, the Netherlands.
Mann, N. and Ramesh, J. 2013. Rising farm wages will lift all boats. The Hindu, May 14.
Mathur, L. 2007. Employment Guarantee Progress so far, Economic and Political Weekly, pp. 17-20.
Ministry of rural development, Quick evaluation of beneficiary oriented (SC/ST) programme of SGRY, New delhi-49, (Nov 2005) Ibid.
MoRD 2012. MGNREGA Sameeksha: An Anthology of Research Studies on the Mahatma Gandhi National Rural Employment Guarantee Act, 2005, 2006-2012. (Edited and Compiled by Mihir Shah, Neelakshi Mann and Varad Pande), Ministry of Rural Development, New Delhi and Orient Black Swan, New Delhi.
Mukhopadhyay, Abhiroop and Rajaraman, Indira 2007. Rural unemployment 1999-2005: Who gained, who lost? Economic and Political Weekly, 37(21): 3116- 3120.
Mukherjee, D. and Sinha, U.B. 2011. Understanding NREGA: A Simple Theory and Some Facts, Centre Development Economics, Delhi School of Economics, Delhi. Working Paper No.196.
Murgai, Rinku and Martin Ravallion 2005. Employment Guarantee in Rural India What would cost and how much would it reduce poverty?, Economic & Political Weekly, 30: 3450-3455.
Narayanamoorthy, A. and Alli, P. 2012. India’s new food security worries: From crop holiday to declining foodgrains area. Indian J. Agricultural Economics, 67(3): 487-498.
Narayanamoorthy, A. and Alli, P. 2013. Rural job scheme sows misery. The Hindu Business Line, February 9.
NSSO (National Sample Survey Organization) 2007. Household Consumption Expenditure among Socio-economic Groups: 2004-05: NSS 61st Round (Report No. 514/61/1.0/7). Ministry of Statistics and Programme Implementation, Government of India, New Delhi.
NSSO (National Sample Survey Organization) 2012. Household Consumption Expenditure among Socio-economic Groups: 2009-10: NSS 66th Round (Report No. 544/66/1.0/5). Ministry of Statistics and Programme Implementation, Government of India, New Delhi.
Pramathesh Ambasta, P S Vijay Shankara and Mihir Shah 2008. Two Years of NREGA: The Road Ahead, Economic & Political Weekly, February 23, p42 ibid, p42.
Prasada Rao, Mecharla 2002. The determinants of rural nonfarm employment in two villages of Andhra Pradesh (India), PRUS Working Paper No. 12, University of Sussex, Brighton.
Priyadarshi Siddhanta 2011. ‘Delay in NREGA Payments Causing Distress Migration’, The Indian Express, Tuesday Aug 23, New Delhi.
Rawal, V., Madhura, S. and Niladri, S.D. 2008. On diversification of rural incomes: A view from three villages of Andhra Pradesh, The Indian J. Labour Economics, 51(2): 230-248.
Shah, M. 2009. Multiplier accelerator synergy in NREGA. The Hindu, April 30.
Sharma, H.R. 2001. Employment and wage earnings of agricultural labourers: A state-wise analysis. The Indian J. Labour Economics, 44(1): 27-38.
Singh, I. 1990. The Great Ascent: The Rural Poor in South Asia. Johns Hopkins University Press, Washington, D.C., USA.
Siddhartha, Anish Vanaik 2008. CAG Report on NREGA: Fact and Fiction , Economic & Political Weekly, June 21, p. 44.
Sundaram, K. 2001. Employment and poverty in 1990s: Further results from NSS 55th Round Employment- Unemployment Survey, 1999-2000. Economic and Political Weekly, 36(32): 3039-3049.
Verma, S. and Shah, T. 2012. Labour Market Dynamics in Post-MGNREGA Rural. Water Policy Research Highlight No. 8, IWMI-Tata Water Policy Programme, Anand, Gujarat (accessed from www.iwmi.org/iwmitata/ apm2012).
Visaria, P. 1995. Rural non-farm employment in India: Trends and issues for research. Indian J. Agricultural Economics, 50(3): 398-409.
Yadav, Raj, Hans and Nidhi Garg 2010. “Socio-economic Condition of MGNREGA Workers in Distric Rewari”, Social Welfare, 57(5): 24-27.