Embed Size (px)
Citation preview
7/23/2019 Poverty Across Social and Religious Groups in Uttar Pradesh 0
http://slidepdf.com/reader/full/poverty-across-social-and-religious-groups-in-uttar-pradesh-0 1/10
SPECIAL ARTICLE
DECEMBER 26, 2015 vol l no 52 EPW Economic & Political Weekly100
Poverty across Social and Religious Groupsin Uttar Pradesh
An Interregional Analysis
Akarsh Arora, S P Singh
The article is an attempt at a comprehensive
understanding of regional as well as disaggregated
(district-wise) patterns of poverty prevailing among
social and religious groups in Uttar Pradesh by using unit
level records of the 61st (2004–05) and 68th (2011–12)
rounds of NSSO’s Consumption Expenditure Survey. Itidentifies the critical regions in UP, where poverty among
social and religious groups is unfairly distributed.
Estimates reveal that though poverty in the state
reduced by 11.50% points between 2004–05 and
2011–12, it remained quite high among Scheduled
Castes (40.87%) and Muslims (34.88%), particularly in
the central, southern and eastern regions of the state.
The study also attempts to gauge the causes for the
unequal distribution of poverty among social and
religious groups in the state and goes on to suggest thatregion specific and group specific development
programmes may be more effective in alleviating
poverty among social and religious groups.
The first author is thankful to the Ministry of Human Resource Develop-
ment for providing a financial grant in the form of a research fellowship
to carry out the research work. Both authors are thankful to an anony-
mous referee for comments and helpful suggestions.
Akarsh Arora ([email protected]) is a doctoral candidate at
the Department of Humanities and Social Sciences, Indian Institute of
Technology, Roorkee; S P Singh ( [email protected]) teaches economics
at the Department of Humanities and Social Sciences, Indian Institute of
Technology, Roorkee.
Extensive research has been conducted in recent years to
evaluate poverty and inequality across regions and
across social and religious groups (SRGs). However, most
of these studies have been based on national or state level
estimates. A close examination reveals that there is a dearth of
studies based on regional and district level statistics, parti-
cularly for measuring poverty and inequality in Uttar Pradesh(UP). Also, earlier studies could not include Other Backward
Classes (OBCs) as a separate category due to unavailability
of classified data from the earlier National Sample Survey
Office (NSSO) rounds.
This study is an attempt to identify critical regions, where
the incidence of poverty among SRGs was unfairly distributed
in UP during 2004–05 (61st NSSO round) and 2011–12 (68th
NSSO round). The rationale behind evaluating such critical re-
gions is that a society is considered better off when poverty is
spread evenly across population groups rather than concen-
trated among a few subsets of the population. Additionally, an
attempt has been made to gauge the causes for such unequal
distribution of poverty among SRGs in the state. A number of studies have been conducted on the subject, but
most of them have a discourse at an aggregate level (Dev and Ravi
2007, 2008; Himanshu 2007). Furthermore, studies particular to
SRGs are few in number (GOI 2011; Mutatkar 2005; Sundaram and
Tendulkar 2003; Thorat and Dubey 2012). Most of them reveal
that the Scheduled Castes (SCs) and Scheduled Tribes (STs) are
comparatively more vulnerable and impoverished, although they
have been showing progress along with other groups over time.
Several studies also highlight the causes of poverty among
SRGs. Sundaram and Tendulkar (2003) state that assetless
casual wage labour households (particularly the SCs and STs)
are doubly disadvantaged (economically as well socially).
Mutatkar (2005) emphasises that the STs and SCs have been
historically marginalised, and they remain concentrated in the
lower quintiles of the economy. Social disparities in living
standards are the result of differences in returns to education
and land along with levels of physical and human capital.
Thorat and Dubey (2012) show that the growth in consump-
tion expenditure of agricultural households during 2005–10
remained pro-poor for marginalised farmers but not for the
SCs, particularly in rural areas.
Some studies also confirm that there has been an improve-
ment in the living standards and well-being of Muslims along
7/23/2019 Poverty Across Social and Religious Groups in Uttar Pradesh 0
http://slidepdf.com/reader/full/poverty-across-social-and-religious-groups-in-uttar-pradesh-0 2/10
SPECIAL ARTICLE
Economic & Political Weekly EPW DECEMBER 26, 2015 vol l no 52 101
with the SCs and STs at an aggregate level. The India Human
Development Report 2011 (GOI 2011) for example, highlights
that poverty across social groups has reduced over time, yet it
is quite perceptible. Rural poverty among Muslims is below
aggregate, while it is greater in urban areas. Even though the
consumption expenditure among SCs, STs, and Muslims has
been rising over time, its distribution remains an issue of con-
cern, particularly for the SCs. The report suggests that reduc-
tion in poverty was brought about by reduction in unemploy-
ment rates (rural and urban) and therefore cited as, “the ris-
ing tide was lifting all boats.” However, the access index of
asset ownership shows that the SCs and Muslims are not able
to enjoy the peaks. Notably, it highlights that poorer states1
account for more than 50% of the SCs, STs and Muslims of the
entire country, and there exists a bidirectional relationship
between the poorness of states and large proportions of the
excluded SRGs. Such coexistence emerged from the fact that
in these states, various affirmative actions initiated by the
government had largely excluded the most needy sections
of society.Nevertheless, a few studies have evaluated the socio-economic
condition of SRGs in UP (Diwakar 2009; Kapur et al 2010; Kozel
and Parker 2003; Ojha 2007). Some of them have pointed out
that social and religious rigidities in the state play a vital role
in the impoverishment and social vulnerability, as class and
caste coincide in the contemporary social reality of UP. How-
ever, they argue that the most excluded and impecunious
population subgroups (SCs /STs and Muslims) have shown an
improvement in their living standards and well-being. Kapur
et al (2010: 42–47) observe that since 1990, “there have been
major changes in the grooming, eating, and ceremonial con-
sumption patterns of Dalits,” signalling a higher social status,
erosion of caste discrimination, and change in agriculturalrelations. They have also reported that almost no Dalit worked
as a bonded labourer, and there has been a significant occupa-
tional diversification among Dalits. Their study has considered
the rise of the Bahujan Samaj Party (BSP), market-oriented re-
forms, exposure to media, and technological changes in agricul-
ture as the potential factors behind improvement in the socio-
economic status of Dalits in UP. However, the study is confined
to only two development blocks (one each from western and
eastern regions), and, therefore, may not reflect the changes
that have taken place across the regions.
Based on three field studies, Kozel and Parker (2003) have
identified lack of access to landholdings, education and skills,
social networks and stable employment, and insecure land
tenure as the primary factors causing poverty among Dalits in
UP. The deeply entrenched exclusion and social marginalisa-
tion (low caste status) is cited as the main reason for the per-
sistence of poverty among them. On the other hand, Ojha
(2007) shows that across social groups, incidence as well as
reduction in poverty was the highest among SCs during 1998–99
and 2004–05.
In general, some ways of escaping from poverty are finding
a private job through migration to cities/towns, starting of
petty trade/business, diversification of farming by inclusion of
animal husbandry and dairying, casual work in the informal
sector, shift from traditional to high value crops, and a govern-
ment job. Likewise, reasons for falling into poverty are,
“unbearable expenditure on illness, beyond-the-capacity expendi-
ture on marriages and other social ceremonies, loss of job,
downfall of business and other reasons, including successive
crop failure and migration of the key worker of the household.”
Furthermore, “small size of landholding, low capital base and
unemployment or underemployment” are identified as three
key factors for chronic poverty.
One of the World Bank (2010) studies stated that social
exclusion has reduced, particularly among SCs in UP. Over-
represented in the farm sector, the SCs benefited from
increasing agricultural wages. Also, those SC households who
entered the labour market were educationally better qualified
than before, enabling them to opt for self-employment and
non-farm occupations. Furthermore, it has been observed that
the scope and reach of the social safety net programmes imple-
mented by the UP government was limited (Ajwad 2007).
Against this backdrop, the present study seeks to examinethe profile of poverty across regions and among SRGs in UP.
The paper proceeds by presenting the underlying objectives of
the study in Section 1. Section 2 describes the methodology and
its limitations, followed by outcomes of the study by portraying
poverty incidence across regions and districts and among SRGs
during 2004–05 and 2011–12 in Section 3. The study also identi-
fies the factors responsible for poverty among SRGs in Section 4
and ends the discussion with conclusions and policy implications.
1 Objectives of the Study
The objectives of the study are as follows: (i) to identify critical
regions and districts in rural and urban areas of UP, where
poverty is severely concentrated; (ii) to evaluate the regionalpattern of poverty among SRGs in rural and urban areas of UP;
(iii) to identify the factors underlying poverty among SRGs in
rural and urban areas of UP.
2 Methodology and Its Limitations
The present study uses unit level records of the 61st (2004–05)
and 68th (2011–12) rounds of NSSO’s Consumption Expenditure
Survey (CES) to define poverty in terms of headcount ratio
(HCR ). The HCR measures poverty as a proportion of house-
holds living below the poverty line (BPL). In India, the poverty
line is defined as the critical threshold of monthly per capita
consumption expenditure (MPCE) that is considered necessary
for subsistence level of living. It is the “reference poverty line
basket (PLB) of household goods and services consumed by
those households at the borderline separating the poor from
the non-poor” (GOI 2009: 1). Any household consuming less than
the prescribed amount of PLB is treated as poor. Until recently,
the poverty line was estimated by expert committees consti-
tuted by the Planning Commission of India, from time to time.
For 2004–05, the Tendulkar Committee provided a poverty
line for each state. However, for 2011–12, the Planning Com-
mission updated the poverty estimates as per the methodo-
logy recommended by the Tendulkar Committee (GOI 2013).
7/23/2019 Poverty Across Social and Religious Groups in Uttar Pradesh 0
http://slidepdf.com/reader/full/poverty-across-social-and-religious-groups-in-uttar-pradesh-0 3/10
SPECIAL ARTICLE
DECEMBER 26, 2015 vol l no 52 EPW Economic & Political Weekly102
For the rural and urban areas of UP, it was estimated at
Rs 435.14 and Rs 532.12, respectively for 2004–05. This
amount was increased to Rs 768 for rural and Rs 941 for urban
areas in 2011–12. Since district-wise poverty line is not estimated
by the Planning Commission, we have considered the state-
wise poverty line to estimate the district-wise HCR .
The 61st and 68th NSSO rounds classify social groups into
four population subgroups—STs, SCs, OBCs and upper castes—
and religious groups into Hindus, Muslims and “Others.” Out
of these, the population subgroups STs
and “Others” have been excluded, as
their sample size was negligible in UP.
However, overall poverty in the state is
estimated by clubbing all categories of
social or religious groups.
This study selects UP for three reasons.
First, it is one of the most impoverished
states in India (Kozel and Parker 2003).
According to the Planning Commission’s
figures (GOI 2009, 2013), it can be esti-
mated that the state held the highest
proportion of the total BPL population of
the country during 2004–05 (17.94%)
and 2011–12 (22.17%), respectively.
Also, the state has the highest propor-
tion of SC (20.5%), Muslim (22.34%)
and rural population2 (18.6%) of India.
Second, with the emergence of the BSP,
the state has witnessed a resurgence ofthe Dalit movement with a clear politi-
cal agenda to capture the state power for
bringing socio-economic changes in
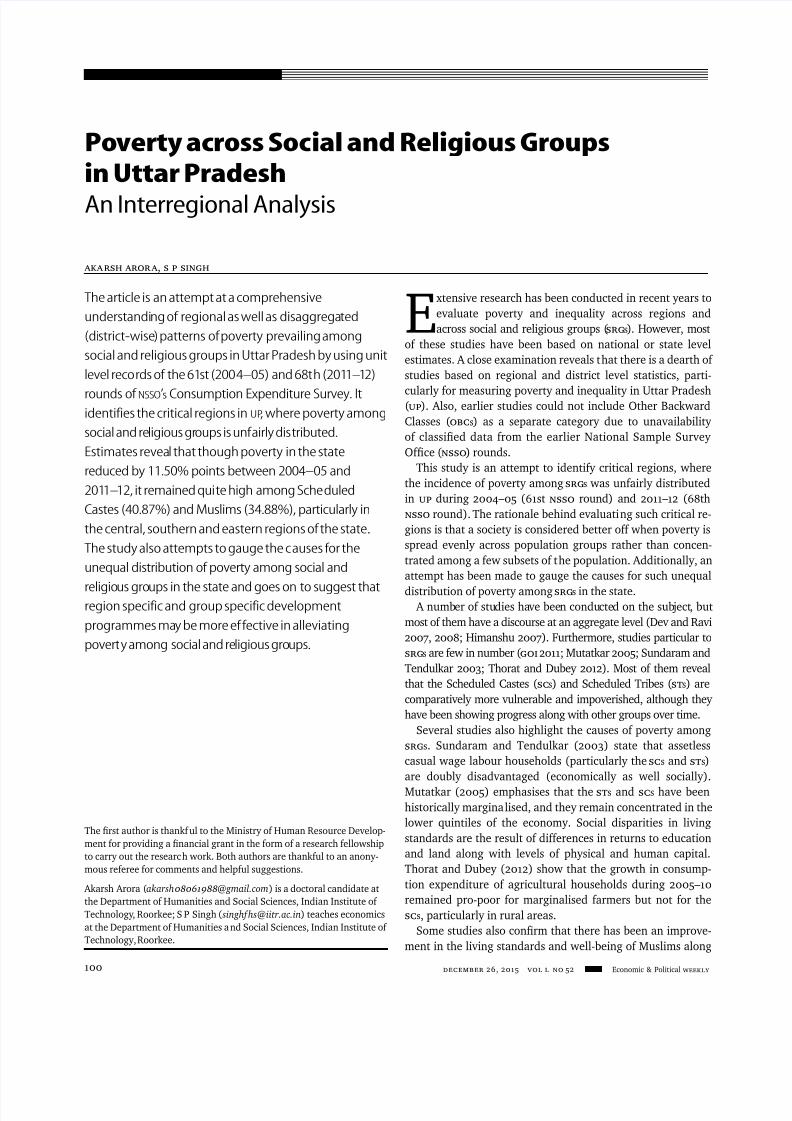
their lives. Third, the state is large and
divided into four economic regions—
western, central, southern and eastern.
These regions differ significantly in
terms of various socio-economic develop-
ment indicators. In order to capture the
disaggregated poverty profile, 70 dis-
tricts of the state have been classified
under these four regions. The western
region comprises 26 districts; the centralregion consists of 10 districts, including
the capital of the state (Lucknow) and
the main financial centre (Kanpur); the
southern region, basically called the
Bundelkhand region, embraces seven
districts; and the eastern region includes
27 districts. The geographical location
of districts along with their respective
regions is depicted in Figures 1, 2, and
Figures 3 and 4 (p 103).
As mentioned above, one of the
prime objectives of the study is to find
out those districts where poverty is
alarming. Initially, the target was to
evaluate the district level poverty among SRGs, but it was
found that bifurcation of sample households across districts
and among SRGs provided a relatively small sample size, which
possibly would affect the reliability of HCR . Nevertheless,
there are two major difficulties while assessing poverty trends
at the district level. The first pertains to the availability of unit
level data that can capture disaggregate poverty trends
unbiasedly. It is only from the 61st round (carried out during
July 2004–June 2005) that sampling design defined rural and
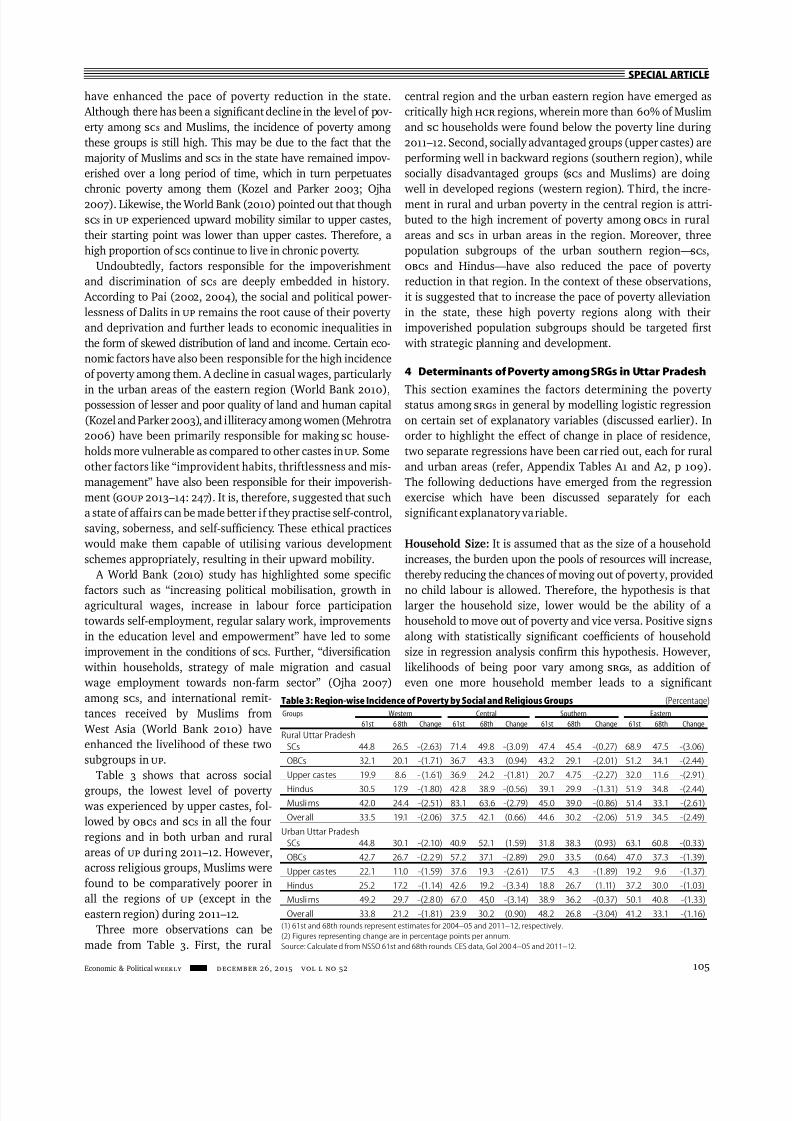
Figure 1: District-wise Mapping of Poverty in Rural UP, 2004–05
Source: Compiled from NSSO 61st round CES data, GoI, 2004–05.
Saharanpur
Muzaffarnagar Bijnor
Baghpat Meerut
Ghaziabad J P Nagar Moradabad Rampur
G B Nagar BulandshahrBareilly Pilibhit
AligarhBudaun
ShahjahanpurKheri
Mathura Hathras FarrukhabadEtah
HardoiSitapur
BahraichShravasti
Balrampur
Siddharthnagar Maharajganj
S K NagarKushinagar
GorakhpurFaizabadBasti
GondaBarabanki
Firozabad MainpuriKannaujAgra
EtawahAuraiya
Kanpur Dehat Kanpur
Lucknow
Unnao
JalaunRaebareli
PratapgarhFatehpurJhansi Hamirpur
MahobaBanda Kaushambi S R Nagar Varanasi
Jaunpur Ghazipur
Azamgarh Mau
Ambedkar NagarSultanpur
Deoria
Ballia
Chitrakoot AllahabadChandauli
Mirzapur
Sonbhadra
Lalitpur
Western region
Central region
Southern region
Eastern region
Legend region
BPL Population (%)
Rural UP: 2004–05
10%–20%
20%–30%
30%–40%
40%–50%
50%–60%
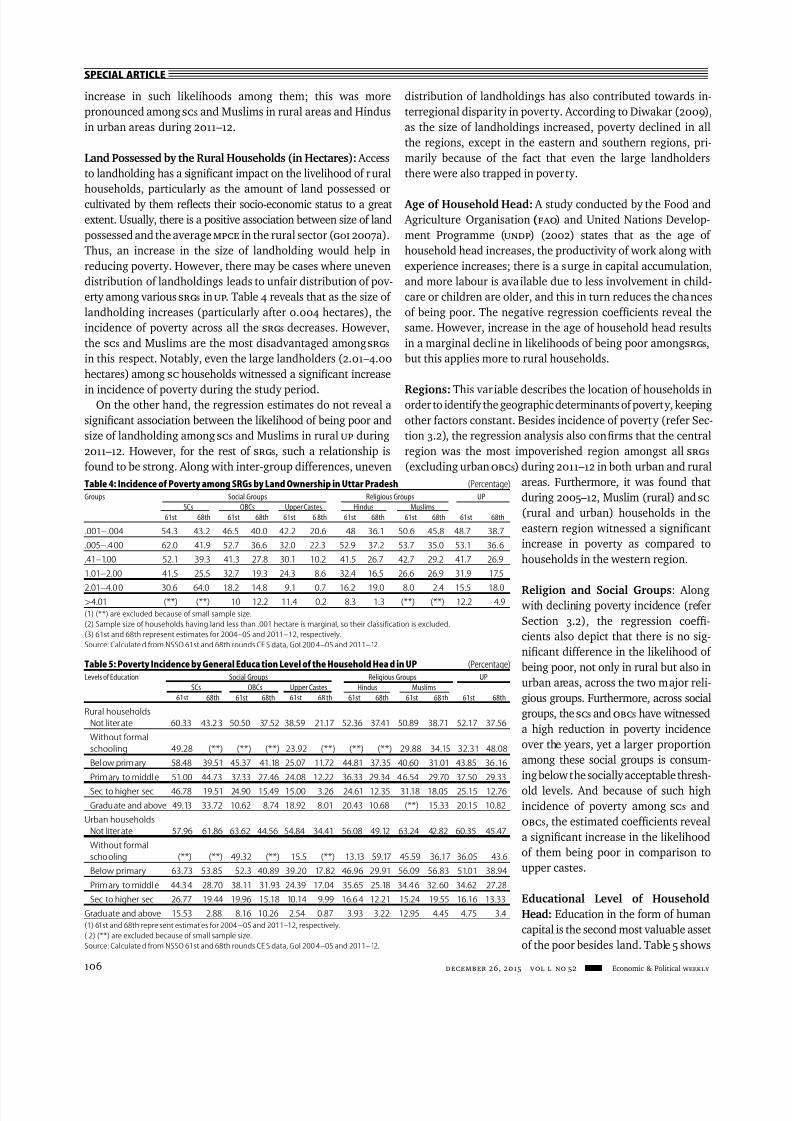
Figure 2: Distric t-wise Mapping of Poverty in Rural UP, 2011–12
Source: Compiled from NSSO 68th round CE S data, GoI, 2011–12.
Saharanpur
Muzaffarnagar Bijnor
Baghpat Meerut
GhaziabadJ P Nagar Moradabad Rampur
G B Nagar BulandshahrBareilly Pilibhit
Aligarh Budaun ShahjahanpurKheri
Mathura Hathras FarrukhabadEtah
HardoiSitapur
BahraichShravasti
Balrampur
SiddharthnagarMaharajganj
S K NagarKushinagar
GorakhpurFaizabadBasti
GondaBarabanki
FirozabadMainpuri
KannaujAgra
EtawahAuraiya
Kanpur DehatKanpur
Lucknow
Unnao
JalaunRaebareli
PratapgarhFatehpurJhansi Hamirpur
MahobaB an da K au sh am bi S R Nagar
Varanasi
Jaunpur Ghazipur
Azamgarh Mau
Ambedkar NagarSultanpur
Deoria
Ballia
Chitrakoot AllahabadChandauli
Mirzapur
Sonbhadra
Lalitpur
Western region
Central region
Southern region
Eastern region
BPL Population (%)
Rural UP : 2011–12
10%–20%
20%–30%
30%–40%
40%–50%
50%–60%
Legend region
7/23/2019 Poverty Across Social and Religious Groups in Uttar Pradesh 0
http://slidepdf.com/reader/full/poverty-across-social-and-religious-groups-in-uttar-pradesh-0 4/10
SPECIAL ARTICLE
Economic & Political Weekly EPW DECEMBER 26, 2015 vol l no 52 103
urban parts of the districts as strata for selection of sample
villages and urban blocks, respectively.
The second problem is associated with the base of MPCE that
has been used as a reference period to estimate the poverty
line. Prior to 2004–05, the poverty line was defined on the ba-
sis of MPCE using the uniform reference period (URP). The Plan-
ning Commission, on the recommendation of the Tendulkar
Committee, decided to adopt consumption expenditure based
on a mixed reference period (MRP). The poverty line based on
the URP considered only calorie norms, but adoption of the
MRP made this poverty line broader in scope, as it included the
“adequacy of actual private expenditure
per capita near the poverty lines on food,
education and health by comparing them
with normative expenditures consistent
with nutritional, educational and health
outcomes” (GOI 2009: 2).
This paper, therefore, estimates poverty
in UP, starting from the 61st NSS round
(2004–05). To examine the factors deter-
mining the unequal distribution of poverty
among SRGs in rural and urban areas in the
state during 2004–05 and 2011–12, a survey-
based binary logistic regression has been
used. The parameters of the logistic regres-
sion have been estimated by modelling the
BPL variable (1 if the household is BPL, 0
otherwise) on selected set of explanatory
variables, such as household size, land
possessed (in hectares),3 age of the head,
regions, religious groups, social groups,gender of the head, educational level of the
head and household type. The estimates of
the model have been expressed in terms of
percentage change in odds.
3 Poverty Profile in Uttar Pradesh
3.1 Regional Pattern of Poverty
The four regions of UP (western, central,
southern and eastern) differ widely. On
economic grounds, the western region is
highly productive in the agricultural and
industrial sector,4 whereas the central re-gion has experienced an industrial decline
in recent years (GOI and UNDP 2008). The
western and eastern regions possessed the
highest and the lowest per capita net do-
mestic product (NDP) at current as well as at
constant prices during 2010–11, respectively,
whereas the southern region had higher per
capita NDP than both eastern and central
regions (basically due to its lower popula-
tion density). Also, the western region
(54.34%) and the eastern region (26.28%)
have the highest and the lowest credit-
deposit ratio, respectively. As per the 2011 Census, the eastern
region is the most populated region of the state (39.95%), fol-
lowed by the western (37.20%), central (18.01%) and southern
regions (18.01%). However, on the urbanisation front, the west-
ern region holds the highest urban population (31.36%) and
the eastern region (12.21%) the lowest.
Table 1 (p 104) shows that in both the survey years, the inci-
dence of poverty in rural areas is higher than that in urban areas;
however, the percentage point dif ference between the two ar-
eas has declined significantly from 8.65% points in 2004–05 to
4.23% points in 2011–12. This indicates that poverty reduction
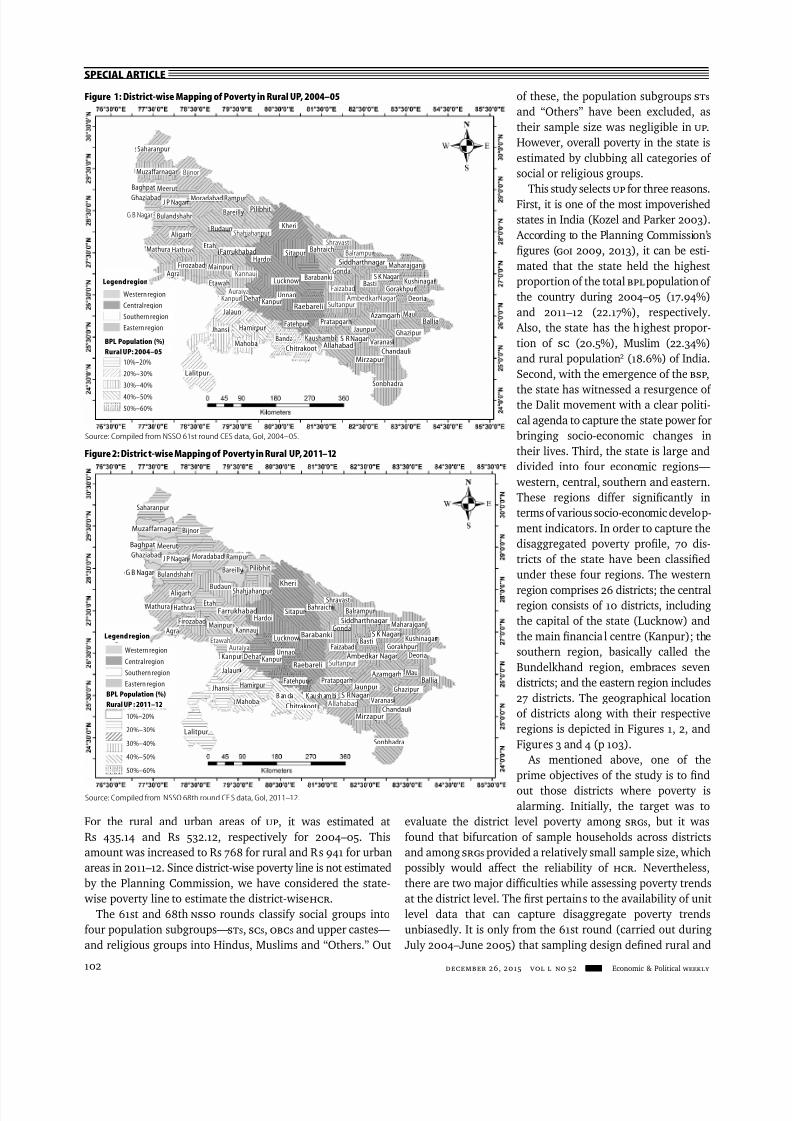
Source: Compiled from NSSO 6 8th round of CES dat a, GoI, 2011–12.
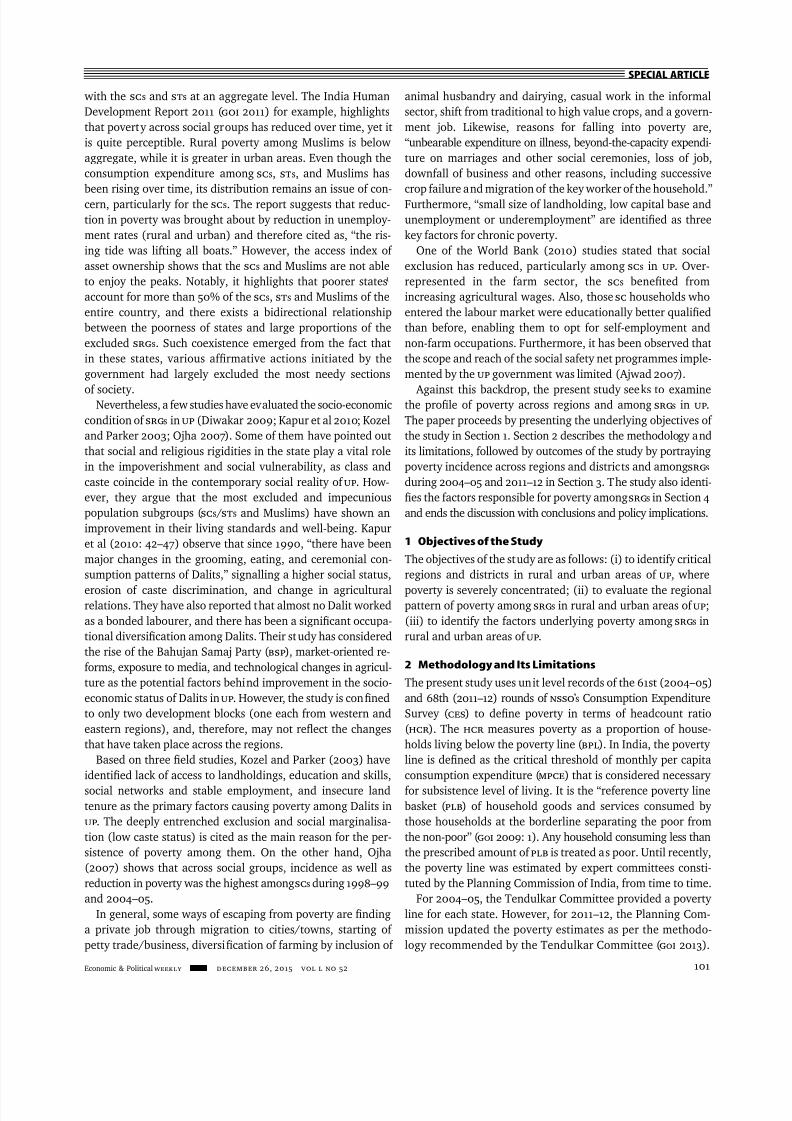
Source: Compiled from NSSO 61st round CES data, GoI, 2004–05.
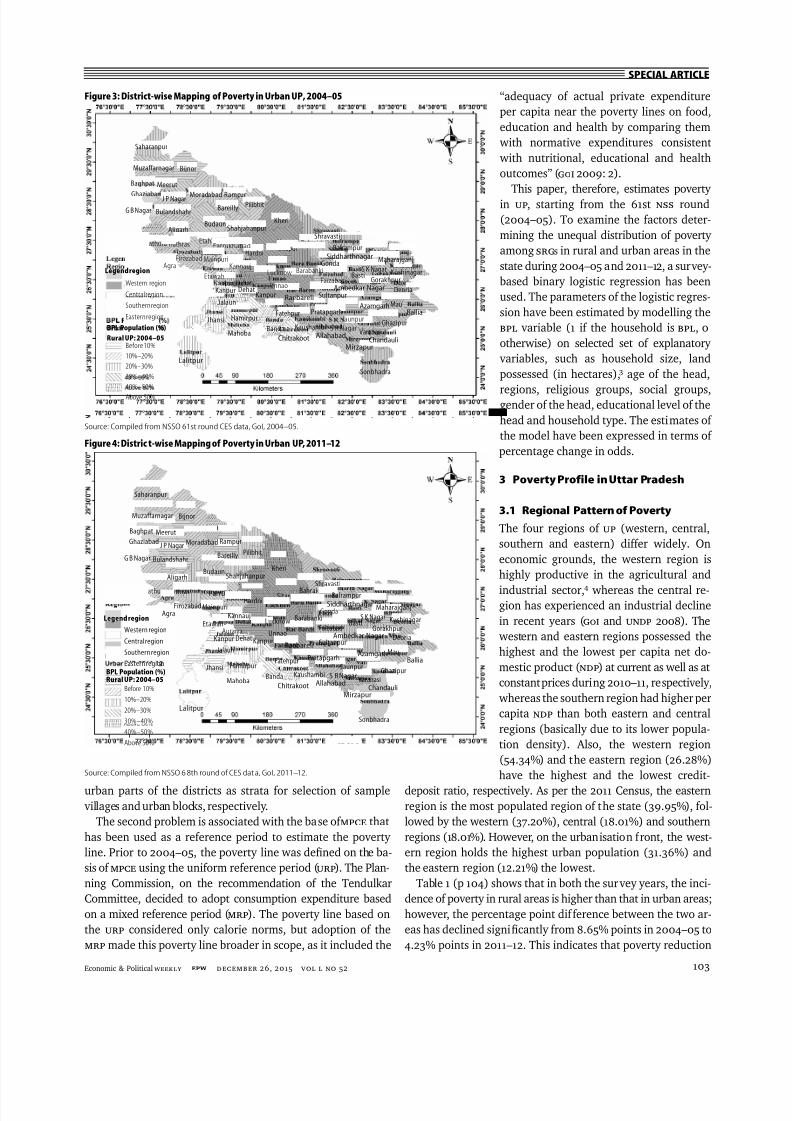
Figure 3: District-wise Mapping of Poverty in Urban UP, 2004–05
Saharanpur
Muzaffarnagar Bijnor
Baghpat Meerut
Ghaziabad J P Nagar Moradabad Rampur
G B Nagar BulandshahrBareilly Pilibhit
AligarhBudaun
ShahjahanpurKheri
Mathura Hathras FarrukhabadEtah
Hardoi Sitapur
BahraichShravasti
BalrampurSiddharthnagar Maharajganj
S K Nagar KushinagarGorakhpurFaizabad
Basti
GondaBarabanki
Firozabad MainpuriKannaujAgra
EtawahAuraiya
Kanpur DehatKanpur
Lucknow
Unnao
Jalaun Raebareli
PratapgarhFatehpurJhansi Hamirpur
MahobaBanda Kaushambi S R Nagar
Varanasi
JaunpurGhazipur
Azamgarh Mau
Ambedkar NagarSultanpur
Deoria
Ballia
Chitrakoot AllahabadChandauli
Mirzapur
Sonbhadra
Lalitpur
Western region
Central region
Southern region
Eastern region
Legend region
BPL Population (%)
Rural UP: 2004–05Before 10%
10%–20%
20%–30%
30%–40%
40%–50%
Above 50%
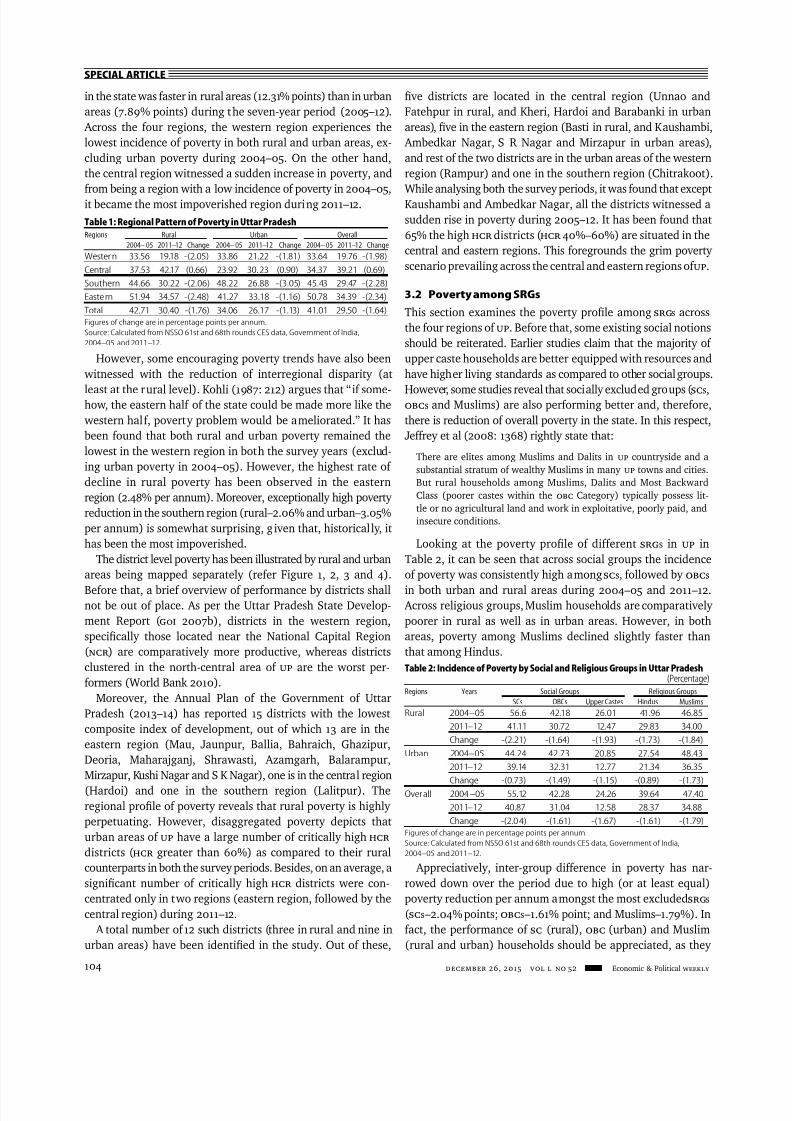
Figure 4: Distric t-wise Mapping of Poverty in Urban UP, 2011–12
Saharanpur
Muzaffarnagar Bijnor
Baghpat Meerut
GhaziabadJ P Nagar Moradabad Rampur
G B Nagar BulandshahrBareilly Pilibhit
AligarhBudaun
ShahjahanpurKheri
Mathura Hathras FarrukhabadEtahHardoi
SitapurBahraich
Shravasti
BalrampurSiddharthnagar Maharajganj
S K Nagar KushinagarGorakhpurFaizabad
Basti
GondaBarabanki
FirozabadMainpuriKannaujAgra
EtawahAuraiya
Kanpur Dehat Kanpur
Lucknow
Unnao
Jalaun Raebareli Sultanpur
FatehpurJhansi Hamirpur
MahobaBanda Kaushambi S R Nagar
Varanasi
JaunpurGhazipur
AzamgarhMau
Ambedkar Nagar
Pratapgarh
Deoria
Ballia
Chitrakoot AllahabadChandauli
Mirzapur
Sonbhadra
Lalitpur
Western region
Central region
Southern region
Eastern region
Legend region
BPL Population (%)Rural UP: 2004–05
Before 10%
10%–20%
20%–30%
30%–40%
40%–50%
Above 50%
7/23/2019 Poverty Across Social and Religious Groups in Uttar Pradesh 0
http://slidepdf.com/reader/full/poverty-across-social-and-religious-groups-in-uttar-pradesh-0 5/10
SPECIAL ARTICLE
DECEMBER 26, 2015 vol l no 52 EPW Economic & Political Weekly104
in the state was faster in rural areas (12.31% points) than in urban
areas (7.89% points) during the seven-year period (2005–12).
Across the four regions, the western region experiences the
lowest incidence of poverty in both rural and urban areas, ex-
cluding urban poverty during 2004–05. On the other hand,
the central region witnessed a sudden increase in poverty, and
from being a region with a low incidence of poverty in 2004–05,
it became the most impoverished region during 2011–12.
Table 1: Regional Pattern of Poverty in Uttar Pradesh
Regions Rural Urban Overall
2004– 05 2011–12 Change 2004– 05 2011–12 Change 2004– 05 2011–12 Change
Western 33.56 19.18 -(2.05) 33.86 21.22 -(1.81) 33.64 19.76 -(1.98)
Central 37.53 42.17 (0.66) 23.92 30.23 (0.90) 34.37 39.21 (0.69)
Southern 44.66 30.22 -(2.06) 48.22 26.88 -(3.05) 45.43 29.47 -(2.28)
Eastern 51.94 34.57 -(2.48) 41.27 33.18 -(1.16) 50.78 34.39 -(2.34)
Total 42.71 30.40 -(1.76) 34.06 26.17 -(1.13) 41.01 29.50 -(1.64)
Figures of change are in percentage points per annum.
Source: Calculated from NSSO 61st and 68th rounds CES data, Government of India,
2004–05 and 2011–12.
However, some encouraging poverty trends have also been
witnessed with the reduction of interregional disparity (at
least at the rural level). Kohli (1987: 212) argues that “ if some-how, the eastern half of the state could be made more like the
western half, poverty problem would be ameliorated.” It has
been found that both rural and urban poverty remained the
lowest in the western region in both the survey years (exclud-
ing urban poverty in 2004–05). However, the highest rate of
decline in rural poverty has been observed in the eastern
region (2.48% per annum). Moreover, exceptionally high poverty
reduction in the southern region (rural–2.06% and urban–3.05%
per annum) is somewhat surprising, given that, historical ly, it
has been the most impoverished.
The district level poverty has been illustrated by rural and urban
areas being mapped separately (refer Figure 1, 2, 3 and 4).
Before that, a brief overview of performance by districts shallnot be out of place. As per the Uttar Pradesh State Develop-
ment Report (GOI 2007b), districts in the western region,
specifically those located near the National Capital Region
(NCR ) are comparatively more productive, whereas districts
clustered in the north-central area of UP are the worst per-
formers (World Bank 2010).
Moreover, the Annual Plan of the Government of Uttar
Pradesh (2013–14) has reported 15 districts with the lowest
composite index of development, out of which 13 are in the
eastern region (Mau, Jaunpur, Ballia, Bahraich, Ghazipur,
Deoria, Maharajganj, Shrawasti, Azamgarh, Balarampur,
Mirzapur, Kushi Nagar and S K Nagar), one is in the central region
(Hardoi) and one in the southern region (Lalitpur). The
regional profile of poverty reveals that rural poverty is highly
perpetuating. However, disaggregated poverty depicts that
urban areas of UP have a large number of critically high HCR
districts (HCR greater than 60%) as compared to their rural
counterparts in both the survey periods. Besides, on an average, a
significant number of critically high HCR districts were con-
centrated only in two regions (eastern region, followed by the
central region) during 2011–12.
A total number of 12 such districts (three in rural and nine in
urban areas) have been identified in the study. Out of these,
five districts are located in the central region (Unnao and
Fatehpur in rural, and Kheri, Hardoi and Barabanki in urban
areas), five in the eastern region (Basti in rural, and Kaushambi,
Ambedkar Nagar, S R Nagar and Mirzapur in urban areas),
and rest of the two districts are in the urban areas of the western
region (Rampur) and one in the southern region (Chitrakoot).
While analysing both the survey periods, it was found that except
Kaushambi and Ambedkar Nagar, all the districts witnessed a
sudden rise in poverty during 2005–12. It has been found that
65% the high HCR districts (HCR 40%–60%) are situated in the
central and eastern regions. This foregrounds the grim poverty
scenario prevailing across the central and eastern regions of UP.
3.2 Poverty among SRGs
This section examines the poverty profile among SRGs across
the four regions of UP. Before that, some existing social notions
should be reiterated. Earlier studies claim that the majority of
upper caste households are better equipped with resources and
have higher living standards as compared to other social groups.
However, some studies reveal that socially excluded groups (SCs,OBCs and Muslims) are also performing better and, therefore,
there is reduction of overall poverty in the state. In this respect,
Jeffrey et al (2008: 1368) rightly state that:
There are elites among Muslims and Dalits in UP countryside and a
substantial stratum of wealthy Muslims in many UP towns and cities.
But rural households among Muslims, Dalits and Most Backward
Class (poorer castes within the OBC Category) typically possess lit-
tle or no agricultural land and work in exploitative, poorly paid, and
insecure conditions.
Looking at the poverty profile of different SRGs in UP in
Table 2, it can be seen that across social groups the incidence
of poverty was consistently high among SCs, followed by OBCs
in both urban and rural areas during 2004–05 and 2011–12. Across religious groups, Muslim households are comparatively
poorer in rural as well as in urban areas. However, in both
areas, poverty among Muslims declined slightly faster than
that among Hindus.
Table 2: Incidence of Poverty by Social and Religious Groups in Uttar Pradesh (Percentage)
Regions Years Social Groups Religious Groups
SCs OBCs Upper Castes Hindus Muslims
Rural 2004–05 56.6 42.18 26.01 41.96 46.85
2011–12 41.11 30.72 12.47 29.83 34.00
Change -(2.21) -(1.64) -(1.93) -(1.73) -(1.84)
Urban 2004–05 44.24 42.73 20.85 27.54 48.43
2011–12 39.14 32.31 12.77 21.34 36.35
Change -(0.73) -(1.49) -(1.15) -(0.89) -(1.73)
Overall 2004–05 55.12 42.28 24.26 39.64 47.40
2011–12 40.87 31.04 12.58 28.37 34.88
Change -(2.04) -(1.61) -(1.67) -(1.61) -(1.79)
Figures of change are in percentage points per annum.
Source: Calculated from NSSO 61st and 68th rounds CES data, Government of India,
2004–05 and 2011–12.
Appreciatively, inter-group difference in poverty has nar-
rowed down over the period due to high (or at least equal)
poverty reduction per annum amongst the most excludedSRGs
(SCs–2.04% points; OBCs–1.61% point; and Muslims–1.79%). In
fact, the performance of SC (rural), OBC (urban) and Muslim
(rural and urban) households should be appreciated, as they
7/23/2019 Poverty Across Social and Religious Groups in Uttar Pradesh 0
http://slidepdf.com/reader/full/poverty-across-social-and-religious-groups-in-uttar-pradesh-0 6/10
SPECIAL ARTICLE
Economic & Political Weekly EPW DECEMBER 26, 2015 vol l no 52 105
have enhanced the pace of poverty reduction in the state.
Although there has been a significant decline in the level of pov-
erty among SCs and Muslims, the incidence of poverty among
these groups is still high. This may be due to the fact that the
majority of Muslims and SCs in the state have remained impov-
erished over a long period of time, which in turn perpetuates
chronic poverty among them (Kozel and Parker 2003; Ojha
2007). Likewise, the World Bank (2010) pointed out that though
SCs in UP experienced upward mobility similar to upper castes,
their starting point was lower than upper castes. Therefore, a
high proportion of SCs continue to live in chronic poverty.
Undoubtedly, factors responsible for the impoverishment
and discrimination of SCs are deeply embedded in history.
According to Pai (2002, 2004), the social and political power-
lessness of Dalits in UP remains the root cause of their poverty
and deprivation and further leads to economic inequalities in
the form of skewed distribution of land and income. Certain eco-
nomic factors have also been responsible for the high incidence
of poverty among them. A decline in casual wages, particularly
in the urban areas of the eastern region (World Bank 2010),possession of lesser and poor quality of land and human capital
(Kozel and Parker 2003), and illiteracy among women (Mehrotra
2006) have been primarily responsible for making SC house-
holds more vulnerable as compared to other castes in UP. Some
other factors like “improvident habits, thriftlessness and mis-
management” have also been responsible for their impoverish-
ment (GOUP 2013–14: 247). It is, therefore, suggested that such
a state of affairs can be made better if they practise self-control,
saving, soberness, and self-sufficiency. These ethical practices
would make them capable of utilising various development
schemes appropriately, resulting in their upward mobility.
A World Bank (2010) study has highlighted some specific
factors such as “increasing political mobilisation, growth inagricultural wages, increase in labour force participation
towards self-employment, regular salary work, improvements
in the education level and empowerment” have led to some
improvement in the conditions of SCs. Further, “diversification
within households, strategy of male migration and casual
wage employment towards non-farm sector” (Ojha 2007)
among SCs, and international remit-
tances received by Muslims from
West Asia (World Bank 2010) have
enhanced the livelihood of these two
subgroups in UP.
Table 3 shows that across social
groups, the lowest level of poverty
was experienced by upper castes, fol-
lowed by OBCs and SCs in all the four
regions and in both urban and rural
areas of UP during 2011–12. However,
across religious groups, Muslims were
found to be comparatively poorer in
all the regions of UP (except in the
eastern region) during 2011–12.
Three more observations can be
made from Table 3. First, the rural
central region and the urban eastern region have emerged as
critically high HCR regions, wherein more than 60% of Muslim
and SC households were found below the poverty line during
2011–12. Second, socially advantaged groups (upper castes) are
performing well in backward regions (southern region), while
socially disadvantaged groups (SCs and Muslims) are doing
well in developed regions (western region). Third, the incre-
ment in rural and urban poverty in the central region is attri-
buted to the high increment of poverty among OBCs in rural
areas and SCs in urban areas in the region. Moreover, three
population subgroups of the urban southern region—SCs,
OBCs and Hindus—have also reduced the pace of poverty
reduction in that region. In the context of these observations,
it is suggested that to increase the pace of poverty alleviation
in the state, these high poverty regions along with their
impoverished population subgroups should be targeted first
with strategic planning and development.
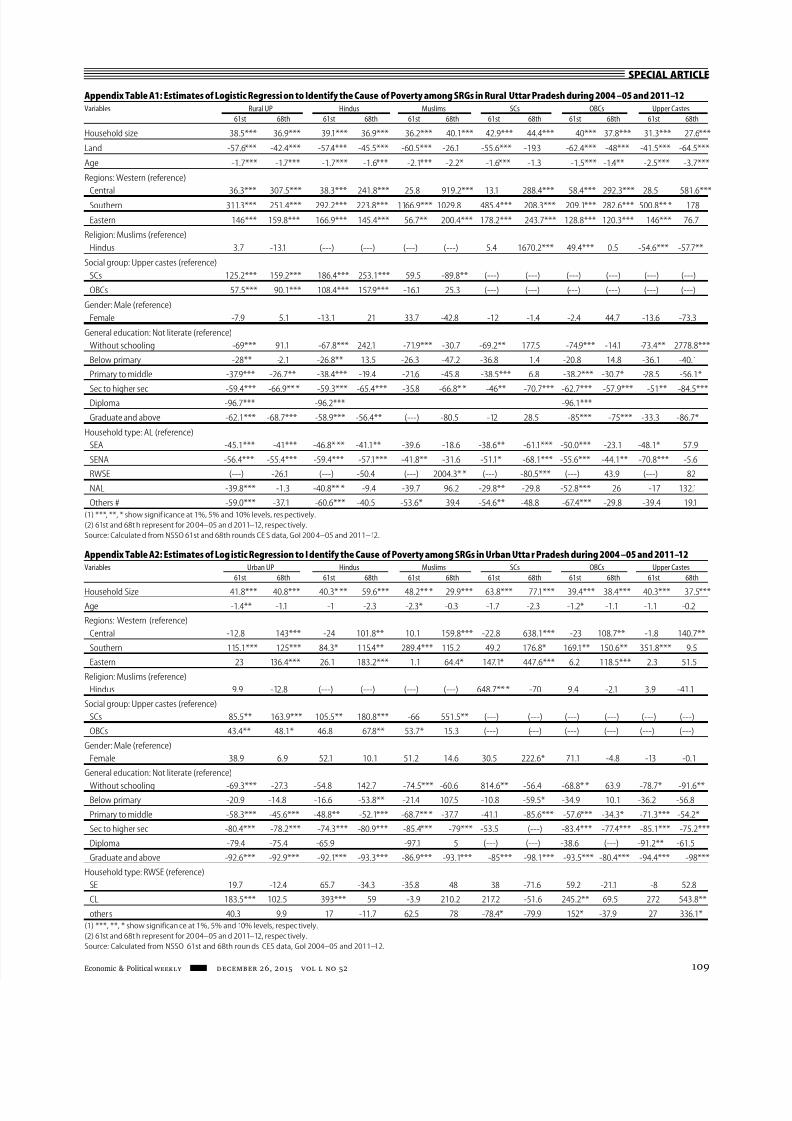
4 Determinants of Poverty among SRGs in Uttar Pradesh
This section examines the factors determining the povertystatus among SRGs in general by modelling logistic regression
on certain set of explanatory variables (discussed earlier). In
order to highlight the effect of change in place of residence,
two separate regressions have been carried out, each for rural
and urban areas (refer, Appendix Tables A1 and A2, p 109).
The following deductions have emerged from the regression
exercise which have been discussed separately for each
significant explanatory variable.
Household Size: It is assumed that as the size of a household
increases, the burden upon the pools of resources will increase,
thereby reducing the chances of moving out of poverty, provided
no child labour is allowed. Therefore, the hypothesis is thatlarger the household size, lower would be the ability of a
household to move out of poverty and vice versa. Positive signs
along with statistically significant coefficients of household
size in regression analysis confirm this hypothesis. However,
likelihoods of being poor vary among SRGs, as addition of
even one more household member leads to a significant
Table 3: Region-wise Incidence of Poverty by Social and Religious Groups (Percentage)
Groups Western Central Southern Eastern
61st 6 8th Change 61st 68th Change 61st 68th Change 61st 68th Change
Rural Uttar Pradesh
SCs 44.8 26.5 -(2.63) 71.4 49.8 -(3.09) 47.4 45.4 -(0.27) 68.9 47.5 -(3.06)
OBCs 32.1 20.1 -(1.71) 36.7 43.3 (0.94) 43.2 29.1 -(2.01) 51.2 34.1 -(2.44)
Upper castes 19.9 8.6 - (1.61) 36.9 24.2 -(1.81) 20.7 4.75 -(2.27) 32.0 11.6 -(2.91)
Hindus 30.5 17.9 -(1.80) 42.8 38.9 -(0.56) 39.1 29.9 -(1.31) 51.9 34.8 -(2.44)
Muslims 42.0 24.4 -(2.51) 83.1 63.6 -(2.79) 45.0 39.0 -(0.86) 51.4 33.1 -(2.61)
Overall 33.5 19.1 -(2.06) 37.5 42.1 (0.66) 44.6 30.2 -(2.06) 51.9 34.5 -(2.49)
Urban Uttar Pradesh
SCs 44.8 30.1 -(2.10) 40.9 52.1 (1.59) 31.8 38.3 (0.93) 63.1 60.8 -(0.33)
OBCs 42.7 26.7 -(2.29) 57.2 37.1 -(2.89) 29.0 33.5 (0.64) 47.0 37.3 -(1.39)
Upper castes 22.1 11.0 -(1.59) 37.6 19.3 -(2.61) 17.5 4.3 -(1.89) 19.2 9.6 -(1.37)
Hindus 25.2 17.2 -(1.14) 42.6 19.2 -(3.34) 18.8 26.7 (1.11) 37.2 30.0 -(1.03)
Muslims 49.2 29.7 -(2.80) 67.0 45,0 -(3.14) 38.9 36.2 -(0.37) 50.1 40.8 -(1.33)
Overall 33.8 21.2 -(1.81) 23.9 30.2 (0.90) 48.2 26.8 -(3.04) 41.2 33.1 -(1.16)
(1) 61st and 68th rounds represent estimates for 2004–05 and 2011–12, respectively.
(2) Figures representing change are in percentage points per annum.
Source: Calculate d from NSSO 61st and 68th rounds CES data, GoI 200 4–05 and 2011–12.
7/23/2019 Poverty Across Social and Religious Groups in Uttar Pradesh 0
http://slidepdf.com/reader/full/poverty-across-social-and-religious-groups-in-uttar-pradesh-0 7/10
SPECIAL ARTICLE
DECEMBER 26, 2015 vol l no 52 EPW Economic & Political Weekly106
increase in such likelihoods among them; this was more
pronounced among SCs and Muslims in rural areas and Hindus
in urban areas during 2011–12.
Land Possessed by the Rural Households (in Hectares): Access
to landholding has a significant impact on the livelihood of rural
households, particularly as the amount of land possessed or
cultivated by them reflects their socio-economic status to a great
extent. Usually, there is a positive association between size of land
possessed and the average MPCE in the rural sector (GOI 2007a).
Thus, an increase in the size of landholding would help in
reducing poverty. However, there may be cases where uneven
distribution of landholdings leads to unfair distribution of pov-
erty among various SRGs inUP. Table 4 reveals that as the size of
landholding increases (particularly after 0.004 hectares), the
incidence of poverty across all the SRGs decreases. However,
the SCs and Muslims are the most disadvantaged among SRGs
in this respect. Notably, even the large landholders (2.01–4.00
hectares) among SC households witnessed a significant increase
in incidence of poverty during the study period.On the other hand, the regression estimates do not reveal a
significant association between the likelihood of being poor and
size of landholding among SCs and Muslims in rural UP during
2011–12. However, for the rest of SRGs, such a relationship is
found to be strong. Along with inter-group differences, uneven
distribution of landholdings has also contributed towards in-
terregional disparity in poverty. According to Diwakar (2009),
as the size of landholdings increased, poverty declined in all
the regions, except in the eastern and southern regions, pri-
marily because of the fact that even the large landholders
there were also trapped in poverty.
Age of Household Head: A study conducted by the Food and
Agriculture Organisation (FAO) and United Nations Develop-
ment Programme (UNDP) (2002) states that as the age of
household head increases, the productivity of work along with
experience increases; there is a surge in capital accumulation,
and more labour is available due to less involvement in child-
care or children are older, and this in turn reduces the chances
of being poor. The negative regression coefficients reveal the
same. However, increase in the age of household head results
in a marginal decline in likelihoods of being poor among SRGs,
but this applies more to rural households.
Regions: This variable describes the location of households inorder to identify the geographic determinants of poverty, keeping
other factors constant. Besides incidence of poverty (refer Sec-
tion 3.2), the regression analysis also confirms that the central
region was the most impoverished region amongst all SRGs
(excluding urban OBCs) during 2011–12 in both urban and rural
areas. Furthermore, it was found that
during 2005–12, Muslim (rural) and SC
(rural and urban) households in the
eastern region witnessed a significant
increase in poverty as compared to
households in the western region.
Religion and Social Groups: Along with declining poverty incidence (refer
Section 3.2), the regression coeffi-
cients also depict that there is no sig-
nificant difference in the likelihood of
being poor, not only in rural but also in
urban areas, across the two major reli-
gious groups. Furthermore, across social
groups, the SCs and OBCs have witnessed
a high reduction in poverty incidence
over the years, yet a larger proportion
among these social groups is consum-
ing below the socially acceptable thresh-
old levels. And because of such high
incidence of poverty among SCs and
OBCs, the estimated coefficients reveal
a significant increase in the likelihood
of them being poor in comparison to
upper castes.
Educational Level of Household
Head: Education in the form of human
capital is the second most valuable asset
of the poor besides land. Table 5 shows
Table 4: Incidence of Poverty among SRGs by Land Ownership in Uttar Pradesh (Percentage)
Groups Social Groups Religious Groups UP
SCs OBCs Upper Castes Hindus Muslims
61st 68th 61st 68th 61st 6 8th 61st 68th 61st 68th 61st 68th
.001–.004 54.3 43.2 46.5 40.0 42.2 20.6 48 36.1 50.6 45.8 48.7 38.7
.005–.4 00 62.0 41.9 52.7 36.6 32.0 22.3 52.9 37.2 53.7 35.0 53.1 36.6
.41–1.00 52.1 39.3 41.3 27.8 30.1 10.2 41.5 26.7 42.7 29.2 41.7 26.9
1.01–2.00 41.5 25.5 32.7 19.3 24.3 8.6 32.4 16.5 26.6 26.9 31.9 17.5
2.01–4.00 30.6 64.0 18.2 14.8 9.1 0.7 16.2 19.0 8.0 2.4 15.5 18.0>4.01 (**) (**) 10 12.2 11.4 0.2 8.3 1.3 (**) (**) 12.2 4.9
(1) (**) are excluded because of small sample size.
(2) Sample size of households having land less than .001 hectare is marginal, so their classification is excluded.
(3) 61st and 68th represent estimates for 2004–05 and 2011–12, respectively.
Source: Calculate d from NSSO 61st and 68th rounds CE S data, GoI 200 4–05 and 2011–12.
Table 5: Poverty Incidence by General Educa tion Level of the Household Hea d in UP (Percentage)
Levels of Education Social Groups Religious Groups UP
SCs OBCs Upper Castes Hindus Muslims
61st 68th 61st 68th 61st 68 th 61st 68th 61st 68 th 61st 68th
Rural households
Not literate 60.33 43.23 50.50 37.52 38.59 21.17 52.36 37.41 50.89 38.71 52.17 37.56
Without formal
schooling 49.28 (**) (**) (**) 23.92 (**) (**) (**) 29.88 34.15 32.31 48.08
Below primary 58.48 39.51 45.37 41.18 25.07 11.72 44.81 37.35 40.60 31.01 43.85 36 .16
Primary to middle 51.00 44.73 37.33 27.46 24.08 12.22 36.33 29.34 46.54 29.70 37.50 29.33
Sec to higher sec 46.78 19.51 24.90 15.49 15.00 3.26 24.61 12.35 31.18 18.05 25.15 12.76
Graduate and above 49.13 33.72 10.62 8.74 18.92 8.01 20.43 10.68 (**) 15.33 20.15 10.82
Urban households
Not literate 57.96 61.86 63.62 44.56 54.84 34.41 56.08 49.12 63.24 42.82 60.35 45.47
Without formal
schooling (**) (**) 49.32 (**) 15.5 (**) 13.13 59.17 45.59 36.17 36.05 43.6
Below primary 63.73 53.85 52.3 40.89 39.20 17.82 46.96 29.91 56.09 56.83 51.01 38.94
Primary to middle 44.34 28.70 38.11 31.93 24.39 17.04 35.65 25.18 34.4 6 32.60 34.62 27.28
Sec to higher sec 26.77 19.44 19.96 15.18 10.14 9.99 16.6 4 12.21 15.24 19.55 16.16 13.33
Graduate and above 15.53 2.88 8.16 10.26 2.54 0.87 3.93 3.22 12.95 4.45 4.75 3.4
(1) 61st and 68th repre sent estimat es for 2004 –05 and 2011–12, respectively.
( 2) (**) are excluded because of small sample size.
Source: Calculate d from NSSO 61st and 68th rounds CE S data, GoI 200 4–05 and 2011–12.
7/23/2019 Poverty Across Social and Religious Groups in Uttar Pradesh 0
http://slidepdf.com/reader/full/poverty-across-social-and-religious-groups-in-uttar-pradesh-0 8/10
SPECIAL ARTICLE
Economic & Political Weekly EPW DECEMBER 26, 2015 vol l no 52 107
that during 2005–12 in UP, the high incidence of poverty
among illiterates, irrespective of their caste and religion, was
prevalent. Nevertheless, an increment in the literacy level of
household head (setting aside the “literate without formal
schooling”) decreases the prevalence of poverty among all the
SRGs (except SC and Hindu households in rural areas).
Likewise, regression estimates reveal the same (particularly
after the “primary to middle level”) with Muslims in rural areas
being the exception. Notably, even the “graduate and above”
SC household heads suffer from comparatively higher levels of
poverty, followed by Muslims in rural UP.
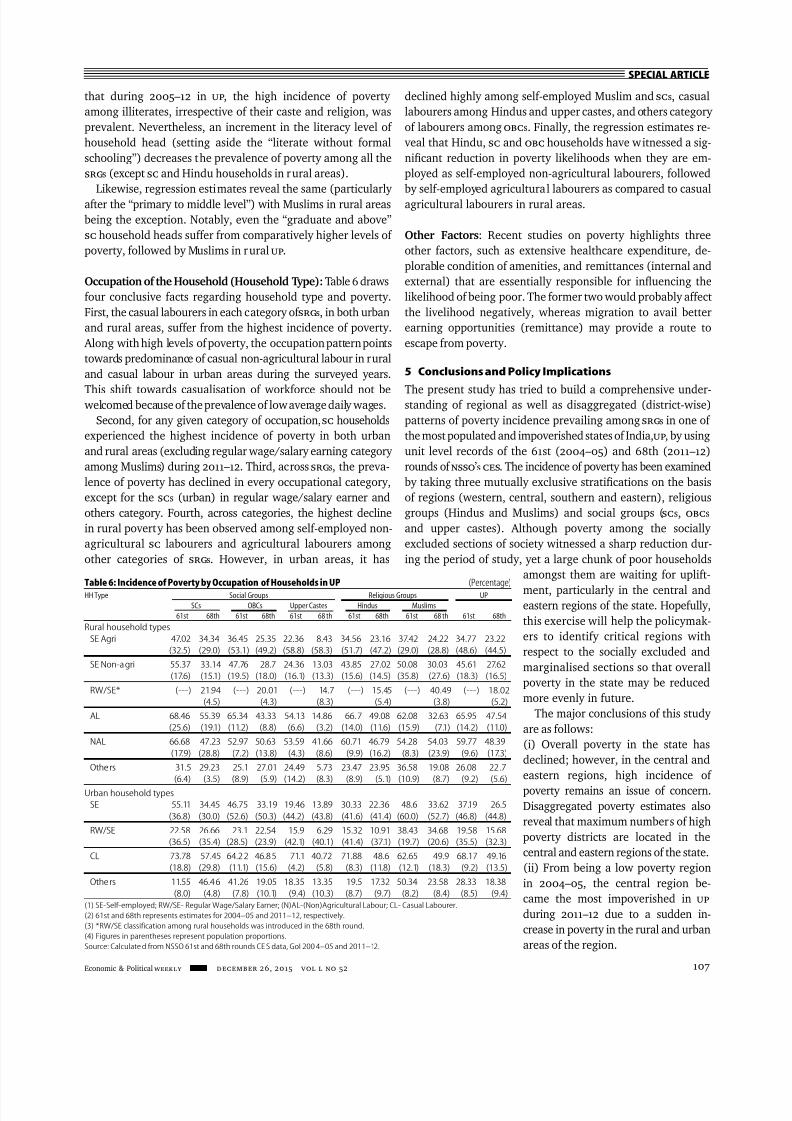
Occupation of the Household (Household Type): Table 6 draws
four conclusive facts regarding household type and poverty.
First, the casual labourers in each category ofSRGs, in both urban
and rural areas, suffer from the highest incidence of poverty.
Along with high levels of poverty, the occupation pattern points
towards predominance of casual non-agricultural labour in rural
and casual labour in urban areas during the surveyed years.
This shift towards casualisation of workforce should not be welcomed because of the prevalence of low average daily wages.
Second, for any given category of occupation, SC households
experienced the highest incidence of poverty in both urban
and rural areas (excluding regular wage/salary earning category
among Muslims) during 2011–12. Third, across SRGs, the preva-
lence of poverty has declined in every occupational category,
except for the SCs (urban) in regular wage/salary earner and
others category. Fourth, across categories, the highest decline
in rural poverty has been observed among self-employed non-
agricultural SC labourers and agricultural labourers among
other categories of SRGs. However, in urban areas, it has
declined highly among self-employed Muslim and SCs, casual
labourers among Hindus and upper castes, and others category
of labourers among OBCs. Finally, the regression estimates re-
veal that Hindu, SC and OBC households have witnessed a sig-
nificant reduction in poverty likelihoods when they are em-
ployed as self-employed non-agricultural labourers, followed
by self-employed agricultural labourers as compared to casual
agricultural labourers in rural areas.
Other Factors: Recent studies on poverty highlights three
other factors, such as extensive healthcare expenditure, de-
plorable condition of amenities, and remittances (internal and
external) that are essentially responsible for influencing the
likelihood of being poor. The former two would probably affect
the livelihood negatively, whereas migration to avail better
earning opportunities (remittance) may provide a route to
escape from poverty.
5 Conclusions and Policy Implications
The present study has tried to build a comprehensive under-standing of regional as well as disaggregated (district-wise)
patterns of poverty incidence prevailing among SRGs in one of
the most populated and impoverished states of India,UP, by using
unit level records of the 61st (2004–05) and 68th (2011–12)
rounds of NSSO’s CES. The incidence of poverty has been examined
by taking three mutually exclusive stratifications on the basis
of regions (western, central, southern and eastern), religious
groups (Hindus and Muslims) and social groups (SCs, OBCs
and upper castes). Although poverty among the socially
excluded sections of society witnessed a sharp reduction dur-
ing the period of study, yet a large chunk of poor households
amongst them are waiting for uplift-
ment, particularly in the central andeastern regions of the state. Hopefully,
this exercise will help the policymak-
ers to identify critical regions with
respect to the socially excluded and
marginalised sections so that overall
poverty in the state may be reduced
more evenly in future.
The major conclusions of this study
are as follows:
(i) Overall poverty in the state has
declined; however, in the central and
eastern regions, high incidence of
poverty remains an issue of concern.
Disaggregated poverty estimates also
reveal that maximum numbers of high
poverty districts are located in the
central and eastern regions of the state.
(ii) From being a low poverty region
in 2004–05, the central region be-
came the most impoverished in UP
during 2011–12 due to a sudden in-
crease in poverty in the rural and urban
areas of the region.
Table 6: Incidence of Poverty by Occupation of Households in UP (Percentage)
HH Type Social Groups Religious Groups UP
SCs OBCs Upper Castes Hindus Muslims
61st 68th 61st 68th 61st 68 th 61st 68th 61st 68 th 61st 68th
Rural household types
SE Agri 47.02 34.34 36.45 25.35 22.36 8.43 34.56 23.16 37.42 24.22 34.77 23.22
(32.5) (29.0) (53.1) (49.2) (58.8) (58.3) (51.7) (47.2) (29.0) (28.8) (48.6) (44.5)
SE Non-agri 55.37 33.14 47.76 28.7 24.36 13.03 43.85 27.02 50.08 30.03 45.61 27.62
(17.6) (15.1) (19.5) (18.0) (16.1) (13.3) (15.6) (14.5) (35.8) (27.6) (18.3) (16.5)
RW/SE* (---) 21.94 (---) 20.01 (---) 14.7 (---) 15.45 (---) 40.49 (---) 18.02
(4.5) (4.3) (8.3) (5.4) (3.8) (5.2)
AL 68.46 55.39 65.34 43.33 54.13 14.86 66.7 49.08 62.08 32.63 65.95 47.54
(25.6) (19.1) (11.2) (8.8) (6.6) (3.2) (14.0) (11.6) (15.9) (7.1) (14.2) (11.0)
NAL 66.68 47.23 52.97 50.63 53.59 41.66 60.71 46.79 54.28 54.03 59.77 48.39
(17.9) (28.8) (7.2) (13.8) (4.3) (8.6) (9.9) (16.2) (8.3) (23.9) (9.6) (17.3)
Others 31.5 29.23 25.1 27.01 24.49 5.73 23.47 23.95 36.58 19.08 26.08 22.7
(6.4) (3.5) (8.9) (5.9) (14.2) (8.3) (8.9) (5.1) (10.9) (8.7) (9.2) (5.6)
Urban household types
SE 55.11 34.45 46.75 33.19 19.46 13.89 30.33 22.36 48.6 33.62 37.19 26.5
(36.8) (30.0) (52.6) (50.3) (44.2) (43.8) (41.6) (41.4) (60.0) (52.7) (46.8) (44.8)
RW/SE 22.58 26.66 23.1 22.54 15.9 6.29 15.32 10.91 38.43 34.68 19.58 15.68
(36.5) (35.4) (28.5) (23.9) (42.1) (40.1) (41.4) (37.1) (19.7) (20.6) (35.5) (32.3)
CL 73.78 57.45 64.22 46.85 71.1 40.72 71.88 48.6 62.65 49.9 68.17 49.16
(18.8) (29.8) (11.1) (15.6) (4.2) (5.8) (8.3) (11.8) (12.1) (18.3) (9.2) (13.5)
Others 11.55 46.46 41.26 19.05 18.35 13.35 19.5 17.32 50.34 23.58 28.33 18.38
(8.0) (4.8) (7.8) (10.1) (9.4) (10.3) (8.7) (9.7) (8.2) (8.4) (8.5) (9.4)
(1) SE-Self-employed; RW/SE- Regular Wage/Salary Earner; (N)AL-(Non)Agricultural Labour; CL- Casual Labourer.
(2) 61st and 68th represents estimates for 2004–05 and 2011–12, respectively.
(3) *RW/SE classification among rural households was introduced in the 68th round.
(4) Figures in parentheses represent population proportions.
Source: Calculate d from NSSO 61st and 68th rounds CE S data, GoI 200 4–05 and 2011–12.
7/23/2019 Poverty Across Social and Religious Groups in Uttar Pradesh 0
http://slidepdf.com/reader/full/poverty-across-social-and-religious-groups-in-uttar-pradesh-0 9/10
SPECIAL ARTICLE
DECEMBER 26, 2015 vol l no 52 EPW Economic & Political Weekly108
(iii) Across religious groups, it has been found that Muslims
are relatively poorer in comparison to Hindus. However, there
are no differences as far as decline in poverty rate is concerned
among the two communities. Across social groups, the SCs,
followed by the OBCs, are comparatively poorer than upper
caste households. Nevertheless, the highest decline in poverty
has been observed among SCs and OBCs. Fortunately, the high
decline in poverty among socially excluded and marginalised
groups (SCs, OBCs and Muslims) signifies a reduction in inter-
group differences in poverty.
(iv) An analysis of the interregional pattern of poverty brings
out three important observations: (a) the rural central region
and the urban eastern region have emerged as critically high
HCR regions, wherein more than 60% of Muslim and SC house-
holds were found below the poverty line during 2011–12;
(b) the socially advantaged groups (upper castes) are perform-
ing well in the backward southern region, while the socially
disadvantaged groups (SCs and Muslims) are doing well in the
developed western region; (c) and lastly the increment in
rural and urban poverty in the central region is attributed tothe increment in poverty among the OBCs in rural and SCs in
urban areas. Moreover, the three population subgroups—SCs,
OBCs and Hindus—in the urban areas of southern region also
reduce the pace of poverty reduction in that region.
(v) An examination of interregional poverty among SRGs shows
that SC and Muslim households are the most impoverished
population subgroups across all regions in general, but particu-
larly in the central and eastern regions of the state. Furthermore,
disaggregated analysis brings out 12 critical districts—five are
located in the central region (Unnao and Fatehpur in rural, and
Kheri, Hardoi and Barabanki in urban areas), five in the east
region (Basti in rural, and Kaushambi, Ambedkar Nagar,
S R Nagar and Mirzapur in urban areas), one in the western re-
gion (Rampur in urban areas), and one in the southern region
(Chitrakoot in urban areas)—which foregrounds the grim poverty
scenario prevailing across the central and eastern regions of UP.
(vi) An attempt has also been made to find out the factors
affecting poverty status among the most impoverished SRGs
(SCs and Muslims) by modelling logistic regression for both
rural and urban areas of the state. Both the groups (SCs and
Muslims) are poor more or less due to illiteracy, casualisation
of work force and the sudden increase in poverty in the central
region in general and low self-employment in agricultural
occupations, large household size, marginal landholdings and
backwardness of the rural eastern region in particular.
(vii) The two most unfortunate facts observed among SCs are
that even the large landholders are highly poor, and for any
given category of occupation, they experienced the highest
poverty in both rural and urban areas (excluding regular wage/salary earning category among Muslims) during 2011–12.
This kind of heterogeneity across the regions and amongst
SRGs demands region-specific and group-specific development
programmes for alleviating overall poverty in the state. Also,
poverty alleviation policies should focus on development of
education and self-employment in general, and promote family
planning and improve the quality of education in particular
amongst rural households, with special emphasis on SC and
Muslim households.
Notes
1 It includes Bihar, Jharkhand, Madhya Pradesh,
Odisha, Rajasthan, UP, Chhattisgarh, and WestBengal.
2 Figures based on the 2011 Census.
3 Since access to land is one of the importantmeans to move out from poverty in rural areas,this variable is considered only for the ruralhouseholds.
4 The western and southern regions have thehighest and lowest gross value of agricultureoutput per hectare of gross cropped area atcurrent price (2009–10), total number of regis-tered factories per lakh of population (2008–09),and number of persons engaged in registeredfactories per lakh of population (2008–09),respectively.
References
Ajwad, Mohamed (2007): “Performance of Socia l
Safety Net Programs in Uttar Pradesh,” SocialProtection, World Bank Policy Research, Work-ing Paper No 714.
Dev, S Mahendra and C Ravi (2007): “Poverty andInequality: All-India and States, 1983–2005,” Economic & Political Weekly , Vol 42, No 6,pp 509–21.
— (2008): “Revising Estimates of Poverty,” Eco-nomic & Political Weekly , Vol 43, No 10, pp 8–10.
Diwakar, D M (2009): “Intra-Regional Disparities,Inequality and Poverty in Uttar Pradesh,” Economic & Political Weekly , Vol 44, Nos 26–27,pp 264–73.
FAO and UNDP (2002): “Gender Differences in theTransitional Economy of Viet Nam,” RegionalOffice for Asia and the Pacific (FAO), Bangkok.
GOI (2007a): “ Household Consumer Expenditureacross Socio-Economic Groups: 2004–05,”Report No 514, National Sample Survey Organi- sation, New Delhi: Government of India.
— (2007b): Uttar Pradesh: State Development Re- port (Volumes I and II), State Plan Division,Planning Commission, New Delhi.
— (2009): “Report of the Expert Group to Reviewthe Methodology for Estimation of Poverty,”Planning Commission, New Delhi.
— (2011): “India Human Development Report(IHDR) 2011–Towards Social Inclusion,” Instituteof Applied Manpower Research, New Delhi.
— (2013): “Press Note on Pover ty Estimates,2011–12,” Planning Commission, New Delhi.
Government of India and United Nations Develop-ment Programme (2008): “Human DevelopmentReport 2006: Uttar Pradesh,” Planning Com-mission, New Delhi.
GoUP (Government of Uttar Pradesh) (2013–14):
“Annual Plan of Uttar Pradesh,” State PlanningCommission, http://planning.up.nic.in/spc/annual%20plan%202013-2014/Annual%20Plan%202013-14, viewed on 26 March 2014.
Himanshu (2007): “Recent Trends in Poverty andInequality: Some Preliminary Results,” Economic& Political Weekly , Vol 42, No 6, pp 497–508.
Jeffrey, C, P Jeffery and R Jeffery (2008): “DalitRevolution? New Politicians in Uttar Pradesh,India,” The Journal of Asian Studies, Vol 67,No 4, pp 1365–96.
Kapur, D, C B Prasad, L Pritchett and D S Babu(2010): “Rethinking Inequality: Dalits in UttarPradesh in the Market Reform Era,” Economic& Political Weekly , Vol 45, No 35, pp 39–49.
Kohli, A (1987): The State and Poverty in India: The
Politics of Reforms, Cambridge: CambridgeUniversity Press, pp 188–222.
Kozel, Valerie and Barbara Parker (2003): “A Profileand Diagnostic of Poverty in Uttar Pradesh,” Economic & Political Weekly , Vol 38, No 04,pp 385–403.
Mehrotra, Santosh (2006): “Well-Being and Castein Uttar Pradesh: Why UP Is Not Like TamilNadu,” Economic & Political Weekly , Vol 40,No 40, pp 4261–71.
Mutatkar, R (2005): “Social Group Disparities andPoverty in India,” Indira Gandhi Institute ofDevelopment Research , Working Paper SeriesNo WP-2005–004.
Ojha, R K (2007): “Poverty Dynamics in Rural UttarPradesh,” Economic & Political Weekly , Vol 42,No 16, pp 1453–58.
Pai, Sudha (2002): Dalit Assertion and the Unfin-ished Democratic Revolution: The BahujanSamaj Party in Uttar Pradesh, New Delhi: SagePublications.
— (2004): “Dalit Question and Political Response:Comparative Study of Uttar Pradesh andMadhya Pradesh,” Economic & Political Weekly , Vol 39, No 11, pp 1141–50.
Sundaram, K and S D Tendulkar (2003): “Povertyamong Social and Economic Groups in Indiain 1990s,” Economic & Poli tical Weekly , Vol 38,No 50, pp 5263–76.
Thorat, S and A Dubey (2012): “Has Growth BeenSocially Inclusive during 1993–94—2009–10?,” Economic & Political Weekly , Vol 47, No 10,pp 43–53.
World Bank (2010): “India–Living Conditions andHuman Development in Uttar Pradesh: ARegional Perspective,” Report No 43573-IN,Washington DC: World Bank.
7/23/2019 Poverty Across Social and Religious Groups in Uttar Pradesh 0
http://slidepdf.com/reader/full/poverty-across-social-and-religious-groups-in-uttar-pradesh-0 10/10
SPECIAL ARTICLE
Economic & Political Weekly EPW DECEMBER 26, 2015 vol l no 52 109
Appendix Table A1: Estimates of Logistic Regressi on to Identify the Cause of Poverty among SRGs in Rural Uttar Pradesh during 2004 –05 and 2011–12
Variables Rural UP Hindus Muslims SCs OBCs Upper Castes
61st 68th 61st 68th 61st 68th 61st 68th 61st 68th 61st 68th
Household size 38.5*** 36.9*** 39.1*** 36.9*** 36.2*** 40.1*** 42.9*** 44.4*** 40*** 37.8*** 31.3*** 27.6***
Land -57.6*** -42.4*** -57.4*** -45.5*** -60.5*** -26.1 -55.6*** -19.3 -62.4*** -48*** -41.5*** -64.5***
Age -1.7*** -1.7*** -1.7*** -1.6*** -2.1*** -2.2* -1.6*** -1.3 -1.5*** -1.4** -2.5*** -3.7***
Regions: Western (reference)
Central 36.3*** 307.5*** 38.3*** 241.8*** 25.8 919.2*** 13.1 288.4*** 58.4*** 292.3*** 28.5 581.6***
Southern 311.3*** 251.4*** 292.2*** 223.8*** 1166.9*** 1029.8 485.4*** 208.3*** 209.1*** 282.6*** 500.8** * 178
Eastern 146*** 159.8*** 166.9*** 145.4*** 56.7** 200.4*** 178.2*** 243.7*** 128.8*** 120.3*** 146*** 76.7
Religion: Muslims (reference)
Hindus 3.7 -13.1 (---) (---) (---) (---) 5.4 1670.2*** 49.4*** 0.5 -54.6*** -57.7**
Social group: Upper castes (reference)
SCs 125.2*** 159.2*** 186.4*** 253.1*** 59.5 -89.8** (---) (---) (---) (---) (---) (---)
OBCs 57.5*** 90.1*** 108.4*** 157.9*** -16.1 25.3 (---) (---) (---) (---) (---) (---)
Gender: Male (reference)
Female -7.9 5.1 -13.1 21 33.7 -42.8 -12 -1.4 -2.4 44.7 -13.6 -73.3
General education: Not literate (reference)
Without schooling -69*** 91.1 -67.8*** 242.1 -71.9*** -30.7 -69.2** 177.5 -74.9*** -14.1 -73.4** 2778.8***
Below primary -28** -2.1 -26.8** 13.5 -26.3 -47.2 -36.8 1.4 -20.8 14.8 -36.1 -40.1
Primary to middle -37.9*** -26.7** -38.4*** -19.4 -21.6 -45.8 -38.5*** 6.8 -38.2*** -30.7* -28.5 -56.1*
Sec to higher sec -59.4*** -66.9** * -59.3*** -65.4*** -35.8 -66.8* * -46** -70.7*** -62.7*** -57.9*** -51** -84.5*** Diploma -96.7*** -96.2*** -96.1***
Graduate and above -62.1*** -68.7*** -58.9*** -56.4** (---) -80.5 -12 28.5 -85*** -75*** -33.3 -86.7*
Household type: AL (reference)
SEA -45.1*** -41*** -46.8* ** -41.1** -39.6 -18.6 -38.6** -61.1*** -50.0*** -23.1 -48.1* 57.9
SENA -56.4*** -55.4*** -59.4*** -57.1*** -41.8** -31.6 -51.1* -68.1*** -55.6*** -44.1** -70.8*** -5.6
RWSE (---) -26.1 (---) -50.4 (---) 2004.3* * (---) -80.5*** (---) 43.9 (---) 82
NAL -39.8*** -1.3 -40.8** * -9.4 -39.7 96.2 -29.8** -29.8 -52.8*** 26 -17 132.1
Others # -59.0*** -37.1 -60.6*** -40.5 -53.6* 39.4 -54.6** -48.8 -67.4*** -29.8 -39.4 19.1
(1) ***, **, * show signif icance at 1%, 5% and 10% levels, res pectively.
(2) 61st and 68t h represent for 20 04–05 an d 2011–12, respec tively.
Source: Calculate d from NSSO 61st and 68th rounds CE S data, GoI 200 4–05 and 2011–12.
Appendix Table A2: Estimates of Log istic Regression to I dentify the Cause of Poverty among SRGs in Urban Utta r Pradesh during 2004 –05 and 2011–12
Variables Urban UP Hindus Muslims SCs OBCs Upper Castes
61st 68th 61st 68th 61st 68th 61st 68th 61st 68th 61st 68th
Household Size 41.8*** 40.8*** 40.3* ** 59.6*** 48.2** * 29.9*** 63.8*** 77.1*** 39.4*** 38.4*** 40.3*** 37.5***
Age -1.4** -1.1 -1 -2.3 -2.3* -0.3 -1.7 -2.3 -1.2* -1.1 -1.1 -0.2
Regions: Western (reference)
Central -12.8 143*** -24 101.8** 10.1 159.8*** -22.8 638.1*** -23 108.7** -1.8 140.7**
Southern 115.1*** 125*** 84.3* 115.4** 289.4*** 115.2 49.2 176.8* 169.1** 150.6** 351.8*** 9.5
Eastern 23 136.4*** 26.1 183.2*** 1.1 64.4* 147.1* 447.6*** 6.2 118.5*** 2.3 51.5
Religion: Muslims (reference)
Hindus 9.9 -12.8 (---) (---) (---) (---) 648.7** * -70 9.4 -2.1 3.9 -41.1
Social group: Upper castes (reference)
SCs 85.5** 163.9*** 105.5** 180.8*** -66 551.5** (---) (---) (---) (---) (---) (---)
OBCs 43.4** 48.1* 46.8 67.8** 53.7* 15.3 (---) (---) (---) (---) (---) (---)
Gender: Male (reference)
Female 38.9 6.9 52.1 10.1 51.2 14.6 30.5 222.6* 71.1 -4.8 -13 -0.1
General education: Not literate (reference)
Without schooling -69.3*** -27.3 -54.8 142.7 -74.5*** -60.6 814.6** -56.4 -68.8* * 63.9 -78.7* -91.6** Below primary -20.9 -14.8 -16.6 -53.8** -21.4 107.5 -10.8 -59.5* -34.9 10.1 -36.2 -56.8
Primary to middle -58.3*** -45.6*** -48.8** -52.1*** -68.7** * -37.7 -41.1 -85.6*** -57.6*** -34.3* -71.3*** -54.2*
Sec to higher sec -80.4*** -78.2*** -74.3*** -80.9*** -85.4*** -79*** -53.5 (---) -83.4*** -77.4*** -85.1*** -75.2***
Diploma -79.4 -75.4 -65.9 -97.1 5 (---) (---) -38.6 (---) -91.2** -61.5
Graduate and above -92.6*** -92.9*** -92.1*** -93.3*** -86.9*** -93.1*** -85*** -98.1*** -93.5*** -80.4*** -94.4*** -98***
Household type: RWSE (reference)
SE 19.7 -12.4 65.7 -34.3 -35.8 48 38 -71.6 59.2 -21.1 -8 52.8
CL 183.5*** 102.5 393*** 59 -3.9 210.2 217.2 -51.6 245.2** 69.5 272 543.8**
other s 40.3 9.9 17 -11.7 62.5 78 -78.4* -79.9 152* -37.9 27 336.1*
(1) ***, **, * show significan ce at 1%, 5% and 10% levels, respec tively.
(2) 61st and 68t h represent for 20 04–05 an d 2011–12, respec tively.
Source: Calculated from NSSO 61st and 68th roun ds CES data, GoI 2004–05 and 2011–12.