Embed Size (px)
Citation preview
Industry & Trade Summary
Office of Industries
Poultry
Publication ITS-010 January 2014
Control No. 2014001
UNITED STATES INTERNATIONAL TRADE COMMISSION
Robert B. Koopman Director, Office of Operations
Karen Laney
Director, Office of Industries
This report was prepared principally by:
Marin Weaver, Office of Industries Livestock, Dairy, and Fishery Products
With supporting assistance from:
Phyllis Boone, Office of Industries
Peg Hausman and David Lundy, Office of Analysis and Research Services
Carolyn Holmes and Darlene Smith,
Statistical Support Division, Office of Investigations
Sonya Wilson,
Help Desk and Customer Service Division, Office of the Chief Information Officer
Under the direction of:
Jonathan Coleman, Chief Agriculture and Fisheries Division
Address all communications to Secretary to the Commission
United States International Trade Commission Washington, DC 20436
www.usitc.gov
Preface
The United States International Trade Commission (USITC) initiated its current Industry and Trade Summary series of reports to provide information on the rapidly evolving trade and competitive situation of the thousands of products imported into and exported from the United States. International supply chains have become more global, and competition has increased. Each Industry and Trade Summary addresses a different commodity/industry and contains information on trends in consumption, production, and trade, as well as an analysis of factors affecting industry trends and competitiveness in domestic and foreign markets. This report on the poultry industry primarily covers the period 2006 through 2012.
Papers in this series reflect ongoing research by USITC international trade analysts. The work does not represent the views of the USITC or any of its individual Commissioners. This paper should be cited as the work of the author only, and not as an official Commission document. Suggested reference citation: Weaver, Marin. Poultry. Industry and Trade Summary. Publication ITS-10. Washington, DC: U.S.
International Trade Commission, January 2014.
i

CONTENTS Page
Preface .......................................................................................................................................... i
Abbreviations and Acronyms .................................................................................... vi
Key Points .................................................................................................................................. 1
Introduction ............................................................................................................................. 3
Definition and scope .................................................................................................................. 3 U.S. industry and the global market .......................................................................................... 4 Industry issues ........................................................................................................................... 6
U.S. Industry ............................................................................................................................ 7
Industry structure ....................................................................................................................... 7 Number and concentration of firms ....................................................................................... 7 Employment, earnings, and productivity ............................................................................... 8 Vertical and horizontal integration ........................................................................................ 10
Extent of globalization of the industry .................................................................................. 10 Production process and market channels ................................................................................... 11 Production process ................................................................................................................. 11 Market channels ..................................................................................................................... 14
U.S. Production and Consumption Trends ..................................................... 14
Production trends ....................................................................................................................... 14 National production ............................................................................................................... 14 State production ..................................................................................................................... 16 Factors affecting production ...................................................................................................... 17 Costs ...................................................................................................................................... 18 U.S. government policy and programs .................................................................................. 19 Research and development .................................................................................................... 20 Consumption .............................................................................................................................. 21 Consumption trends ............................................................................................................... 21 Import penetration levels ....................................................................................................... 22 Factors affecting consumption ................................................................................................... 22
U.S. Trade .................................................................................................................................. 23
Overview .................................................................................................................................... 23 U.S. exports ............................................................................................................................... 25
Export levels .......................................................................................................................... 25 U.S. government programs .................................................................................................... 27 Principal markets ................................................................................................................... 27 Foreign trade measures in principal markets ......................................................................... 30 U.S. imports ............................................................................................................................... 33
iii
CONTENTS—Continued Page
U.S. Trade—Continued Import levels .......................................................................................................................... 33 Principal suppliers ................................................................................................................. 33 U.S. trade measures ............................................................................................................... 35
Foreign Industry Profiles .............................................................................................. 36
Overview .................................................................................................................................... 36 Global net exporters ................................................................................................................... 37 Brazil ..................................................................................................................................... 37 European Union ..................................................................................................................... 40 Thailand ................................................................................................................................. 42 China ...................................................................................................................................... 44 Global net importers .................................................................................................................. 46 Russia ..................................................................................................................................... 46 Saudi Arabia .......................................................................................................................... 49 Mexico ................................................................................................................................... 51 Japan ...................................................................................................................................... 52
Bibliography ........................................................................................................................... 55
Appendix
A. Statistical tables ........................................................................................................................... A-1
Figures
1. The U.S. poultry industry includes multiple types of producers, principal inputs, finished products, and markets .......................................................................................................... 4 2. The conventional U.S. poultry industry has multiple stages of production and market
channels ............................................................................................................................... 12 3. The largest share of U.S. broiler meat was marketed through domestic retail outlets in
2007 ..................................................................................................................................... 15 4. Turkey meat was largely marketed through domestic retail outlets and food services in 2007 ..................................................................................................................................... 15 5. Soybean and corn price rose to record highs multiple times between 2006/07 and 2011/12 ................................................................................................................................ 18 6. Only a small percentage of U.S. poultry meat production is exported..................................... 24 7. During 2006–12 U.S. poultry exports of live birds to China and Indonesia grew
significantly ......................................................................................................................... 26 8. Global production of poultry meat was highly concentrated in 2006–12 ................................ 36 9. There are a small number of major poultry meat trade flows, as demonstrated by world trade in 2011 ........................................................................................................................ 38 10. Russia's poultry tariff-rate quota amounts fell between 2009 and 2012 .................................. 49
iv
CONTENTS—Continued Page
Tables
1. U.S. poultry farms: Number reporting sales of live poultry, by type, 2002 and 2007 ............... 7 2. Poultry: Share of U.S. production accounted for by the top 3, 5, and 10 firms, 2006–12 ......... 8 3. U.S. poultry-processing industry: Employment and earnings, 2006–11 ................................... 9 4. Broilers: Performance indicators for the U.S. industry, 1940–2010 .......................................... 10 5. Poultry: U.S. production of live broilers and turkeys, 2006–12 ................................................ 16 6. Poultry: U.S. broiler and turkey production, by major states, 2006–12 .................................... 17 7. U.S. annual per capita consumption of meat and seafood, 2006–12 ......................................... 21 8. Average retail prices for chicken, beef, pork, and eggs, 2006–12 ............................................. 23 9. Live and meat poultry: U.S. exports of domestic merchandise, imports for consumption, and trade balance, by selected trade partners and trade partner groups, 2006–12 ................ 24 10. Poultry meat: U.S. exports of domestic merchandise, by principal markets, 2006–12 ............. 26 11. Poultry: Composition of U.S. imports for consumption, by product type, 2006–12 ................. 34 12. Poultry meat: U.S. imports for consumption, by principal markets, 2006–12 .......................... 34 13. Brazil: Poultry production, consumption, exports, imports, and trade balance, 2006–12 ......... 39 14. European Union: Poultry production, consumption, exports, imports, and trade balance, 2006–12 ................................................................................................................................ 40 15. Thailand: Poultry production, consumption, exports, imports, and trade balance, 2006–12 ..... 43 16. China: Poultry production, consumption, exports, imports, and trade balance, 2006–12 ......... 44 17. Russia: Poultry production, consumption, exports, imports, and trade balance, 2006–12 ........ 47 18. Saudi Arabia: Poultry production, consumption, exports, imports, and trade balance, 2006–12 ................................................................................................................................ 50 19. Mexico: Poultry production, consumption, exports, imports, and trade balance, 2006–12 ....... 51 20. Japan: Poultry production, consumption, exports, imports, and trade balance, 2006–12 .......... 53 A.1. Broiler and turkey meat: World production, by selected countries and country groups, 2006–12 ................................................................................................................................ A-3 A.2. Broiler and turkey meat: World consumption, by selected countries and country groups, 2006–12 ................................................................................................................................ A-4 A.3. Broiler and turkey meat: World exports, by selected countries and country groups, 2006–12 ................................................................................................................................ A-5 A.4. Broiler and turkey meat: World imports, by selected countries and country groups, 2006–12 ................................................................................................................................ A-6 A.5. Poultry: Harmonized Tariff Schedule of the United States (HTS) subheadings, description, and column-1 rates of duty, 2012 ......................................................................................... A-7
v
Abbreviations and Acronyms APHIS
Animal and Plant Health Inspection Service
AD Antidumping ARF Automatic Registration Form AI Avian influenza CAP Common Agricultural Policy (European Union) CIF Cost, insurance, and freight CV Countervailing CVD Countervailing duty CY Crop year EC European Commission EU European Union FSIS Food Safety and Inspection Service FAS Foreign Agricultural Services FTA GDP HS
Free trade agreement Gross domestic product Harmonized Schedule
HTS or HTSUS Harmonized Tariff Schedule of the United States HACCP Hazard Analysis and Critical Control Points systems HPAI High pathogen avian influenza IREP Import to Re-Export Program kg Kilogram LPAI Low pathogenic avian influenza MAP Market Access Program mt Metric ton MFN Most favored nation MOFCOM Ministry of Commerce (People’s Republic of China) NTM Nontariff measures NAFTA North American Free Trade Agreement P&SP Packers and Stockyards Program PRT Pathogen reduction treatment lb Pound PPIA R&D
Poultry Products Inspection Act Research and development
m2 Square meter TRQs Tariff-rate quotas UNA Mexican Association of Poultry Producers USDA U.S. Department of Agriculture USITC or Commission U.S. International Trade Commission USAPEEC USA Poultry and Egg Export Council OIE World Organisation for Animal Health VAT Value-added tax WTO World Trade Organization
vi
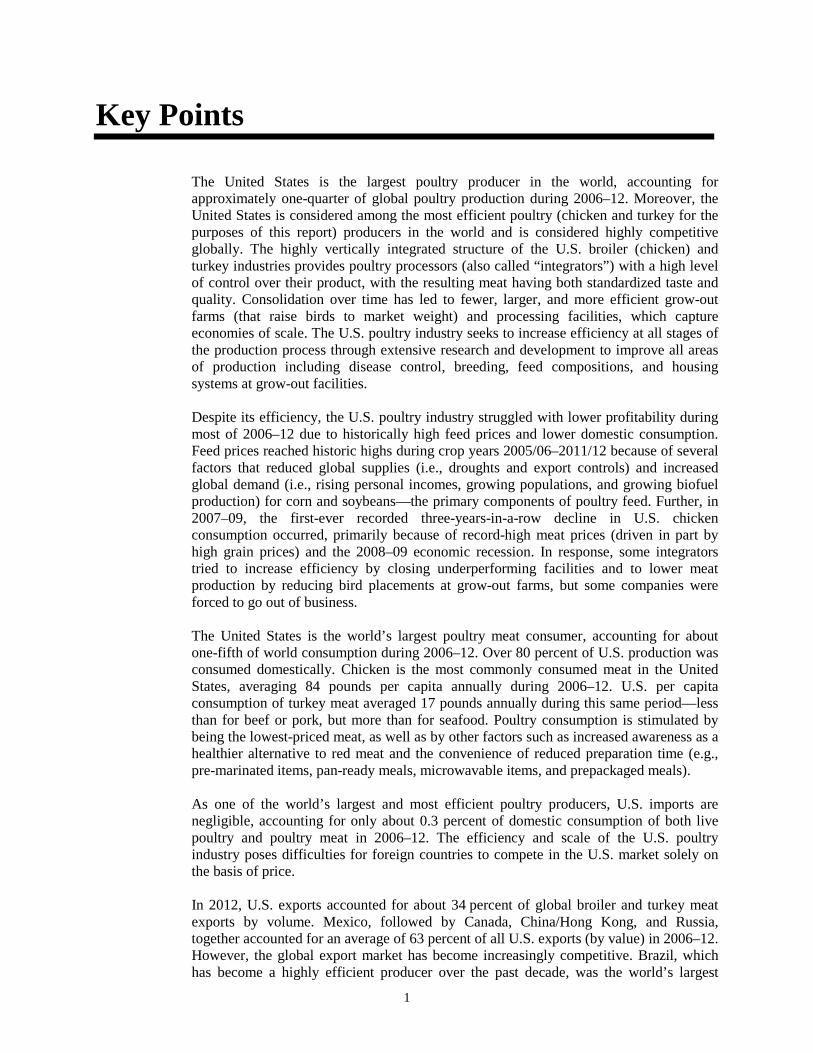
Key Points
The United States is the largest poultry producer in the world, accounting for approximately one-quarter of global poultry production during 2006–12. Moreover, the United States is considered among the most efficient poultry (chicken and turkey for the purposes of this report) producers in the world and is considered highly competitive globally. The highly vertically integrated structure of the U.S. broiler (chicken) and turkey industries provides poultry processors (also called “integrators”) with a high level of control over their product, with the resulting meat having both standardized taste and quality. Consolidation over time has led to fewer, larger, and more efficient grow-out farms (that raise birds to market weight) and processing facilities, which capture economies of scale. The U.S. poultry industry seeks to increase efficiency at all stages of the production process through extensive research and development to improve all areas of production including disease control, breeding, feed compositions, and housing systems at grow-out facilities.
Despite its efficiency, the U.S. poultry industry struggled with lower profitability during most of 2006–12 due to historically high feed prices and lower domestic consumption. Feed prices reached historic highs during crop years 2005/06–2011/12 because of several factors that reduced global supplies (i.e., droughts and export controls) and increased global demand (i.e., rising personal incomes, growing populations, and growing biofuel production) for corn and soybeans—the primary components of poultry feed. Further, in 2007–09, the first-ever recorded three-years-in-a-row decline in U.S. chicken consumption occurred, primarily because of record-high meat prices (driven in part by high grain prices) and the 2008–09 economic recession. In response, some integrators tried to increase efficiency by closing underperforming facilities and to lower meat production by reducing bird placements at grow-out farms, but some companies were forced to go out of business.
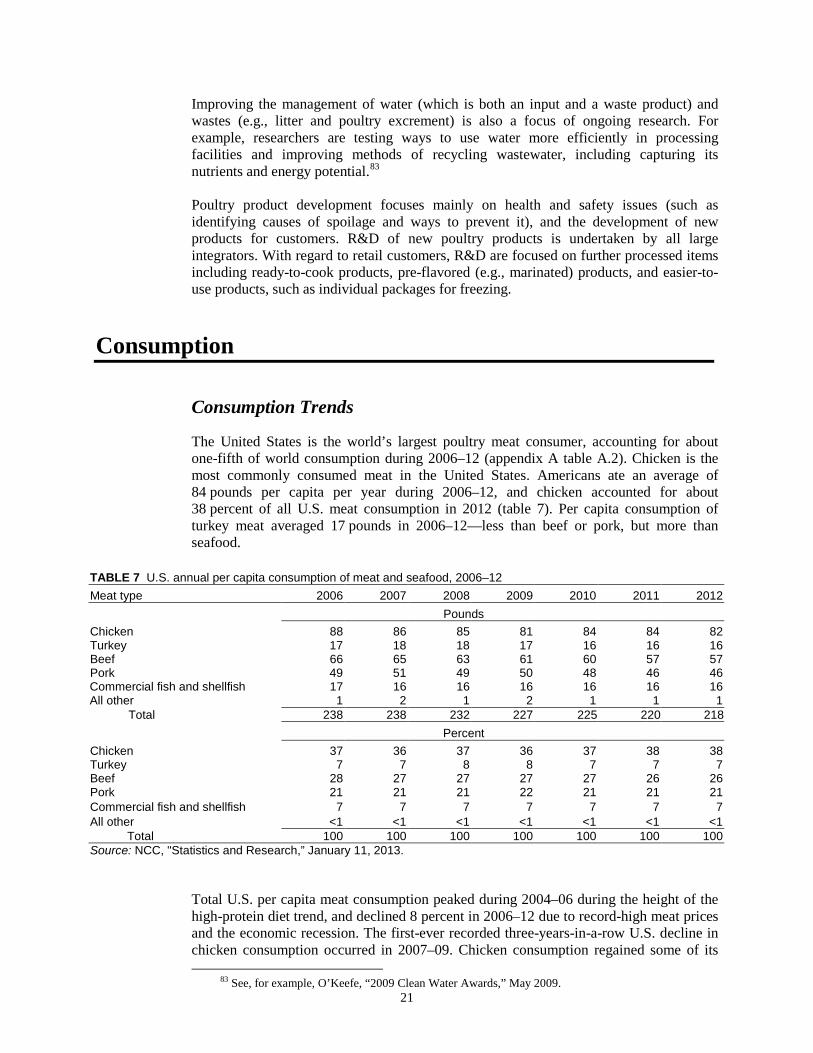
The United States is the world’s largest poultry meat consumer, accounting for about one-fifth of world consumption during 2006–12. Over 80 percent of U.S. production was consumed domestically. Chicken is the most commonly consumed meat in the United States, averaging 84 pounds per capita annually during 2006–12. U.S. per capita consumption of turkey meat averaged 17 pounds annually during this same period—less than for beef or pork, but more than for seafood. Poultry consumption is stimulated by being the lowest-priced meat, as well as by other factors such as increased awareness as a healthier alternative to red meat and the convenience of reduced preparation time (e.g., pre-marinated items, pan-ready meals, microwavable items, and prepackaged meals).
As one of the world’s largest and most efficient poultry producers, U.S. imports are negligible, accounting for only about 0.3 percent of domestic consumption of both live poultry and poultry meat in 2006–12. The efficiency and scale of the U.S. poultry industry poses difficulties for foreign countries to compete in the U.S. market solely on the basis of price.
In 2012, U.S. exports accounted for about 34 percent of global broiler and turkey meat exports by volume. Mexico, followed by Canada, China/Hong Kong, and Russia, together accounted for an average of 63 percent of all U.S. exports (by value) in 2006–12. However, the global export market has become increasingly competitive. Brazil, which has become a highly efficient producer over the past decade, was the world’s largest
1
poultry exporter for most of 2006–12. The European Union, Thailand, and China are also among the world’s leading poultry exporters. Russia, followed by Saudi Arabia, Mexico, and Japan are the world’s largest poultry net importers. Exports are becoming more important for the U.S. poultry industry, increasing from 14 percent of production in 2006 to 19 percent in 2012, partly because domestic consumption fell. The U.S. poultry industry was able to increase exports despite facing challenges in exporting to two of its largest export markets—Russia and China. U.S. exports to these foreign markets fell by 79 percent (by volume) from their 2008 peak to their low in 2011 because of a number of measures imposed on U.S. poultry. Russia banned imports of poultry treated with a chlorinated rinse to reduce pathogens, effectively blocking U.S. poultry exports for over one-half of 2010. Additionally, Russia lowered its tariff-rate quota between 2009 and 2010, thereby reducing the amount of poultry that entered at the lower duty rate. For its part, in 2010, China imposed antidumping duties rates ranging from 50.3 to 105.4 percent ad valorem and countervailing duties rates ranging from 5.1 to 30.3 percent ad valorem on imports of U.S. poultry meat.
2
Introduction
Definition and Scope
This industry and trade summary examines the structure of the U.S. industry, trends in U.S. production and trade, trade barriers, and conditions in key markets and producing countries. It covers both live poultry raised for meat and poultry meat.1 The poultry meat industry includes producers of broilers (chickens) and turkeys, as well as smaller industry segments producing ducks, geese, guinea fowls, etc. Nevertheless, the primary focus of this summary is on broilers and turkeys, the largest poultry industry sectors in the United States. 2 This summary presents information on the structure of the U.S. and foreign industries, the production process and market channels, consumer preferences, trade levels and trends, domestic and foreign tariff and nontariff measures, and the factors affecting international competitive conditions for the U.S. poultry industry. This summary primarily reports on developments during 2006–12. However, it also discusses events prior to 2006 that are relevant to explaining the industry’s current structure and, where 2012 data are not available, uses the most recent data available. The United States is one of the largest and is considered among the most efficient poultry producer in the world, accounting for approximately one-quarter of global poultry production in 2006–12. U.S. exports rose almost 40 percent during 2006–12, and accounted for about 34 percent of global broiler and turkey meat exports by volume in 2012. The U.S. industry, which is highly vertically integrated, continues to become more efficient over time due to factors such as economies of scale and extensive research and development. Nevertheless, the U.S. industry also faced some significant challenges. High feed prices and lower domestic demand led to a decline in U.S. poultry industry profitability during much of 2006–12. Further, the global export market has become increasingly competitive, with Brazil becoming a more competitive global producer in the last decade and the European Union, Thailand, and China also expanding exports. In addition, the United States has faced challenges in exporting to two of its largest foreign export markets—Russia and China. U.S. exports to these foreign markets fell by 79 percent (by volume) from their 2008 peak to their low in 2011 because of restrictions imposed on imports of U.S. poultry meat.
Poultry production was valued at $30.2 billion in 2012.3 Chicken is the most commonly consumed meat in the United States and is widely consumed throughout the world. Turkey is the fourth-most commonly eaten meat in the United States, but is not widely consumed worldwide. Poultry meat is attractive to consumers because it is competitively priced compared with other meats, is considered healthier than red meats, and offers the convenience of reduced cooking and preparation time. Additionally, consumption of
1 Live poultry raised for meat and poultry meat are classified for tariff purposes under heading 0105; heading 0207; and headings 1602.20.20, 1602.31, 1602.32, and 1602.39 of the Harmonized Tariff Schedule of the United States (HTSUS or HTS). See appendix A table A.5.
2 There are two types of chicken—broilers (birds raised for meat purposes) and layers (birds raised to produce eggs)—and each type comes from different poultry breeds. Broilers can be either male or female. Only hens become layers, which are then processed into meat when they have completed their egg-producing years (that is, when they are “spent layers”).
3 USDA, NASS, Poultry Production and Value: 2012 Summary, April 2013, 7, 9. Broiler production accounted for 82 percent of the total value of production.
3
poultry meat is generally not subject to the same types of dietary rules that prohibit pork and beef consumption by members of certain religious groups.
Broiler meat is commonly processed and sold as fresh, chilled, or frozen in a variety of forms, including whole chickens, breast meat, chicken leg quarters, and wings. Turkey meat is also normally processed and sold fresh, chilled, or frozen, primarily as whole dressed birds. Poultry meat may also be further processed into a number of items, including ready-to-cook products such as microwaveable meals, deli meats, and sausages. Poultry meat products are widely sold through domestic retail and food service outlets.
U.S. Industry and the Global Market
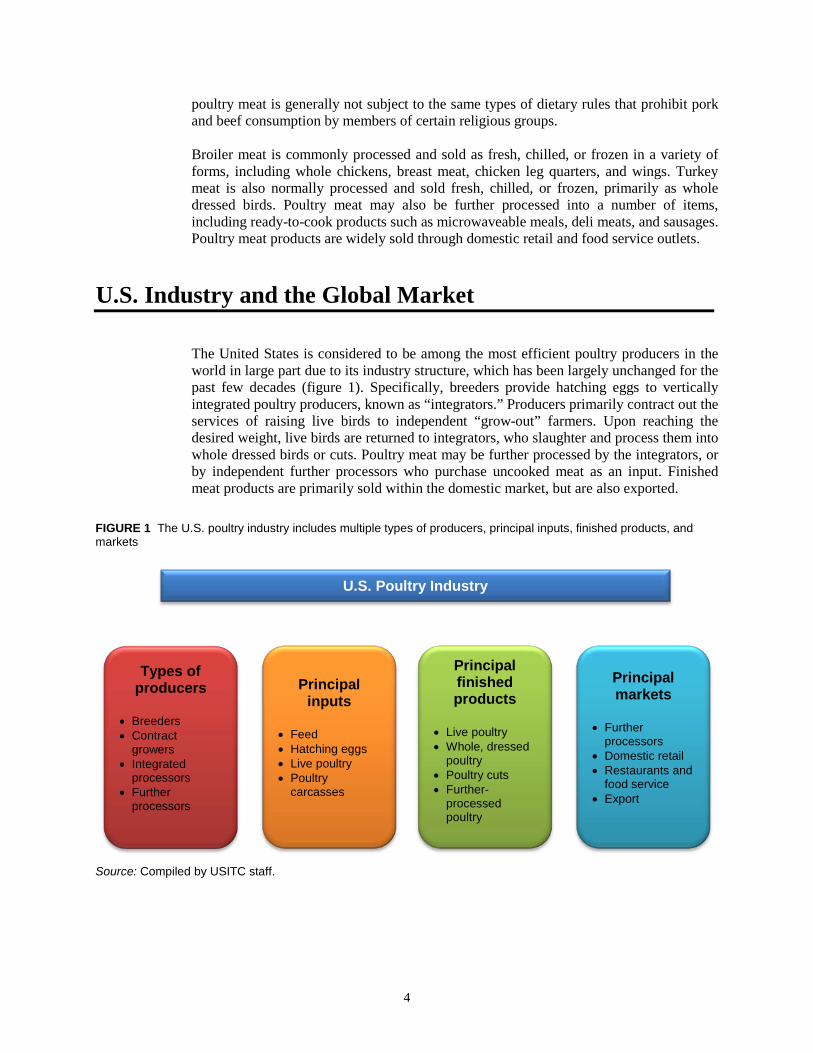
The United States is considered to be among the most efficient poultry producers in the world in large part due to its industry structure, which has been largely unchanged for the past few decades (figure 1). Specifically, breeders provide hatching eggs to vertically integrated poultry producers, known as “integrators.” Producers primarily contract out the services of raising live birds to independent “grow-out” farmers. Upon reaching the desired weight, live birds are returned to integrators, who slaughter and process them into whole dressed birds or cuts. Poultry meat may be further processed by the integrators, or by independent further processors who purchase uncooked meat as an input. Finished meat products are primarily sold within the domestic market, but are also exported.
Source: Compiled by USITC staff.
U.S. Poultry Industry
Principal inputs
• Feed • Hatching eggs • Live poultry • Poultry
carcasses
Types of producers
• Breeders • Contract
growers • Integrated
processors • Further
processors
Principal finished products
• Live poultry • Whole, dressed
poultry • Poultry cuts • Further-
processed poultry
Principal markets
• Further
processors • Domestic retail • Restaurants and
food service • Export
FIGURE 1 The U.S. poultry industry includes multiple types of producers, principal inputs, finished products, and markets
4
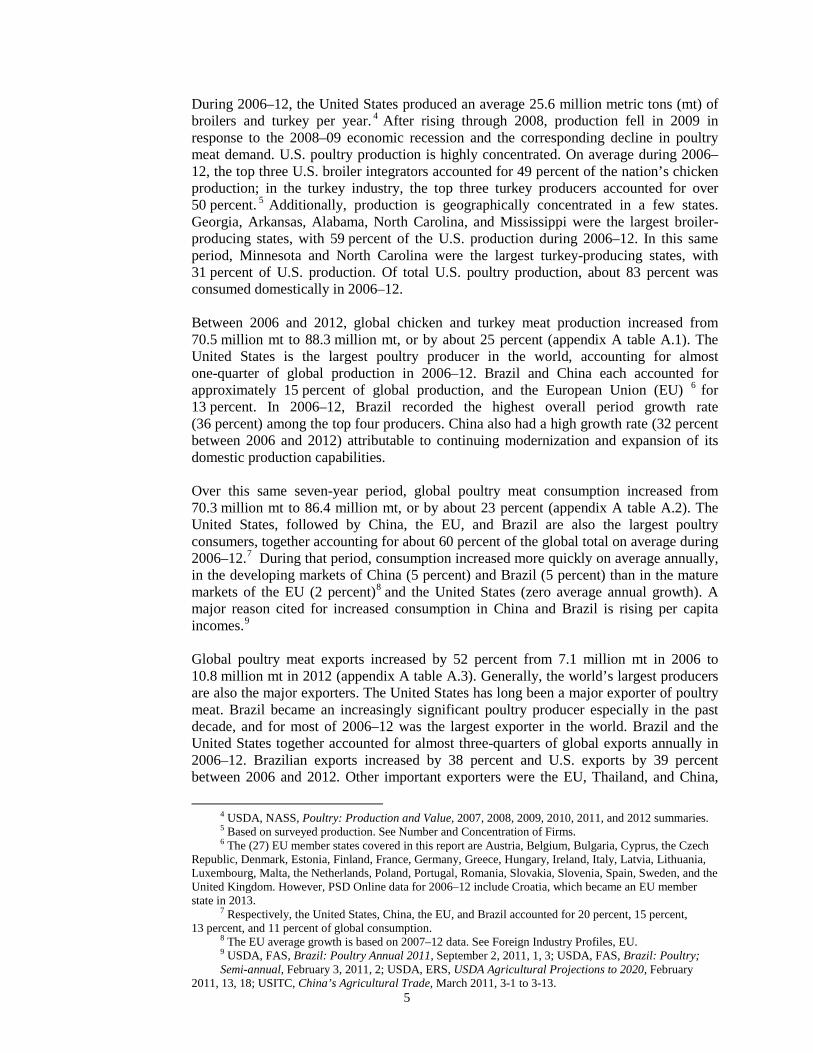
During 2006–12, the United States produced an average 25.6 million metric tons (mt) of broilers and turkey per year. 4 After rising through 2008, production fell in 2009 in response to the 2008–09 economic recession and the corresponding decline in poultry meat demand. U.S. poultry production is highly concentrated. On average during 2006–12, the top three U.S. broiler integrators accounted for 49 percent of the nation’s chicken production; in the turkey industry, the top three turkey producers accounted for over 50 percent. 5 Additionally, production is geographically concentrated in a few states. Georgia, Arkansas, Alabama, North Carolina, and Mississippi were the largest broiler-producing states, with 59 percent of the U.S. production during 2006–12. In this same period, Minnesota and North Carolina were the largest turkey-producing states, with 31 percent of U.S. production. Of total U.S. poultry production, about 83 percent was consumed domestically in 2006–12.
Between 2006 and 2012, global chicken and turkey meat production increased from 70.5 million mt to 88.3 million mt, or by about 25 percent (appendix A table A.1). The United States is the largest poultry producer in the world, accounting for almost one-quarter of global production in 2006–12. Brazil and China each accounted for approximately 15 percent of global production, and the European Union (EU) 6 for 13 percent. In 2006–12, Brazil recorded the highest overall period growth rate (36 percent) among the top four producers. China also had a high growth rate (32 percent between 2006 and 2012) attributable to continuing modernization and expansion of its domestic production capabilities.
Over this same seven-year period, global poultry meat consumption increased from 70.3 million mt to 86.4 million mt, or by about 23 percent (appendix A table A.2). The United States, followed by China, the EU, and Brazil are also the largest poultry consumers, together accounting for about 60 percent of the global total on average during 2006–12.7 During that period, consumption increased more quickly on average annually, in the developing markets of China (5 percent) and Brazil (5 percent) than in the mature markets of the EU (2 percent)8 and the United States (zero average annual growth). A major reason cited for increased consumption in China and Brazil is rising per capita incomes.9
Global poultry meat exports increased by 52 percent from 7.1 million mt in 2006 to 10.8 million mt in 2012 (appendix A table A.3). Generally, the world’s largest producers are also the major exporters. The United States has long been a major exporter of poultry meat. Brazil became an increasingly significant poultry producer especially in the past decade, and for most of 2006–12 was the largest exporter in the world. Brazil and the United States together accounted for almost three-quarters of global exports annually in 2006–12. Brazilian exports increased by 38 percent and U.S. exports by 39 percent between 2006 and 2012. Other important exporters were the EU, Thailand, and China,
4 USDA, NASS, Poultry: Production and Value, 2007, 2008, 2009, 2010, 2011, and 2012 summaries. 5 Based on surveyed production. See Number and Concentration of Firms. 6 The (27) EU member states covered in this report are Austria, Belgium, Bulgaria, Cyprus, the Czech
Republic, Denmark, Estonia, Finland, France, Germany, Greece, Hungary, Ireland, Italy, Latvia, Lithuania, Luxembourg, Malta, the Netherlands, Poland, Portugal, Romania, Slovakia, Slovenia, Spain, Sweden, and the United Kingdom. However, PSD Online data for 2006–12 include Croatia, which became an EU member state in 2013.
7 Respectively, the United States, China, the EU, and Brazil accounted for 20 percent, 15 percent, 13 percent, and 11 percent of global consumption.
8 The EU average growth is based on 2007–12 data. See Foreign Industry Profiles, EU. 9 USDA, FAS, Brazil: Poultry Annual 2011, September 2, 2011, 1, 3; USDA, FAS, Brazil: Poultry; Semi-annual, February 3, 2011, 2; USDA, ERS, USDA Agricultural Projections to 2020, February
2011, 13, 18; USITC, China’s Agricultural Trade, March 2011, 3-1 to 3-13. 5
which together accounted for 19 percent of global poultry exports during 2006–12. In that period, Thailand recorded the highest export growth rate (106 percent) of any of the top five exporters, exporting mostly cooked poultry product. However, Thailand is the only major exporter that is not among the leading global producing countries. Global imports increased by 32 percent, from 6.8 million mt in 2006 to 9.0 million mt in 2012.10 Imports have been less highly concentrated than exports; in fact, they became less concentrated among top importers during the period. The top five importers––the EU, Japan, Mexico, Saudi Arabia, and Russia––accounted for 55 percent of worldwide imports in 2006, but only 43 percent in 2012.11 This decline was largely because of fewer imports by Russia, which reduced its imports by 55 percent between 2006 and 2012 in an effort to become more self-sufficient in poultry meat production.
Industry Issues
The U.S. poultry industry faced several issues during 2006–12 that affected its ability to remain competitive in the global market. Among the most prominent ones were rising feed costs, which lowered industry profitability, and foreign trade barriers that reduced U.S. exports, especially to Russia and China.
Feed for live birds is the costliest input into poultry meat production, accounting for 65–75 percent of production costs. 12 The two major components are corn and soybeans, whose prices reached historically high levels during crop years (CY) 2005/06–2010/11 and continued to rise in CY 2011/12.13 Prices were impacted by several long- and short-term factors affecting both supply and demand. Globally available supplies fell primarily because of drought and export controls, while at the same time global demand rose in response to growing populations, rising personal incomes, and expanding biofuel production.14 As a result of high feed costs and reduced domestic customer demand, the U.S. poultry industry was less profitable during much of 2006–12. In response, integrators tried to increase efficiency by closing underperforming facilities and reducing production to help increase prices. However, some poultry companies also went out of business during this period.15
Although the United States remains highly competitive on global markets, U.S. poultry meat exports to several key foreign markets were disrupted, particularly by trade measures enacted by Russia and China––especially in 2010. China imposed antidumping
10 USDA, FAS, PSD Online (accessed August 20, 2013); (Appendix A table A.4). 11 The top five importers for most, although not all, of 2006–12 were EU, Japan, Mexico, Saudi Arabia,
and Russia. 12 For further information, see the Factors Affecting Production section below. 13 USDA, ERS, Feed Grains Yearbook Tables, table 19 (accessed August 28, 2012); USDA, ERS, Oil
Crops Yearbook, table 3 (accessed August 28, 2012). 14 Trostle et al., Why Have Food Commodity Prices Risen Again? June 2011; USITC, Shifts in U.S.
Merchandise Trade 2008, July 2009, AG-7 and AG-13; Trostle, Global Agricultural Supply and Demand, July 2008, 16 and 20–21; ADB, Soaring Food Prices, May 2008; USDA, ERS, Oil Crops Outlook, June 10, 2011, 1–3; Thornton, “Grain Prices and Poultry Demand,” April 2013, 16–24.
15 O’Keefe, “Coping With High Feed Prices,” June 2008, 18–20; O’Keefe, “No Growth in RTC Production in 2008,” February 2009, 18–25; O’Keefe, “Can Cutbacks Lead to Quick Turnaround?” February 2009, 44–46; USDA, ERS, Livestock, Dairy, and Poultry Outlook, March 28, 2009, 2; USDA, ERS, Livestock, Dairy, and Poultry Outlook, December 17, 2009, 13; Thornton, “Tyson Foods Focuses on Chicken Pricing,” August 11, 2011; Thornton, “Grain Prices and Poultry Demand,” April 2013, 16–17.
6
and countervailing duties (AD/CVD or AD/CV duties) on certain U.S. poultry products (in a manner that the World Trade Organization (WTO) determined, in August 2013,violated numerous obligations under the WTO Antidumping Agreement and Subsidies Agreement).16 Russia banned imports of poultry treated with chlorinated rinse, a common pathogen reduction treatment (PRT) in the United States.17 U.S. poultry meat exports to China and Russia fell from their peak of 1.6 million mt in 2008 to a low of 0.35 million mt in 2011, a decline of about 79 percent. While China and Russia were the two largest buyers of U.S. poultry meat between 2006 and 2009, on average receiving about 34 percent of exports yearly by value, only about 11 percent of U.S. poultry meat exports went to Russia and China in 2011–12. 18
U.S. Industry
Industry Structure
Number and Concentration of Firms
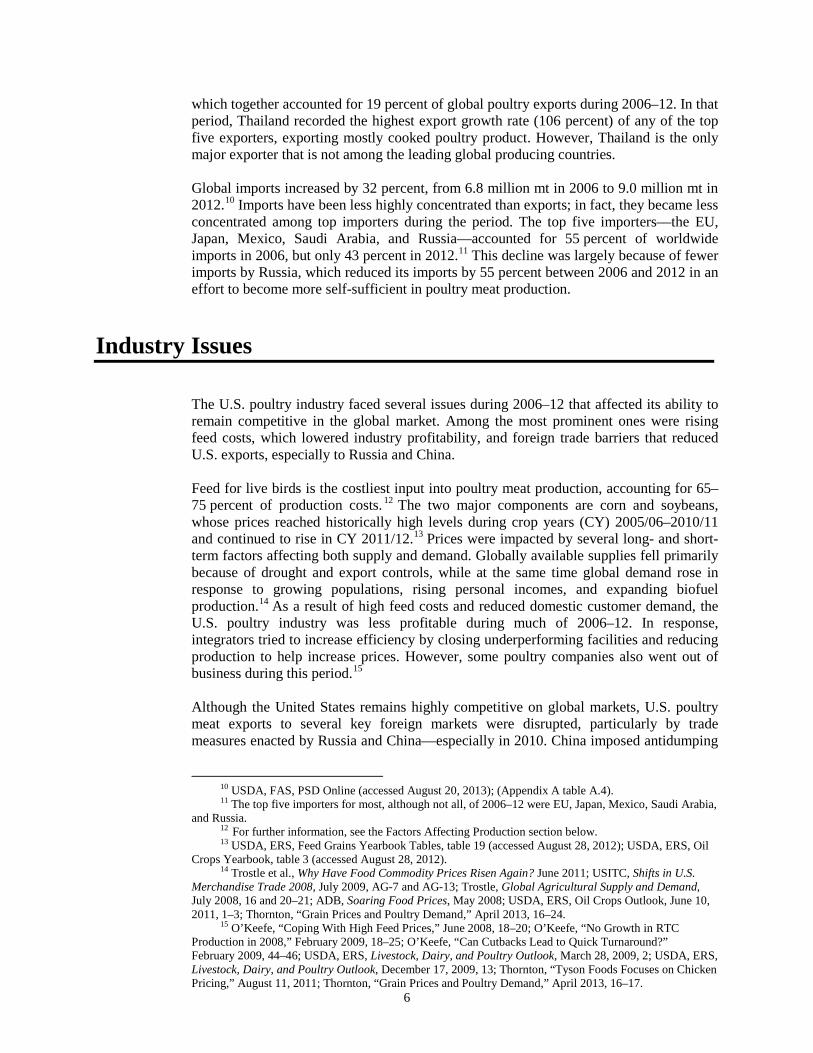
A key factor that enhanced the global competitiveness of the U.S. broiler and turkey industries is consolidation over time, leading to fewer, larger, and more efficient production and processing facilities. Overall, the number of poultry farms that reported sales of live birds declined slightly between 2002 and 2007 driven by fewer broiler and turkey farms (table 1).19 The largest decline (15 percent) was in broiler and other meat-type chicken farms.20 This reflects the long-term trend towards fewer and larger grow-out farms, which raise increased numbers of birds to capture economies of scale. However, farms producing chickens for egg production (“layers and pullets”) and other poultry (ducks, geese, etc.) grew 9 percent and 11 percent, respectively.
16 China applied antidumping duties rates ranging between 50.3 to 105.4 percent ad valorem and countervailing duties rates ranging from 5.4 and 30.3 percent ad valorem on U.S. poultry. USDA, FAS, China: Poultry and Products; Annual, 2010, September 30, 2010, 4. USTR, “United States Wins Trade Enforcement Case for American Farmers, Proves Export-Blocking Chinese Duties Unjustified Under WTO Rules,” Press release Aug. 2013.
17 Johnson and Becker, U.S.-Russia Meat and Poultry Trade Issues, April 2, 2010, 9; Bottemiller, “Russia Agrees to Lift Ban,” June 25, 2010; USDA, FAS, Russian Federation: Russia Resumes Imports, September 21, 2010. For further information see the U.S. Exports sections on China and Russia, below.
18 USITC, DataWeb (accessed August 26, 2013). 19 Most recent data available. 20 Other meat-type chickens include spent layers––birds which are bred to produce eggs, and which
when no longer able to do so, are ready for slaughter.
TABLE 1 U.S. poultry farms: Number reporting sales of live poultry, by type, 2002 and 2007 Type 2002 2007 Percent change Layers and pullets 26,814 29,140 9 Broiler and other meat-type chickens 32,006 27,091 (15) Turkeys 8,436 8,284 (2) Ducks, geese, and other poultry 19,732 21,857 11 Total 86,988 86,372 (1) Source: USDA, 2007 Census of Agriculture, February 4, 2009, table 27. Note: Parentheses indicate negative numbers.
7
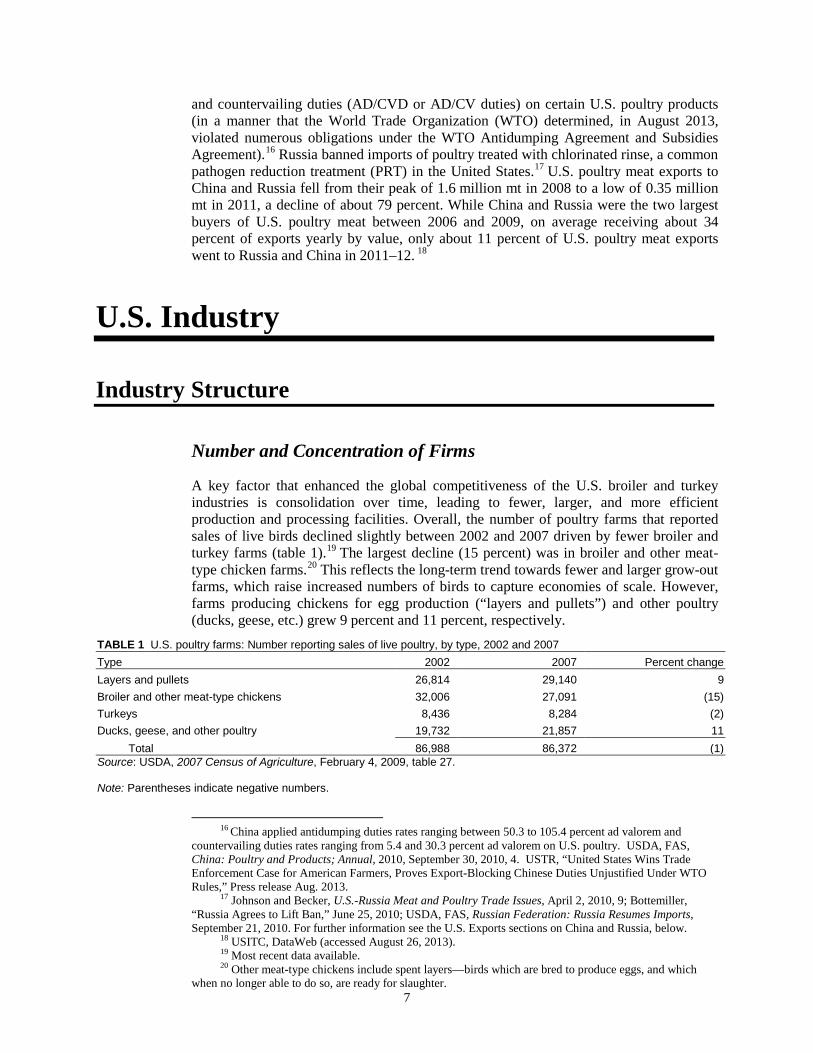
The U.S. poultry industry went through significant and rapid concentration after World War II. However, in the past few decades, the pace of concentration has slowed considerably, and during 2006–12, the industry actually became slightly less concentrated. More specifically, between 2006 and 2012, the share of production of the top three U.S. broiler companies fell 10 percent (although it hit its low in 2010), while the share of the top 10 companies remained the same at about 77 percent (table 2). The largest drop in industry concentration occurred between 2008 and 2009, primarily because of a 12 percent decline in production by Pilgrim’s Pride Corp., coupled by more modest production declines at other large firms such as Perdue Farms Inc. (2 percent) and Tyson’s Foods Inc. (Tyson’s) (1 percent).21 The declines in production at these firms reportedly are attributable to the 2008–09 economic recession, which weakened demand. Nonetheless, during 2006–10, there was some consolidation in the poultry industry, including the Pilgrim’s Pride purchase of Gold Kist Inc.; 22 Pilgrim’s Pride’s sale of its turkey operations to other turkey producers;23 and the Simmons Food Inc. purchase of the broiler operations of Peterson Farms Inc. 24 In 2011, the concentration of the broiler industry production among the largest firms began increasing, due in part to higher year-on-year production for all but two of the ten-largest firms, and continued rising in 2012.25 The top three turkey integrators’ share of U.S. production fell slightly (5 percent) during 2006–12 (table 2). However, the concentration of the top ten firms rose slightly (3 percent).
TABLE 2 Poultry: Share of U.S. production accounted for by the top 3, 5, and 10 firms, 2006–12 (percent) Sectors 2006 2007 2008 2009 2010 2011 2012 Broilers:a Top 3 firms 53.1 50.9 49.3 46.5 45.7 46.6 47.6 Top 5 firms 62.6 60.9 60.5 57.5 57.0 58.7 60.7 Top 10 firms 76.6 75.8 75.7 74.8 74.5 76.7 78.8 Turkeys:b Top 3 firms 52.0 50.7 50.5 53.1 51.2 50.2 49.5 Top 5 firms 58.8 58.1 58.1 60.9 61.0 59.7 59.5 Top 10 firms 75.2 75.0 74.7 78.9 78.9 77.6 77.5 Source: Thornton, “Broiler Companies; Top 10 Pulls Away from Pack,” February 2007, 21; Thornton, “Cutbacks, Expansions,” February 2008, 26; O’Keefe, “No Growth in RTC production in 2008,” February 2009, table 1; Thornton, “Shakeup at the Top,” February 2010, 16; Thornton, “U.S. Chicken Producers,” February 2011, 12; Thornton, “Tough Economics ” March 2012, 13; Thornton, “Mid-Size US Turkey Producers,” March 2012; Thornton, “US Chicken Companies Enter 2013 with Production Increases?,” March 2013, 13; Thornton, “Turkey Companies Plot Production Growth for 2013,” March 2013, 44. aBased on ready-to-cook weight from surveys of 35 to 42 firms, depending on the year. bBased on live weight pounds of processed turkeys from surveys of 23 to 26 firms, depending on the year.
Employment, Earnings, and Productivity
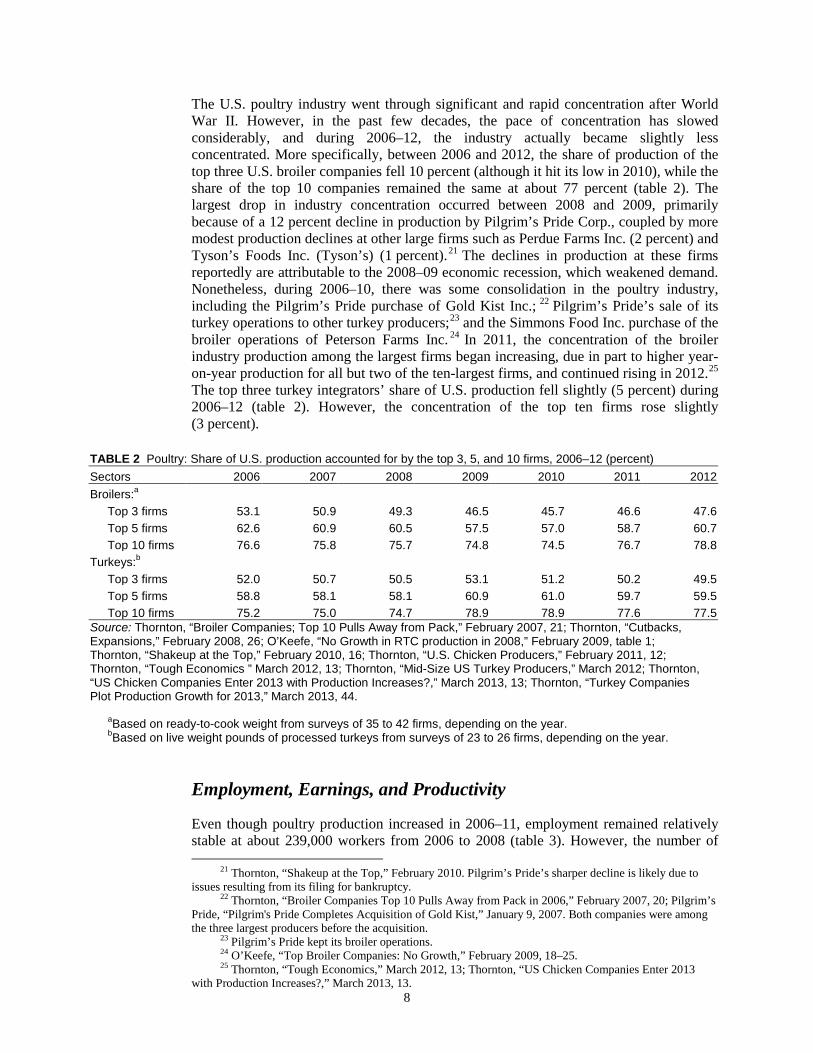
Even though poultry production increased in 2006–11, employment remained relatively stable at about 239,000 workers from 2006 to 2008 (table 3). However, the number of
21 Thornton, “Shakeup at the Top,” February 2010. Pilgrim’s Pride’s sharper decline is likely due to issues resulting from its filing for bankruptcy.
22 Thornton, “Broiler Companies Top 10 Pulls Away from Pack in 2006,” February 2007, 20; Pilgrim’s Pride, “Pilgrim's Pride Completes Acquisition of Gold Kist,” January 9, 2007. Both companies were among the three largest producers before the acquisition.
23 Pilgrim’s Pride kept its broiler operations. 24 O’Keefe, “Top Broiler Companies: No Growth,” February 2009, 18–25. 25 Thornton, “Tough Economics,” March 2012, 13; Thornton, “US Chicken Companies Enter 2013
with Production Increases?,” March 2013, 13. 8
TABLE 3 U.S. poultry-processing industry: Employment and earnings, 2006–11
Item 2006 2007 2008 2009 2010 2011 Thousand workers
Employment: Production workers 212.7 212.5 211.4 204.8 201.5 200.5 Other workers 26.9 26.4 27.4 26.1 25.1 24.2 Total workers 239.6 238.9 238.8 230.9 226.6 224.7 Dollars per period
Average hourly earnings 10.80 10.91 11.37 11.31 11.29 11.64 Average weekly earnings 415.55 433.23 446.88 432.43 442.62 455.77 Source: AMI, Meat and Poultry Facts 2012, April 2012, 22.
employees fell to 230,900 in 2009 and 224,700 in 2011. Poultry plants generally hire two categories of workers: (1) production-line workers, who perform relatively low-skill tasks, such as cutting and packaging, and are paid relatively low wages, and (2) highly skilled staff who serve in management, technical, and scientific capacities. Production-line workers accounted for about 200,500, or 89 percent, of all poultry workers in 2011. Most of these employees work in processing chicken. The turkey industry directly employs between 20,000 and 25,000 workers, excluding contract growers.26
The poultry industry pays lower wages on average than other food processing or manufacturing industries. This is largely because most poultry-processing plants are located in more rural, less unionized parts of the country, such as the southeast.27 In 2011, the average hourly wage for poultry processing was $11.64, compared to $14.70 for other meat processing and $14.63 for all food processing.28 On average, the weekly earnings of poultry-processing workers were $456 in 2011, much lower than the $629 earned by other meat processing workers and the $785 earned by manufacturing workers.
From the mid-1940s until the early-1990s, productivity in the poultry industry grew rapidly, as measured by factors such as efficiency of feed conversion (i.e., the number of pounds of feed to produce a pound of meat), days of feeding to reach market weight (market age), average market weight, and mortality rate (table 4). A number of advances contributed to these gains, including better veterinary medicine to control and eradicate diseases, enhanced genetics and breeding, improved feed compositions, and better housing systems at grow-out facilities. 29 Further, consolidation during the 1950s and 1960s facilitated the industry’s establishment of the current integrator system, including the basic automated slaughtering process,30 which enabled the industry to achieve greater economies of scale. Over the past decade, improvements in most productivity measures slowed as technical advances yielded diminishing marginal returns. For example, the chicken feed conversion ratio improved on average by 15 percent per decade during 1940–80, and by 2 percent per decade between 1980 and 2010.
26 National Turkey Federation, “Turkey Industry Structure,” accessed August 13, 2013. http://www.eatturkey.com/consumer/history.
27 DOL, Union Members Summary, January 21, 2011. 28 AMI, Meat and Poultry Facts 2012, April 2012, 26. 29 See, e.g., Knoeber, “A Real Game of Chicken,” autumn 1989; Havenstein, Ferket, and Qureshi,
“Growth, Livability, and Feed Conversion,” October 1, 2003. 30 Ollinger, MacDonald, and Madison, Structural Change in U.S. Chicken and Turkey Slaughter,
September 2000, 1, 7. 9
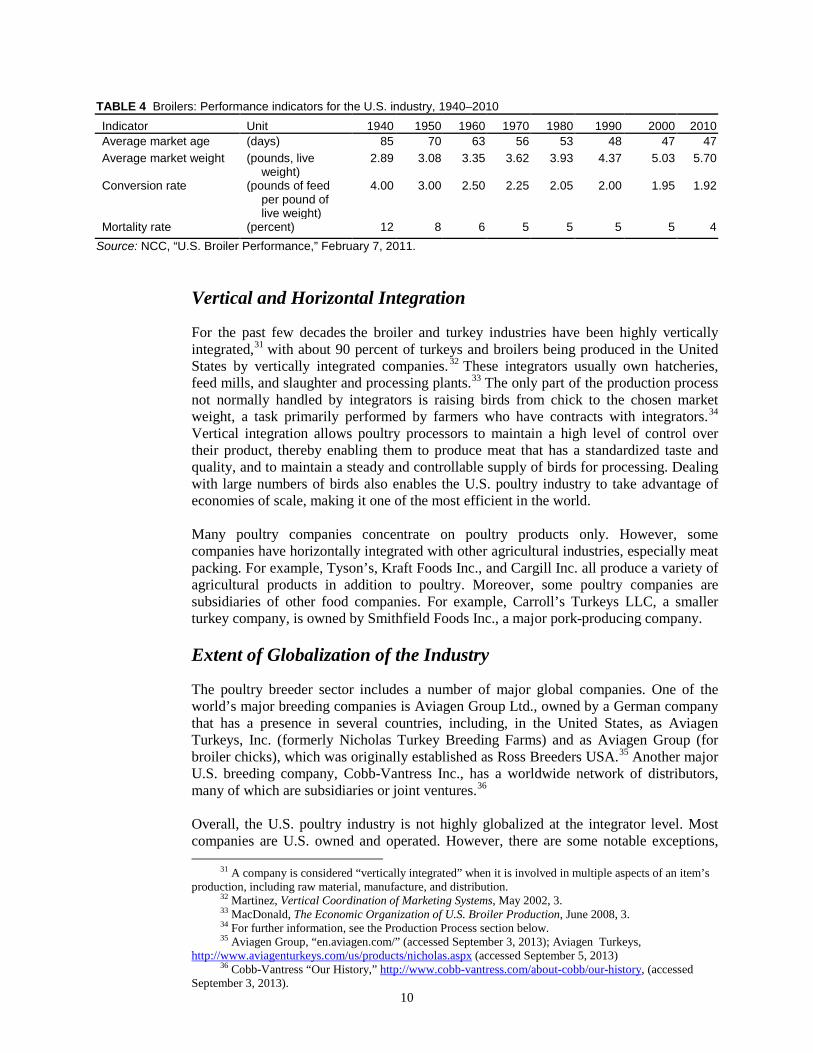
TABLE 4 Broilers: Performance indicators for the U.S. industry, 1940–2010 Indicator Unit 1940 1950 1960 1970 1980 1990 2000 2010 Average market age (days) 85 70 63 56 53 48 47 47 Average market weight (pounds, live
weight) 2.89 3.08 3.35 3.62 3.93 4.37 5.03 5.70
Conversion rate (pounds of feed per pound of live weight)
4.00 3.00 2.50 2.25 2.05 2.00 1.95 1.92
Mortality rate (percent) 12 8 6 5 5 5 5 4 Source: NCC, “U.S. Broiler Performance,” February 7, 2011.
Vertical and Horizontal Integration
For the past few decades the broiler and turkey industries have been highly vertically integrated,31 with about 90 percent of turkeys and broilers being produced in the United States by vertically integrated companies.32 These integrators usually own hatcheries, feed mills, and slaughter and processing plants.33 The only part of the production process not normally handled by integrators is raising birds from chick to the chosen market weight, a task primarily performed by farmers who have contracts with integrators.34 Vertical integration allows poultry processors to maintain a high level of control over their product, thereby enabling them to produce meat that has a standardized taste and quality, and to maintain a steady and controllable supply of birds for processing. Dealing with large numbers of birds also enables the U.S. poultry industry to take advantage of economies of scale, making it one of the most efficient in the world.
Many poultry companies concentrate on poultry products only. However, some companies have horizontally integrated with other agricultural industries, especially meat packing. For example, Tyson’s, Kraft Foods Inc., and Cargill Inc. all produce a variety of agricultural products in addition to poultry. Moreover, some poultry companies are subsidiaries of other food companies. For example, Carroll’s Turkeys LLC, a smaller turkey company, is owned by Smithfield Foods Inc., a major pork-producing company.
Extent of Globalization of the Industry
The poultry breeder sector includes a number of major global companies. One of the world’s major breeding companies is Aviagen Group Ltd., owned by a German company that has a presence in several countries, including, in the United States, as Aviagen Turkeys, Inc. (formerly Nicholas Turkey Breeding Farms) and as Aviagen Group (for broiler chicks), which was originally established as Ross Breeders USA.35 Another major U.S. breeding company, Cobb-Vantress Inc., has a worldwide network of distributors, many of which are subsidiaries or joint ventures.36
Overall, the U.S. poultry industry is not highly globalized at the integrator level. Most companies are U.S. owned and operated. However, there are some notable exceptions,
31 A company is considered “vertically integrated” when it is involved in multiple aspects of an item’s production, including raw material, manufacture, and distribution.
32 Martinez, Vertical Coordination of Marketing Systems, May 2002, 3. 33 MacDonald, The Economic Organization of U.S. Broiler Production, June 2008, 3. 34 For further information, see the Production Process section below. 35 Aviagen Group, “en.aviagen.com/” (accessed September 3, 2013); Aviagen Turkeys,
http://www.aviagenturkeys.com/us/products/nicholas.aspx (accessed September 5, 2013) 36 Cobb-Vantress “Our History,” http://www.cobb-vantress.com/about-cobb/our-history, (accessed
September 3, 2013). 10
especially among the largest U.S. broiler producers. For instance, Tyson’s, one of the largest broiler integrators in the United States, owns companies—either directly or through joint ventures—in many other countries, including Brazil, China, India, and Mexico. A majority share of U.S. broiler company Pilgrim’s Pride was purchased by JBS S.A., a Brazilian meat company, in 2009.37 Cargill VAM, a U.S. company that grows and produces turkey, is a subsidiary of privately owned Cargill Inc., a large agricultural company with poultry facilities in the Brazil, Canada, France, Honduras, Ireland, the Netherlands, Nicaragua, Thailand, and the United Kingdom. 38 Some nonagricultural businesses have also become involved in overseas poultry markets. For example, Goldman Sachs—which is primarily a financial services firm—invested in 10 Chinese poultry farms in 2008.39
Production Process and Market Channels
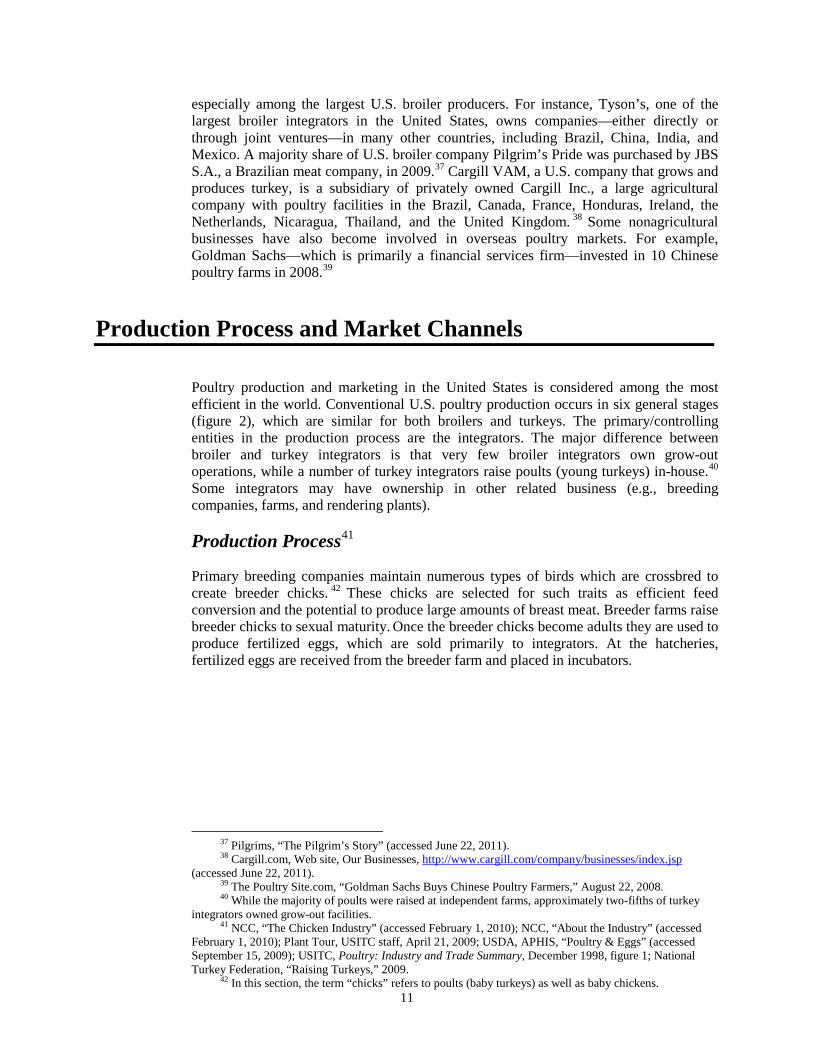
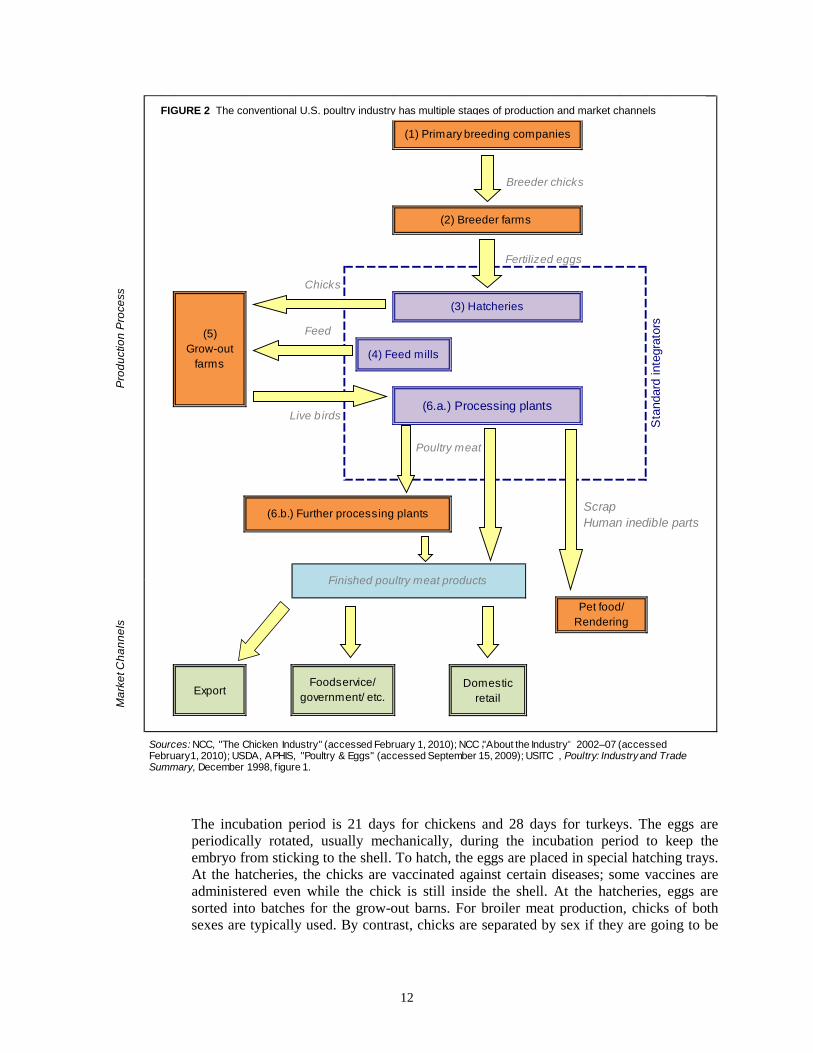
Poultry production and marketing in the United States is considered among the most efficient in the world. Conventional U.S. poultry production occurs in six general stages (figure 2), which are similar for both broilers and turkeys. The primary/controlling entities in the production process are the integrators. The major difference between broiler and turkey integrators is that very few broiler integrators own grow-out operations, while a number of turkey integrators raise poults (young turkeys) in-house.40 Some integrators may have ownership in other related business (e.g., breeding companies, farms, and rendering plants).
Production Process41
Primary breeding companies maintain numerous types of birds which are crossbred to create breeder chicks. 42 These chicks are selected for such traits as efficient feed conversion and the potential to produce large amounts of breast meat. Breeder farms raise breeder chicks to sexual maturity. Once the breeder chicks become adults they are used to produce fertilized eggs, which are sold primarily to integrators. At the hatcheries, fertilized eggs are received from the breeder farm and placed in incubators.
37 Pilgrims, “The Pilgrim’s Story” (accessed June 22, 2011). 38 Cargill.com, Web site, Our Businesses, http://www.cargill.com/company/businesses/index.jsp
(accessed June 22, 2011). 39 The Poultry Site.com, “Goldman Sachs Buys Chinese Poultry Farmers,” August 22, 2008. 40 While the majority of poults were raised at independent farms, approximately two-fifths of turkey
integrators owned grow-out facilities. 41 NCC, “The Chicken Industry” (accessed February 1, 2010); NCC, “About the Industry” (accessed
February 1, 2010); Plant Tour, USITC staff, April 21, 2009; USDA, APHIS, “Poultry & Eggs” (accessed September 15, 2009); USITC, Poultry: Industry and Trade Summary, December 1998, figure 1; National Turkey Federation, “Raising Turkeys,” 2009.
42 In this section, the term “chicks” refers to poults (baby turkeys) as well as baby chickens. 11
The incubation period is 21 days for chickens and 28 days for turkeys. The eggs are periodically rotated, usually mechanically, during the incubation period to keep the embryo from sticking to the shell. To hatch, the eggs are placed in special hatching trays. At the hatcheries, the chicks are vaccinated against certain diseases; some vaccines are administered even while the chick is still inside the shell. At the hatcheries, eggs are sorted into batches for the grow-out barns. For broiler meat production, chicks of both sexes are typically used. By contrast, chicks are separated by sex if they are going to be
Breeder chicks
Fertilized eggs
Chicks
Feed
Live b irds
Poultry meat
ScrapHuman inedible parts
ExportDomestic
retail
Pro
duct
ion
Pro
cess
Sta
ndar
d in
tegr
ator
s
(5) Grow-out
farms
(1) Primary breeding companies
(2) Breeder farms
(3) Hatcheries
Foodservice/ government/ etc.
(6.b.) Further processing plants
(4) Feed mills
(6.a.) Processing plants
Pet food/ Rendering
Finished poultry meat products
Mar
ket C
hann
els
FIGURE 2 The convinetianal U.S. poultry industry has multiple stages of production and market channels
Sources: NCC, "The Chicken Industry" (accessed February 1, 2010); NCC "About the Industry": 2002–07 (accessed February1, 2010); USDA, APHIS, "Poultry & Eggs" (accessed September 15, 2009); USITC , Poultry: Industry and Trade Summary, December 1998, f igure 1.
FIGURE 2 The conventional U.S. poultry industry has multiple stages of production and market channels
,
12
grown into specialized products such as Cornish hens (females only) or roasters (males only).43
Feed is a very important part of poultry production process, for it influences the speed and efficiency chicks reach market weight. Feed mills are usually owned by integrators in order to control the feed given to their birds. Feed is developed by poultry nutritionists and its exact composition changes at each stage of development in the grow-out period. Poultry feed primarily consists of corn and soybean meal along with added vitamins and minerals.44
At grow-out farms, birds are raised from chicks to the desired market weight. A grow-out house (a type of specialized barn) is generally owned by an independent farmer who has a contract with an integrator. About 99 percent of broilers are raised by contractors.45 A large number of turkeys are also raised by contract farmers, although a substantial minority is still raised in-house by the integrator. Currently, about 80 percent of turkeys are raised under contract, a marked increase from the approximately 56 percent raised under contract in 2002. 46 Most farmers and integrators have long-term relationships, largely because the grow-out houses are expensive to build and difficult to convert to other uses, and many years of use are required to recoup the initial investment. Contract farmers do not normally own the birds. Rather, birds are almost always owned by the integrator, who pays the contractor to raise or “grow them out.” As of 2006, there were 70,000 broiler houses in the United States. Most contract farmers (70 percent) own one to four houses. The size of these houses has increased over time, from an average of 12,750 square feet in the 1960s to an average of about 20,000 square feet in the mid-2000s.47
While contract terms may vary, integrators normally provide veterinary services and feed to the farmer. Farmers provide water, litter, electricity, and labor.48 Farmers are usually paid a set amount, with bonuses for good performance (compared to other contractors). Once the birds reach the intended market weight they are collected and transported to the processing plant by the integrator.
At the processing plants, the birds are slaughtered and have their feathers, heads, and feet removed—chicken feet are often cut into “paws” and frequently collected for export sales.49 The carcasses are inspected in accordance with state or federal regulations.50 Sanitary measures, such as a chlorine rinse, are used to reduce pathogens in the raw meat.
Once they pass inspection, carcasses are selected to be sold either whole or cut into pieces. Whole birds are sent to be packaged, while the other carcasses go through various processing lines where they are cut up. This process may also include mechanically deboning parts of the carcass.51 Cuts include breasts, wings, thighs, legs, and leg quarters.
43 A chick’s sex is determined by examining its wing feathers since female and male chicks have different length wing feathers.
44 By weight, broiler feed is about 70 percent corn and 25 percent soy. Industry official, telephone interview by USITC staff, June 27, 2011.
45 MacDonald, The Economic Organization of U.S. Broiler Production, June 2008, 7. 46 Industry official, telephone interview with USITC staff, July 5, 2011; Martinez, Vertical
Coordination of Marketing Systems, May 2002, 3. 47 MacDonald, The Economic Organization of U.S. Broiler Production, June 2008, 11. 48 At integrator-owned farms, all facilities and inputs are owned/purchased by the company. 49 Chicken feet and paws are very similar products, differing only in the amount of leg that is attached
to the foot. Chicken paws and feet are popular in China and Hong Kong. 50 For further information, see the Factors Affecting Production section below. 51 Mechanically deboned poultry meat can be used in items like sausages.
13
After being cut up, the meat may be packaged for sale. Some integrators only process birds to this stage. In the case of broilers, just over one-half of the meat is sold either whole or cut up, with the remainder sold for further processing.52 About 25 percent of turkeys are sold whole, while the rest is sold cut up or further processed.53
Further processing plants undertake several activities, including cooking, breading, marinating, and preparing meat into sausages or nuggets, as well as incorporating poultry meat into products such as microwaveable meals and pot pies. Ground turkey and cooked turkey breast for deli meat are also very popular items with U.S. consumers.54 In some cases, integrators own further processing facilities, either integrated with their slaughter plants or as separate facilities. However, poultry meat (either whole or cut) is also commonly sold to independent further processing facilities.
Market Channels
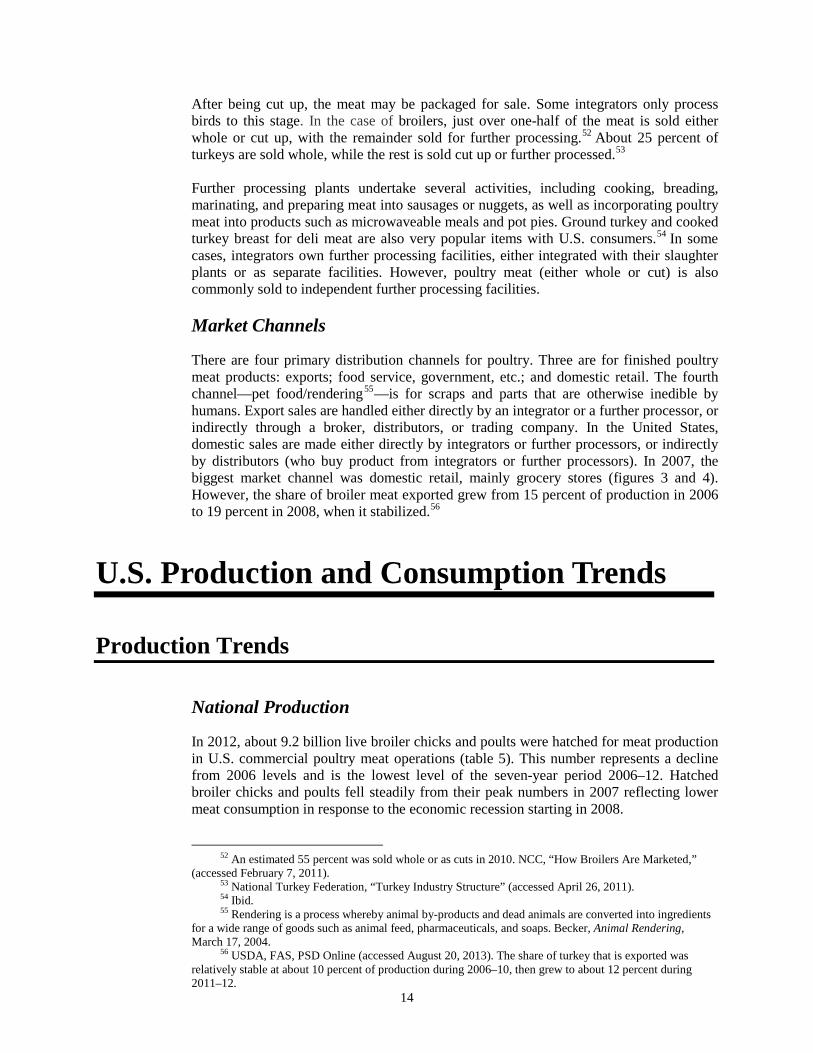
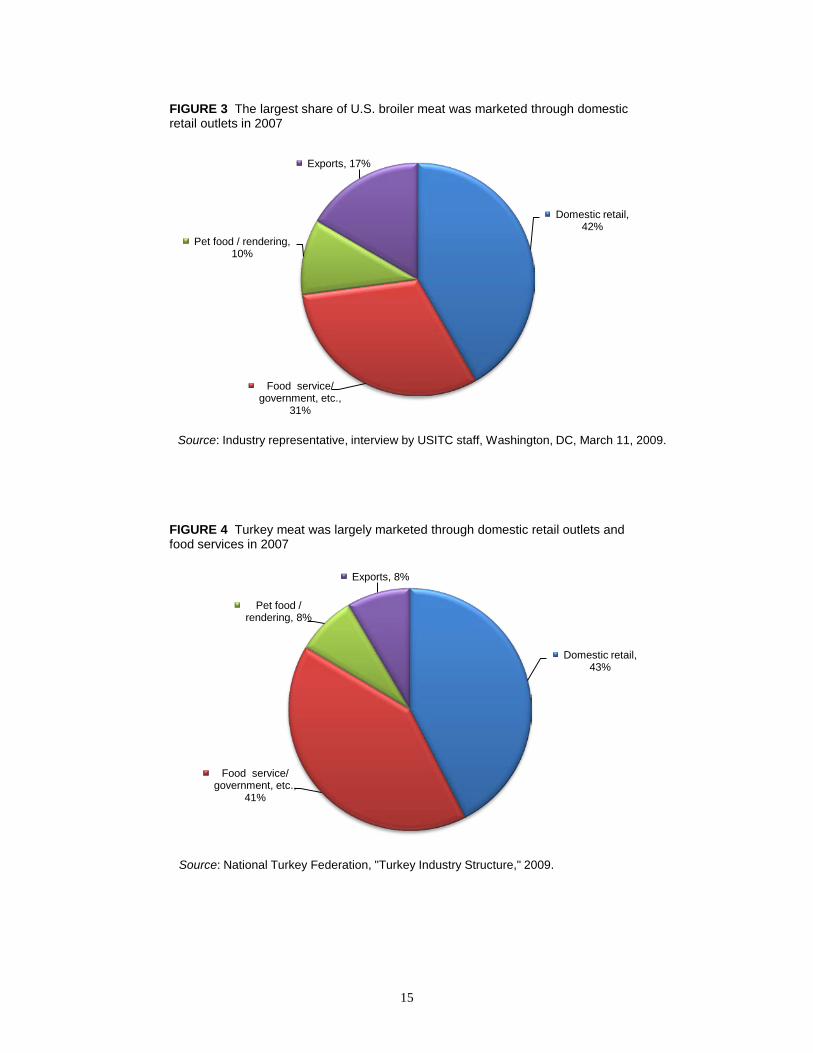
There are four primary distribution channels for poultry. Three are for finished poultry meat products: exports; food service, government, etc.; and domestic retail. The fourth channel—pet food/rendering55—is for scraps and parts that are otherwise inedible by humans. Export sales are handled either directly by an integrator or a further processor, or indirectly through a broker, distributors, or trading company. In the United States, domestic sales are made either directly by integrators or further processors, or indirectly by distributors (who buy product from integrators or further processors). In 2007, the biggest market channel was domestic retail, mainly grocery stores (figures 3 and 4). However, the share of broiler meat exported grew from 15 percent of production in 2006 to 19 percent in 2008, when it stabilized.56
U.S. Production and Consumption Trends
Production Trends
National Production
In 2012, about 9.2 billion live broiler chicks and poults were hatched for meat production in U.S. commercial poultry meat operations (table 5). This number represents a decline from 2006 levels and is the lowest level of the seven-year period 2006–12. Hatched broiler chicks and poults fell steadily from their peak numbers in 2007 reflecting lower meat consumption in response to the economic recession starting in 2008.
52 An estimated 55 percent was sold whole or as cuts in 2010. NCC, “How Broilers Are Marketed,” (accessed February 7, 2011).
53 National Turkey Federation, “Turkey Industry Structure” (accessed April 26, 2011). 54 Ibid. 55 Rendering is a process whereby animal by-products and dead animals are converted into ingredients
for a wide range of goods such as animal feed, pharmaceuticals, and soaps. Becker, Animal Rendering, March 17, 2004.
56 USDA, FAS, PSD Online (accessed August 20, 2013). The share of turkey that is exported was relatively stable at about 10 percent of production during 2006–10, then grew to about 12 percent during 2011–12.
14
15
Domestic retail, 42%
Food service/ government, etc.,
31%
Pet food / rendering, 10%
Exports, 17%
FIGURE 3 The largest share of U.S. broiler meat was marketed through domestic retail outlets in 2007
Source: Industry representative, interview by USITC staff, Washington, DC, March 11, 2009.
Domestic retail, 43%
Food service/ government, etc.,
41%
Pet food / rendering, 8%
Exports, 8%
FIGURE 4 Turkey meat was largely marketed through domestic retail outlets and food services in 2007
Source: National Turkey Federation, "Turkey Industry Structure," 2009.
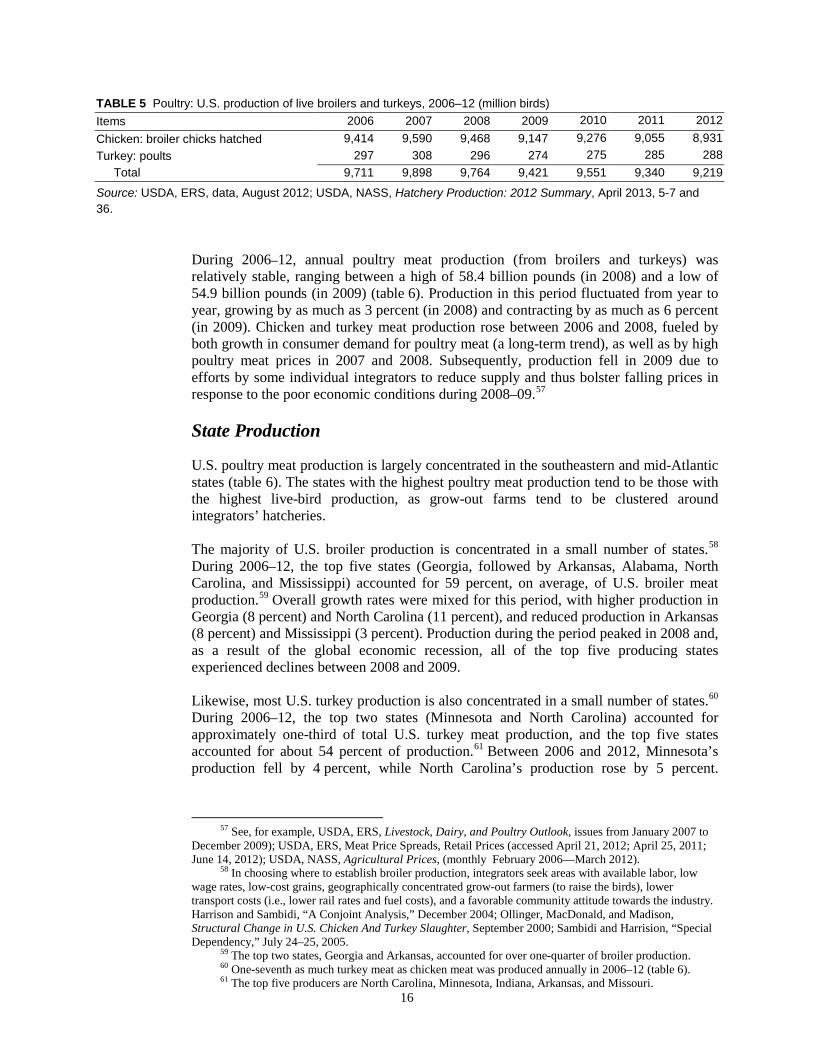
TABLE 5 Poultry: U.S. production of live broilers and turkeys, 2006–12 (million birds) Items 2006 2007 2008 2009 2010 2011 2012 Chicken: broiler chicks hatched 9,414 9,590 9,468 9,147 9,276 9,055 8,931 Turkey: poults 297 308 296 274 275 285 288 Total 9,711 9,898 9,764 9,421 9,551 9,340 9,219
Source: USDA, ERS, data, August 2012; USDA, NASS, Hatchery Production: 2012 Summary, April 2013, 5-7 and 36.
During 2006–12, annual poultry meat production (from broilers and turkeys) was relatively stable, ranging between a high of 58.4 billion pounds (in 2008) and a low of 54.9 billion pounds (in 2009) (table 6). Production in this period fluctuated from year to year, growing by as much as 3 percent (in 2008) and contracting by as much as 6 percent (in 2009). Chicken and turkey meat production rose between 2006 and 2008, fueled by both growth in consumer demand for poultry meat (a long-term trend), as well as by high poultry meat prices in 2007 and 2008. Subsequently, production fell in 2009 due to efforts by some individual integrators to reduce supply and thus bolster falling prices in response to the poor economic conditions during 2008–09.57 State Production
U.S. poultry meat production is largely concentrated in the southeastern and mid-Atlantic states (table 6). The states with the highest poultry meat production tend to be those with the highest live-bird production, as grow-out farms tend to be clustered around integrators’ hatcheries. The majority of U.S. broiler production is concentrated in a small number of states.58 During 2006–12, the top five states (Georgia, followed by Arkansas, Alabama, North Carolina, and Mississippi) accounted for 59 percent, on average, of U.S. broiler meat production.59 Overall growth rates were mixed for this period, with higher production in Georgia (8 percent) and North Carolina (11 percent), and reduced production in Arkansas (8 percent) and Mississippi (3 percent). Production during the period peaked in 2008 and, as a result of the global economic recession, all of the top five producing states experienced declines between 2008 and 2009. Likewise, most U.S. turkey production is also concentrated in a small number of states.60 During 2006–12, the top two states (Minnesota and North Carolina) accounted for approximately one-third of total U.S. turkey meat production, and the top five states accounted for about 54 percent of production.61 Between 2006 and 2012, Minnesota’s production fell by 4 percent, while North Carolina’s production rose by 5 percent.
57 See, for example, USDA, ERS, Livestock, Dairy, and Poultry Outlook, issues from January 2007 to December 2009); USDA, ERS, Meat Price Spreads, Retail Prices (accessed April 21, 2012; April 25, 2011; June 14, 2012); USDA, NASS, Agricultural Prices, (monthly February 2006—March 2012).
58 In choosing where to establish broiler production, integrators seek areas with available labor, low wage rates, low-cost grains, geographically concentrated grow-out farmers (to raise the birds), lower transport costs (i.e., lower rail rates and fuel costs), and a favorable community attitude towards the industry. Harrison and Sambidi, “A Conjoint Analysis,” December 2004; Ollinger, MacDonald, and Madison, Structural Change in U.S. Chicken And Turkey Slaughter, September 2000; Sambidi and Harrision, “Special Dependency,” July 24–25, 2005.
59 The top two states, Georgia and Arkansas, accounted for over one-quarter of broiler production. 60 One-seventh as much turkey meat as chicken meat was produced annually in 2006–12 (table 6). 61 The top five producers are North Carolina, Minnesota, Indiana, Arkansas, and Missouri.
16
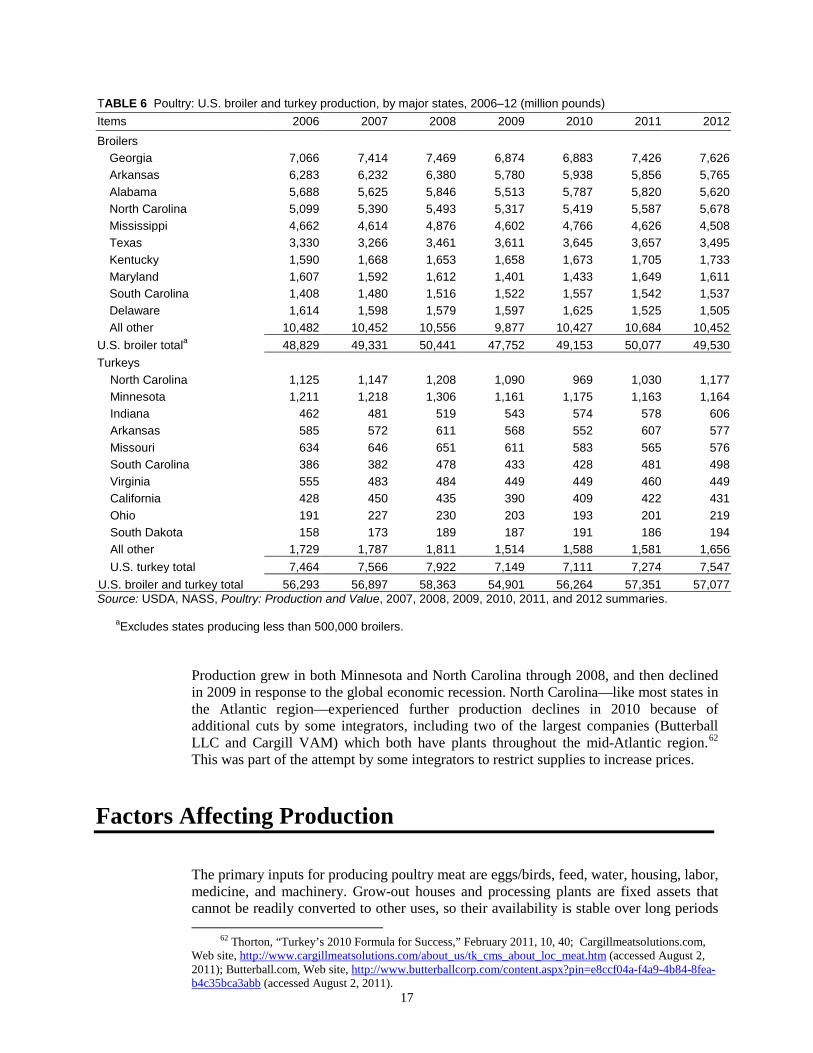
TABLE 6 Poultry: U.S. broiler and turkey production, by major states, 2006–12 (million pounds) Items 2006 2007 2008 2009 2010 2011 2012 Broilers Georgia 7,066 7,414 7,469 6,874 6,883 7,426 7,626 Arkansas 6,283 6,232 6,380 5,780 5,938 5,856 5,765 Alabama 5,688 5,625 5,846 5,513 5,787 5,820 5,620 North Carolina 5,099 5,390 5,493 5,317 5,419 5,587 5,678 Mississippi 4,662 4,614 4,876 4,602 4,766 4,626 4,508 Texas 3,330 3,266 3,461 3,611 3,645 3,657 3,495 Kentucky 1,590 1,668 1,653 1,658 1,673 1,705 1,733 Maryland 1,607 1,592 1,612 1,401 1,433 1,649 1,611 South Carolina 1,408 1,480 1,516 1,522 1,557 1,542 1,537 Delaware 1,614 1,598 1,579 1,597 1,625 1,525 1,505 All other 10,482 10,452 10,556 9,877 10,427 10,684 10,452
U.S. broiler totala 48,829 49,331 50,441 47,752 49,153 50,077 49,530 Turkeys North Carolina 1,125 1,147 1,208 1,090 969 1,030 1,177 Minnesota 1,211 1,218 1,306 1,161 1,175 1,163 1,164 Indiana 462 481 519 543 574 578 606 Arkansas 585 572 611 568 552 607 577 Missouri 634 646 651 611 583 565 576 South Carolina 386 382 478 433 428 481 498 Virginia 555 483 484 449 449 460 449 California 428 450 435 390 409 422 431 Ohio 191 227 230 203 193 201 219 South Dakota 158 173 189 187 191 186 194
All other 1,729 1,787 1,811 1,514 1,588 1,581 1,656 U.S. turkey total 7,464 7,566 7,922 7,149 7,111 7,274 7,547 U.S. broiler and turkey total 56,293 56,897 58,363 54,901 56,264 57,351 57,077 Source: USDA, NASS, Poultry: Production and Value, 2007, 2008, 2009, 2010, 2011, and 2012 summaries.
aExcludes states producing less than 500,000 broilers.
Production grew in both Minnesota and North Carolina through 2008, and then declined in 2009 in response to the global economic recession. North Carolina—like most states in the Atlantic region—experienced further production declines in 2010 because of additional cuts by some integrators, including two of the largest companies (Butterball LLC and Cargill VAM) which both have plants throughout the mid-Atlantic region.62 This was part of the attempt by some integrators to restrict supplies to increase prices.
Factors Affecting Production
The primary inputs for producing poultry meat are eggs/birds, feed, water, housing, labor, medicine, and machinery. Grow-out houses and processing plants are fixed assets that cannot be readily converted to other uses, so their availability is stable over long periods
62 Thorton, “Turkey’s 2010 Formula for Success,” February 2011, 10, 40; Cargillmeatsolutions.com, Web site, http://www.cargillmeatsolutions.com/about_us/tk_cms_about_loc_meat.htm (accessed August 2, 2011); Butterball.com, Web site, http://www.butterballcorp.com/content.aspx?pin=e8ccf04a-f4a9-4b84-8fea-b4c35bca3abb (accessed August 2, 2011).
17
of time. A reduction in the supply of birds from their 2007 peak was a response to the economic recession. During 2006−12, feed was the most volatile input in terms of cost, reflecting high global prices for its constituent ingredients.
Costs
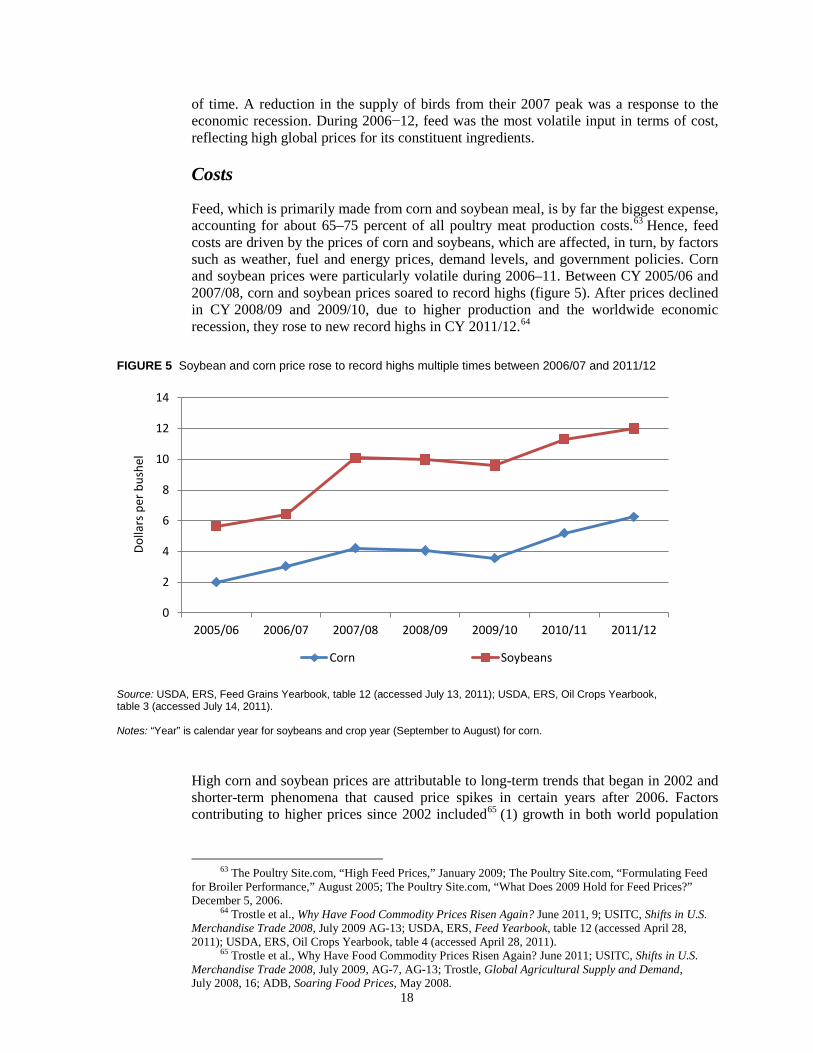
Feed, which is primarily made from corn and soybean meal, is by far the biggest expense, accounting for about 65–75 percent of all poultry meat production costs.63 Hence, feed costs are driven by the prices of corn and soybeans, which are affected, in turn, by factors such as weather, fuel and energy prices, demand levels, and government policies. Corn and soybean prices were particularly volatile during 2006–11. Between CY 2005/06 and 2007/08, corn and soybean prices soared to record highs (figure 5). After prices declined in CY 2008/09 and 2009/10, due to higher production and the worldwide economic recession, they rose to new record highs in CY 2011/12.64
High corn and soybean prices are attributable to long-term trends that began in 2002 and shorter-term phenomena that caused price spikes in certain years after 2006. Factors contributing to higher prices since 2002 included65 (1) growth in both world population
63 The Poultry Site.com, “High Feed Prices,” January 2009; The Poultry Site.com, “Formulating Feed for Broiler Performance,” August 2005; The Poultry Site.com, “What Does 2009 Hold for Feed Prices?” December 5, 2006.
64 Trostle et al., Why Have Food Commodity Prices Risen Again? June 2011, 9; USITC, Shifts in U.S. Merchandise Trade 2008, July 2009 AG-13; USDA, ERS, Feed Yearbook, table 12 (accessed April 28, 2011); USDA, ERS, Oil Crops Yearbook, table 4 (accessed April 28, 2011).
65 Trostle et al., Why Have Food Commodity Prices Risen Again? June 2011; USITC, Shifts in U.S. Merchandise Trade 2008, July 2009, AG-7, AG-13; Trostle, Global Agricultural Supply and Demand, July 2008, 16; ADB, Soaring Food Prices, May 2008.
0
2
4
6
8
10
12
14
2005/06 2006/07 2007/08 2008/09 2009/10 2010/11 2011/12
Dolla
rs p
er b
ushe
l
Corn Soybeans
FIGURE 5 Soybean and corn price rose to record highs multiple times between 2006/07 and 2011/12
Source: USDA, ERS, Feed Grains Yearbook, table 12 (accessed July 13, 2011); USDA, ERS, Oil Crops Yearbook, table 3 (accessed July 14, 2011). Notes: “Year” is calendar year for soybeans and crop year (September to August) for corn.
18
and per capita incomes, which increased demand;66 (2) expanding biofuel production and subsequent diversion of corn to its production, which further increased demand; 67
(3) depreciation of the U.S. dollar, which increased global demand for dollar-denominated products, including U.S. corn and soybeans; (4) rising worldwide energy prices, which drove up the cost of energy-intensive crop production inputs, especially fertilizer; and (5) declining growth rates of agricultural productivity. Between 2006 and 2011, short-term factors contributing to increased prices included68 (1) adverse weather, primarily droughts, in major grain- and oilseed-producing countries, including Australia, Russia, Ukraine, and the United States, which reduced world supply; (2) export controls established by some national governments to combat domestic food price inflation, which further reduced international market supply;69 (3) purchases to replenish depleted public stockpiles, which increased demand; and (4) government-set price controls in certain countries, which further increased demand for artificially cheap commodities.
Largely as a result of higher feed costs and lower domestic consumption,70 poultry meat producers faced lower profit levels in 2008–10. 71 Some integrators responded by reducing production, closing and consolidating inefficient facilities in an effort to improve productivity, and even going out of business. 72 According to an industry representative, rising feed prices in 2010 and 2011 meant that some broiler integrators were not able to sell meat at prices that covered their costs of production. In 2011, the U.S. government responded by purchasing $40 million of chicken meat to support the industry.73
U.S. Government Policy and Programs
Poultry meat production is governed by federal laws and regulations to ensure food safety.74 Primary among them is the Poultry Products Inspection Act (PPIA), which gives the U.S. Department of Agriculture’s (USDA’s) Food Safety and Inspection Service (FSIS) the authority to inspect and monitor poultry products sold between states and abroad. 75 For federally inspected plants, the PPIA (1) requires both ante- and post-mortem inspections for most aspects of poultry processing; and (2) mandates certain sanitary practices, labeling requirements, and container standards. The PPIA also establishes what safety, sanitary, or other conditions constitute violations of the act and
66 In particular, there is strong Chinese demand for soybeans (especially from the United States). 67 For example, there was increased use of corn for ethanol. The share of U.S. corn used for ethanol
rose from 10 to 24 percent between crop year 2002/03 and 2007/08. USITC, Shifts in U.S. Merchandise Trade 2008, July 2009, AG-7, AG-13; Trostle, Global Agricultural Supply and Demand, July 2008, 16.
68 Trostle, Global Agricultural Supply and Demand, July 2008, 20–21; USDA, ERS, Oil Crops Outlook, June 10, 2011, 1–3; Trostle et al., Why Have Food Commodity Prices Risen Again? June 2011.
69 For example, Argentina raised export prices on corn and soybeans, and China imposed an export tax on grains. Trostle, Global Agricultural Supply and Demand, July 2008, 23–24.
70 Due to higher prices and the 2008–09 economic recession. For further detail see the “Consumption” section below.
71 Thornton and O’Keefe, “When Will Profits Return?” October 2008, 20–21; Thornton, “U.S. Chicken Producers Increased Volume in 2010,” February 2011, 10; Kavilans, “U.S. Places $40 million Chicken Order,” August 16, 2011.
72 O’Keefe, “Coping with High Feed Prices,” June 2008, 18–20; O’Keefe, “No Growth in RTC Production in 2008,” February 2009, 18–25; O’Keefe, “Can Cutbacks Lead to Quick Turnaround?” February 2009, 44–46; USDA, ERS, Livestock, Dairy, and Poultry Outlook, March 28, 2009, 2; USDA, ERS, Livestock, Dairy, and Poultry Outlook, December 17, 2009, 13; Thornton, “Tyson Foods Focuses on Chicken Pricing,” August 11, 2011; Johnston, “Butterball to Close Plant Due to High Input Costs,” September 15, 2011.
73 Kavilans, “U.S. Places $40 Million Chicken Order,” August 16, 2011. 74 Some plants are inspected under state laws. Only products from federally inspected plants can be
sold across state borders or internationally. 75 USDA, FSIS, “Federal Inspection Programs” (accessed April 28, 2011).
19
penalties for such violations. All federally inspected plants have USDA inspectors on-site to ensure compliance with federal laws. In addition to the PPIA, the FSIS requires that all processing and slaughter plants develop and follow a plan to prevent food safety hazards—a Pathogen Reduction and Hazard Analysis and Critical Control Points (HACCP) systems plan—as required by the FSIS’s HACCP Rule.76 This plan should enable plants to (1) identify biological and physical hazards; (2) find “critical control points” in the production process; (3) monitor the control points to ensure they are operating within predetermined limits; (4) correct deviations from those limits; and (5) maintain thorough records of the plan.77 No federal inspection can commence unless a plant has an HACCP plan in place.78
Research and Development
Research and development (R&D) can be broadly classified into three groups: (1) animal genetics, health, and nutrition; (2) production and processing technology; and (3) product development. R&D within the U.S. poultry industry makes a critical contribution to its global competitiveness.
Animal genetics researchers work to improve the quality of birds. Genetics are extremely important for producing a healthy, meaty bird that grows quickly (i.e., is efficient at converting feed into meat). Research studies have shown that genetic selection was responsible for 85–90 percent of the improved broiler growth rate over the past half century, with feed improvements providing the remaining 10–15 percent of the gains.79 There is ongoing research into the control and prevention of diseases, particularly those that affect live birds, including avian influenza (AI), spinal abscesses, clostridial dermatitis, and foot pad conditions, as well as diseases that are harmful to consumers, such as salmonellosis (the infection caused by salmonella). There is also continuous R&D to improve the quality and efficiency of feed. This includes research into enzymes, formulation, particle size, and differences in grain varieties.80 For example, during 2006–10 researchers sought ways to formulate feed to enrich poultry meat with omega-3 fatty acids.81
Production and processing technology R&D seek to improve efficiency at all stages of the production process. Researchers continuously explore ways to improve the conditions and cost effectiveness of grow-out houses. Efforts include improving ventilation, heating, and cooling systems, as well as developing ways to use solar or wind power. Ongoing studies seek to make processing machinery more efficient and to automate parts of processes that are still done manually. For example, the Georgia Technology Research Institute has worked on developing an efficient automated deboning machine. 82
76 USDA, FSIS, The Final Rule on HACCP Systems, July 1996. 77 Hulebak and Scholosser, “HACCP History and Conceptual Overview” (accessed January 12, 2011). 78 Code of Federal Regulations (CFR) Parts 304.3(b) and (c). 79 Havenstein, Ferket, Qureshi, “Growth, Livability, and Feed Conversion of 1957 versus 2001,” 2003. 80 See, for example, Atlantic Poultry Research Institute, “Poultry Publications of Factsheets from
Current Research”; ThePoultrySite.com, “Study Shows Effects of Feed Particle Size on Laying Hens,” July 2008; Watt Poultry USA, issues from 2006–12.
81 Omega-3 fatty acids are considered by many consumers to have health benefits due to scientific research and corresponding positive press. This has started a trend where some producers are enriching foods, including eggs and pasta, with omega-3. University of Guelph, “U of G Prof Working to ‘Hatch’ Omega-3 Chicken,” June 29, 2006; The Australian, “Fish Food the Key,” January 17, 2007; The PoultrySite.com, “Algae May Boost Omega-3 in US Chicken,” January 23, 2009; Mayo Clinic, “Omega-3 Fatty Acids,” November 5, 2010; Harvard School of Public Health, “The Nutrition Source: Omega-3 Fatty Acids” (accessed July 20, 2011).
82 McMurray and Britton, “Automation to the Rescue?” December 2009, 18. 20
Improving the management of water (which is both an input and a waste product) and wastes (e.g., litter and poultry excrement) is also a focus of ongoing research. For example, researchers are testing ways to use water more efficiently in processing facilities and improving methods of recycling wastewater, including capturing its nutrients and energy potential.83
Poultry product development focuses mainly on health and safety issues (such as identifying causes of spoilage and ways to prevent it), and the development of new products for customers. R&D of new poultry products is undertaken by all large integrators. With regard to retail customers, R&D are focused on further processed items including ready-to-cook products, pre-flavored (e.g., marinated) products, and easier-to-use products, such as individual packages for freezing.
Consumption
Consumption Trends
The United States is the world’s largest poultry meat consumer, accounting for about one-fifth of world consumption during 2006–12 (appendix A table A.2). Chicken is the most commonly consumed meat in the United States. Americans ate an average of 84 pounds per capita per year during 2006–12, and chicken accounted for about 38 percent of all U.S. meat consumption in 2012 (table 7). Per capita consumption of turkey meat averaged 17 pounds in 2006–12—less than beef or pork, but more than seafood.
TABLE 7 U.S. annual per capita consumption of meat and seafood, 2006–12 Meat type 2006 2007 2008 2009 2010 2011 2012 Pounds Chicken 88 86 85 81 84 84 82 Turkey 17 18 18 17 16 16 16 Beef 66 65 63 61 60 57 57 Pork 49 51 49 50 48 46 46 Commercial fish and shellfish 17 16 16 16 16 16 16 All other 1 2 1 2 1 1 1 Total 238 238 232 227 225 220 218 Percent Chicken 37 36 37 36 37 38 38 Turkey 7 7 8 8 7 7 7 Beef 28 27 27 27 27 26 26 Pork 21 21 21 22 21 21 21 Commercial fish and shellfish 7 7 7 7 7 7 7 All other <1 <1 <1 <1 <1 <1 <1 Total 100 100 100 100 100 100 100 Source: NCC, "Statistics and Research,” January 11, 2013.
Total U.S. per capita meat consumption peaked during 2004–06 during the height of the high-protein diet trend, and declined 8 percent in 2006–12 due to record-high meat prices and the economic recession. The first-ever recorded three-years-in-a-row U.S. decline in chicken consumption occurred in 2007–09. Chicken consumption regained some of its
83 See, for example, O’Keefe, “2009 Clean Water Awards,” May 2009. 21
losses in 2010, partly because of expanded supply resulting from increased production and reduced exports to Russia and China due to trade restrictions. However, lower production and higher exports lead to higher consumer prices, and as a result, chicken consumption declined again in 2012. 84 Turkey consumption declined (11 percent) between 2008 and 2010 and then stabilized. U.S. consumers eat poultry in a variety of forms but generally prefer white meat, such as breast meat or wings. However, in recent years dark meat has become more popular, especially among growing immigrant communities.85 In the United States, an estimated 12 percent of chicken was consumed whole and 42 percent in parts (e.g., breast, leg, and wing) in 2011.86 The remaining 46 percent was further processed into products such as chicken nuggets and microwaveable meals. In 2009, the most popular turkey products were whole birds (which make up approximately one-quarter of sales), ground turkey, and deli meat.87 Ground turkey was the fastest-growing turkey product over the past decade. Many dark-meat cuts (such as leg quarters), as well as parts not generally consumed in the United States (such as paws), are exported.
Import Penetration Levels
Because the United States is one of the world’s largest and most efficient poultry producers, its imports are negligible. Imports represented only about 0.3 percent of domestic consumption of both live poultry and poultry meat in 2006–12 (appendix A tables A.2 and A.4).
Factors Affecting Consumption
One of the most important factors impacting consumers’ meat purchasing decisions is price. Studies show that a price increase for one type of meat causes an increase in consumption of another as a substitute. For example, a rise in the price of chicken may cause a shift toward increased consumption of beef.88 For lower income consumers, an increase in poultry meat prices may cause their consumption to shift to lower-priced protein sources, such as eggs. Nevertheless, as the lowest-priced major meat, poultry generally has a marketing advantage with consumers (table 8). In 2012, retail consumers paid on average almost 46 percent more per pound for pork and 62 percent more per pound for beef than for chicken. Several other factors also affect poultry demand, including science, consumer lifestyles, and cultural traditions, among others. For example, increased awareness about health issues has benefited poultry, as it is considered healthier than red meat. Additionally, consumers are spending less time cooking and want products that reduce preparation time. Poultry companies have developed a number of products to meet these criteria, including pre-marinated items, pan-ready meals, microwavable items, and prepackaged
84 Growing Georgia, “Per Capita Meat, Poultry and Fish Consumption,” February 3, 2011; WattAgNet, “US Chicken Consumption Increases,” April 5, 2011; USDA, ERS, Long-term Projections, February 2012, 2. See also the U.S. Trade and Foreign Industry Profiles below.
85 See, for example, WattAgNet.com, “Demand for Dark Poultry Meat on the Rise,” April 16, 2012. 86 NCC, “How Broilers Are Marketed,” (accessed February 7, 2011). 87 National Turkey Federation, “Turkey Industry Structure” (accessed May 2, 2011). 88 Schroeder, Marsh, and Mintert, Beef Demand Determinants, March 2000.
22
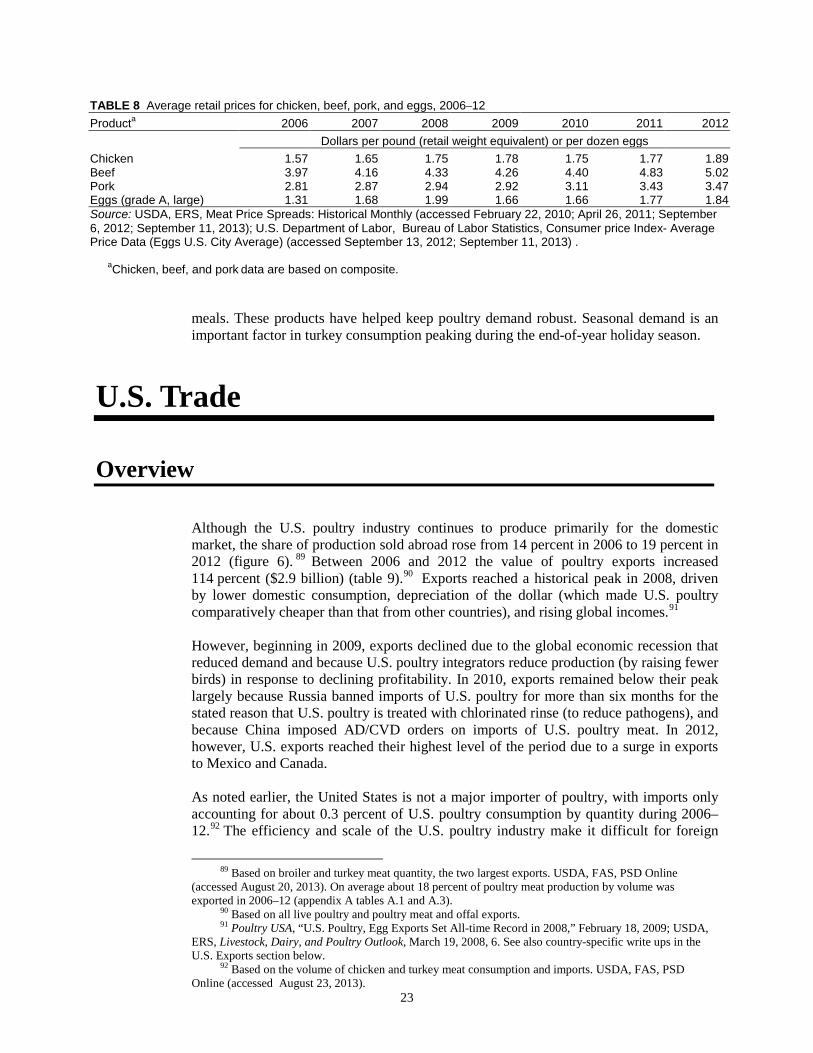
TABLE 8 Average retail prices for chicken, beef, pork, and eggs, 2006–12 Producta 2006 2007 2008 2009 2010 2011 2012 Dollars per pound (retail weight equivalent) or per dozen eggs Chicken 1.57 1.65 1.75 1.78 1.75 1.77 1.89 Beef 3.97 4.16 4.33 4.26 4.40 4.83 5.02 Pork 2.81 2.87 2.94 2.92 3.11 3.43 3.47 Eggs (grade A, large) 1.31 1.68 1.99 1.66 1.66 1.77 1.84 Source: USDA, ERS, Meat Price Spreads: Historical Monthly (accessed February 22, 2010; April 26, 2011; September 6, 2012; September 11, 2013); U.S. Department of Labor, Bureau of Labor Statistics, Consumer price Index- Average Price Data (Eggs U.S. City Average) (accessed September 13, 2012; September 11, 2013) . aChicken, beef, and pork data are based on composite.
meals. These products have helped keep poultry demand robust. Seasonal demand is an important factor in turkey consumption peaking during the end-of-year holiday season.
U.S. Trade
Overview
Although the U.S. poultry industry continues to produce primarily for the domestic market, the share of production sold abroad rose from 14 percent in 2006 to 19 percent in 2012 (figure 6). 89 Between 2006 and 2012 the value of poultry exports increased 114 percent ($2.9 billion) (table 9).90 Exports reached a historical peak in 2008, driven by lower domestic consumption, depreciation of the dollar (which made U.S. poultry comparatively cheaper than that from other countries), and rising global incomes.91 However, beginning in 2009, exports declined due to the global economic recession that reduced demand and because U.S. poultry integrators reduce production (by raising fewer birds) in response to declining profitability. In 2010, exports remained below their peak largely because Russia banned imports of U.S. poultry for more than six months for the stated reason that U.S. poultry is treated with chlorinated rinse (to reduce pathogens), and because China imposed AD/CVD orders on imports of U.S. poultry meat. In 2012, however, U.S. exports reached their highest level of the period due to a surge in exports to Mexico and Canada. As noted earlier, the United States is not a major importer of poultry, with imports only accounting for about 0.3 percent of U.S. poultry consumption by quantity during 2006–12.92 The efficiency and scale of the U.S. poultry industry make it difficult for foreign
89 Based on broiler and turkey meat quantity, the two largest exports. USDA, FAS, PSD Online (accessed August 20, 2013). On average about 18 percent of poultry meat production by volume was exported in 2006–12 (appendix A tables A.1 and A.3).
90 Based on all live poultry and poultry meat and offal exports. 91 Poultry USA, “U.S. Poultry, Egg Exports Set All-time Record in 2008,” February 18, 2009; USDA,
ERS, Livestock, Dairy, and Poultry Outlook, March 19, 2008, 6. See also country-specific write ups in the U.S. Exports section below.
92 Based on the volume of chicken and turkey meat consumption and imports. USDA, FAS, PSD Online (accessed August 23, 2013).
23
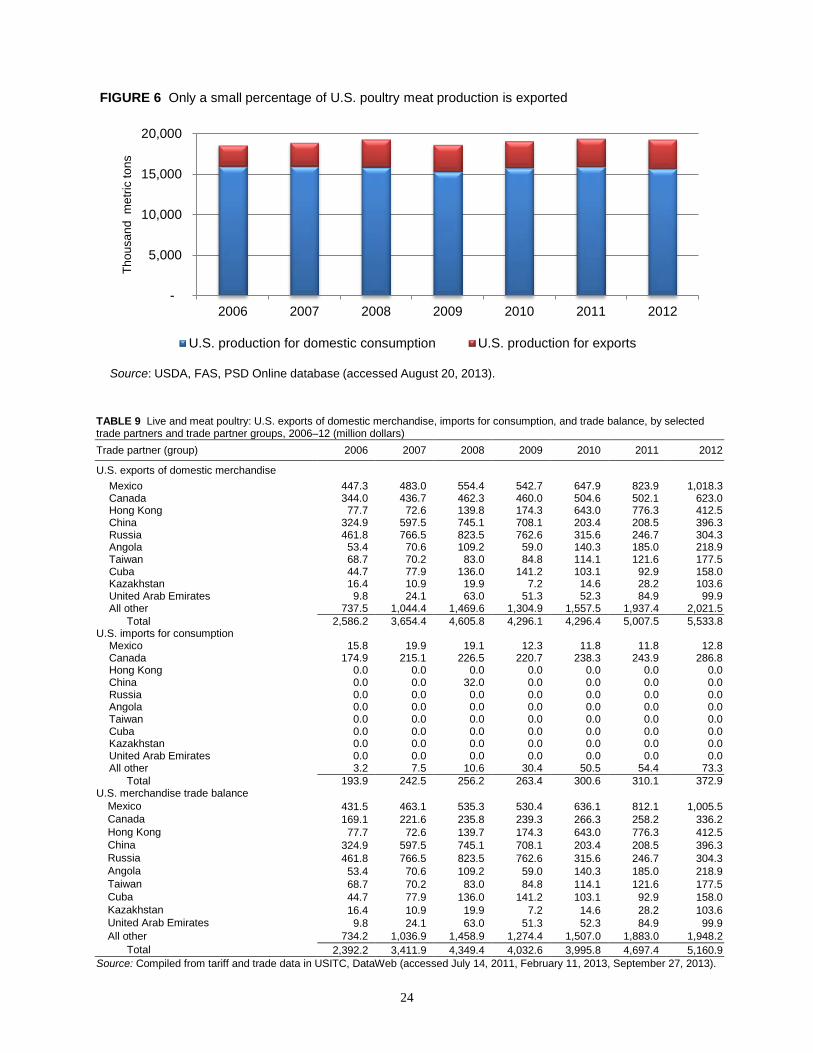
TABLE 9 Live and meat poultry: U.S. exports of domestic merchandise, imports for consumption, and trade balance, by selected trade partners and trade partner groups, 2006–12 (million dollars) Trade partner (group) 2006 2007 2008 2009 2010 2011 2012
U.S. exports of domestic merchandise Mexico 447.3 483.0 554.4 542.7 647.9 823.9 1,018.3 Canada 344.0 436.7 462.3 460.0 504.6 502.1 623.0 Hong Kong 77.7 72.6 139.8 174.3 643.0 776.3 412.5 China 324.9 597.5 745.1 708.1 203.4 208.5 396.3 Russia 461.8 766.5 823.5 762.6 315.6 246.7 304.3 Angola 53.4 70.6 109.2 59.0 140.3 185.0 218.9 Taiwan 68.7 70.2 83.0 84.8 114.1 121.6 177.5 Cuba 44.7 77.9 136.0 141.2 103.1 92.9 158.0 Kazakhstan 16.4 10.9 19.9 7.2 14.6 28.2 103.6 United Arab Emirates 9.8 24.1 63.0 51.3 52.3 84.9 99.9 All other 737.5 1,044.4 1,469.6 1,304.9 1,557.5 1,937.4 2,021.5 Total 2,586.2 3,654.4 4,605.8 4,296.1 4,296.4 5,007.5 5,533.8 U.S. imports for consumption
Mexico 15.8 19.9 19.1 12.3 11.8 11.8 12.8 Canada 174.9 215.1 226.5 220.7 238.3 243.9 286.8 Hong Kong 0.0 0.0 0.0 0.0 0.0 0.0 0.0 China 0.0 0.0 32.0 0.0 0.0 0.0 0.0 Russia 0.0 0.0 0.0 0.0 0.0 0.0 0.0 Angola 0.0 0.0 0.0 0.0 0.0 0.0 0.0 Taiwan 0.0 0.0 0.0 0.0 0.0 0.0 0.0 Cuba 0.0 0.0 0.0 0.0 0.0 0.0 0.0 Kazakhstan 0.0 0.0 0.0 0.0 0.0 0.0 0.0 United Arab Emirates 0.0 0.0 0.0 0.0 0.0 0.0 0.0 All other 3.2 7.5 10.6 30.4 50.5 54.4 73.3 Total 193.9 242.5 256.2 263.4 300.6 310.1 372.9 U.S. merchandise trade balance Mexico 431.5 463.1 535.3 530.4 636.1 812.1 1,005.5 Canada 169.1 221.6 235.8 239.3 266.3 258.2 336.2 Hong Kong 77.7 72.6 139.7 174.3 643.0 776.3 412.5 China 324.9 597.5 745.1 708.1 203.4 208.5 396.3 Russia 461.8 766.5 823.5 762.6 315.6 246.7 304.3 Angola 53.4 70.6 109.2 59.0 140.3 185.0 218.9 Taiwan 68.7 70.2 83.0 84.8 114.1 121.6 177.5 Cuba 44.7 77.9 136.0 141.2 103.1 92.9 158.0 Kazakhstan 16.4 10.9 19.9 7.2 14.6 28.2 103.6 United Arab Emirates 9.8 24.1 63.0 51.3 52.3 84.9 99.9 All other 734.2 1,036.9 1,458.9 1,274.4 1,507.0 1,883.0 1,948.2 Total 2,392.2 3,411.9 4,349.4 4,032.6 3,995.8 4,697.4 5,160.9 Source: Compiled from tariff and trade data in USITC, DataWeb (accessed July 14, 2011, February 11, 2013, September 27, 2013).
24
-
5,000
10,000
15,000
20,000
2006 2007 2008 2009 2010 2011 2012
Thou
sand
met
ric to
ns
U.S. production for domestic consumption U.S. production for exports
FIGURE 6 Only a small percentage of U.S. poultry meat production is exported
Source: USDA, FAS, PSD Online database (accessed August 20, 2013).
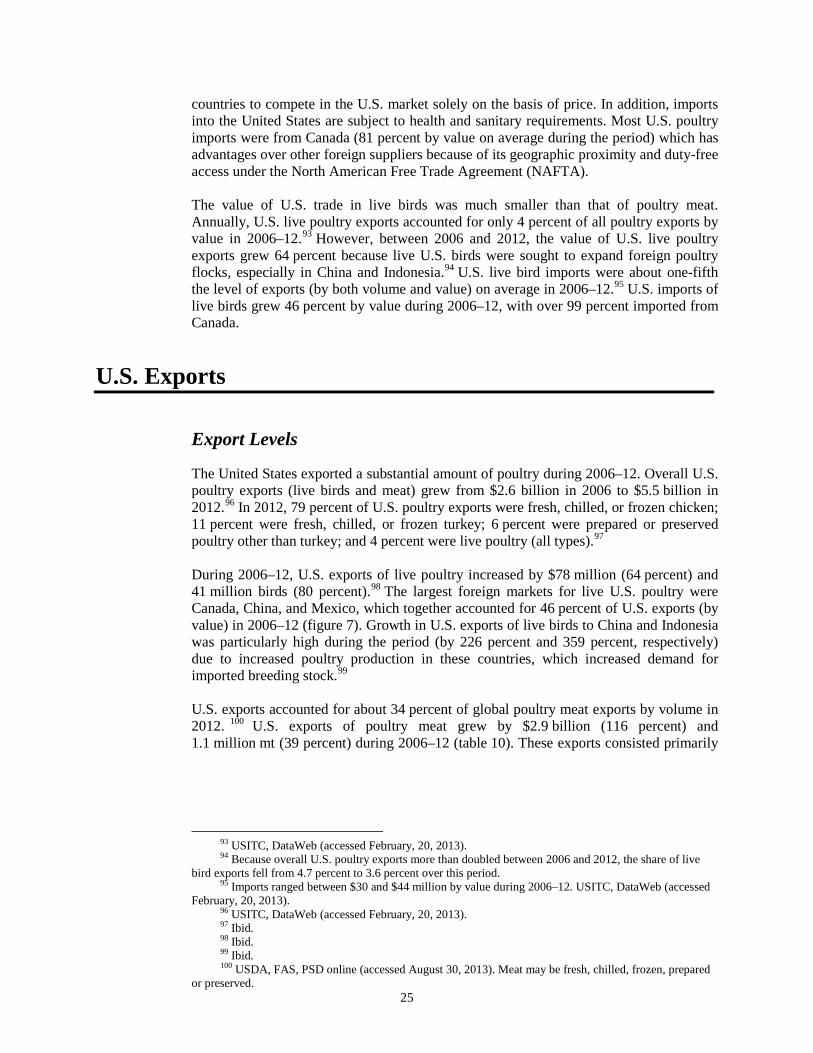
countries to compete in the U.S. market solely on the basis of price. In addition, imports into the United States are subject to health and sanitary requirements. Most U.S. poultry imports were from Canada (81 percent by value on average during the period) which has advantages over other foreign suppliers because of its geographic proximity and duty-free access under the North American Free Trade Agreement (NAFTA). The value of U.S. trade in live birds was much smaller than that of poultry meat. Annually, U.S. live poultry exports accounted for only 4 percent of all poultry exports by value in 2006–12.93 However, between 2006 and 2012, the value of U.S. live poultry exports grew 64 percent because live U.S. birds were sought to expand foreign poultry flocks, especially in China and Indonesia.94 U.S. live bird imports were about one-fifth the level of exports (by both volume and value) on average in 2006–12.95 U.S. imports of live birds grew 46 percent by value during 2006–12, with over 99 percent imported from Canada.
U.S. Exports
Export Levels
The United States exported a substantial amount of poultry during 2006–12. Overall U.S. poultry exports (live birds and meat) grew from $2.6 billion in 2006 to $5.5 billion in 2012.96 In 2012, 79 percent of U.S. poultry exports were fresh, chilled, or frozen chicken; 11 percent were fresh, chilled, or frozen turkey; 6 percent were prepared or preserved poultry other than turkey; and 4 percent were live poultry (all types).97
During 2006–12, U.S. exports of live poultry increased by $78 million (64 percent) and 41 million birds (80 percent).98 The largest foreign markets for live U.S. poultry were Canada, China, and Mexico, which together accounted for 46 percent of U.S. exports (by value) in 2006–12 (figure 7). Growth in U.S. exports of live birds to China and Indonesia was particularly high during the period (by 226 percent and 359 percent, respectively) due to increased poultry production in these countries, which increased demand for imported breeding stock.99 U.S. exports accounted for about 34 percent of global poultry meat exports by volume in 2012. 100 U.S. exports of poultry meat grew by $2.9 billion (116 percent) and 1.1 million mt (39 percent) during 2006–12 (table 10). These exports consisted primarily
93 USITC, DataWeb (accessed February, 20, 2013). 94 Because overall U.S. poultry exports more than doubled between 2006 and 2012, the share of live
bird exports fell from 4.7 percent to 3.6 percent over this period. 95 Imports ranged between $30 and $44 million by value during 2006–12. USITC, DataWeb (accessed
February, 20, 2013). 96 USITC, DataWeb (accessed February, 20, 2013). 97 Ibid. 98 Ibid. 99 Ibid. 100 USDA, FAS, PSD online (accessed August 30, 2013). Meat may be fresh, chilled, frozen, prepared
or preserved. 25
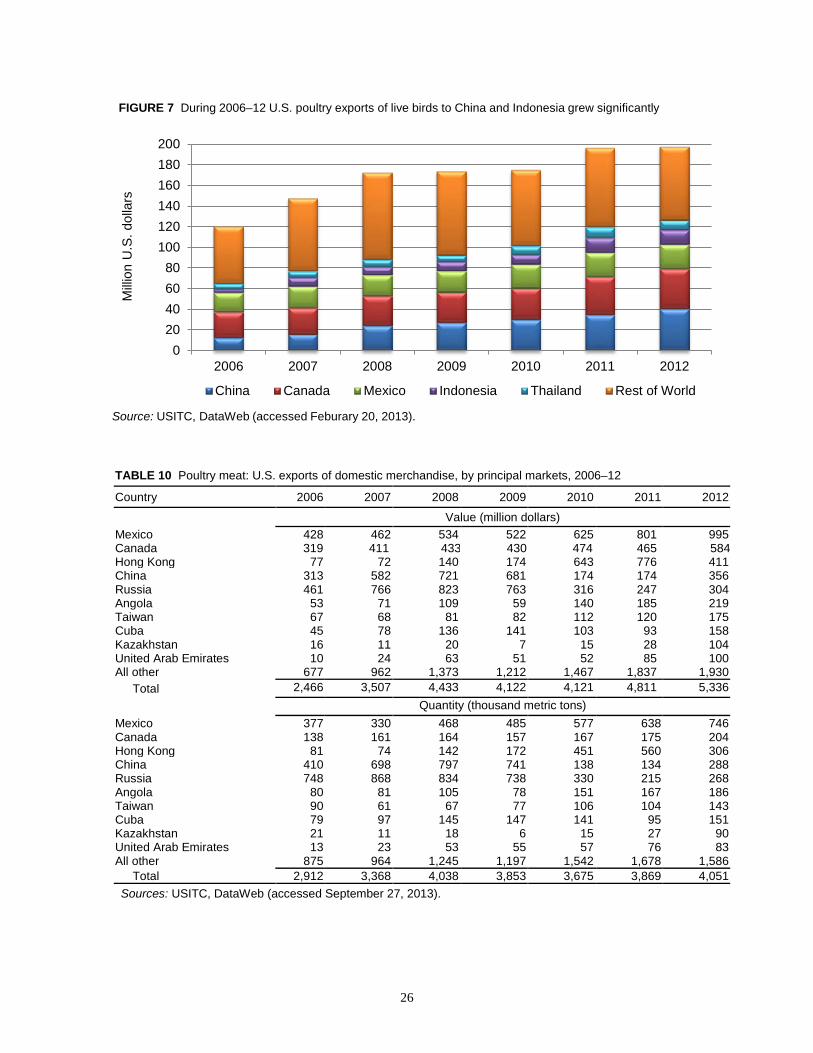
TABLE 10 Poultry meat: U.S. exports of domestic merchandise, by principal markets, 2006–12
Country 2006 2007 2008 2009 2010 2011 2012
Value (million dollars) Mexico 428 462 534 522 625 801 995 Canada 319 411 433 430 474 465 584 Hong Kong 77 72 140 174 643 776 411 China 313 582 721 681 174 174 356 Russia 461 766 823 763 316 247 304 Angola 53 71 109 59 140 185 219 Taiwan 67 68 81 82 112 120 175 Cuba 45 78 136 141 103 93 158 Kazakhstan 16 11 20 7 15 28 104 United Arab Emirates 10 24 63 51 52 85 100 All other 677 962 1,373 1,212 1,467 1,837 1,930 Total 2,466 3,507 4,433 4,122 4,121 4,811 5,336 Quantity (thousand metric tons) Mexico 377 330 468 485 577 638 746 Canada 138 161 164 157 167 175 204 Hong Kong 81 74 142 172 451 560 306 China 410 698 797 741 138 134 288 Russia 748 868 834 738 330 215 268 Angola 80 81 105 78 151 167 186 Taiwan 90 61 67 77 106 104 143 Cuba 79 97 145 147 141 95 151 Kazakhstan 21 11 18 6 15 27 90 United Arab Emirates 13 23 53 55 57 76 83 All other 875 964 1,245 1,197 1,542 1,678 1,586 Total 2,912 3,368 4,038 3,853 3,675 3,869 4,051 Sources: USITC, DataWeb (accessed September 27, 2013).
26
020406080
100120140160180200
2006 2007 2008 2009 2010 2011 2012
Milli
on U
.S. d
olla
rs
China Canada Mexico Indonesia Thailand Rest of World
FIGURE 7 During 2006–12 U.S. poultry exports of live birds to China and Indonesia grew significantly
Source: USITC, DataWeb (accessed Feburary 20, 2013).
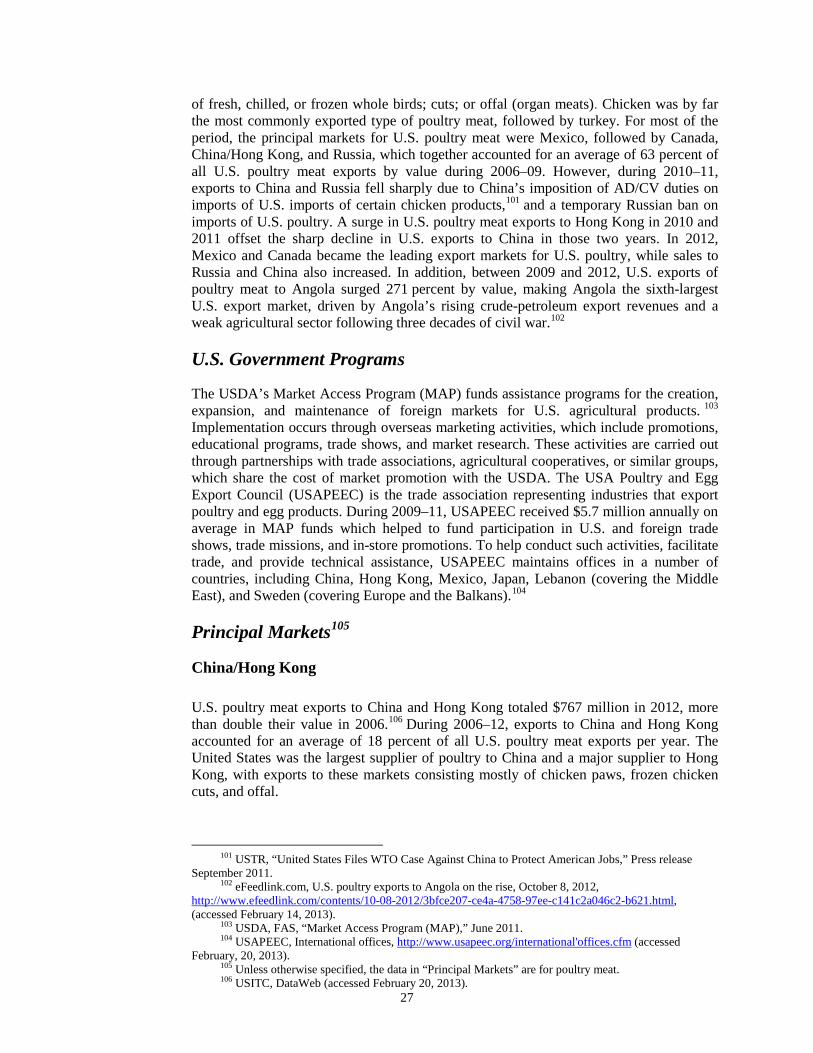
of fresh, chilled, or frozen whole birds; cuts; or offal (organ meats). Chicken was by far the most commonly exported type of poultry meat, followed by turkey. For most of the period, the principal markets for U.S. poultry meat were Mexico, followed by Canada, China/Hong Kong, and Russia, which together accounted for an average of 63 percent of all U.S. poultry meat exports by value during 2006–09. However, during 2010–11, exports to China and Russia fell sharply due to China’s imposition of AD/CV duties on imports of U.S. imports of certain chicken products,101 and a temporary Russian ban on imports of U.S. poultry. A surge in U.S. poultry meat exports to Hong Kong in 2010 and 2011 offset the sharp decline in U.S. exports to China in those two years. In 2012, Mexico and Canada became the leading export markets for U.S. poultry, while sales to Russia and China also increased. In addition, between 2009 and 2012, U.S. exports of poultry meat to Angola surged 271 percent by value, making Angola the sixth-largest U.S. export market, driven by Angola’s rising crude-petroleum export revenues and a weak agricultural sector following three decades of civil war.102
U.S. Government Programs
The USDA’s Market Access Program (MAP) funds assistance programs for the creation, expansion, and maintenance of foreign markets for U.S. agricultural products. 103 Implementation occurs through overseas marketing activities, which include promotions, educational programs, trade shows, and market research. These activities are carried out through partnerships with trade associations, agricultural cooperatives, or similar groups, which share the cost of market promotion with the USDA. The USA Poultry and Egg Export Council (USAPEEC) is the trade association representing industries that export poultry and egg products. During 2009–11, USAPEEC received $5.7 million annually on average in MAP funds which helped to fund participation in U.S. and foreign trade shows, trade missions, and in-store promotions. To help conduct such activities, facilitate trade, and provide technical assistance, USAPEEC maintains offices in a number of countries, including China, Hong Kong, Mexico, Japan, Lebanon (covering the Middle East), and Sweden (covering Europe and the Balkans).104
Principal Markets105
China/Hong Kong
U.S. poultry meat exports to China and Hong Kong totaled $767 million in 2012, more than double their value in 2006.106 During 2006–12, exports to China and Hong Kong accounted for an average of 18 percent of all U.S. poultry meat exports per year. The United States was the largest supplier of poultry to China and a major supplier to Hong Kong, with exports to these markets consisting mostly of chicken paws, frozen chicken cuts, and offal.
101 USTR, “United States Files WTO Case Against China to Protect American Jobs,” Press release September 2011.
102 eFeedlink.com, U.S. poultry exports to Angola on the rise, October 8, 2012, http://www.efeedlink.com/contents/10-08-2012/3bfce207-ce4a-4758-97ee-c141c2a046c2-b621.html, (accessed February 14, 2013).
103 USDA, FAS, “Market Access Program (MAP),” June 2011. 104 USAPEEC, International offices, http://www.usapeec.org/international'offices.cfm (accessed
February, 20, 2013). 105 Unless otherwise specified, the data in “Principal Markets” are for poultry meat. 106 USITC, DataWeb (accessed February 20, 2013).
27
The pattern of U.S. poultry meat exports to China and Hong Kong has varied over time. U.S. firms started to export poultry directly to China beginning in the 1990s.107 However, before 2005, poultry entered China through Hong Kong because it was difficult to ship directly to China owing to poor internal transportation and high tariffs. During 2006–09, the United States exported substantially more poultry directly to China than via Hong Kong. U.S. poultry exports to Hong Kong fell sharply during 2005–07 before increasing slightly in 2008 and 2009 due to competitive U.S. prices, increased transshipments to Macao and Taiwan through Hong Kong, and a sharp decline in imports from the EU and Argentina, thereby raising the demand for U.S. and Brazilian product.108 In 2010, the pattern shifted again, as the value of direct shipments to China plummeted by 75 percent following the imposition of AD/CV duties109 on U.S. poultry, and exports to Hong Kong rose by 269 percent.110 Between 2010 and 2011, U.S. poultry meat exports to Hong Kong increased another 21 percent by value.111 In 2012, this pattern reversed, with a sharp decline in U.S. poultry exports to Hong Kong, partially offset by an increase of direct exports to China. China’s imports of U.S. poultry rose because import prices from alternative sources (in South America) rose high enough that some Chinese importers were willing to pay the AD/CV duties for higher quality U.S. product.112 Growth of direct and indirect U.S. poultry exports to China was spurred by increased consumer demand resulting from rising personal incomes and cultural changes, particularly increased dining out at fast-food restaurants, such as Kentucky Fried Chicken (KFC) and McDonald’s.113 Additionally, from 2007 to 2009, poultry consumption rose in response to lower production and consumption of pork following an outbreak of blue-ear disease in Chinese swine herds.114
Mexico
U.S. poultry meat exports to Mexico increased significantly, with most of the increase occurring since 2010. U.S. poultry meat exports to Mexico were $995 million in 2012, 132 percent higher than in 2006. 115 During 2006–12, Mexico accounted for about 15 percent by value of all U.S. poultry meat exports, purchasing mostly chicken leg quarters, mechanically deboned chicken, and fresh or chilled turkey cuts/offal. In that period, approximately 38 percent by value of Mexican poultry imports from the United States was turkey, making Mexico the largest importer of U.S. turkey meat.116 Turkey was primarily imported as an ingredient by the Mexican cold-cuts industry for products such as turkey ham.117
107 In 2004, a quarantine law to crack down on poultry smuggling from Hong Kong made it more difficult to transship poultry to China from Hong Kong. USDA, FAS, China: Annual Poultry Report, September 24, 2004, 3; USDA, FAS, China: Poultry and Products, February 1, 2005, 3.
108 Industry representative, e-mail to USITC staff, November 11, 2009. 109 USTR, “United States Files WTO Case Against China to Protect American Jobs,” September 2011. 110 According to industry and government officials, when poultry products are restricted from directly
entering China, they will enter China through “grey” channels (primary through routes in Vietnam or Hong Kong). This is true of product from all countries. USITC, China’s Agricultural Trade, March 2011.
111 USITC, DataWeb (accessed February 11, 2013). Based on data rounded to thousand dollars. 112 USDA, FAS, China: Poultry and Products Annual, September 18, 2013, 3-4. 113 USITC, China’s Agricultural Trade, March 2011. 114 USITC, China’s Agricultural Trade, March 2011, 2-7, 3-3; USDA, FAS, China: Poultry and
Product, March 1, 2008, 3; USDA, FAS, China: Poultry and Products, September 1, 2008, 5. 115 USITC, DataWeb (accessed February 11, 2013). For further details on why imports from the U.S.
increased, see Foreign Industry Profiles: Net Importers: Mexico, below. 116 One-quarter by volume. GTIS, GTA database (accessed August 29, 2013). 117 USDA, FAS, Mexico: Poultry and Products, September 2, 2008, 14. Domestic pork and imported
turkey meat are mixed to make the hams. 28
The United States was Mexico’s largest poultry supplier during 2006–12, accounting for almost 90 percent of the import market value annually. 118 However, Mexico also diversified its import suppliers by increasing its purchases from Chile.119 Chilean poultry is attractive to Mexican buyers because it enters at a zero tariff rate, is competitively priced, and is suitable for processing by producers willing to use frozen product.120
Canada
Canada accounted for about 11 percent of total U.S. poultry meat exports during 2006–12, and U.S. exports of poultry meat to Canada trended upward during the period. In 2012, U.S. poultry meat exports to Canada reached a record $584 million, an 83 percent increase from 2006, consisting mostly of fresh or chilled chicken cuts/offal and frozen other prepared chicken meat.
Canada has imposed a tariff-rate quota (TRQ) system on chicken and turkey meat, hatching eggs and chicks, and eggs that limit in-quota shipments to its ceiling under either WTO commitments or NAFTA, whichever is higher. 121 However, at least two types of poultry imports are exempt from the TRQs. Under Canada’s Import to Re-Export Program (IREP), duty-free access is granted to certain poultry meat for further processing, provided the finished product is exported.122 Most of the poultry entering Canada under its IREP was subsequently re-exported as finished products to the United States. Supplementary import permits allow permit holders to import poultry duty-free, and Canada regularly increases the number of supplementary import permits it issues under the IREP.123 In addition, spent layers are not subject to Canada’s TRQ system. Overall, although Canada’s TRQ for chicken was 77,000 mt in 2012, it is estimated that Canada imported from all countries about twice that amount duty-free. 124 That year, Canada imported about 81,000 mt of chicken meat from the world that were not subject to a tariff under the Canadian TRQ system.125
Russia
Between 2006 and 2009, Russia was the largest export market for U.S. poultry meat, accounting for an average of about 19 percent of U.S. exports annually during those four years.126 However, U.S. exports of poultry meat to Russia fell sharply in 2010, and fell
118 GTIS, GTA database (accessed August 28, 2013). 119 USDA, FAS, Mexico: Poultry and Products, September 24, 2007; USDA, FAS, Mexico: Poultry
and Products, September 2, 2008. Chile supplied 9 percent of Mexico’s poultry meat imports on average in 2006–12. GTIS, GTA database (accessed August 28, 2013).
120 The majority of turkey that Mexico imported from the United States is fresh or chilled, while most product from Chile is frozen. The United States can ship fresh or chilled turkey to Mexico because of the proximity of the two countries, and Mexican producers are used to processing both types of products. GTIS, GTA database (accessed August 28, 2013).
121 Under its WTO agreement Canada’s TRQs are 7.949 million hatching eggs and chicks, 39.9 million kg of eviscerated chicken, 5.6 million kgs of eviscerated turkey, and 21.4 million dozen eggs. Under NAFTA, Canada’s TRQs are 21.1 percent of anticipated current-year production for hatching eggs and chicks, 7.5 percent of the previous-year production for chicken, 3.5 percent of anticipated current-year production for turkey, and 2.988 percent of the previous-year production for eggs and egg products. Agriculture and Agri-Food Canada, “Canada’s Poultry Import Regime” (accessed August 15, 2011).
122 USDA, FAS, Canada: Annual Poultry Report, 2008, September 2, 2008, 3, 8. Processing usually entails adding marinates and flavor.
123 USDA, FAS, Canada: Annual Poultry Report, 2008, September 2, 2008, 3, 8; USDA, FAS, Canada: Annual Poultry Report, 2009, August 31, 2009, 6–7.
124 USDA, FAS, Canada: Poultry and Product Annual, August, 2012, 2. 125 Ibid., 10. 126 By value. Almost all exports were frozen, and chicken leg quarters were the most exported item.
29
further in 2011 after Russia banned imports of poultry meat treated with a chlorinated rinse. In 2010 Russia was the fourth-largest U.S. export market, purchasing only about 8 percent (by value) of total U.S. poultry meat exports. Some industry analysts view the ban was imposed not for sanitary concerns, but rather as part of a drive by the government to achieve national self-sufficiency in poultry production.127 Due to such measures, U.S. poultry meat faced greater competition from domestic poultry than from imports sourced from other foreign suppliers in the Russian market.
Foreign Trade Measures in Principal Markets
China
During 2006–12, U.S. poultry exports to China were affected by AD/CV duties and nontariff measures (NTMs). In April 2009, China initiated AD and CV duty investigations against U.S. chicken, which resulted in the imposition of company-specific AD duties ranging from 50.3 to 105.4 percent ad valorem, plus CVD from 4 to 30.3 percent ad valorem, on U.S. poultry meat products in 2010.128 In September 2011, the United States requested consultations with China under the WTO Dispute Settlement mechanism, about these determinations. 129 These consultations failed to resolve the dispute, and as a result the United States requested in December 2011 the formation of a WTO dispute resolution panel which was formed in January 2012.130 In August 2013, the WTO dispute settlement panel found that China violated numerous WTO obligations in conducting its investigations and imposing AD and DVD duties on chicken imports from the United States.131 China did not appeal the decision and is now entitled to a period of time to bring itself into compliance with its WTO obligations.132
During 2006–12, China banned imports of U.S. poultry that were produced in, or shipped through, some U.S. states because of the presence of low pathogenic avian influenza (LPAI).133 While China has lifted bans on some states, as of early 2013, bans were still in
127 USDA, FAS, Russian Federation: Chlorine Ban Postponed until January 1, 2010, December 29, 2008; USDA, FAS, Russian Federation: Chlorine Use in Poultry Production Banned, July 1, 2009; USTR, 2009 National Trade Estimate Report, March 2009, 418; USTR, 2010 National Trade Estimate Report, March 2010, 311–13; WattAgNet, “Russia to Ban US Imports,” September 14, 2009; Schwirtz, “Russia Seeks to Cleanse Its Palate,” January 19, 2010; USDA, FAS, Russian Federation: Big Moves to Self-Sufficiency, April 6, 2010, 1–2, 4–6. See “Foreign Industry Profiles” for more detail on Russia tariffs and barriers to trade.
128 DOC, U.S. Products Subject to Foreign Antidumping and Countervailing Duty Measures: China, http://ia.ita.doc.gov/trcs/foreignadcvd/china.html. AD and CV duties are cumulated. The investigation included the following Harmonized Schedule (HS) numbers: 0207.11.00, 0207.12.00, 0207.13.11, 0207.13.19, 0207.13.21, 0207.13.29, 0207.14.11, 0207.14.19, 0207.14.21, 0207.14.22, 0207.14.29, and 0504.00.21. USTR, “United States Files WTO Case Against China to Protect American Jobs,” September 20, 2011.
129 USTR, “United States Files WTO Case Against China to Protect American Jobs,” September 20, 2011.
130 USTR, “To Protect American Jobs, United States Announces Next Step,” December 2011. 131 USTR, “United States Wins Trade Enforcement Case for American Farmers, Proves Export-
Blocking Chinese Duties Unjustified Under WTO Rules,” Press release Aug. 2013. 132 USTR, “World Trade Organization Adopts Report Ruling in Favor of the United States in Chicken
Products Trade Dispute with China,” Press release Sept. 2013. 133 USTR, 2012 Sanitary/Phytosanitary Report, March 2012; USDA, FSIS, Export Requirements for
People’s Republic of China, December 23, 2010; USTR, 2010 Report on Sanitary and Phytosanitary Measures, 2010, 35. The World Organisation for Animal Health (OIE) distinguishes between LPAI and HPAI. Under OIE rules, both types of AI must be reported, but OIE guidelines require member countries to permit imports of poultry from a country, zone, or compartment that has LPAI but is free of HPAI.
30
effect for poultry producers in Arkansas, New York, and Virginia.134 In the view of U.S. officials, China’s ban on the basis of the presence of LPAI appears to be contrary to the internationally accepted standard. 135 China also restricted U.S. access to its market through the intermittent application of a zero-tolerance pathogen standard on U.S. poultry for salmonella, E. coli, and listeria. According to the Office of the United States Trade Representative (USTR), China’s standard is not based on scientific principles, nor is it consistently applied.136 Moreover, USTR maintains that China does not appear to apply this to its domestically-produced poultry meat.137
The Chinese government monitors poultry imports through Automatic Registration Forms (ARFs).138 An importer must obtain an ARF from China’s Ministry of Commerce (MOFCOM), but only certain entities in China are eligible to apply for an ARF.139 The purported purpose of the ARF is to gather information, thus enabling the Chinese government to monitor the amount of poultry being imported.140 However, two problems have reportedly arisen from China’s administration of ARFs: the ARF does not always appear to be issued automatically, and reportedly, the ARF has been used to slow the entry process during periods of trade tension, such as after the U.S. imposition of safeguard import duties on Chinese tires in 2009.141 Additionally, when the ARF for poultry was first established, only 73 entities, many of them not poultry importers, were allowed to receive an ARF. As of 2010, U.S. industry officials stated that about 200 entities had access to an ARF to import poultry, but the updated list of companies had not been made public.142
Mexico
Although Mexican imports of U.S. chicken leg quarters were subject to TRQs from mid-2003 to year-end 2007, all U.S. poultry has entered Mexico duty-free since January 1, 2008. Periodically during 2006–12, however, Mexico imposed poultry import bans on different U.S. states and counties or third counties due to LPAI outbreaks.143 On February 8, 2011, Mexico’s Secretariat of the Economy announced that it had initiated an AD investigation of U.S. chicken products covered under Harmonized Schedule (HS) numbers 0207.13.03 and 0207.14.04, which include chicken leg quarters and thighs.144 In August 2012, the Mexican government announced both the investigation’s final AD rates
134 USDA, FSIS, Export Requirements for People’s Republic of China, January 3, 2012; Johnston, “China lifts bans on Texas, Penn. Poultry,” April 23, 2013.
135 USTR, 2012 Sanitary/ Phytosanitary Report, March 2012, 33; USTR, 2009 National Trade Estimate Report, March 2009, 95; USTR, 2010 Report on Sanitary and Phytosanitary Measures, 2010, 35.
136 USTR, 2012 Sanitary/Phytosanitary Report, March 2012, 33. 137 USTR, 2012 Sanitary/Phytosanitary Report, March 2012, 33; USITC, China’s Agricultural Trade,
March 2011, 9-7. 138 USITC, China’s Agricultural Trade, March 2011, 9-11. 139 Many of these entities were, reportedly, not themselves poultry importers, but instead sold the
import permits to traders, imposing an additional cost on imports. USDA, FAS, China: FAIRS Export Certificate Report, December 7, 2009, 8; industry official, interview by USITC staff, Hong Kong, September 20, 2010.
140 Industry representative, interview by USITC staff, Hong Kong, September 20, 2010. 141 USITC, China’s Agricultural Trade, March 2011, 9-11. 142 USITC, China’s Agricultural Trade, March 2011, 9-11; industry representative, interview by
USITC staff, Hong Kong, September 20, 2010. 143 See e.g., USDA, FAS, Mexico: Poultry and Products, September 2, 2008, 11; USDA, FAS, Mexico
Bans Poultry, April 17, 2009; USDA, FAS, Mexico Bans Poultry Products from Polk County, April 8, 2011. 144 USDA, AMS, International Egg and Poultry Review, February 7, 2011. HS 0207.13 covers fresh
and chilled product. HS 0207.14 covers frozen product. Mexico receives more fresh or chilled product than other countries importing U.S. poultry. Most, if not all, of the exports to Russia and China are frozen. See Mexico’s tariff schedule available at: http://www.siicex-caaarem.org.mx/
31
ranging from 25.7 percent ad valorem to 127.5 percent ad valorem, depending on the company. 145 However, the Mexican government also announced that, due to a high pathogen avian influenza (HPAI) outbreak in the state of Jalisco, AD duties will not be imposed until further notice. 146 As of August 2013, the AD duties still had not been imposed on U.S. broiler imports because further HPAI outbreaks occurred in Jalisco and other Mexican states in 2013.
Canada
Canada maintains TRQs for many poultry products. All U.S. poultry products subject to the TRQ that enter Canada within the quota limits have a zero tariff,147 and imports in excess of those quota levels are subject to tariff rates between 154.5 percent and 253 percent ad valorem. 148 The TRQs, which Canada uses to help manage supply of chicken and turkey, limit the ability of U.S. producers to increase exports to Canada.149 Russia
Russia maintains a number of measures which effectively restrict imports of U.S. poultry. Russia has reduced its in-quota TRQ ceilings between 2008 and 2012, thereby reducing the quantity of poultry imports eligible to enter at lower in-quota tariff rates, in an effort to reduce poultry imports to promote domestic self-sufficiency in poultry production.150 In 2010, the in-quota tariff stood at 25 percent ad valorem and the over-quota tariff rate was 95 percent ad valorem but not less than €0.80 ($1.06) per kg.151 In addition to tariffs, poultry imports are subject to a value-added tax (VAT) of 18 percent ad valorem on the cost, insurance, and freight (CIF) value plus duty price, and a “customs procedure fee” (for processing a customs entry) of 0.15 percent of the CIF value of the shipment.152 In 2012, Russia divided its single global poultry TRQ into three separate TRQs, two of which are global and a third which provides country-specific allocations mainly to the EU.153
Some NTMs also restrict access of U.S. poultry to the Russian market. In 2010, Russia banned entry of poultry treated with a chlorine rinse to reduce pathogens. Although this ban applied to chlorine-washed poultry from all countries, it primarily affected the United States where this PRT practice is standard. Russia subsequently approved an export certification system in mid-2010 for U.S. poultry treated other than with chlorine.154 In 2010 and 2011, Russia also banned the use of frozen poultry in a number of specialty
145 The Poultry Site, CME: “US/Mexico Anti-Dumping Saga Continues,” August 8, 2012. The AD rate of 25.7 percent ad valorem applies to Simmons, Tyson, Sanderson, and Pilgrim’s Pride, while all other U.S. companies will be assessed at the 127.5 percent ad valorem rate.
146 The Poultry Site, CME: “US/Mexico Anti-Dumping Saga Continues,” August 8, 2012. 147 CBSA, Customs Tariff, August 17, 2011. 148 Products also have a minimum tariff rate, either a price per kg or a price per bird, which varies by
product. 149 USTR, 2012 National Trade Estimate Report, March 2012, 53 150 USDA, FAS, Russian Federation: Poultry Semi-Annual Report; 2009, March 13, 2009, 9. See
“Foreign Industry Profiles” for further details on Russia’s tariffs, TRQs, and NTMs. 151 U.S. government official, e-mail to USITC staff, April 22, 2011; IMF, Exchange Rate Query Tool
(accessed December 21, 2011). 152 AriVist.com, “Customs Clearance in Russia” (accessed August 3, 2011); Management Dynamics,
“Country Summaries: Russia,” January 24, 2008; USAPEEC, “Russia: Tariffs and Quantitative Restrictions for Poultry” (accessed September 15, 2009).
153 USTR, 2012 National Trade Estimate Report, March 2012, 324. 154 Bottemiller, “Russia Agrees to Lift Ban,” June 25, 2010; USDA, FAS, Russian Federation: Russia
Resumes Imports, September 21, 2010. 32
products, including baby foods and diet foods.155 These restrictions go beyond the normal regulations affecting frozen-food imports, which set an upper limit on the amount of water in frozen and chilled chicken.156 Russia claims that these bans were enacted for health and safety reasons, but U.S. industry officials view the ban as lacking scientific basis, and view it as another effort to promote self-sufficiency in poultry.157
U.S. Imports
Import Levels
Between 2006 and 2012, the value of U.S. imports rose sharply, but remained at low levels compared with the value of U.S. exports. In 2012, major imported items were fresh, chilled, or frozen poultry (53 percent); prepared and preserved poultry (35 percent); and live birds (12 percent). U.S. imports of fresh, chilled, or frozen poultry grew 130 percent in 2006–12, rising from $87 million to $200 million (table 11). A $98 million increase in imports of chicken cuts, mostly frozen, accounted for the majority of this growth. Growth in imports of poultry cuts was partially offset by a 36 percent decline in imports of whole chickens, turkeys, and “other poultry” during 2006–12. U.S. imports of prepared or preserved poultry grew more slowly than those of uncooked poultry, increasing 68 percent between 2006 and 2012.158 During 2006–10, U.S. imports of live birds increased by only 2 percent. However, between 2010 and 2012 U.S. imports of live birds grew 43 percent from 2010 levels. Almost one-half of U.S. imports of live poultry were birds (other than chickens) not over 185 grams (6.5 ounces) in weight.
Principal Suppliers
Between 2006 and 2012, the vast majority of U.S. poultry meat159 imports came from Canada, reflecting a number of factors, including: a zero tariff rate under NAFTA, proximity to the U.S. market, and Canada’s IREP for poultry meat to be further processed and re-exported as finished products.160 Until 2008, Mexico was the second-largest supplier of poultry meat to the United States. Like Canada, Mexico benefits from proximity to the U.S. market and a zero tariff under NAFTA. However, Mexico is currently a net poultry meat importer and is not a large exporter of poultry meat. Mexico’s share of U.S. imports declined from just under 10 percent of U.S. imports in 2006 to 4 percent during 2010–12 (in terms of both volume and value) (table 12).
155 USDA, FAS, Russian Federation: Poultry Annual Report; 2008, September 15, 2008, 1; USDA, FAS, Russian Federation: Frozen Poultry Use, December 29, 2010; USDA, FAS, Russian Federation: Big Moves to Self-Sufficiency, April 6, 2010, 8; USDA, FAS, Russian Federation: Frozen Poultry Use, December 29, 2010.
156 USTR, 2009 National Trade Estimate Report, March 2009, 418. 157 USDA, FAS, Russian Federation, Frozen Poultry Use, December 29, 2010; Bottemiller, “Russia
Agrees to Lift Ban,” June 25, 2010; WattAgNet, “New Regulation Prohibits Imports of Poultry Meat Treated with Chlorine of a Certain Concentration,” September 11, 2009; Schwirtz, “Russia Seeks to Cleanse Its Palate,” January 19, 2010; USDA, FAS, Russian Federation: Poultry Semi-Annual Report, 2009, May 13, 2009.
158 Prepared poultry products are covered by HTS headings 1602.31, 1602.32, and 1602.39. 159 Based on HTS 0207, 1602.31, 1602.32, and 1602.39. 160 Described in the “Canada” section below.
33
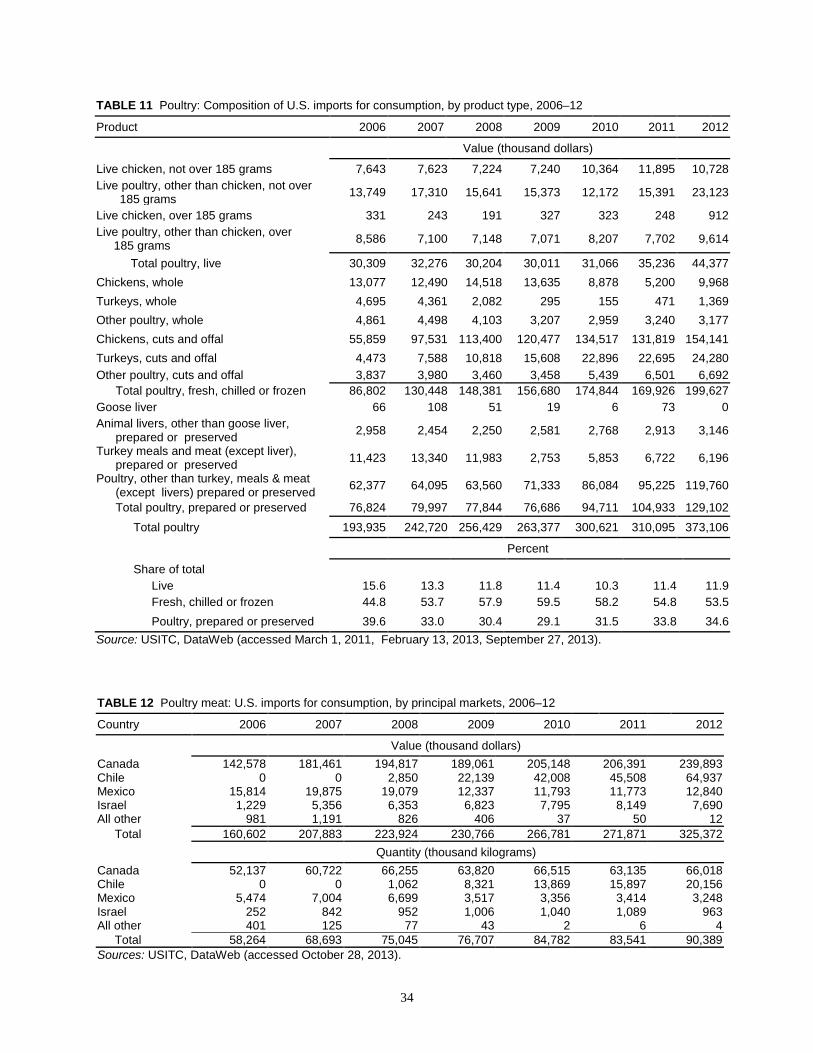
TABLE 11 Poultry: Composition of U.S. imports for consumption, by product type, 2006–12
Product 2006 2007 2008 2009 2010 2011 2012
Value (thousand dollars)
Live chicken, not over 185 grams 7,643 7,623 7,224 7,240 10,364 11,895 10,728 Live poultry, other than chicken, not over 185 grams 13,749 17,310 15,641 15,373 12,172 15,391 23,123
Live chicken, over 185 grams 331 243 191 327 323 248 912 Live poultry, other than chicken, over 185 grams 8,586 7,100 7,148 7,071 8,207 7,702 9,614
Total poultry, live 30,309 32,276 30,204 30,011 31,066 35,236 44,377 Chickens, whole 13,077 12,490 14,518 13,635 8,878 5,200 9,968 Turkeys, whole 4,695 4,361 2,082 295 155 471 1,369 Other poultry, whole 4,861 4,498 4,103 3,207 2,959 3,240 3,177 Chickens, cuts and offal 55,859 97,531 113,400 120,477 134,517 131,819 154,141 Turkeys, cuts and offal 4,473 7,588 10,818 15,608 22,896 22,695 24,280 Other poultry, cuts and offal 3,837 3,980 3,460 3,458 5,439 6,501 6,692 Total poultry, fresh, chilled or frozen 86,802 130,448 148,381 156,680 174,844 169,926 199,627 Goose liver 66 108 51 19 6 73 0 Animal livers, other than goose liver, prepared or preserved 2,958 2,454 2,250 2,581 2,768 2,913 3,146
Turkey meals and meat (except liver), prepared or preserved 11,423 13,340 11,983 2,753 5,853 6,722 6,196
Poultry, other than turkey, meals & meat (except livers) prepared or preserved 62,377 64,095 63,560 71,333 86,084 95,225 119,760
Total poultry, prepared or preserved 76,824 79,997 77,844 76,686 94,711 104,933 129,102 Total poultry 193,935 242,720 256,429 263,377 300,621 310,095 373,106
Percent
Share of total
Live 15.6 13.3 11.8 11.4 10.3 11.4 11.9 Fresh, chilled or frozen 44.8 53.7 57.9 59.5 58.2 54.8 53.5 Poultry, prepared or preserved 39.6 33.0 30.4 29.1 31.5 33.8 34.6 Source: USITC, DataWeb (accessed March 1, 2011, February 13, 2013, September 27, 2013).
TABLE 12 Poultry meat: U.S. imports for consumption, by principal markets, 2006–12
Country 2006 2007 2008 2009 2010 2011 2012
Value (thousand dollars) Canada 142,578 181,461 194,817 189,061 205,148 206,391 239,893 Chile 0 0 2,850 22,139 42,008 45,508 64,937 Mexico 15,814 19,875 19,079 12,337 11,793 11,773 12,840 Israel 1,229 5,356 6,353 6,823 7,795 8,149 7,690 All other 981 1,191 826 406 37 50 12 Total 160,602 207,883 223,924 230,766 266,781 271,871 325,372
Quantity (thousand kilograms) Canada 52,137 60,722 66,255 63,820 66,515 63,135 66,018 Chile 0 0 1,062 8,321 13,869 15,897 20,156 Mexico 5,474 7,004 6,699 3,517 3,356 3,414 3,248 Israel 252 842 952 1,006 1,040 1,089 963 All other 401 125 77 43 2 6 4 Total 58,264 68,693 75,045 76,707 84,782 83,541 90,389 Sources: USITC, DataWeb (accessed October 28, 2013).
34
Chile obtained access to the U.S. market in December 2007, when the FSIS determined that Chile’s poultry meat inspection system was equivalent to that in the United States.161 The first shipments of Chilean poultry meat entered the United States in 2008, with imports amounting to $2.9 million that year. By 2012, imports rose to $64.9 million, accounting for about 20 percent of all U.S. poultry meat imports in terms of value and 22 percent of volume.
U.S. Trade Measures
Tariff Measures
U.S. tariffs on poultry imports generally are low.162 For example, in 2012, the ad valorem equivalent tariff was less than 0.5 percent on live birds; less than 3 percent on fresh, chilled, or frozen whole birds; and about 7 percent on poultry cuts. In addition, most U.S. poultry imports are sourced from countries with free trade agreements with the United States, so dutiable imports are negligible. Nontariff Measures
U.S. imports of live poultry and poultry meat are subject to the PPIA, as amended, and as administered by the USDA’s FSIS.163 These regulations require that poultry meat imports be healthful, wholesome, and fit for human consumption, and that they comply with any standards, rules, and regulations that apply to domestic like products (U.S.-produced poultry meat). Poultry and poultry products may be imported only from countries and plants whose output FSIS considers equivalent in safety to U.S.-produced foods, based on the application of sanitary measures that protect against food hazards.164 Additionally, countries may not ship product to the United States if they have been restricted by the USDA’s Animal and Plant Health Inspection Service (APHIS) due to the presence of certain poultry diseases—such as HPAI—in their flocks. APHIS also requires that live poultry imports from all countries, except Canada, be quarantined for 30 days and be tested for communicable poultry diseases; 165 Canadian live poultry need only be accompanied by a veterinary certification that is less than 30 days old. As of early 2013, the only five countries approved to export both raw and processed poultry meat to the United States were Canada, Chile, France, Mexico (with certain restrictions), and the United Kingdom.166
161 Eligibility of Chile to Export Poultry and Poultry Products to the United States, 72 Fed. Reg. 61793 (November 1, 2007).
162 HTSUS subheadings and rates of duty applicable to U.S. imports of live poultry, poultry meat, and prepared or preserved poultry meat covered by this summary are shown in appendix A.5.
163 PPIA, 21 U.S.C. 451 (et seq.) (accessed November 2, 2009). 164 USDA, FSIS, “Regulations & Policies Equivalence Process” (accessed November 2, 2009). 165 For further detail see USDA, APHIS, “Animal and Animal Product Import: Live Poultry,”
(March 6, 2012). 166 USDA, FSIS, “Countries/Products Eligible for Export to the United States,” May 1, 2013. In
addition, Australia and New Zealand are approved to export raw and processed ratite (flightless bird) meat, but no other types of poultry meat.
35
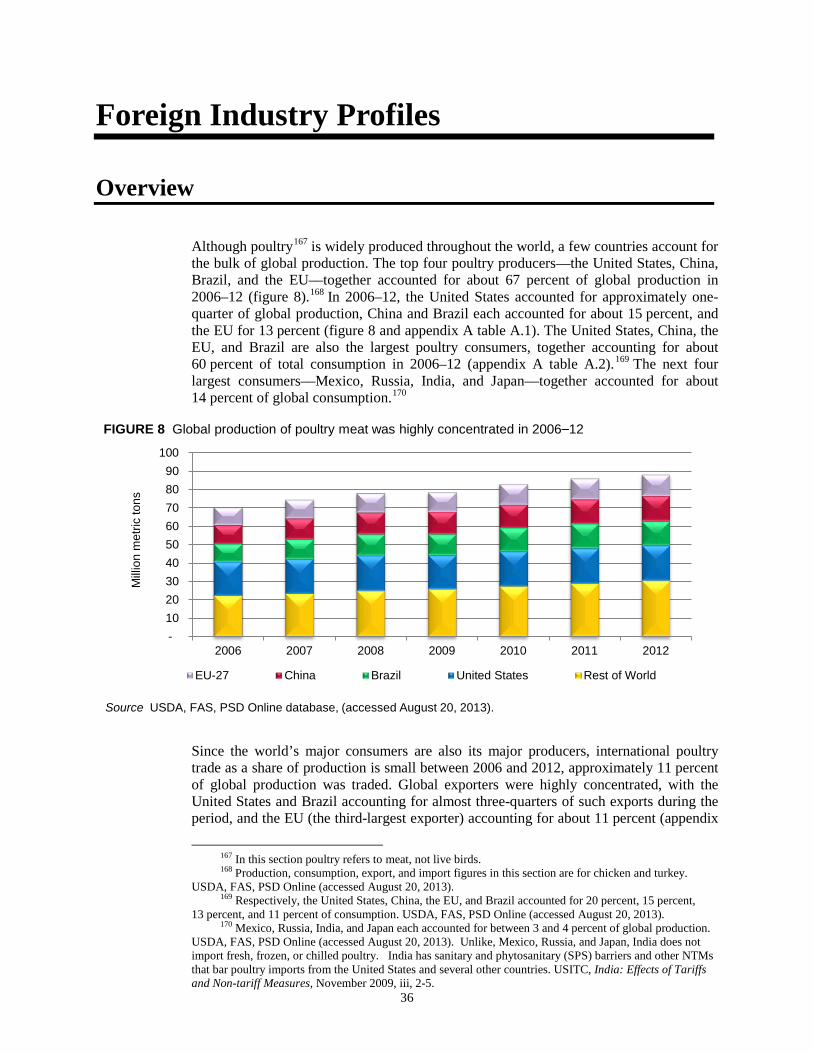
Foreign Industry Profiles
Overview
Although poultry167 is widely produced throughout the world, a few countries account for the bulk of global production. The top four poultry producers––the United States, China, Brazil, and the EU––together accounted for about 67 percent of global production in 2006–12 (figure 8).168 In 2006–12, the United States accounted for approximately one- quarter of global production, China and Brazil each accounted for about 15 percent, and the EU for 13 percent (figure 8 and appendix A table A.1). The United States, China, the EU, and Brazil are also the largest poultry consumers, together accounting for about 60 percent of total consumption in 2006–12 (appendix A table A.2).169 The next four largest consumers––Mexico, Russia, India, and Japan––together accounted for about 14 percent of global consumption.170 Since the world’s major consumers are also its major producers, international poultry trade as a share of production is small between 2006 and 2012, approximately 11 percent of global production was traded. Global exporters were highly concentrated, with the United States and Brazil accounting for almost three-quarters of such exports during the period, and the EU (the third-largest exporter) accounting for about 11 percent (appendix
167 In this section poultry refers to meat, not live birds. 168 Production, consumption, export, and import figures in this section are for chicken and turkey.
USDA, FAS, PSD Online (accessed August 20, 2013). 169 Respectively, the United States, China, the EU, and Brazil accounted for 20 percent, 15 percent,
13 percent, and 11 percent of consumption. USDA, FAS, PSD Online (accessed August 20, 2013). 170 Mexico, Russia, India, and Japan each accounted for between 3 and 4 percent of global production.
USDA, FAS, PSD Online (accessed August 20, 2013). Unlike, Mexico, Russia, and Japan, India does not import fresh, frozen, or chilled poultry. India has sanitary and phytosanitary (SPS) barriers and other NTMs that bar poultry imports from the United States and several other countries. USITC, India: Effects of Tariffs and Non-tariff Measures, November 2009, iii, 2-5.
36
- 10 20 30 40 50 60 70 80 90
100
2006 2007 2008 2009 2010 2011 2012
Mill
ion
met
ric to
ns
EU-27 China Brazil United States Rest of World
Source USDA, FAS, PSD Online database, (accessed August 20, 2013).
FIGURE 8 Global production of poultry meat was highly concentrated in 2006–12
A table A.3). The fourth-largest exporter, Thailand, is the only major exporter that is not a major producer. Both Brazil and Thailand have highly export-oriented poultry industries. China, which is a much larger producer than Thailand, was the fifth-largest global exporter. Both Thailand and China accounted for about 4 percent of poultry exports in 2006–12. Global imports became less concentrated between and 2006 and 2011. The share of global imports by the top five markets––the EU, Japan, Mexico, Saudi Arabia, and Russia––declined from over one-half in 2006 to 43 percent in 2012 due to a drop in imports by Russia, related to actions aimed at reducing its import dependency (appendix A table A.4).171 The type of poultry product imported differs among importing countries. For example, China was a major global market for chicken paws, and Russia was a principal buyer of dark meat, mainly in the form of chicken leg quarters. Moreover, Saudi Arabia and other Islamic countries usually import halal poultry products.172
During 2006–12, there were a small number of major poultry trade flows. These included the United States supplying Russia, China, Mexico, and Canada, while Brazil supplied Saudi Arabia, Japan, Hong Kong, and the EU (figure 9).
Global Net Exporters
Brazil
Global Position Brazilian poultry production grew 36 percent between 2006 and 2012 (table 13). As a result of its rapid increase in production in 2006, Brazil surpassed the EU to become the third-largest poultry producer in the world. Brazil held this position for most of 2006–12, although in 2010 and 2011, it took China’s spot as the second-largest producer after the United States (appendix A table A.1). Overall, Brazil is home to three of Latin America’s largest poultry producers: Brazil Foods (BRF), Marfrig Frigorificos e Comercio de Alimentos S.A. (Marfrig), and Doux Frangosul S/A Agro Avicola Industrial (Doux Frangosul). 173 Even with a 39 percent rise in consumption between 2006-2011, 174 Brazil’s domestic poultry production was more than sufficient to meet its domestic consumption needs. Brazil imported only nominal amounts of poultry during 2006–12.
171 The top five importers for most, although not all, of 2006–12 were EU, Japan, Mexico, Saudi Arabia, and Russia.
172 Halal is the Arabic word meaning “lawful” or “permitted.” Although there are currently no universal halal food production standards or certifications, broadly, halal refers to food that is produced in accordance with Islamic law. See, for example, USDA, FAS, Indonesia: Approved U.S. Halal Certifying Bodies, March 22, 2011; USDA, FAS, Malaysia: Poultry and Products Annual, September 2, 2005, 7–9; USDA, AMS, International Egg and Poultry Review, June 26, 2007.
173 Clements, “Latin America’s Top Poultry Producers,” December 2010, 25. In 2007, the five largest Brazilian poultry companies were expected to account for 41 percent of all Latin American production. The share of production by the top producers has probably grown as the industry has further consolidated since 2007. The two largest Brazilian poultry companies, Sadia and Perdigão, merged to form BRF in 2009, although the deal did not receive final approval until mid-2011. In January 2010, Marfrig finalized its takeover of Seara Alimentos, which was one of the top five poultry producers in Brazil. Shane, “Has the ‘Brazilian Giant’ Stumbled?” January 2007, 20; WattAgNet, “Perdigão Combines with Sadia to Form Brasil Foods,” May 19, 2009; WattAgNet, “Marfrig,” (accessed March 7, 2010).
174 Brazil’s consumption fell by 3 percent between 2011 and 2012. 37
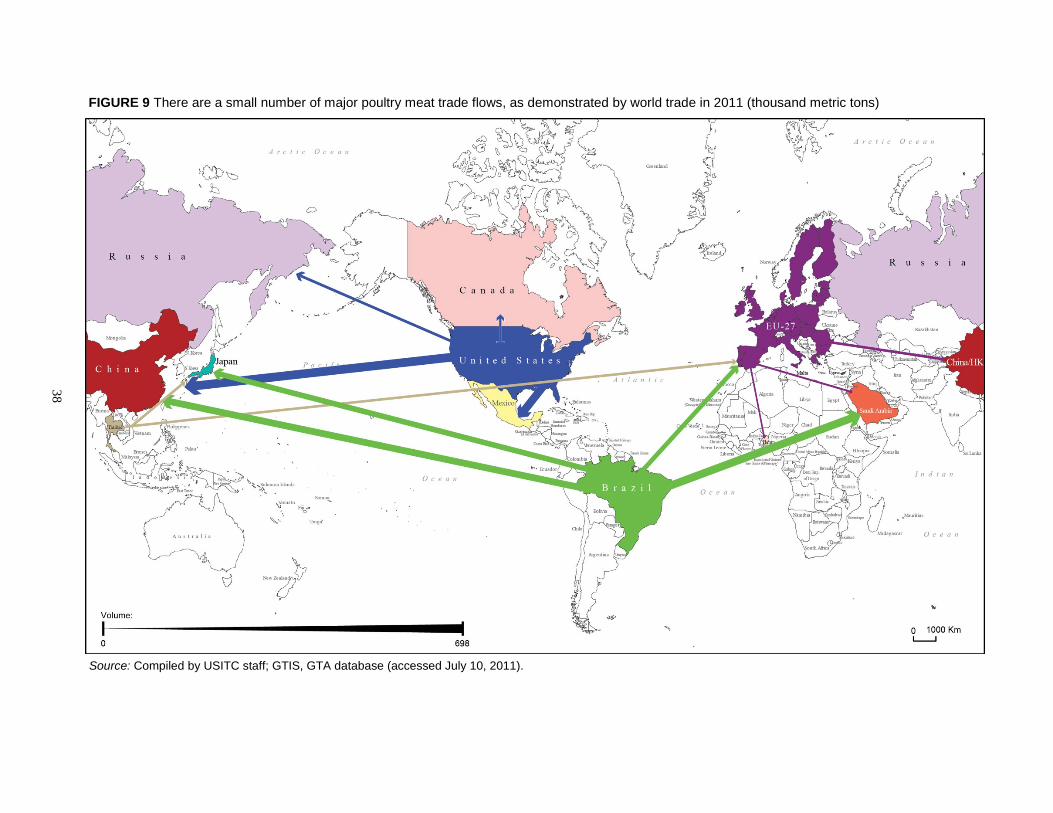
FIGURE 9 There are a small number of major poultry meat trade flows, as demonstrated by world trade in 2011 (thousand metric tons)
Source: Compiled by USITC staff; GTIS, GTA database (accessed July 10, 2011).
38
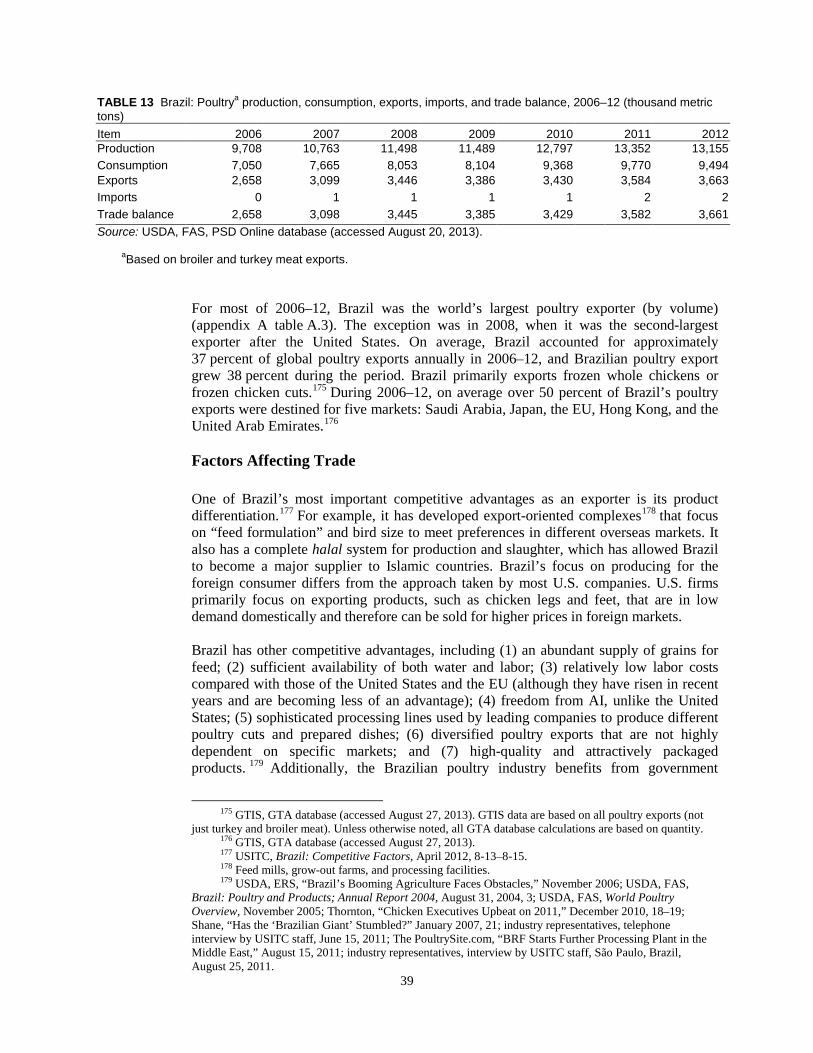
TABLE 13 Brazil: Poultrya production, consumption, exports, imports, and trade balance, 2006–12 (thousand metric tons) Item 2006 2007 2008 2009 2010 2011 2012 Production 9,708 10,763 11,498 11,489 12,797 13,352 13,155 Consumption 7,050 7,665 8,053 8,104 9,368 9,770 9,494 Exports 2,658 3,099 3,446 3,386 3,430 3,584 3,663 Imports 0 1 1 1 1 2 2 Trade balance 2,658 3,098 3,445 3,385 3,429 3,582 3,661 Source: USDA, FAS, PSD Online database (accessed August 20, 2013). aBased on broiler and turkey meat exports.
For most of 2006–12, Brazil was the world’s largest poultry exporter (by volume) (appendix A table A.3). The exception was in 2008, when it was the second-largest exporter after the United States. On average, Brazil accounted for approximately 37 percent of global poultry exports annually in 2006–12, and Brazilian poultry export grew 38 percent during the period. Brazil primarily exports frozen whole chickens or frozen chicken cuts.175 During 2006–12, on average over 50 percent of Brazil’s poultry exports were destined for five markets: Saudi Arabia, Japan, the EU, Hong Kong, and the United Arab Emirates.176 Factors Affecting Trade
One of Brazil’s most important competitive advantages as an exporter is its product differentiation.177 For example, it has developed export-oriented complexes178 that focus on “feed formulation” and bird size to meet preferences in different overseas markets. It also has a complete halal system for production and slaughter, which has allowed Brazil to become a major supplier to Islamic countries. Brazil’s focus on producing for the foreign consumer differs from the approach taken by most U.S. companies. U.S. firms primarily focus on exporting products, such as chicken legs and feet, that are in low demand domestically and therefore can be sold for higher prices in foreign markets. Brazil has other competitive advantages, including (1) an abundant supply of grains for feed; (2) sufficient availability of both water and labor; (3) relatively low labor costs compared with those of the United States and the EU (although they have risen in recent years and are becoming less of an advantage); (4) freedom from AI, unlike the United States; (5) sophisticated processing lines used by leading companies to produce different poultry cuts and prepared dishes; (6) diversified poultry exports that are not highly dependent on specific markets; and (7) high-quality and attractively packaged products. 179 Additionally, the Brazilian poultry industry benefits from government
175 GTIS, GTA database (accessed August 27, 2013). GTIS data are based on all poultry exports (not just turkey and broiler meat). Unless otherwise noted, all GTA database calculations are based on quantity.
176 GTIS, GTA database (accessed August 27, 2013). 177 USITC, Brazil: Competitive Factors, April 2012, 8-13–8-15. 178 Feed mills, grow-out farms, and processing facilities. 179 USDA, ERS, “Brazil’s Booming Agriculture Faces Obstacles,” November 2006; USDA, FAS,
Brazil: Poultry and Products; Annual Report 2004, August 31, 2004, 3; USDA, FAS, World Poultry Overview, November 2005; Thornton, “Chicken Executives Upbeat on 2011,” December 2010, 18–19; Shane, “Has the ‘Brazilian Giant’ Stumbled?” January 2007, 21; industry representatives, telephone interview by USITC staff, June 15, 2011; The PoultrySite.com, “BRF Starts Further Processing Plant in the Middle East,” August 15, 2011; industry representatives, interview by USITC staff, São Paulo, Brazil, August 25, 2011.
39
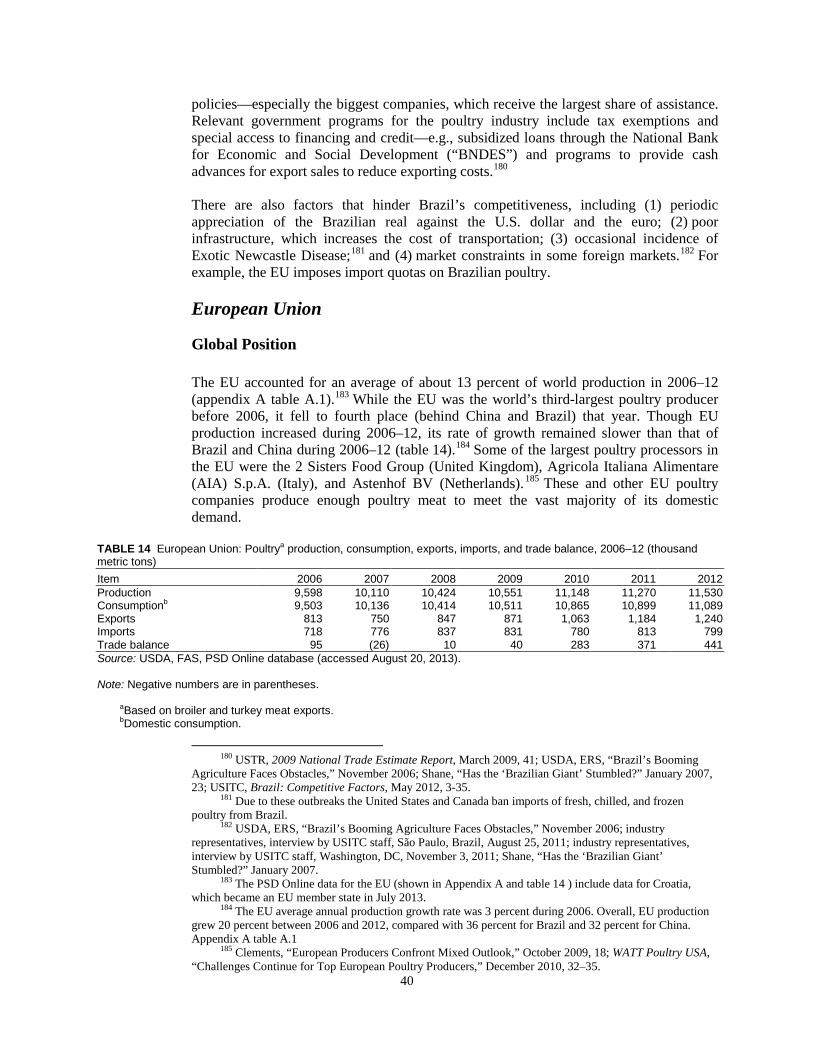
policies—especially the biggest companies, which receive the largest share of assistance. Relevant government programs for the poultry industry include tax exemptions and special access to financing and credit—e.g., subsidized loans through the National Bank for Economic and Social Development (“BNDES”) and programs to provide cash advances for export sales to reduce exporting costs.180
There are also factors that hinder Brazil’s competitiveness, including (1) periodic appreciation of the Brazilian real against the U.S. dollar and the euro; (2) poor infrastructure, which increases the cost of transportation; (3) occasional incidence of Exotic Newcastle Disease;181 and (4) market constraints in some foreign markets.182 For example, the EU imposes import quotas on Brazilian poultry.
European Union
Global Position
The EU accounted for an average of about 13 percent of world production in 2006–12 (appendix A table A.1).183 While the EU was the world’s third-largest poultry producer before 2006, it fell to fourth place (behind China and Brazil) that year. Though EU production increased during 2006–12, its rate of growth remained slower than that of Brazil and China during 2006–12 (table 14).184 Some of the largest poultry processors in the EU were the 2 Sisters Food Group (United Kingdom), Agricola Italiana Alimentare (AIA) S.p.A. (Italy), and Astenhof BV (Netherlands). 185 These and other EU poultry companies produce enough poultry meat to meet the vast majority of its domestic demand.
TABLE 14 European Union: Poultrya production, consumption, exports, imports, and trade balance, 2006–12 (thousand metric tons) Item 2006 2007 2008 2009 2010 2011 2012 Production 9,598 10,110 10,424 10,551 11,148 11,270 11,530 Consumptionb 9,503 10,136 10,414 10,511 10,865 10,899 11,089 Exports 813 750 847 871 1,063 1,184 1,240 Imports 718 776 837 831 780 813 799 Trade balance 95 (26) 10 40 283 371 441 Source: USDA, FAS, PSD Online database (accessed August 20, 2013). Note: Negative numbers are in parentheses. aBased on broiler and turkey meat exports. bDomestic consumption.
180 USTR, 2009 National Trade Estimate Report, March 2009, 41; USDA, ERS, “Brazil’s Booming Agriculture Faces Obstacles,” November 2006; Shane, “Has the ‘Brazilian Giant’ Stumbled?” January 2007, 23; USITC, Brazil: Competitive Factors, May 2012, 3-35.
181 Due to these outbreaks the United States and Canada ban imports of fresh, chilled, and frozen poultry from Brazil.
182 USDA, ERS, “Brazil’s Booming Agriculture Faces Obstacles,” November 2006; industry representatives, interview by USITC staff, São Paulo, Brazil, August 25, 2011; industry representatives, interview by USITC staff, Washington, DC, November 3, 2011; Shane, “Has the ‘Brazilian Giant’ Stumbled?” January 2007.
183 The PSD Online data for the EU (shown in Appendix A and table 14 ) include data for Croatia, which became an EU member state in July 2013.
184 The EU average annual production growth rate was 3 percent during 2006. Overall, EU production grew 20 percent between 2006 and 2012, compared with 36 percent for Brazil and 32 percent for China. Appendix A table A.1
185 Clements, “European Producers Confront Mixed Outlook,” October 2009, 18; WATT Poultry USA, “Challenges Continue for Top European Poultry Producers,” December 2010, 32–35.
40
The EU was the third-largest consumer of poultry in the world in 2006–12, accounting for about 13 percent of global consumption (appendix A table A.2). Consumption grew 17 percent during this period, largely due to a 7 percent increase in 2006–07, as consumption rebounded from decreased demand following AI outbreaks in 2006. Between 2007 and 2012, EU poultry consumption grew at an average rate of about 2 percent per year, a more typical rate for a mature market.
EU exports rose 65 percent between 2007 (its lowest point) and 2012. During this period, the EU was the third-largest poultry exporter in the world (appendix A table A.3) and accounted for an average of 11 percent of world exports, substantially less than United States or Brazil. While the EU is a net exporter in most years, it was also one of the world’s top three importers of poultry during 2006–12 (appendix A table A.4). Between 2006 and 2012, EU imports grew 11 percent and accounted for about one-tenth of global imports annually. These imports mostly consisted of cooked chicken and frozen boneless chicken cuts.186 Factors Affecting Trade
The competitive position of EU poultry exporters is supported by a safe, modern, and integrated production infrastructure and high production levels. Additionally, there are government programs to enhance EU firms’ global competitiveness. For example, export refunds are granted under the EU’s Common Agricultural Policy (CAP) to facilitate certain poultry exports. 187 The meat export refund program currently covers whole chickens sold primarily to the Middle East. 188 Poultry exporters also benefit from government programs and funding to control poultry diseases (e.g., AI and Exotic Newcastle Disease).189
Despite these positive factors, the EU poultry industry is less internationally competitive than its counterparts in the United States and Brazil. Indeed, despite increased exports since 2008, the European Commission (EC) anticipated that poultry exports would decline and imports would increase moderately, thus returning the EU to net importer status by 2020. 190 A number of long-term factors may also hurt the global competitiveness of the EU. Chief among these is the high cost structure of the EU poultry industry, which makes its products more expensive than those of many other countries.191 In addition to high costs for feed, energy, labor, land, and capital,192 regulations and laws
186 GTIS, GTA database (accessed August 27, 2012). 187 Europa, Agriculture and Rural Development, “Agricultural Markets: Poultry Meat,” February 20,
2008; Europa, Agriculture and Rural Development, “The Export of Agricultural Products to Third Countries,” December 17, 2008. Export refunds for “pigs, eggs, and poultry” totaled €201 million in 2008, up from €111 million in 2007. South Centre, EU’s Common Agricultural Policy, March 2011, 9.
188 The HS numbers covered are 0207.12.10.9900, 0207.12.90.9190, and 0207.12.90.9990. The countries covered are Angola, Saudi Arabia, Kuwait, Bahrain, Qatar, Oman, United Arab Emirates, Jordan, Yemen, Lebanon, Iraq, and Iran. EC, Commission Regulation (EC) “Fixing the Export Refunds for Beef and Poultry” (draft), March 17, 2011; government officials, e-mails to USITC staff, January 4, 2010, and April 6, 2011.
189 Government official, e-mail to USITC staff, January 4, 2010; Europa, “Animal Diseases: Eradication and Monitoring Programmes; Legislation” (accessed July 15, 2011).
190 EC, Directorate-General for Agriculture and Rural Development, Prospects for Agricultural Markets and Income in the European Union 2008–2015, March 2009; EC, Directorate-General for Agriculture and Rural Development, Prospects for Agricultural Markets and Income in the EU 2010–2020, December 2010, 27.
191 Van Horne, Production Costs of Broiler Meat, 2009. 192 EC, Directorate-General for Agriculture and Rural Development, Prospects for Agricultural
Markets and Income in the EU 2010–2020, December 2010, 27. 41
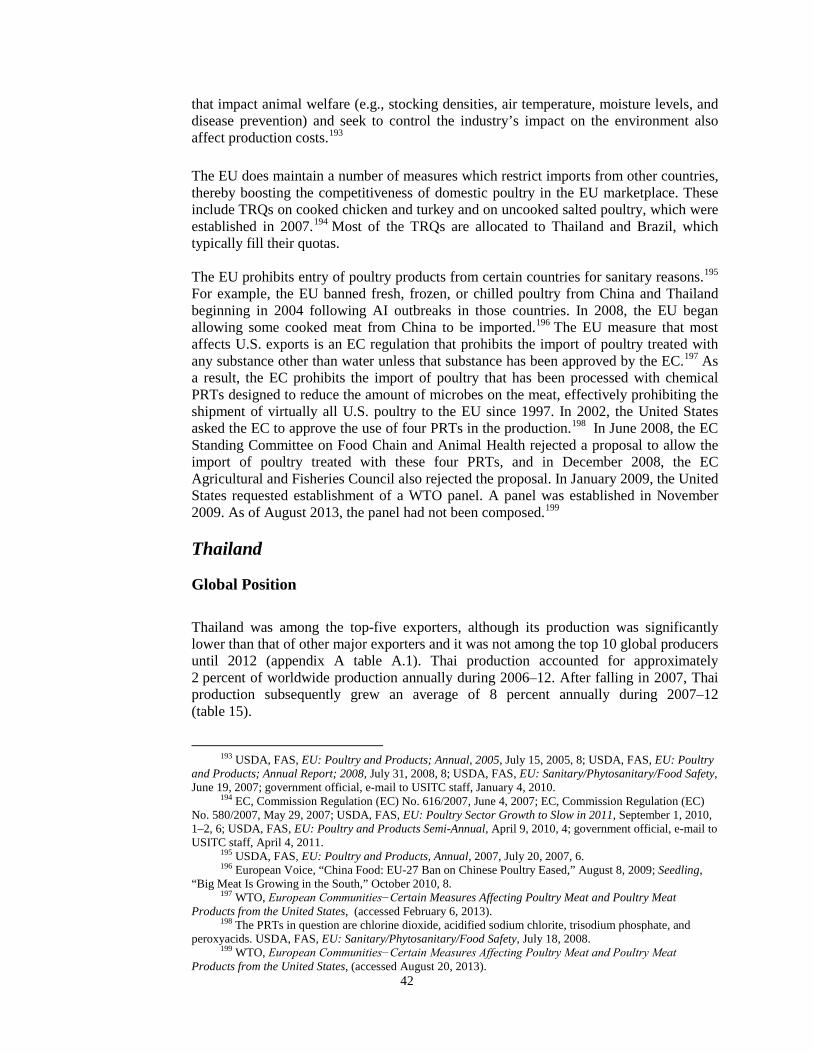
that impact animal welfare (e.g., stocking densities, air temperature, moisture levels, and disease prevention) and seek to control the industry’s impact on the environment also affect production costs.193 The EU does maintain a number of measures which restrict imports from other countries, thereby boosting the competitiveness of domestic poultry in the EU marketplace. These include TRQs on cooked chicken and turkey and on uncooked salted poultry, which were established in 2007.194 Most of the TRQs are allocated to Thailand and Brazil, which typically fill their quotas.
The EU prohibits entry of poultry products from certain countries for sanitary reasons.195 For example, the EU banned fresh, frozen, or chilled poultry from China and Thailand beginning in 2004 following AI outbreaks in those countries. In 2008, the EU began allowing some cooked meat from China to be imported.196 The EU measure that most affects U.S. exports is an EC regulation that prohibits the import of poultry treated with any substance other than water unless that substance has been approved by the EC.197 As a result, the EC prohibits the import of poultry that has been processed with chemical PRTs designed to reduce the amount of microbes on the meat, effectively prohibiting the shipment of virtually all U.S. poultry to the EU since 1997. In 2002, the United States asked the EC to approve the use of four PRTs in the production.198 In June 2008, the EC Standing Committee on Food Chain and Animal Health rejected a proposal to allow the import of poultry treated with these four PRTs, and in December 2008, the EC Agricultural and Fisheries Council also rejected the proposal. In January 2009, the United States requested establishment of a WTO panel. A panel was established in November 2009. As of August 2013, the panel had not been composed.199
Thailand
Global Position
Thailand was among the top-five exporters, although its production was significantly lower than that of other major exporters and it was not among the top 10 global producers until 2012 (appendix A table A.1). Thai production accounted for approximately 2 percent of worldwide production annually during 2006–12. After falling in 2007, Thai production subsequently grew an average of 8 percent annually during 2007–12 (table 15).
193 USDA, FAS, EU: Poultry and Products; Annual, 2005, July 15, 2005, 8; USDA, FAS, EU: Poultry and Products; Annual Report; 2008, July 31, 2008, 8; USDA, FAS, EU: Sanitary/Phytosanitary/Food Safety, June 19, 2007; government official, e-mail to USITC staff, January 4, 2010.
194 EC, Commission Regulation (EC) No. 616/2007, June 4, 2007; EC, Commission Regulation (EC) No. 580/2007, May 29, 2007; USDA, FAS, EU: Poultry Sector Growth to Slow in 2011, September 1, 2010, 1–2, 6; USDA, FAS, EU: Poultry and Products Semi-Annual, April 9, 2010, 4; government official, e-mail to USITC staff, April 4, 2011.
195 USDA, FAS, EU: Poultry and Products, Annual, 2007, July 20, 2007, 6. 196 European Voice, “China Food: EU-27 Ban on Chinese Poultry Eased,” August 8, 2009; Seedling,
“Big Meat Is Growing in the South,” October 2010, 8. 197 WTO, European Communities−Certain Measures Affecting Poultry Meat and Poultry Meat
Products from the United States, (accessed February 6, 2013). 198 The PRTs in question are chlorine dioxide, acidified sodium chlorite, trisodium phosphate, and
peroxyacids. USDA, FAS, EU: Sanitary/Phytosanitary/Food Safety, July 18, 2008. 199 WTO, European Communities−Certain Measures Affecting Poultry Meat and Poultry Meat
Products from the United States, (accessed August 20, 2013). 42
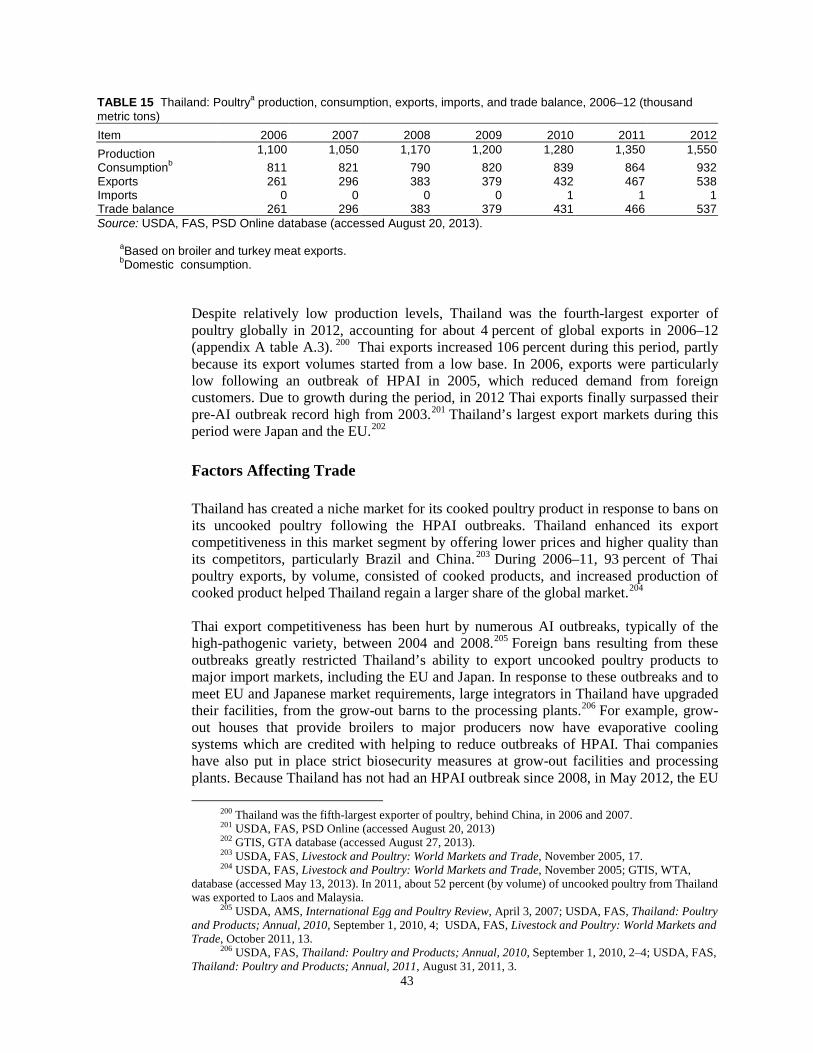
TABLE 15 Thailand: Poultrya production, consumption, exports, imports, and trade balance, 2006–12 (thousand metric tons) Item 2006 2007 2008 2009 2010 2011 2012 Production 1,100 1,050 1,170 1,200 1,280 1,350 1,550 Consumptionb 811 821 790 820 839 864 932 Exports 261 296 383 379 432 467 538 Imports 0 0 0 0 1 1 1 Trade balance 261 296 383 379 431 466 537 Source: USDA, FAS, PSD Online database (accessed August 20, 2013).
aBased on broiler and turkey meat exports. bDomestic consumption.
Despite relatively low production levels, Thailand was the fourth-largest exporter of poultry globally in 2012, accounting for about 4 percent of global exports in 2006–12 (appendix A table A.3). 200 Thai exports increased 106 percent during this period, partly because its export volumes started from a low base. In 2006, exports were particularly low following an outbreak of HPAI in 2005, which reduced demand from foreign customers. Due to growth during the period, in 2012 Thai exports finally surpassed their pre-AI outbreak record high from 2003.201 Thailand’s largest export markets during this period were Japan and the EU.202 Factors Affecting Trade
Thailand has created a niche market for its cooked poultry product in response to bans on its uncooked poultry following the HPAI outbreaks. Thailand enhanced its export competitiveness in this market segment by offering lower prices and higher quality than its competitors, particularly Brazil and China.203 During 2006–11, 93 percent of Thai poultry exports, by volume, consisted of cooked products, and increased production of cooked product helped Thailand regain a larger share of the global market.204
Thai export competitiveness has been hurt by numerous AI outbreaks, typically of the high-pathogenic variety, between 2004 and 2008.205 Foreign bans resulting from these outbreaks greatly restricted Thailand’s ability to export uncooked poultry products to major import markets, including the EU and Japan. In response to these outbreaks and to meet EU and Japanese market requirements, large integrators in Thailand have upgraded their facilities, from the grow-out barns to the processing plants.206 For example, grow-out houses that provide broilers to major producers now have evaporative cooling systems which are credited with helping to reduce outbreaks of HPAI. Thai companies have also put in place strict biosecurity measures at grow-out facilities and processing plants. Because Thailand has not had an HPAI outbreak since 2008, in May 2012, the EU
200 Thailand was the fifth-largest exporter of poultry, behind China, in 2006 and 2007. 201 USDA, FAS, PSD Online (accessed August 20, 2013) 202 GTIS, GTA database (accessed August 27, 2013). 203 USDA, FAS, Livestock and Poultry: World Markets and Trade, November 2005, 17. 204 USDA, FAS, Livestock and Poultry: World Markets and Trade, November 2005; GTIS, WTA,
database (accessed May 13, 2013). In 2011, about 52 percent (by volume) of uncooked poultry from Thailand was exported to Laos and Malaysia.
205 USDA, AMS, International Egg and Poultry Review, April 3, 2007; USDA, FAS, Thailand: Poultry and Products; Annual, 2010, September 1, 2010, 4; USDA, FAS, Livestock and Poultry: World Markets and Trade, October 2011, 13.
206 USDA, FAS, Thailand: Poultry and Products; Annual, 2010, September 1, 2010, 2–4; USDA, FAS, Thailand: Poultry and Products; Annual, 2011, August 31, 2011, 3.
43
announced that it would reopen its market to uncooked chicken from Thailand in July 2012, a major gain for Thai exporters.207 As a result, Thai exports of uncooked poultry grew 76 percent between 2011 and 2012 and constituted 17 percent of Thai poultry exports in 2012.208 China
Global Position
In 2012, China was the second-largest poultry producer in the world, accounting for about 15 percent of global production annually in 2006–12 (appendix A table A.1). On average, annual growth was 5 percent in that period (table 16). Part of China’s poultry production increase was a response to the sharp decline in the country’s pork production in 2006 and 2007 following a swine disease outbreak.209 China is also the second-largest poultry consumer in the world, accounting for about 15 percent of global consumption annually in 2006–12. Consumption grew at the same pace as production (5 percent annually). A number of factors drove China’s consumption growth, foremost of which were increased urbanization and rising personal incomes.210
TABLE 16 China: Poultrya production, consumption, exports, imports, and trade balance, 2006–12 (thousand metric tons) Item 2006 2007 2008 2009 2010 2011 2012 Production 10,354 11,296 11,845 12,105 12,556 13,206 13,706 Consumptionb 10,392 11,450 12,004 12,242 12,489 13,055 13,590 Exports 322 358 285 291 379 423 411 Imports 360 512 444 428 312 272 295 Trade balance (38) (154) (159) (137) 67 151 116 Source: USDA, FAS, PSD Online database (accessed August 20, 2013). Note: Negative numbers are in parentheses. aBased on broiler and turkey meat exports. bDomestic consumption.
During 2006–12, China’s exports grew 28 percent and accounted for 4 percent of global exports on average (appendix A table A.3). In 2012, China ranked fifth among poultry-exporting countries. China’s exports accounted for about 3 percent of its total production during 2006–12, the lowest ratio of the top-five global exporters. China’s export levels are relatively low because Chinese consumption has normally been higher than domestic production. However, in 2010 China became a net exporter. In 2006–12, over one-half of China’s exports were cooked chicken, which primarily went to Japan, and about 44 percent were frozen chicken cuts or chilled chicken, which primarily went to Hong Kong.211
207 Rabobank, “The Return of Thai Raw Chicken,” May 2012. 208 GTIS, GTA database (accessed August 29, 2013). 209 USDA, FAS, China: Poultry and Products; Annual Report, 2008, September 1, 2008, 3. 210 USITC, China’s Agricultural Trade, March 2011, 3-1 to 3-13. For more detail see U.S. Trade,
above. 211 GTIS, GTA database (accessed August 27, 2013).
44
China is also a major importer of poultry, having accounted for 5 percent of global imports during 2006–12 (appendix A table A.4).212 However, China’s imports peaked in 2007 at 512,000 mt. Imports then fell in each of the following years through 2011 (to 272,000 mt) and in 2012, despite an increase in imports, remained below 2006-10 levels. This was due, in part, to trade disruptions resulting primarily from a temporary ban on imports from Brazil in 2008 and to AD/CV duties imposed on U.S. imports beginning in 2010.213 The United States, Brazil, and Argentina were the primary suppliers to China during 2006–12, but their individual shares of Chinese imports fluctuated significantly from year to year.214 During the period 2006–09, the United States was the largest direct supplier of poultry, supplying about three-quarters of Chinese imports.215 Despite the temporary 2008 ban, imports from Brazil reached 61 percent of total imports in 2011. Argentina’s share of the Chinese market also fluctuated, accounting for as little as 5 percent (in 2006) and as high as 24 percent (in 2010). Argentinian product substituted for Brazilian and U.S. product in some years. Frozen chicken cuts and offal (HS 0207.14) constituted an average of 94 percent of Chinese imports in 2006–12, with chicken paws—a popular snack food—accounting for about one-half of all poultry imports. China also imports wing tips and chicken leg quarters.216 Factors Affecting Trade
A number of factors enhance the export competitiveness of the Chinese poultry industry.217 China is modernizing its integrated poultry production system through better flock management and by incorporating advanced technologies in an increasing number of grow-out houses, among other improvements. The presence of foreign investors in the poultry industry is helping to bring about these and other positive changes, including raising quality and production standards. In addition, the government provided direct payments to some producers and eliminated corporate income taxes on companies raising poultry (or other livestock).
Chinese production is hampered by high feed prices, partly resulting from dependence on soymeal derived from imported soybeans and from relatively high domestic corn prices (compared to prices on the world market). 218 These feed costs have raised Chinese poultry prices and thus limited the marketability of Chinese poultry products in new export markets, such as those in Africa. Sanitary concerns, such as those related to
212 USDA, FAS, PSD Online (accessed August 20, 2013 ). 213 For further detail on U.S. exports to China, including trade measures which affect them, see U.S.
Trade, above. 214 GTIS, GTA database (accessed August 27, 2013). 215 The U.S. share of China’s imports was 85 percent in 2009 and 20 percent in 2010–11. GTIS, GTA
database (accessed August 27, 2013). 216 Most imported chicken leg quarters are used for further processing in China for re-export, owing to
foreign buyers’ aversion to residues found in Chinese broiler meat. Industry representative, interview by USITC staff, Hong Kong, September 20, 2010.
217 Industry representative, interview by USITC staff, Shandong province, China, September 13, 2010; USDA, FAS, China: Poultry and Products; Annual Report, 2010, September 30, 2010; industry representative, interview by USITC staff, Shanghai, China, September 13, 2010; USITC, China’s Agricultural Trade, March 2011, 4-13, 4-14, 4-30.
218 USDA, FAS, China: Poultry and Products; Annual Report, 2008, September 1, 2008, 5; industry representative, interview by USITC staff, Shandong province, China, September 13, 2010; USDA, ERS, Corn: Trade (accessed June 29, 2012); USITC, China’s Agricultural Trade, March 2011, 6-10 to 6-11; USDA, FAS, China: Poultry and Products; Annual Report, 2010, September 30, 2010, 3. Feed accounts for approximately 55–70 percent of total production costs in both China and the United States.
45
disease outbreaks, residues, and contaminants, have also restricted Chinese access to some overseas markets.219
China is an attractive market for poultry exporters because of its size and consumer preference for cuts that are not popular elsewhere. China’s large population, increased urbanization, and rising personal incomes have led to increased poultry consumption.220 Broiler meat, which is less expensive than red meat, has become an important substitute for pork, the most popular meat in China.221 Increased dining out, especially by younger consumers, has also boosted poultry consumption, since chicken is a mainstay at fast-growing, quick-serve restaurants like KFC and McDonald’s.222
China maintains a number of measures which affect access for imports. For example, China continues to enact bans for outbreaks of LPAI, and maintains a zero-tolerance policy for bacteria in imports of poultry (although reportedly such standards are not applied to its domestic production).223 The Chinese government also requires importers to obtain certain certifications and licensing, such as the ARFs.224 In addition, imports are subject to a 13 percent ad valorem VAT which does not seem to be assessed on domestic producers, thus making imported poultry more expensive.225
Global Net Importers
Russia
Global Position
In terms of both production and consumption, Russia’s poultry sector is among the world’s leaders. Russia was the seventh-largest poultry producer globally in 2012 and accounted for about 3 percent of global production in that period. Russia’s poultry production grew an average of 16 percent annually during 2006–12 (table 17 and appendix A table A.1). Some of the largest poultry firms in Russia include the Cherkizovo Group, Prioskolye, and the Prodo Group.226 During 2006–12, Russia was the
219 Incidences like the 2011 addition of barium sulphate to live chicken to increase their weight and the 2008 discovery that melamine had (for several years) been widely added to powdered milk and animal feed contribute to these perceptions. Barium sulphate, or barium powder as it is more commonly called, is often added to oil drilling mud, paint, and brakes. See, for example, Barboza, “China’s Contaminated Food Scandal Widens,” October 31, 2008; BBC News, “Chinese Melamine Scandal Widens,” October 31, 2008; Behreandt, “Melamine Concerns Widen,” November 3, 2008; ThePoultrySite.com, “Another Scandal Hits Chinese Chicken—China,” May 10, 2011.
220 EIU, “China: Food, Beverages and Tobacco Profile,” January 17, 2008. 221 USDA, FAS, China: Poultry and Products; Annual Report, 2008, September 1, 2008, 4. 222 USDA, FAS, China: Annual Report, 2008, September 1, 2008, 5; USDA, FAS, China: Poultry and
Products Annual, September 16, 2009; USDA, FAS, China: Poultry and Products; Semi-Annual, 2010, April 14, 2010.
223 USTR, 2009 National Trade Estimate Report, March 2009, 95; USITC, China’s Agricultural Trade, March 2011, 9-7.
224 For instance, as mentioned earlier, licenses for poultry imports were reportedly delayed following U.S. imposition of duties on Chinese tire imports in 2009. Industry representative, interview by USITC staff, Hong Kong, September 20, 2010.
225 USITC, China’s Agricultural Trade, March 2011, 9-12 to 9-13. 226 Watt Poultry USA, “Challenges Continue for Top European Poultry Producers,” December 2010,
34–35. 46
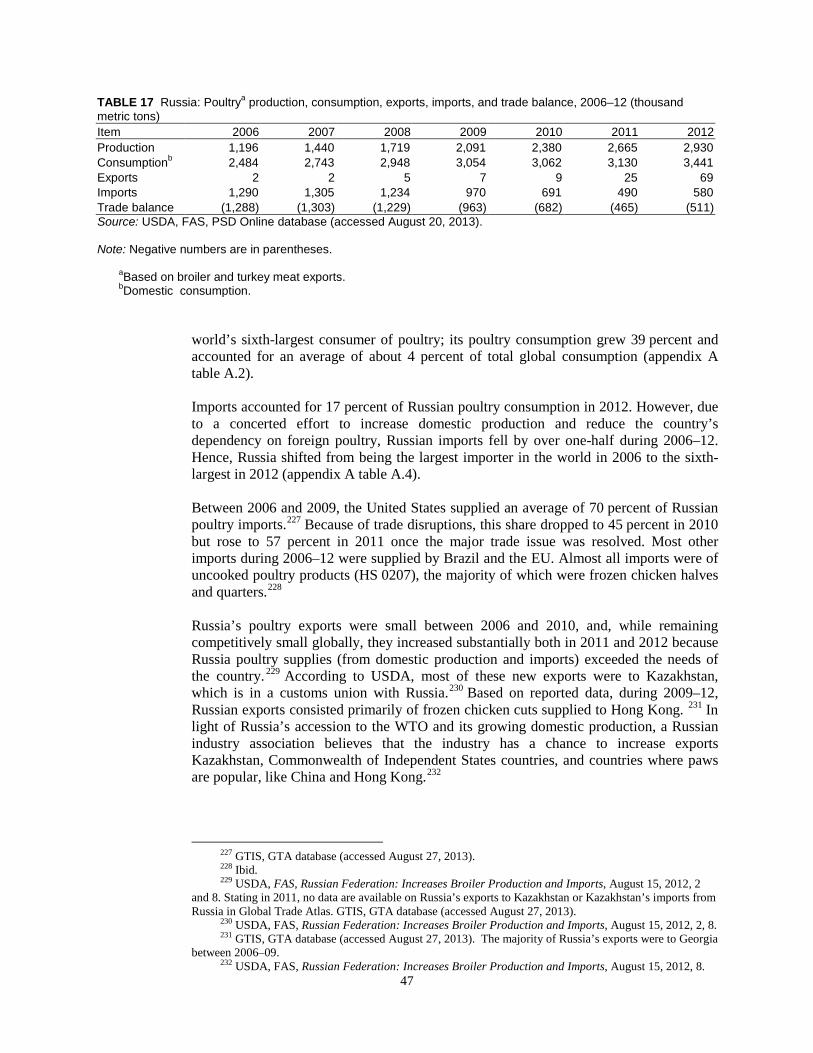
TABLE 17 Russia: Poultrya production, consumption, exports, imports, and trade balance, 2006–12 (thousand metric tons) Item 2006 2007 2008 2009 2010 2011 2012 Production 1,196 1,440 1,719 2,091 2,380 2,665 2,930 Consumptionb 2,484 2,743 2,948 3,054 3,062 3,130 3,441 Exports 2 2 5 7 9 25 69 Imports 1,290 1,305 1,234 970 691 490 580 Trade balance (1,288) (1,303) (1,229) (963) (682) (465) (511) Source: USDA, FAS, PSD Online database (accessed August 20, 2013). Note: Negative numbers are in parentheses. aBased on broiler and turkey meat exports. bDomestic consumption.
world’s sixth-largest consumer of poultry; its poultry consumption grew 39 percent and accounted for an average of about 4 percent of total global consumption (appendix A table A.2). Imports accounted for 17 percent of Russian poultry consumption in 2012. However, due to a concerted effort to increase domestic production and reduce the country’s dependency on foreign poultry, Russian imports fell by over one-half during 2006–12. Hence, Russia shifted from being the largest importer in the world in 2006 to the sixth-largest in 2012 (appendix A table A.4).
Between 2006 and 2009, the United States supplied an average of 70 percent of Russian poultry imports.227 Because of trade disruptions, this share dropped to 45 percent in 2010 but rose to 57 percent in 2011 once the major trade issue was resolved. Most other imports during 2006–12 were supplied by Brazil and the EU. Almost all imports were of uncooked poultry products (HS 0207), the majority of which were frozen chicken halves and quarters.228
Russia’s poultry exports were small between 2006 and 2010, and, while remaining competitively small globally, they increased substantially both in 2011 and 2012 because Russia poultry supplies (from domestic production and imports) exceeded the needs of the country. 229 According to USDA, most of these new exports were to Kazakhstan, which is in a customs union with Russia.230 Based on reported data, during 2009–12, Russian exports consisted primarily of frozen chicken cuts supplied to Hong Kong. 231 In light of Russia’s accession to the WTO and its growing domestic production, a Russian industry association believes that the industry has a chance to increase exports Kazakhstan, Commonwealth of Independent States countries, and countries where paws are popular, like China and Hong Kong.232
227 GTIS, GTA database (accessed August 27, 2013). 228 Ibid. 229 USDA, FAS, Russian Federation: Increases Broiler Production and Imports, August 15, 2012, 2
and 8. Stating in 2011, no data are available on Russia’s exports to Kazakhstan or Kazakhstan’s imports from Russia in Global Trade Atlas. GTIS, GTA database (accessed August 27, 2013).
230 USDA, FAS, Russian Federation: Increases Broiler Production and Imports, August 15, 2012, 2, 8. 231 GTIS, GTA database (accessed August 27, 2013). The majority of Russia’s exports were to Georgia
between 2006–09. 232 USDA, FAS, Russian Federation: Increases Broiler Production and Imports, August 15, 2012, 8.
47
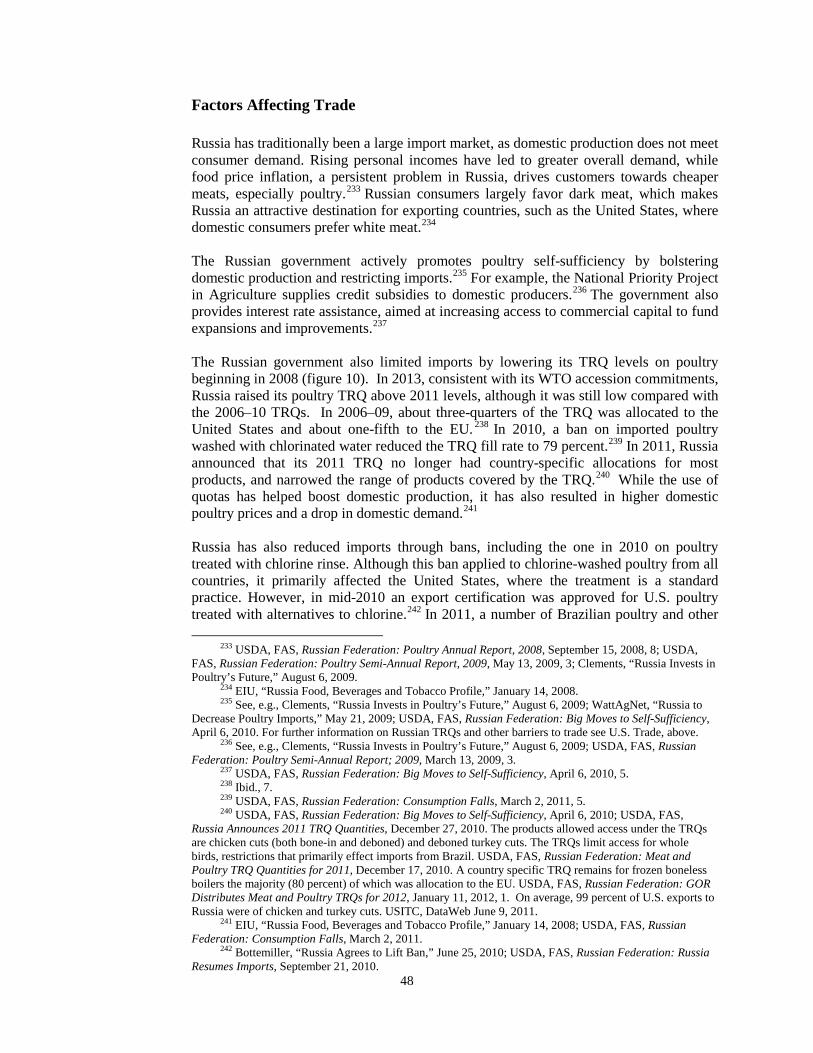
Factors Affecting Trade
Russia has traditionally been a large import market, as domestic production does not meet consumer demand. Rising personal incomes have led to greater overall demand, while food price inflation, a persistent problem in Russia, drives customers towards cheaper meats, especially poultry.233 Russian consumers largely favor dark meat, which makes Russia an attractive destination for exporting countries, such as the United States, where domestic consumers prefer white meat.234
The Russian government actively promotes poultry self-sufficiency by bolstering domestic production and restricting imports.235 For example, the National Priority Project in Agriculture supplies credit subsidies to domestic producers.236 The government also provides interest rate assistance, aimed at increasing access to commercial capital to fund expansions and improvements.237
The Russian government also limited imports by lowering its TRQ levels on poultry beginning in 2008 (figure 10). In 2013, consistent with its WTO accession commitments, Russia raised its poultry TRQ above 2011 levels, although it was still low compared with the 2006–10 TRQs. In 2006–09, about three-quarters of the TRQ was allocated to the United States and about one-fifth to the EU. 238 In 2010, a ban on imported poultry washed with chlorinated water reduced the TRQ fill rate to 79 percent.239 In 2011, Russia announced that its 2011 TRQ no longer had country-specific allocations for most products, and narrowed the range of products covered by the TRQ.240 While the use of quotas has helped boost domestic production, it has also resulted in higher domestic poultry prices and a drop in domestic demand.241 Russia has also reduced imports through bans, including the one in 2010 on poultry treated with chlorine rinse. Although this ban applied to chlorine-washed poultry from all countries, it primarily affected the United States, where the treatment is a standard practice. However, in mid-2010 an export certification was approved for U.S. poultry treated with alternatives to chlorine.242 In 2011, a number of Brazilian poultry and other
233 USDA, FAS, Russian Federation: Poultry Annual Report, 2008, September 15, 2008, 8; USDA, FAS, Russian Federation: Poultry Semi-Annual Report, 2009, May 13, 2009, 3; Clements, “Russia Invests in Poultry’s Future,” August 6, 2009.
234 EIU, “Russia Food, Beverages and Tobacco Profile,” January 14, 2008. 235 See, e.g., Clements, “Russia Invests in Poultry’s Future,” August 6, 2009; WattAgNet, “Russia to
Decrease Poultry Imports,” May 21, 2009; USDA, FAS, Russian Federation: Big Moves to Self-Sufficiency, April 6, 2010. For further information on Russian TRQs and other barriers to trade see U.S. Trade, above.
236 See, e.g., Clements, “Russia Invests in Poultry’s Future,” August 6, 2009; USDA, FAS, Russian Federation: Poultry Semi-Annual Report; 2009, March 13, 2009, 3.
237 USDA, FAS, Russian Federation: Big Moves to Self-Sufficiency, April 6, 2010, 5. 238 Ibid., 7. 239 USDA, FAS, Russian Federation: Consumption Falls, March 2, 2011, 5. 240 USDA, FAS, Russian Federation: Big Moves to Self-Sufficiency, April 6, 2010; USDA, FAS,
Russia Announces 2011 TRQ Quantities, December 27, 2010. The products allowed access under the TRQs are chicken cuts (both bone-in and deboned) and deboned turkey cuts. The TRQs limit access for whole birds, restrictions that primarily effect imports from Brazil. USDA, FAS, Russian Federation: Meat and Poultry TRQ Quantities for 2011, December 17, 2010. A country specific TRQ remains for frozen boneless boilers the majority (80 percent) of which was allocation to the EU. USDA, FAS, Russian Federation: GOR Distributes Meat and Poultry TRQs for 2012, January 11, 2012, 1. On average, 99 percent of U.S. exports to Russia were of chicken and turkey cuts. USITC, DataWeb June 9, 2011.
241 EIU, “Russia Food, Beverages and Tobacco Profile,” January 14, 2008; USDA, FAS, Russian Federation: Consumption Falls, March 2, 2011.
242 Bottemiller, “Russia Agrees to Lift Ban,” June 25, 2010; USDA, FAS, Russian Federation: Russia Resumes Imports, September 21, 2010.
48
meat plants were delisted (i.e., lost their eligibility to export) on the grounds that they do not meet Russian food safety requirements.243 In February 2013, Russia announced it would ban U.S. turkey meat reportedly because of possible residues of ractopamine.244 Saudi Arabia
Global Position
Saudi Arabia is a relatively small producer of poultry. It ranked 24th among global producers in 2012 and accounted for less than 1 percent of global production annually in 2006–12 (appendix A table A.1). Annual production fluctuated significantly but growth averaged only 2 percent during 2006–12 (table 18). Two of the largest Saudi poultry producers are Al Akhawain and Al Watania.245 Saudi Arabia exported a small, but fairly consistent, amount of poultry for most of 2006–12. Exports averaged 3 percent of production annually. Most exports were to small neighboring countries, including Kuwait, the United Arab Emirates, and Bahrain.246
243 See e.g., The Poultry Site.com, “Russia Bans Brazilian Meat from Three States,” June 3, 2011; The Poultry Site.com, “Russia Keeps Embargo on Brazilian Meat Imports,” December 18, 2012.
244 The PoultrySite.com, “Weekly Overview: Russia Bans Imports of US Turkey Meat,” February 7, 2013.
245 Watt Poultry USA, “Investments Continues for Poultry Producers,” December 2010, 39. 246 GTIS, GTA database (accessed August 28, 2013). Detailed data on Saudi Arabian exports are
limited, and no country-specific data are available for 2008–12.
Source: USDA, FAS, Russian Federation : Big Moves to Self-Sufficiency, April 6, 2010; USDA, FAS, Russia Announces 2011 TRQ Quantities, December 27, 2010; USDA, FAS, Russian Federation: GOR Distributes Meat and Poultry TRQs for 2012, January 11, 2012, 1; USDA, FAS, Russian Federation: Eurasian Economic Commission Announces 2013 Meat and Poultry TRQ, November 27, 2012, 2.
49
-
200
400
600
800
1,000
1,200
1,400
2006 2007 2008 2009 2010 2011 2012 2013
Thou
and
met
ric to
ns
FIGURE 10 Russia's poultry tariff-rate quota amounts fell between 2009 and 2012
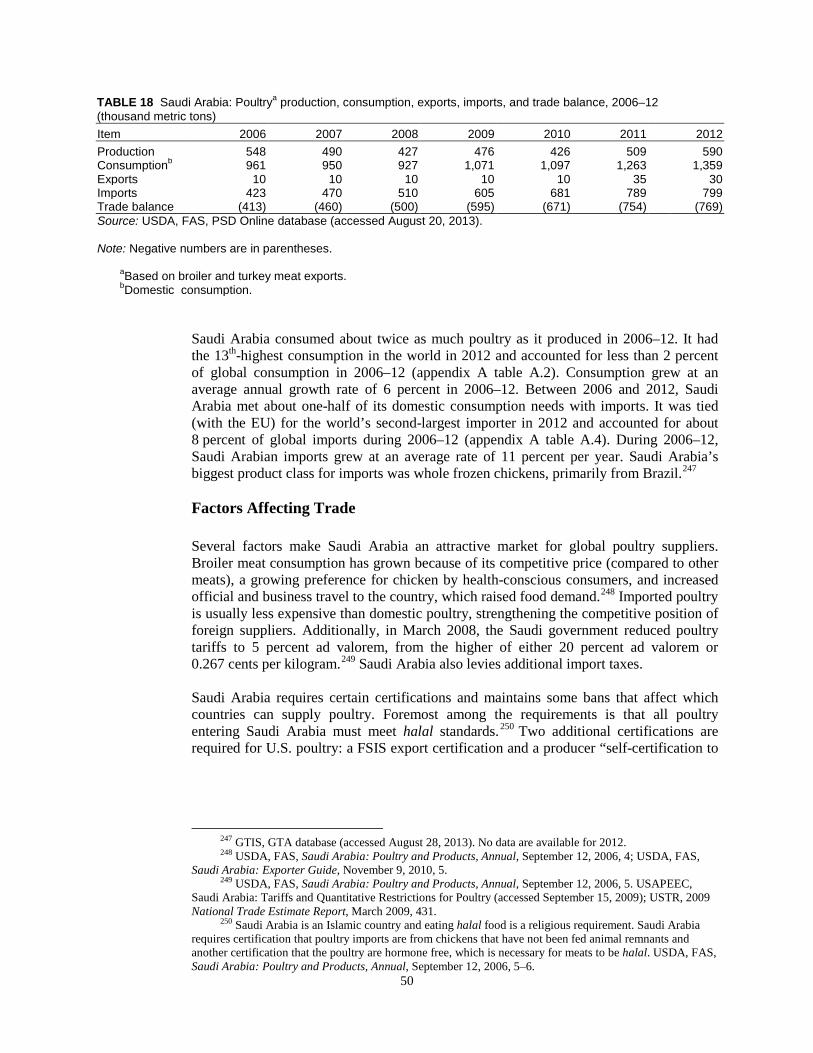
TABLE 18 Saudi Arabia: Poultrya production, consumption, exports, imports, and trade balance, 2006–12 (thousand metric tons) Item 2006 2007 2008 2009 2010 2011 2012 Production 548 490 427 476 426 509 590 Consumptionb 961 950 927 1,071 1,097 1,263 1,359 Exports 10 10 10 10 10 35 30 Imports 423 470 510 605 681 789 799 Trade balance (413) (460) (500) (595) (671) (754) (769) Source: USDA, FAS, PSD Online database (accessed August 20, 2013). Note: Negative numbers are in parentheses. aBased on broiler and turkey meat exports. bDomestic consumption.
Saudi Arabia consumed about twice as much poultry as it produced in 2006–12. It had the 13th-highest consumption in the world in 2012 and accounted for less than 2 percent of global consumption in 2006–12 (appendix A table A.2). Consumption grew at an average annual growth rate of 6 percent in 2006–12. Between 2006 and 2012, Saudi Arabia met about one-half of its domestic consumption needs with imports. It was tied (with the EU) for the world’s second-largest importer in 2012 and accounted for about 8 percent of global imports during 2006–12 (appendix A table A.4). During 2006–12, Saudi Arabian imports grew at an average rate of 11 percent per year. Saudi Arabia’s biggest product class for imports was whole frozen chickens, primarily from Brazil.247
Factors Affecting Trade
Several factors make Saudi Arabia an attractive market for global poultry suppliers. Broiler meat consumption has grown because of its competitive price (compared to other meats), a growing preference for chicken by health-conscious consumers, and increased official and business travel to the country, which raised food demand.248 Imported poultry is usually less expensive than domestic poultry, strengthening the competitive position of foreign suppliers. Additionally, in March 2008, the Saudi government reduced poultry tariffs to 5 percent ad valorem, from the higher of either 20 percent ad valorem or 0.267 cents per kilogram.249 Saudi Arabia also levies additional import taxes.
Saudi Arabia requires certain certifications and maintains some bans that affect which countries can supply poultry. Foremost among the requirements is that all poultry entering Saudi Arabia must meet halal standards.250 Two additional certifications are required for U.S. poultry: a FSIS export certification and a producer “self-certification to
247 GTIS, GTA database (accessed August 28, 2013). No data are available for 2012. 248 USDA, FAS, Saudi Arabia: Poultry and Products, Annual, September 12, 2006, 4; USDA, FAS,
Saudi Arabia: Exporter Guide, November 9, 2010, 5. 249 USDA, FAS, Saudi Arabia: Poultry and Products, Annual, September 12, 2006, 5. USAPEEC,
Saudi Arabia: Tariffs and Quantitative Restrictions for Poultry (accessed September 15, 2009); USTR, 2009 National Trade Estimate Report, March 2009, 431.
250 Saudi Arabia is an Islamic country and eating halal food is a religious requirement. Saudi Arabia requires certification that poultry imports are from chickens that have not been fed animal remnants and another certification that the poultry are hormone free, which is necessary for meats to be halal. USDA, FAS, Saudi Arabia: Poultry and Products, Annual, September 12, 2006, 5–6.
50
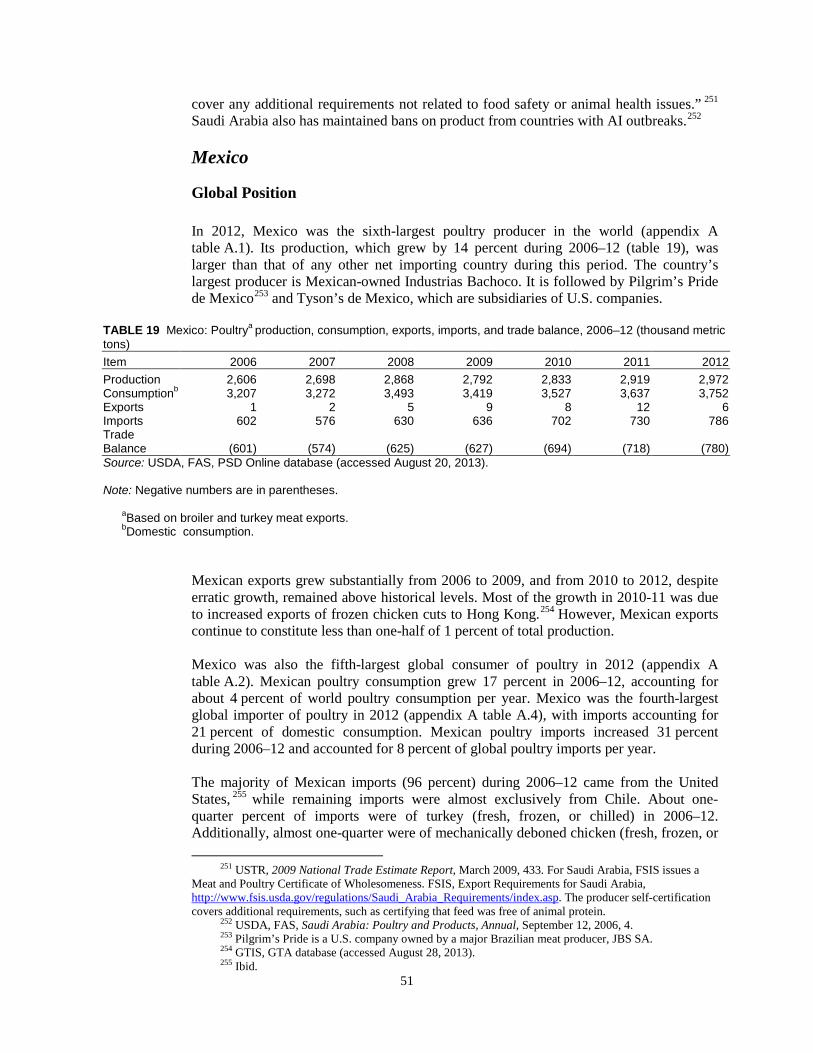
cover any additional requirements not related to food safety or animal health issues.” 251 Saudi Arabia also has maintained bans on product from countries with AI outbreaks.252 Mexico
Global Position
In 2012, Mexico was the sixth-largest poultry producer in the world (appendix A table A.1). Its production, which grew by 14 percent during 2006–12 (table 19), was larger than that of any other net importing country during this period. The country’s largest producer is Mexican-owned Industrias Bachoco. It is followed by Pilgrim’s Pride de Mexico253 and Tyson’s de Mexico, which are subsidiaries of U.S. companies.
TABLE 19 Mexico: Poultrya production, consumption, exports, imports, and trade balance, 2006–12 (thousand metric tons) Item 2006 2007 2008 2009 2010 2011 2012 Production 2,606 2,698 2,868 2,792 2,833 2,919 2,972 Consumptionb 3,207 3,272 3,493 3,419 3,527 3,637 3,752 Exports 1 2 5 9 8 12 6 Imports 602 576 630 636 702 730 786 Trade Balance (601) (574) (625) (627) (694) (718) (780) Source: USDA, FAS, PSD Online database (accessed August 20, 2013). Note: Negative numbers are in parentheses. aBased on broiler and turkey meat exports. bDomestic consumption.
Mexican exports grew substantially from 2006 to 2009, and from 2010 to 2012, despite erratic growth, remained above historical levels. Most of the growth in 2010-11 was due to increased exports of frozen chicken cuts to Hong Kong.254 However, Mexican exports continue to constitute less than one-half of 1 percent of total production.
Mexico was also the fifth-largest global consumer of poultry in 2012 (appendix A table A.2). Mexican poultry consumption grew 17 percent in 2006–12, accounting for about 4 percent of world poultry consumption per year. Mexico was the fourth-largest global importer of poultry in 2012 (appendix A table A.4), with imports accounting for 21 percent of domestic consumption. Mexican poultry imports increased 31 percent during 2006–12 and accounted for 8 percent of global poultry imports per year.
The majority of Mexican imports (96 percent) during 2006–12 came from the United States, 255 while remaining imports were almost exclusively from Chile. About one-quarter percent of imports were of turkey (fresh, frozen, or chilled) in 2006–12. Additionally, almost one-quarter were of mechanically deboned chicken (fresh, frozen, or
251 USTR, 2009 National Trade Estimate Report, March 2009, 433. For Saudi Arabia, FSIS issues a Meat and Poultry Certificate of Wholesomeness. FSIS, Export Requirements for Saudi Arabia, http://www.fsis.usda.gov/regulations/Saudi_Arabia_Requirements/index.asp. The producer self-certification covers additional requirements, such as certifying that feed was free of animal protein.
252 USDA, FAS, Saudi Arabia: Poultry and Products, Annual, September 12, 2006, 4. 253 Pilgrim’s Pride is a U.S. company owned by a major Brazilian meat producer, JBS SA. 254 GTIS, GTA database (accessed August 28, 2013). 255 Ibid.
51
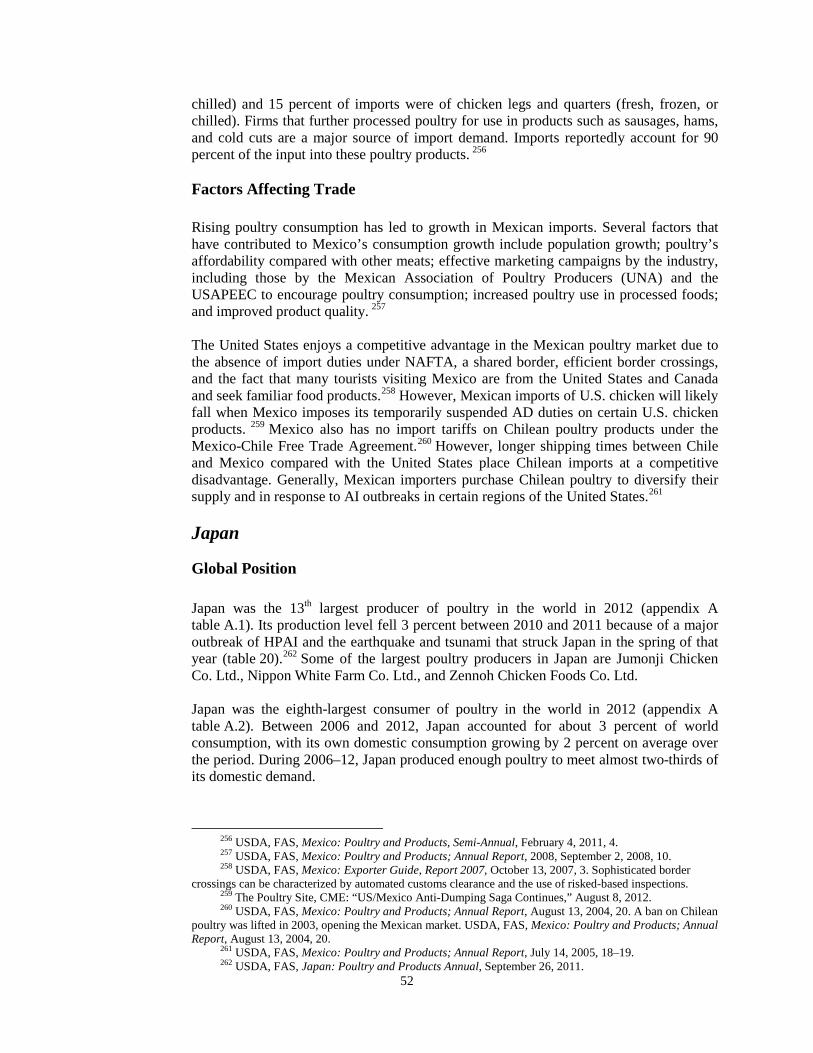
chilled) and 15 percent of imports were of chicken legs and quarters (fresh, frozen, or chilled). Firms that further processed poultry for use in products such as sausages, hams, and cold cuts are a major source of import demand. Imports reportedly account for 90 percent of the input into these poultry products. 256
Factors Affecting Trade
Rising poultry consumption has led to growth in Mexican imports. Several factors that have contributed to Mexico’s consumption growth include population growth; poultry’s affordability compared with other meats; effective marketing campaigns by the industry, including those by the Mexican Association of Poultry Producers (UNA) and the USAPEEC to encourage poultry consumption; increased poultry use in processed foods; and improved product quality. 257
The United States enjoys a competitive advantage in the Mexican poultry market due to the absence of import duties under NAFTA, a shared border, efficient border crossings, and the fact that many tourists visiting Mexico are from the United States and Canada and seek familiar food products.258 However, Mexican imports of U.S. chicken will likely fall when Mexico imposes its temporarily suspended AD duties on certain U.S. chicken products. 259 Mexico also has no import tariffs on Chilean poultry products under the Mexico-Chile Free Trade Agreement.260 However, longer shipping times between Chile and Mexico compared with the United States place Chilean imports at a competitive disadvantage. Generally, Mexican importers purchase Chilean poultry to diversify their supply and in response to AI outbreaks in certain regions of the United States.261
Japan
Global Position
Japan was the 13th largest producer of poultry in the world in 2012 (appendix A table A.1). Its production level fell 3 percent between 2010 and 2011 because of a major outbreak of HPAI and the earthquake and tsunami that struck Japan in the spring of that year (table 20).262 Some of the largest poultry producers in Japan are Jumonji Chicken Co. Ltd., Nippon White Farm Co. Ltd., and Zennoh Chicken Foods Co. Ltd. Japan was the eighth-largest consumer of poultry in the world in 2012 (appendix A table A.2). Between 2006 and 2012, Japan accounted for about 3 percent of world consumption, with its own domestic consumption growing by 2 percent on average over the period. During 2006–12, Japan produced enough poultry to meet almost two-thirds of its domestic demand.
256 USDA, FAS, Mexico: Poultry and Products, Semi-Annual, February 4, 2011, 4. 257 USDA, FAS, Mexico: Poultry and Products; Annual Report, 2008, September 2, 2008, 10. 258 USDA, FAS, Mexico: Exporter Guide, Report 2007, October 13, 2007, 3. Sophisticated border
crossings can be characterized by automated customs clearance and the use of risked-based inspections. 259 The Poultry Site, CME: “US/Mexico Anti-Dumping Saga Continues,” August 8, 2012. 260 USDA, FAS, Mexico: Poultry and Products; Annual Report, August 13, 2004, 20. A ban on Chilean
poultry was lifted in 2003, opening the Mexican market. USDA, FAS, Mexico: Poultry and Products; Annual Report, August 13, 2004, 20.
261 USDA, FAS, Mexico: Poultry and Products; Annual Report, July 14, 2005, 18–19. 262 USDA, FAS, Japan: Poultry and Products Annual, September 26, 2011.
52
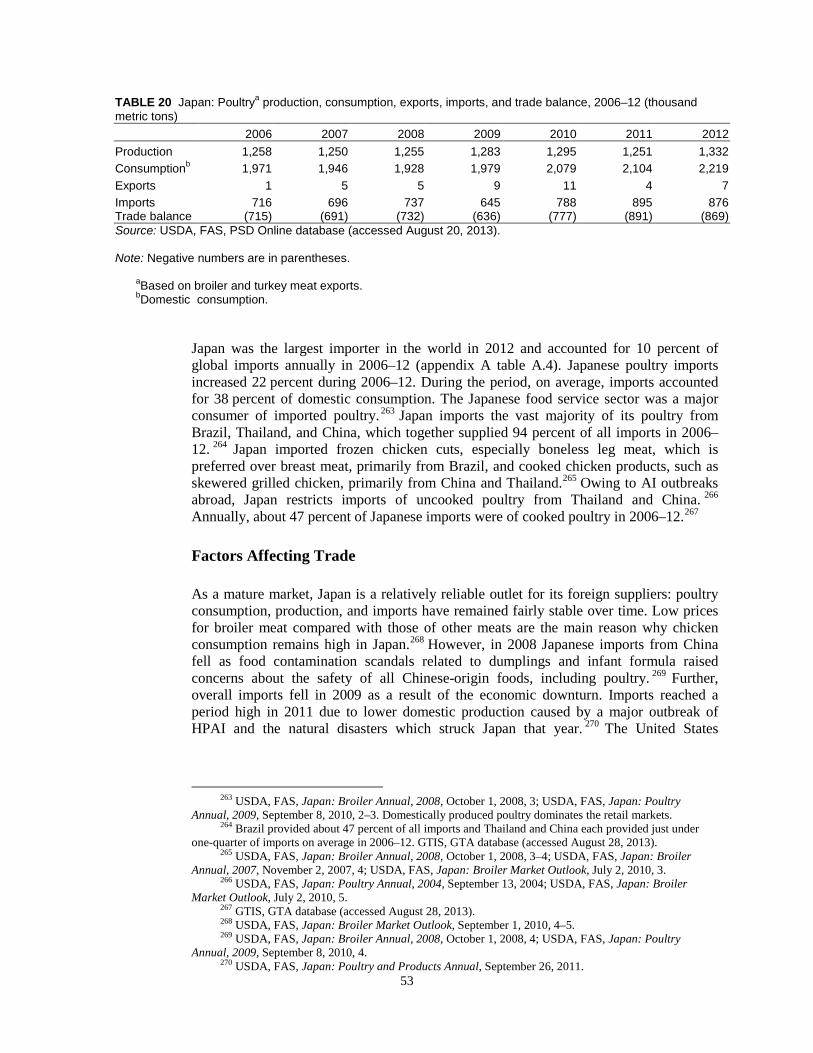
TABLE 20 Japan: Poultrya production, consumption, exports, imports, and trade balance, 2006–12 (thousand metric tons) 2006 2007 2008 2009 2010 2011 2012 Production 1,258 1,250 1,255 1,283 1,295 1,251 1,332 Consumptionb 1,971 1,946 1,928 1,979 2,079 2,104 2,219 Exports 1 5 5 9 11 4 7 Imports 716 696 737 645 788 895 876 Trade balance (715) (691) (732) (636) (777) (891) (869) Source: USDA, FAS, PSD Online database (accessed August 20, 2013). Note: Negative numbers are in parentheses. aBased on broiler and turkey meat exports. bDomestic consumption.
Japan was the largest importer in the world in 2012 and accounted for 10 percent of global imports annually in 2006–12 (appendix A table A.4). Japanese poultry imports increased 22 percent during 2006–12. During the period, on average, imports accounted for 38 percent of domestic consumption. The Japanese food service sector was a major consumer of imported poultry.263 Japan imports the vast majority of its poultry from Brazil, Thailand, and China, which together supplied 94 percent of all imports in 2006–12. 264 Japan imported frozen chicken cuts, especially boneless leg meat, which is preferred over breast meat, primarily from Brazil, and cooked chicken products, such as skewered grilled chicken, primarily from China and Thailand.265 Owing to AI outbreaks abroad, Japan restricts imports of uncooked poultry from Thailand and China. 266 Annually, about 47 percent of Japanese imports were of cooked poultry in 2006–12.267 Factors Affecting Trade
As a mature market, Japan is a relatively reliable outlet for its foreign suppliers: poultry consumption, production, and imports have remained fairly stable over time. Low prices for broiler meat compared with those of other meats are the main reason why chicken consumption remains high in Japan.268 However, in 2008 Japanese imports from China fell as food contamination scandals related to dumplings and infant formula raised concerns about the safety of all Chinese-origin foods, including poultry. 269 Further, overall imports fell in 2009 as a result of the economic downturn. Imports reached a period high in 2011 due to lower domestic production caused by a major outbreak of HPAI and the natural disasters which struck Japan that year. 270 The United States
263 USDA, FAS, Japan: Broiler Annual, 2008, October 1, 2008, 3; USDA, FAS, Japan: Poultry Annual, 2009, September 8, 2010, 2–3. Domestically produced poultry dominates the retail markets.
264 Brazil provided about 47 percent of all imports and Thailand and China each provided just under one-quarter of imports on average in 2006–12. GTIS, GTA database (accessed August 28, 2013).
265 USDA, FAS, Japan: Broiler Annual, 2008, October 1, 2008, 3–4; USDA, FAS, Japan: Broiler Annual, 2007, November 2, 2007, 4; USDA, FAS, Japan: Broiler Market Outlook, July 2, 2010, 3.
266 USDA, FAS, Japan: Poultry Annual, 2004, September 13, 2004; USDA, FAS, Japan: Broiler Market Outlook, July 2, 2010, 5.
267 GTIS, GTA database (accessed August 28, 2013). 268 USDA, FAS, Japan: Broiler Market Outlook, September 1, 2010, 4–5. 269 USDA, FAS, Japan: Broiler Annual, 2008, October 1, 2008, 4; USDA, FAS, Japan: Poultry
Annual, 2009, September 8, 2010, 4. 270 USDA, FAS, Japan: Poultry and Products Annual, September 26, 2011.
53
benefited from this increase in imports, as Japan’s 2011 imports of frozen chicken cuts (HS 0207.14) from the United States reached their highest level by volume since 2003.271
Import bans were the largest trade barrier for poultry entering Japan in 2006–12. Throughout the period, Japan continued its long-running ban on uncooked poultry from Thailand and China on the grounds of AI outbreaks. 272 Some plants in these two countries are exempt from this ban, although reportedly many of the exempt plants are joint ventures with Japanese companies.273 Owing to outbreaks of AI (including the low pathogenic variety), Japan also imposed temporary bans on poultry products from many other countries, including the Netherlands, United Kingdom (England in particular), and United States, either from the entire country or only from specific regions.274
271 Highest volumes both in absolute terms and the share of Japan’s total broiler meat imports. GTIS, GTA database (accessed August 28, 2013).
272 USDA, FAS, Japan: Poultry Annual, 2004, September 13, 2004, 3; USDA, FAS, Japan: Broiler Annual, 2007, November 2, 2007, 3; USDA, FAS, Japan: Broiler Annual, 2008, October 1, 2008.
273 USDA, FAS, Japan: Poultry Annual, 2004, September 13, 2004, 4. 274 See, e.g., USTR, 2009 National Trade Estimate Report, 276, November 24, 2009; EIU, “Japan/UK
Trade: Bird Flu Prompts Poultry Suspension,” June 4, 2008; The Poultry Site, “Japan Halts Dutch Poultry Imports,” March 17, 2006; USDA, FSIS, “Export Requirements for Japan,” April 14, 2011.
54
Bibliography Aho, Paul. “Great Chicken Crisis of 2008.” Watt Poultry USA, December 2008. American Meat Institute (AMI). Meat and Poultry Facts 2008. Washington, DC: AMI, 2008. ———. Meat and Poultry Facts 2009. Washington, DC: AMI, April 2009. ———. Meat and Poultry Facts 2010. Washington, DC: AMI, 2011. ———. Meat and Poultry Facts 2011. Washington, DC: AMI, 2012. AriVist.com. Customs Clearance in Russia. n.d. http://arivist.com/arivist/benefits/122/infolist/2141/
(accessed August 20, 2011). Asian Development Bank (ADB). Soaring Food Prices: Response to the Crisis. Manila: ADB, May 2008.
http://www.adb.org/Documents/Papers/soaring-food-prices/soaring-food-prices.pdf. Asia-Pacific Economic Cooperation (APEC). China Tariff Schedule (accessed April 14, 2009). ———. APEC Customs Guide—Hong Kong China, 2006, (accessed April 14, 2009). Atlantic Poultry Research Institute. Feeding Blueberry By-products to Improve Broiler Chicken Health
and Meat Quality. Fact sheet 28, April 2007. http://nsac.ca/apri/APRI%20FOLDER/Web%20Pages/factsheets.asp.
———. Poultry Publications of Factsheets from Current Research.
http://nsac.ca/apri/APRI%20FOLDER/Web%20Pages/factsheets.asp. The Australian. “Fish Food the Key to Lower Fat in Pork,” January 17, 2007. Barboza, David. “China’s Contaminated Food Scandal Widens.” New York Times, October 31, 2008. BBC News. “Chinese Melamine Scandal Widens,” October 31, 2008. Becker, Geoffrey S. Animal Rendering: Economics and Policy. Congressional Research Service,
March 17, 2004. http://www.nationalaglawcenter.org/assets/crs/RS21771.pdf. Behreandt, Denise. “Melamine Concerns Widen.” New American, November 3, 2008. Bottemiller, Helena. “Russia Agrees to Lift Ban on U.S. Poultry Imports.” Food Safety News, June 25,
2010. http://www.foodsafetynews.com/2010/06/russia-agrees-to-lift-ban-on-us-poultry-imports/. BRChicken. “Brazil’s Rigorous Production of Halal Chicken,” February 2010.
http://www.brazilianchicken.com.br/english/publication-brazilian-chicken.php. Calvin, Linda, Fred Gale, Dinghuan, Hu, and Bryan Lomar. “Food Safety Improvements Underway in
China.” Amber Waves, November 2006.
55
Canada Boarder Service Agency (CBSA). Customs Tariff, August 17, 2011. http://www.cbsa-asfc.gc.ca/trade-commerce/tariff-tarif/2009/01-99/tblmod-eng.html#s1.
Chauynarong, N., A.V. Elangovan, and P.A. Iji. “The Potential of Cassava Products in Diets for Poultry.”
World's Poultry Science Journal 65, no. 1 (2009): 23–36. Clements, Mark. “European Producers Confront Mixed Outlook.” Watt Poultry International, October
2009. ———. “Latin America’s Top Poultry Producers Ready for Market Upturn.” Watt Poultry USA,
December 2010. ———. “Russia Invests in Poultry’s Future.” Wattagnet.com, August 6, 2009. CME Group. Daily Livestock Report, April 16, 2010. Economist Intelligence Unit (EIU). “China: Food, Beverages and Tobacco Profile,” January 17, 2008.
http://www.eiu.com/article1932976978.html?pubtypeId=1122462497&text=china%20poultry. ———. “Japan/UK Trade: Bird Flu Prompts Poultry Suspension,” June 4, 2008. ———. “Russia: Food, Beverages and Tobacco Profile,” January 14, 2008.
http://www.eiu.com/index.asp?layout=ib3Article&article_id=1673026152&pubtypeId=1122462497&text=russia%20+%20poultry&rf=0.
Europa. “Animal Diseases––Eradication and Monitoring Programmes––Legislation.” June 12, 2010.
http://ec.europa.eu/food/animal/diseases/eradication/legisl_en.htm. ———. Agriculture and Rural Development. “Agricultural Markets: Poultry Meat,” February 20, 2008. ———. Agriculture and Rural Development. “The Export of Agricultural Products to Third Countries:
Export Credits,” December 17, 2008. European Commission (EC). Directorate-General for Agriculture and Rural Development. Prospects for
Agricultural Markets and Income in the European Union 2008–2015, March 2009. http://ec.europa.eu/agriculture/publi/caprep/prospects2008/index_en.htm.
———. Prospects for Agricultural Markets and Income in the EU 2010–2020, December 2010.
http://www.google.com/search?q=European+Commission%2C+Directorate-General+for+Agriculture+and+Rural+Development%2C+Prospects+for+Agricultural+Markets+and+Income+&ie=utf-8&oe=utf-8&aq=t&rls=org.mozilla:en-US:official&client=firefox-a.
———. Directorate-General for Health and Consumer Protection. Opinion of the Scientific Committee on
Veterinary Measures Relating to Public Health on Benefits and Limitations of Antimicrobial Treatment for Poultry Carcasses, adopted April 14–15, 2003. http://ec.europa.eu/food/fs/sc/scv/out63_en.pdf.
———. Scientific Committee on Veterinary Measures Relating to Public Health. Benefits and
Limitations of Antimicrobial Treatment for Poultry Carcasses, October 18, 1998. http://ec.europa.eu/food/fs/sc/scv/out14_en.pdf.
56
European Union (EU). Agriculture and Rural Development (ARD). “Agricultural Markets: Poultrymeat,” February 20, 2008. http://ec.europa.eu/agriculture/markets/poultry/index_en.htm.
———. “The Export of Agricultural Products to Third Countries: Export Credits,” December 17, 2008. European Voice. “China Food: EU Ban on Chinese Poultry Eased,” August 8, 2009.
http://www.eiu.com/article363678221.html?pubtypeId=1122462497&text=china%20poultry. eUpdate. “Chinese Poultry Rule Stirs Controversy,” February 12, 2011.
http://www.foodquality.com/details/article/1009925/Chinese_Poultry_Rule_Stirs_Controversy.html.
Gabbett, Rita Jane. “Mexico Issues Preliminary Ruling on U.S. Chicken Leg Imports.”
Meatingplace.com, January 23, 2012. Gifford, Rob. “Food Fears Persist in China 2 Years after Milk Scare.” National Public Radio, October 26,
2010. Global Trade Information Services (GTIS). Global Trade Atlas (GTA) database (accessed various dates). Government of Canada. Agriculture and Agri-Food Canada. “Poultry Marketplace: Canada’s Poultry
Import Regime,” April 26, 2011. http://www.agr.gc.ca/poultry/regimp_eng.htm#trq. Growing Georgia. “Per Capita Meat, Poultry and Fish Consumption.” Press release, February 4, 2011.
http://growinggeorgia.com/animalag/1397-per-capita-meat-poultry-and-fish-consumption. Harris, Chris. “Top Poultry Companies in Europe.” Poultry International, September 1, 2007.
http://www.wattpoultry.com/Europe_companies.aspx. ———. “Research into Distiller’s Dried Grains in Poultry Feed.” The Poultry Site, January 2008.
http://www.thepoultrysite.com/articles/966/research-into-distillers-dried-grains-in-poultry-feed. Harrison, R. Wes, and Pramod R. Sambidi. “A Conjoint Analysis of the U.S. Broiler Complex Location
Decision.” Journal of Agriculture and Applied Economics 36, no. 3 (December 2004): 639–55. Harvard School of Public Health. “The Nutrition Source: Ask the Expert: Omega-3 Fatty Acids.”
http://www.hsph.harvard.edu/nutritionsource/questions/omega-3/index.html (accessed July 20, 2011).
Havenstein, G.B., P.R. Ferket, and M.A. Qureshi. “Growth, Livability, and Feed Conversion of 1957
versus 2001 Broilers when Fed Representative 1957 and 2001 Broiler Diets.” Poultry Science 82, no. 10 (October 1, 2003): 1500–08.
Hulebak, Karen L., and Wayne Schlosser. “HACCP History and Conceptual Overview,” n.d.
http://www.ce.ncsu.edu/risk/pdf/hulebak.pdf (accessed January 12, 2011). International Monetary Fund (IMF). Exchange Rate Query Tool.
http://www.imf.org/external/np/fin/ert/GUI/Pages/CountryDataBase.aspx (accessed December 21, 2011).
Japanese Ministry of Finance (JMF). Japan’s Tariff Schedule as of April 1, 1010.
http://www.customs.go.jp/english/tariff/2010_4/index.htm (accessed April 21, 2011). 57
Japan Times. “Japan Halts Dutch Poultry Imports,” March 17, 2006. Johnson, Renée. U.S.-EU Poultry Dispute. Congressional Research Service, December 9, 2010.
http://www.fas.org/sgp/crs/row/R40199.pdf. Johnson, Renée, and Geoffrey Becker. U.S.-Russia Meat and Poultry Trade Issues. Congressional
Research Service, April 2, 2010. http://www.nationalaglawcenter.org/assets/crs/RS22948.pdf. Johnston, Tom. “Butterball to Close Plant Due to High Input Costs.” MeatingPlace.com, September 15,
2011. ———. “China Lifts Bans on Texas, Penn. Poultry.” MeatingPlace.com, January 4, 2012.
http://www.meatingplace.com/MembersOnly/webNews/details.aspx?item=29588. ———. “U.S., Mexico Work to Settle Poultry Dispute.” MeatingPlace.com, September 1, 2011. Kavilans, Parija. “U.S. Places $40 Million Chicken Order,” August 16, 2011.
http://money.cnn.com/2011/08/16/news/economy/chicken_prices/index.htm?iid=HP_LN&hpt=hp_t2.
Knoeber, Charles R. “A Real Game of Chicken: Chicken, Tournaments, and the Production of Broilers.”
Journal of Law, Economics, & Organization 5, no. 2 (Autumn 1989). Leibtag, Ephraim. “Corn Prices Near Record High, But What about Food Cost?” Amber Waves, February
2008. http://www.ers.usda.gov/AmberWaves/February08/Features/CornPrices.htm. Lomar, Bryan, and Fred Gale. “Who Will China Feed?” Amber Waves, June 2008.
http://www.ers.usda.gov/AmberWaves/June08/Features/ChinaFeed.htm. MacDonald, James M. The Economic Organization of U.S. Broiler Production. Economic Information
Bulletin no. 38. USDA Economic Research Service, June 2008. http://www.ers.usda.gov/Publications/EIB38/.
McFerron, Whitney. “Russia Bans Pork, Beef and Poultry from U.S. States.” Bloomberg, April 28, 2009.
http://www.bloomberg.com/apps/news?pid=newsarchive&sid=avCa8P8x0Uyc&refer=commodity_futures.
McMurray, Gary, and Doug Britton. “Automation to the Rescue?” Watt Poultry USA, December 2009. Management Dynamics. “Country Summaries: Russia,” January 24, 2008.
https://content.managementdynamics.com/TW/REFERENCE/summary/russia.html. Martinez, Steven. Vertical Coordination of Marketing Systems: Lessons from the Poultry, Egg, and Pork
Industries. Agricultural Economic Report no. 807. USDA Economic Research Service, April 2002. http://www.ers.usda.gov/publications/aer807/aer807c.pdf.
Mayo Clinic. “Omega-3 Fatty Acids, Fish Oil, Alpha-linolenic Acid,” November 5, 2010.
http://www.mayoclinic.com/health/fish-oil/NS_patient-fishoil. Moscow Times. “Russia Plans Ban on U.S. Meat Plants,” October 22, 2007. Reprinted on the Poultry Site
58
National Chicken Council (NCC). “Domestic Market Segments,” February 9, 2009. http://www.nationalchickencouncil.org/about-the-industry/statistics/domestic-market-segments/.
———. “National Chicken Council Animal Welfare Guidelines and Audit Checklist for Broilers,”
January 28, 2010. http://www.nationalchickencouncil.com/aboutIndustry/detail.cfm?id=19. ———. “Share of Broilers for Major Market,” June 8, 2006.
http://www.nationalchickencouncil.com/statistics/stat_detail.cfm?id=22 (accessed October 16, 2009).
———. “How Broilers Are Marketed,” October 7, 2009 (accessed February 7, 2011). ———. “The Chicken Industry.” (accessed February 1, 2010). ———. “About the Industry,” 2002–07, (accessed February 1, 2010). ———. “Statistics and Research, Per Capita Consumption of Poultry and Livestock,” September 12,
2013. http://www.nationalchickencouncil.org/about-the-industry/statistics/per-capita-consumption-of-poultry-and-livestock-1965-to-estimated-2012-in-pounds/.
———. “U.S. Broiler Performance,” February 7, 2011.
http://www.nationalchickencouncil.com/statistics/stat_detail.cfm?id=2. National Turkey Federation. “Turkey Industry Structure,” 2009.
http://www.eatturkey.com/consumer/industry/industry.html. ———. “Raising Turkeys,” 2009. http://www.eatturkey.com/consumer/raising/raise.html. O’Keefe, Terrence. “2009 Clean Water Awards.” Watt Poultry USA, May 2009. ———. “2009 Outlook: Reduced Consumption.” Watt Poultry USA, March 2009. ———. “Coping with High Feed Prices.” Watt Poultry USA, June 2008. http://www.wattpoultryusa-
digital.com/wattpoultryusa/200806/#pg20. ———. “Russia’s Changing Market.” Watt Poultry USA, March 2009. ———. “Top Broiler Companies: No Growth in RTC Production in 2008.” Watt Poultry USA,
February 2009. ———. “Top Turkey Companies: Can Cutbacks Lead to a Quick Turnaround?” Watt Poultry USA,
February 2009. ———. “Turkey: How Long Will Profitability Last?” Watt Poultry USA, January 2006. ———. “U.S. Poultry, Egg Exports Set All-time Record in 2008,” Watt Poultry USA, February 18, 2009. Ollinger, Michael, James MacDonald, and Milton Madison. Structural Change in U.S. Chicken and
Turkey Slaughter. USDA Economic Research Service, September 2000.
59
Pedersen, John. “Strong Prices Depend on Rapid Economic Improvement.” Watt Poultry USA, December 2008.
Pilgrim’s Pride. “Pilgrim’s Pride Completes Acquisition of Gold Kist.” News release, January 9, 2007.
http://phx.corporate-ir.net/phoenix.zhtml?c=68228&p=irol-newsArticle&ID=948851&highlight=. ———. “The Pilgrim’s Story.” http://www.pilgrims.com/company/pilgrims-story.aspx (accessed June 22,
2011). ———. “Our Company.” http://www.pilgrims.com/company/ (accessed August 2, 2011).
Plyler, Jim, and Susan Watkins. “Gut Health: Is Anything More Important in Turkey Production?” September 2008. http://www.thepoultrysite.com/articles/1140/gut-health-is-anything-more-important-in-turkey-production.
PRNewswire. “Mexico to Lift Ban on Pennsylvania Poultry Imports,” September 23, 2005. Rabobank. “The Return of Thai Raw Chicken.” Rabobank Industry Notes 312, May 2012. Sambidi, Pramod R., and R. Wes Harrision. “Special Dependency of Geographically Concentrated U.S.
Broiler Industry.” Paper presented at the American Agricultural Economics Association 2005 Annual Meeting, July 24–25, 2005, Providence, Rhode Island.
Schroeder, Ted C., Thomas L. Marsh, and James Mintert. Beef Demand Determinants: A Research
Summary, Kansas State University. Beef Marketing Report MF-2457, March 2000.
Schwirtz, Michael. “Russia Seeks to Cleanse Its Palate of U.S. Chicken.” New York Times, January 19, 2010. http://www.nytimes.com/2010/01/20/world/europe/20russia.html.
Seedling. “Big Meat Is Growing in the South,” October 2010. Shane, Simon. “Has the ‘Brazilian Giant’ Stumbled?” Watt Poultry USA, January 2007. South Centre. EU’s Common Agricultural Policy (CAP): Tools Protecting European Farmers,
March 2011. The Poultry Site.com. “Algae May Boost Omega-3 in US Chicken,” January 23, 2009.
http://www.thepoultrysite.com/poultrynews/16937/algae-may-boost-omega3-in-us-chicken ———. “Another Scandal Hits Chinese Chicken,” May 10, 2011.
http://www.thepoultrysite.com/poultrynews/22591/another-scandal-hits-chinese-chicken. ———. “Brazil Produce: Saudis Want It All,” February 29, 2008. ———. “Formulating Feed for Broiler Performance,” August 2005. ———. “Goldman Sachs Buys Chinese Poultry Farmers,” August 22, 2008. ———. “High Feed Prices; Reevaluating Turkey Slaughter Ages and Weights,” January 2009. ———. “Russia Bans Brazilian Meat from Three States,” June 3, 2011.
60
———. “Russia Could Ban Brazilian Meat,” May 14, 2012.
http://www.thepoultrysite.com/poultrynews/22781/russia-bans-brazilian-meat-from-three-states ———. “Russia Keeps Embargo on Brazilian Meat Imports,” December 18, 2012.
http://www.thepoultrysite.com/poultrynews/27588/russia-keeps-embargo-on-brazilian-meat-imports.
———. “Study Shows Effects of Feed Particle Size on Laying Hens,” July 2008. http://www.thepoultrysite.com/articles/1103/study-shows-effects-of-feed-particle-size-on-laying-hens.
———. “Tyson Invests in Rendering, Dynamic Fuels,” January 22, 2009.
http://www.thepoultrysite.com/poultrynews/16924/tyson-invests-in-rendering-dynamic-fuels. ———. “US Agrees to Limit Exports to Mexico,” August 18, 2003. http://www.thepoultrysite.com/
http://www.thepoultrysite.com/poultrynews/5527/us-agrees-to-limit-export-of-leg-quarters-to-mexico.
———. “Weekly Overview: Poultry Company Reports Mixed; Russia Bans Imports of US Turkey Meat,”
February 7, 2013. ———. “What Does 2009 Hold for Feed Prices?” December 5, 2006. Thornton, Gary. “Broiler Companies Top 10 Pulls Away from Pack in 2006.” Watt Poultry USA,
February 2007. ———. “Chicken Executives Upbeat on 2011.” Watt Poultry USA, December 2010. ———. “Cutbacks, Expansion Figure in Offbeat Year.” Watt Poultry USA, February 2008. ———. “Grain Prices and Poultry Demand: Seraching for the New Normal.” Watt Poultry USA, April
2013. ———. “Pace of Expansion Picks Up in 2005.” Watt Poultry USA, January 2006. ———. “Shakeup at the Top, Growth in the Ranks.” Watt Poultry USA, February 2010. ———. “Top Turkey Firms Signal Production Restraint for 2011.” Watt Poultry USA, February 2011. ———. “Turkey Companies Plot Production Growth for 2013.” Watt Poultry USA, March 2013. ———. “Turkey’s 2010 Formula for Success.” Watt Poultry USA, February 2010. ———. “Tyson Foods Focuses on Chicken Pricing, Efficiency As Corn Outlook Worsens.”
WattAgNet.com, August 11, 2011. ———. “US Chicken Companies Enter 2013 with Production Increases?” Watt Poultry USA, March
2013. ———. “U.S. Chicken Producers Increase Volume in 2010,” Watt Poultry USA, February 2011.
61
Thornton, Gary, and Terrence O’Keefe. “When Will Profits Return?” Watt Poultry USA, October 2008.
http://www.wattpoultryusa-digital.com/poultryusa/200810/#pg22. Trostle, Ronald. Global Agricultural Supply and Demand: Factors Contributing to the Recent Increases
in Food Commodity Prices. U.S. Department of Agriculture, Economic Research Service, July 2008. http://www.ers.usda.gov/Publications/WRS0801/.
Trostle, Ronald, Daniel Marti, Stacey Rosen, and Paul Westcott. Why Have Food Commodity Prices
Risen Again? U.S. Department of Agriculture, Economic Research Service, June 2011. http://www.ers.usda.gov/Publications/WRS1103/WRS1103.pdf.
University of Guelph. “U of G Prof Working to ‘Hatch’Omega-3 Chicken.” News release, June 29, 2006. http://www.uoguelph.ca/news/2006/06/u_of_g_prof_wor_1.html.
U.S.A. Poultry and Egg Export Council (USAPEEC). “China: Tariff and Quantitative Restrictions for
Poultry” (accessed September 15, 2009). ———. “Japan: Tariffs and Quantitative Restrictions for Poultry” (accessed September 15, 2009). ———. “Russia: Tariffs and Quantitative Restrictions for Poultry” (accessed September 15, 2009). ———. “Saudi Arabia: Tariffs and Quantitative Restrictions for Poultry” (accessed September 15, 2009). U.S. Department of Agriculture (USDA). 2007 Census of Agriculture: United States Summary and State
Data 1, Geographic Area Series, Part 51, February 4, 2009. U.S. Department of Agriculture (USDA). Agricultural Marketing Service (AMS). International Egg and
Poultry Review 10, no. 14 (April 3, 2007). http://www.ams.usda.gov/AMSv1.0/ams.fetchTemplateData.do?template=TemplateR&navID=MarketNewsAndTransportationData&leftNav=MarketNewsAndTransportationData&page=PYMNReportInternationalEggandPoultry1&acct=pmn.
———. International Egg and Poultry Review 10, no. 26 (June 26, 2007). ———. International Egg and Poultry Review 12, no. 18 (May 5, 2009). ———. International Egg and Poultry Review 14, no. 07 (February 7, 2011). U.S. Department of Agriculture (USDA). Animal and Plant Health Inspection Service (APHIS). “Animal
and Animal Product Import: Live Poultry,” October 15, 2009. http://www.aphis.usda.gov/import_export/animals/live_poultry.shtml (accessed November 2, 2009).
———. “Poultry & Eggs.”
http://www.aphis.usda.gov/animal_health/emergingissues/downloads/1poultry.pdf (accessed September 15, 2009).
62
U.S. Department of Agriculture (USDA). Economic Research Service (ERS). “2008 Farm Bill Side-by-Side,” October 6, 2008. http://www.ers.usda.gov/farmbill/2008/titles/titleIIITrade.htm#amendmentseep.
———. Agricultural Projections to 2020, Outlook No. (OCE-111). Washington, DC: USDA, February
2011. http://www.ers.usda.gov/publications/oce-usda-agricultural-projections/oce-111.aspx. ———. “Brazil’s Booming Agriculture Faces Obstacles.” Amber Waves, November 2006. ———. Corn: Trade. http://www.ers.usda.gov/Briefing/corn/trade.htm (accessed June 29, 2012). ———. Feed Grains Yearbook Tables. http://www.ers.usda.gov/data-products/feed-grains-database/feed-
grains-yearbook-tables.aspx#.UrSWhBCV33U(accessed July 13, 2011). ———. Livestock, Dairy, and Poultry Outlook. LDP-M-151. Washington, DC: USDA, January 23, 3007.
http://www.ers.usda.gov/Publications/ldp/. ———. Livestock, Dairy, and Poultry Outlook. LDP-M-152. Washington, DC: USDA, February 20,
2007. ———. Livestock, Dairy, and Poultry Outlook. LDP-M-153. Washington, DC: USDA, March, 19, 2007. ———. Livestock, Dairy, and Poultry Outlook. LDP-M-154. Washington, DC: USDA, April 18, 2007. ———. Livestock, Dairy, and Poultry Outlook. LDP-M-155. Washington, DC: USDA, May 21, 2007. ———. Livestock, Dairy, and Poultry Outlook. LDP-M-156. Washington, DC: USDA, July 20, 2007. ———. Livestock, Dairy, and Poultry Outlook. LDP-M-157. Washington, DC: USDA, August 20, 2007. ———. Livestock, Dairy, and Poultry Outlook. LDP-M-156. Washington, DC: USDA, June 19, 2007. ———. Livestock, Dairy, and Poultry Outlook. LDP-M-159. Washington, DC: USDA, September 20,
2007. ———. Livestock, Dairy, and Poultry Outlook. LDP-M-160. Washington, DC: USDA, October 22, 2007. ———. Livestock, Dairy, and Poultry Outlook. LDP-M-164. Washington, DC: USDA, February 15,
2008. ———. Livestock, Dairy, and Poultry Outlook. LDP-M-165. Washington, DC: USDA, March 19, 2008. ———. Livestock, Dairy, and Poultry Outlook. LDP-M-169. Washington, DC: USDA, July 18, 2008. ———. Livestock, Dairy, and Poultry Outlook. LDP-M-174. Washington, DC: USDA, December 18,
2008. ———. Livestock, Dairy, and Poultry Outlook. LDP-M-177. Washington, DC: USDA, March 18, 2009. ———. Livestock, Dairy, and Poultry Outlook. LDP-M-182. Washington, DC: USDA, August 19, 2009.
63
———. Livestock, Dairy, and Poultry Outlook. LDP-M-186. Washington, DC: USDA, December 17, 2009.
———. Livestock, Dairy, and Poultry Outlook. LDP-M- 188. Washington, DC: USDA, February 24,
2010. ———. Livestock, Dairy, and Poultry Outlook. LDP-M-189. Washington, DC: USDA, March 19, 2010. ———. Livestock, Dairy, and Poultry Outlook. LDP-M-191. Washington, DC: USDA, May 19, 2010. ———. Livestock, Dairy, and Poultry Outlook. LDP-M-192. Washington, DC: USDA, June 18, 2010. ———. Livestock, Dairy, and Poultry Outlook. LDP-M-194. Washington, DC: USDA, August 18, 2010. ———. Livestock, Dairy, and Poultry Outlook. LDP-M-196. Washington, DC: USDA, October 22, 2010. ———. Livestock, Dairy, and Poultry Outlook. LDP-M-197. Washington, DC: USDA, November 19,
2010. ———. Livestock, Dairy, and Poultry Outlook. LDP-M-199. Washington, DC: USDA, January 19, 2011. ———. Livestock, Dairy, and Poultry Outlook. LDP-M-200. Washington, DC: USDA, February 15,
2011. ———. Long-term Projections, February 2012. ———. Meat Price Spreads, Retail Prices http://www.ers.usda.gov/Data/MeatPriceSpreads/ (accessed
April 25, 2011). ———. Meat Price Spreads, Historic Prices. http://www.ers.usda.gov/Data/MeatPriceSpreads/ (accessed
April 26, 2011). ———. Oil Crops Outlook. OCF-11f. Washington, DC: USDA, June 10, 2011.
http://usda.mannlib.cornell.edu/usda/ers/OCS//2010s/2011/OCS-06-10-2011.pdf. ———. Oil Crops Yearbook Tables. http://www.ers.usda.gov/data-products/oil-crops-
yearbook.aspx#.UsrJcRCV33V (accessed July 13, 2011). U.S. Department of Agriculture (USDA). Foreign Agricultural Service (FAS). Brazil: Poultry and
Products; Annual Report, 2004, by João F. Silva. GAIN no. BR4620, August 31, 2004. http://gain.fas.usda.gov/Pages/Default.aspx.
———. Brazil: Poultry and Products; Annual Report, 2005, by João F. Silva. GAIN no. BR5620,
August 19, 2005. ———. Brazil: Poultry and Products; Annual Poultry Report, 2008, by João F. Silva. GAIN no.
BR8625, September 03, 2008. ———. Brazil: Poultry and Products Annual; Annual Poultry Report, by João Faustino Silva. GAIN no.
BR0616, September 13, 2010.
64
———. Brazil: Poultry and Products Annual; Poultry Annual 2011, by João Faustino Silva. GAIN no. BR0714, September 2, 2011.
———. Brazil: Poultry and Products Semiannual; Semi Annual Poultry Report, by João F. Silva.
GAIN no. 0703, February 3, 2011. ———. Canada: Poultry and Products Annual, 2010, by Mihai Lupescu. GAIN no. CA0031,
September 1, 2010. ———. Canada: Poultry and Products; Annual Poultry Report, 2008, by George Myles. GAIN no.
CA8062, September 2, 2008. ———. Canada: Poultry and Products, by Matthew Thoren. GAIN no. CA9049, August 31, 2009. ———. China, Peoples Republic of: Food and Agricultural Import Regulations and Standards––
Certification; FAIRS Export Certificate Report. GAIN no. CH9121, December 7, 2009. ———. China, Peoples Republic of: Poultry and Products; Annual Poultry Report––Final, 2004, by
Casey Bean and Jianping Zhang. GAIN no. CH4045, September 24, 2004. ———. China, Peoples Republic of: Poultry and Products; Semi-Annual, 2005, by Casey Bean and
Jianping Zhang. GAIN no. CH5011, February 1, 2005. ———. China, Peoples Republic of: Poultry and Products; Challenges to Increasing U.S. Sales of
Chicken Paws to China, 2006, by Casey Bean and Suzanne Ryan. GAIN no. CH6117, December 15, 2006.
———. China, Peoples Republic of: Poultry and Products; Semi-Annual, Report, 2008, by Jianping
Zhang and Eric Trachtenberg. GAIN no. CH8013, March 1, 2008. ———. China, Peoples Republic of: Poultry and Products; Annual, Report, 2008, by Jianping Zhang and
Chanda Beckman. GAIN no. CH8073, September 1, 2008. ———. China, Peoples Republic of: Poultry and Products; Semi-Annual, 2000, by Jin Zhihong.
GAIN No. CH 0806, February 1, 2000. ———. China, Peoples Republic of: Poultry and Products; Semi-Annual, 2009, by Jianping Zhang.
GAIN no. CH9014, March 5, 2009. ———. China, Peoples Republic of: Poultry and Products; Semi-Annual Report, 2010, by Michael
Woolsey, Joshua Lagos, and Jianping Zhang. GAIN no. CH10010, April 14, 2010. ———. China, Peoples Republic of: Poultry and Products; Annual; Annual Report 2009, by Michael
Woolsey and Jianping Zhang. GAIN no. CH9070, September 16, 2009. ———. China, Peoples Republic of: Poultry and Products Annual, 2010, by Michael Woolsey and
Jianping Zhang. GAIN No. CH10056, September 30, 2010. ———. China, Peoples Republic of: Poultry and Products Annual, 2010, by Ryan Scott and Jianping
Zhang. GAIN No. CH12054, September 18, 2012.
65
———. European Union: Annual Report 2000, by Caroline Hommez. GAIN no. E20007, January 1, 2000.
———. European Union: Poultry and Products; Annual, 2001, by Caroline Hommez. GAIN no. E21017,
February 1, 2001. ———. EU-25: Poultry and Products; Annual, 2005, by Yvan Polet. GAIN no. E35142, July 15, 2005. ———. EU-27: Poultry and Products; Annual, 2007, by Yvan Polet. GAIN no. E47061, July 20, 2007. ———. EU-27: Poultry and Products; Annual Report; 2008, by Xavier Audran. GAIN no. E48090,
July 31, 2008. ———. EU-27: Poultry and Products; Semi-Annual; Semi-annual Report, by Xavier Audran. GAIN no.
FR9039, April 9, 2010. ———. EU-27: Poultry and Products Annual; EU-27 Poultry Sector Growth to Slow in 2011, by Xavier
Audran. GAIN no. FR9049, September 1, 2010. ———. EU-27: Poultry and Products; Semi-Annual, EU-27 Poultry Sector Growth Slowing in 2011, by
Xavier Audran and Lashonda McLeod. GAIN no. FR9059, February 2, 2009. ———. EU-27: Sanitary/Phytosanitary/Food Safety: EC Regulation Sets Targets for Salmonella
Prevalence in Broiler Flocks: 2007, by Yvan Polet. GAIN no. E47050, June 19, 2007. ———. Fact Sheet: Export Enhancement Programs, March 2006.
http://www.fas.usda.gov/info/factsheets/EEP.pdf. ———. Fact Sheet: Market Access Program (MAP), December 2009.
http://www.fas.usda.gov/info/factsheets/mapfact.asp. ———. Hong Kong: Poultry and Products; Poultry Semi-Annual Report, by Lai Yee Yeung. GAIN no.
HK5076, 1995. ———. Hong Kong: Poultry and Products; Poultry Semi-Annual Report, 2000, by Caroline Yuen. GAIN
no. HK0009, February 2, 2000. ———. Indonesia: Approved U.S. Halal Certifying Bodies for Poultry Slaughtering, by John Slete and
Titi Rahayu. GAIN no. ID1103, March 22, 2011. ———. Japan: Japan Broiler Market Outlook, 2010, by Kakuyu Obara. GAIN no. JA0011, July 2, 2010. ———. Japan: Poultry and Products Annual; Japan Broiler Market Outlook, by Kakuyu Obara.
GAIN no. JA0026, September 1, 2010. ———. Japan: Poultry and Products; Poultry Annual, 2004, by Kakuyu Obara. GAIN no. JA4069,
September 13, 2004. ———. Japan: Poultry and Products; Broiler Annual, 2007, by Kakuyu Obara. GAIN no. JA7063,
November 2, 2007.
66
———. Japan: Poultry and Products; Broiler Annual, 2008, by Kakuyu Obara. GAIN no. JA0026, October 1, 2008.
———. Korea, Republic of: Poultry and Products Annual, by Sun Young Choi and Michael Francom.
GAIN no. KS9040, September 1, 2009. ———. Korea, Republic of: Poultry and Products Annual, by Sun Young Choi and Michael Francom.
GAIN no. KS1022, September 1, 2010. ———. “Livestock and Poultry: World Markets and Trade,” November 2005. ———. “Livestock and Poultry: World Markets and Trade,” October 2011. ———. Malaysia: Poultry and Products; Annual, 2005, by Jacelyn Chang. Gain No. MY5036,
September 2, 2005. ———. Mexico: Bans Poultry from 2 Kentucky Counties due to Avian Influenza, by Zaida San Juan and
Daniel R. Williams II. GAIN no. MX9022, April 17, 2009. ———. Mexico: Mexico Bans Poultry Products from Polk County, by Gabriel Hernandez. GAIN no.
MX1028, April 8, 2011. ———. Mexico: Poultry and Products; Final Safeguard on Chicken Leg Quarters, 2003, by Dulce Flores.
GAIN no. MX3099, July 7, 2003. ———. Mexico: Poultry and Products; Poultry Annual Report, 2004, by Dulce Flores. GAIN No.
MX4101, August 13, 2004. ———. Mexico: Poultry and Products; Poultry Annual Report, 2005, by Dulce Flores. GAIN no.
MX5059, July 14, 2005. ———. Mexico: Poultry and Products; Annual Report, 2007, by Dulce Flores and Jeff Nawn.
GAIN no. MX7064, September 24, 2007. ———. Mexico: Exporter Guide; Report, 2007, by Carlos Zertuche, Valerie Brown-Jones, Lourdes
Guzman, and Jaime Lopez. GAIN no. MX7306, October 13, 2007. ———. Mexico: Poultry and Products: Annual Report, 2008, by Dulce Flores. GAIN no. MX8507,
September 2, 2008. ———. Mexico: Poultry and Products; Semi-Annual, by Zaida San Juan and Daniel R. Williams II.
GAIN no. MX1013, February 14, 2011. ———. Production, Supply, and Distribution (PSD) Online database (accessed various dates). ———. Russian Federation: Russia Announces 2011 TRQ Quantities, by Mikhail Maksimenko.
GAIN no. RS1078, December 27, 2010. ———. Russian Federation: Frozen Poultry Use Restrictions Amended, GAIN no. RS1080,
December 29, 2010.
67
———. Russian Federation: GOR Distributes Meat and Poultry TRQs for 2012, by Mikhail Maksimenko. GAIN no. RS1202, Janurary 11, 2012.
———. Russian Federation: Poultry and Products; AI and Reduced Supply Boosting Prices, 2004, by
Mikhail Maksimenko, Mark Petry, and Randall Hager. GAIN no. RS4006, February 9, 2004. ———. Russian Federation: Poultry and Products Annual; Increases Broiler Production and Imports
(January-June 2012), by Mikhail Maksimenko. GAIN no. RS1251, August 15, 2012. ———. Russian Federation: Poultry and Products Annual; Self-Sufficiency Goals Push Subsidies and
Inflation Higher, by Morgan Haas and Mikhail Maksimenko. GAIN no. RS9054, September 1, 2009.
———. Russian Federation: Poultry and Products; Chlorine Ban Postponed until January 1, 2010, 2008,
by Mikhail Maksimenko. GAIN no. RS8099, December 29, 2008. ———. Russian Federation: Poultry and Products; Chlorine Use in Poultry Production Banned, 2008,
by Erik Hansen, Mikhail Maksimenko, and Cynthia Barmore. GAIN no. RS8050, July 1, 2009. ———. Russian Federation: Poultry and Products; Consumption Falling despite Higher Domestic
Production, 2004, by Mark Petry and Mikhail Maksimenko. GAIN no. RS4045, August 17, 2004. ———. Russian Federation: Poultry and Product; Semi-Annual; Big Moves to Self-Sufficiency, by
Morgan Haas and Mikhail Maksimenko. GAIN no. RS1020, April 6, 2010. ———. Russian Federation: Poultry and Products; Poultry Annual Report, 2008, by Erik Hansen and
Mikhail Maksimenko. GAIN no. RS8071, September 15, 2008. ———. Russian Federation: Poultry and Products; Poultry Semi-Annual Report, 2006, by Erik Hansen
and Mikhail Maksimenko. GAIN no. RS6005, February 13, 2006. ———. Russian Federation: Poultry and Products; Poultry Semi-Annual Report, 2009, by Erik Hansen
and Mikhail Maksimenko. GAIN no. RS9016, March 13, 2009. ———. Russian Federation: Poultry and Products; Poultry Semi-Annual Report, 2009, by Erik Hansen
and Mikhail Maksimenko. GAIN no. RS9016, May 13, 2009. ———. Russian Federation: Poultry and Products Semi-annual; Russia Resumes Imports of U.S. Poultry,
by Morgan Haas and Mikhail Maksimenko. GAIN no. RS1052, September 21, 2010. ———. Russian Federation: Trade Policy Monitoring; Russian Customs Limits Ports of Entry for Meat,
2007, by Allan Mustard. GAIN no. RS7085, November 28, 2007. ———. Saudi Arabia: Exporter Guide; Update 2010, by Hussein Mousa. GAIN no. SA1017,
November 9, 2010. ———. Saudi Arabia: Grain and Feed; Saudi Arabia Reduces Import Subsidies on Animal Feed, 2009,
by Hussein Mousa. GAIN no. SA9001, January 25, 2009. ———. Saudi Arabia: Poultry and Products; Annual, 2006, by Hussein Mousa. GAIN no. SA6012,
September 12, 2006.
68
———. Taiwan: Poultry and Poultry Products; Annual, 2003, by Jeff Miller. GAIN no. TW3029, August 22, 2003.
———. Taiwan: Poultry and Products; Annual, 2006, by Jeff Miller. GAIN no. TW0631, August 31,
2006. ———. Taiwan: Exporter Guide; Annual, 2008, by Amy Chang-Chien Hsueh and John Halcomb.
GAIN no. TW8032, June 12, 2008. ———. Taiwan: Exporter Guide; Taiwan: US’ 6th Largest Agr Market and Excellent Platform to Enter
Greater China Market, by Amy Chang-Chien Hsueh and Josephine Hsu. GAIN no. TW20017, June 30, 2010.
———. Thailand: Poultry and Products; Annual, 2007, by Sakchai Preechajarn. GAIN no. TH7119,
September 11, 2007. ———. Thailand: Poultry and Products; Annual, 2008, by Sakchai Preechajarn. GAIN no. TH8131,
August 27, 2008. ———. Thailand: Poultry and Products; Annual, by Sakchai Preechajarn. GAIN no. TH9131,
September 4, 2009. ———. Thailand: Poultry and Products Annual, 2010, by Sakchai Preechajarn. GAIN no. TH0127,
September 1, 2010. ———. Vietnam: Exporter Guide Annual; Vietnam Exporter Guide 2009, by Bui Thi Huong and Truong
Minh Dao. GAIN no. VM9101, October 26, 2009. U.S. Department of Agriculture (USDA). Food Safety and Inspection Service (FSIS).
“Countries/Products Eligible for Export to the United States,” July 23, 2008. ———. “Export Requirements for Hong Kong,” July 6, 2011. ———. “Export Requirements for Japan,” April 14, 2011. ———. “Export Requirements for the People’s Republic of China,” January 4, 2012. ———. “Export Requirements for Russia,” March 29, 2011. ———. “Federal Inspection Programs,” September 23, 2010.
———. The Final Rule on Pathogen Reduction and Hazard Analysis and Critical Control Point (HACCP) Systems, July 1996.
———. “Regulations & Policies: Import Information; Equivalence Process,” July 7, 2010. U.S. Department of Agriculture (USDA). Grain Inspection, Packers, and Stockyard Administration
(GIPSA). 2008 Annual Report: Packers & Stockyards Program, March 1, 2009. ———. 2010 Annual Report: Packers & Stockyards Program, March 2011.
http://www.gipsa.usda.gov/Publications/psp/ar/2010_psp_annual_report.pdf.
69
U.S. Department of Agriculture (USDA). National Agricultural Statistics Service (NASS). Agricultural
Prices, monthly [February 2006—February 2011]. http://usda.mannlib.cornell.edu/MannUsda/viewDocumentInfo.do?documentID=1002.
———. Hatchery Production: 2012 Summary, April 2013. http://usda01.library.cornell.edu/usda/current/HatcProdSu/HatcProdSu-04-15-2013.pdf. ———. Poultry: Production and Value; 2005 Summary, April 2006.
http://usda.mannlib.cornell.edu/MannUsda/viewDocumentInfo.do?documentID=1130. ———. Poultry: Production and Value; 2007 Summary, April 2008. ———. Poultry: Production and Value; 2008 Summary, May 2009. ———. Poultry: Production and Value; 2009 Summary, April 2010. ———. Poultry: Production and Value; 2010 Summary, April 2011. ———. Poultry: Production and Value; 2011 Summary, April 2012. ———. Poultry: Production and Value; 2012 Summary, April 2013. U.S. Department of Commerce (DOC). U.S. Products Subject to Foreign Antidumping and
Countervailing Duty Measures: China, updated Febuary 6, 2013. http://ia.ita.doc.gov/trcs/foreignadcvd/china.html.
U.S. Department of Labor (DOL). Bureau of Labor Statistics. Consumer Price Index- Average Price Data
(Eggs U.S. City Average). http://www.bls.gov/ro3/apmw.htm (accessed September 13, 2012). ———. “Union Members Summary.” News release, January 21, 2011.
http://www.bls.gov/news.release/union2.nr0.htm.
U.S. Congressional House. “DeLauro Amendment Denies Funding to Implement Chinese Poultry Imports Rule.” Press release, May 3, 2006. http://delauro.house.gov/text_release.cfm?id=1163.
U.S. International Trade Commission (USITC). Brazil: Competitive Factors in Brazil Affecting U.S. and
Brazilian Agricultural Sales in Selected Third Country Markets. USITC Publication 4310. Washington, DC: USITC May 2012. http://www.usitc.gov/publications/332/pub4310.pdf.
———. China’s Agricultural Trade: Competitive Conditions and Effects on U.S. Exports. USITC
Publication 4219. Washington, DC: USITC March 2011. http://www.usitc.gov/publications/332/pub4219.pdf.
———. Harmonized Tariff Schedule of the United States (2012) Supplement 1 (Revision 1), October 31,
2012. http://www.usitc.gov/tata/hts/bychapter/index.htm. ———. Interactive Tariff and Trade DataWeb (DataWeb). http://dataweb.usitc.gov/ (accessed various
dates).
70
———. Poultry: Industry and Trade Summary. USITC Publication 3148. Washington, DC: USITC, December 1998.
———. Shifts in U.S. Merchandise Trade 2008. USITC Publication 4089. Washington, DC: USITC,
July 2009. http://www.usitc.gov/publications/332/pub4089.pdf. United States Trade Representative (USTR). 2009 National Trade Estimate Report on Foreign Trade
Barriers. Washington, DC: USTR, March 2009. http://www.ustr.gov/about-us/press-office/reports-and-publications/2009/2009-national-trade-estimate-report-foreign-trad.
———. 2010 National Trade Estimate Report on Foreign Trade Barriers. Washington, DC: USTR,
March 2010..http://www.ustr.gov/sites/default/files/uploads/reports/2010/NTE/NTE_COMPLETE_WITH_APPENDnonameack.pdf.
———. 2012 National Trade Estimate Report on Foreign Trade Barriers. Washington, DC: USTR,
March 2012. http://www.ustr.gov/sites/default/files/NTE%20Final%20Printed_0.pdf. ———. 2012 Report on Sanitary and Phytosanitary Measures. Washington, DC: USTR, March 2012.
http://www.ustr.gov/webfm_send/3324. ———. 2010 Report on Sanitary and Phytosanitary Measures. Washington, DC: USTR, March 2010. ———. “To Protect American Jobs, United States Announces Next Step in Dispute against China.” Press
release, December 2011. http://www.ustr.gov/about-us/press-office/press-releases/2011/december/protect-american-jobs-united-states-announces-nex.
———. “United States Files WTO Case against China to Protect American Jobs.” Press release,
September 20, 2011. ———. “United States Requests WTO Panel in Challenge of EU restrictions on Poultry Exports.” Press
release, October 8, 2009. http://www.ustr.gov/about-us/press-office/press-releases/2009/october/united-states-requests-wto-panel-challenge-eu-rest.
———. “United States Wins Trade Enforcement Case for American Farmers, Proves Export-Blocking
Chinese Duties Unjustified Under WTO Rules.” Press release, August 2, 2013. http://www.ustr.gov/US-Wins-Trade-Enforcement-Case-AmericanFarmers-Proves-Export-Blocking-Chinese-Duties-Unjustified-Under-WTO-Rule.
———. “World Trade Organization Adopts Report Ruling in Favor of the United States in Chicken
Products Trade Dispute with China.” Press release, September 25, 2013. http://www.ustr.gov/about-us/press-office/press-releases/2013/september/WTO-ruling-favor-US-chicken-China.
Van Horne, P.L.M. Production Costs of Broiler Meat: An International Comparison. Agricultural
Economics Research Institute (LEI), The Hague, 2009. http://www.lei.wur.nl/UK/publications+en+products/LEI+publications/?id=987.
WattAgNet.com. “New Regulation Prohibits Imports of Poultry Meat Treated with Chlorine of a Certain
Concentration,” September 14, 2009.
71
———. “Russia to Ban US Imports of Poultry Meat Treated with Chlorine,” September 11, 2009. http://www.wattagnet.com/Russia_to_ban_US_imports_of_poultry_meat_treated_with_chlorine.html.
———. “Marfrig,” (accessed March 7, 2010).
http://www.wattagnet.com/ViewCompany.aspx?id=11076&terms=Seara+Alimentos+S.A. ———.”US Chicken Consumption Increases in 2010 After Three-year Decline,” April 5, 2011.
http://www.wattagnet.net/US_chicken_consumption_increases_in_2010_after_three-year_decline.html.
———. “Perdigão Combines with Sadia to Form Brasil Foods,” May 19, 2009. http://www.wattagnet.com/ViewNews.aspx?id=6758&terms=Sadia+S.A. ———. “Russia to Decrease Poultry Imports,” May 21, 2009. Watt Poultry USA. issues from January 2006 to December 2010. ———. “Asia and Oceania’s Top Poultry Producers Bounce Back,” December 2010. ———. “Challenges Continue for Top European Poultry Producers,” December 2010. ———. “Investments Continues for Poultry Producers in the Middle East and Africa,” December 2010. White & Case. “2010 Agriculture Appropriations Act Permits Chinese Poultry Imports with Certain
Conditions.” US Customs Developments, December 2009. http://www.whitecase.com/files/Publication/1307bdec-bc54-4270-864f-4559689f5f03/Presentation/PublicationAttachment/f6f15b55-db35-4b52-98d8-4c0b0ec97778/US_Customs_Developments_December2009.pdf.
World Organisation for Animal Health (OIE). Terrestrial Animal Health Code. Paris: OIE, 2010.
http://www.oie.int/eng/normes/mcode/en_sommaire.htm. World Poultry.net. “EU: €275 Mln to Control Animal Diseases,” November 27, 2009. World Trade Organization (WTO). European Communities−Certain Measures Affecting Poultry Meat
and Poultry Meat Products from the United States. WTO Dispute DS389. http://www.wto.org/english/tratop_e/dispu_e/cases_e/ds389_e.htm (accessed February 6, 2013).
———. Tariff Download Facility. http://tariffdata.wto.org/Default.aspx?culture=en-US (accessed
August 30, 2011). WTD Trade Alert. “US to Take China to WTO over Poultry Duties,” September 20, 2011.
72
APPENDIX A STATISTICAL TABLES


TABLE A.1 Broiler and turkey meat: World production, by selected countries and country groups, 2006–12 (thousand metric tons) Country 2006 2007 2008 2009 2010 2011 2012 North America: Canada 1,135 1,176 1,197 1,178 1,182 1,187 1,205 Mexico 2,606 2,698 2,868 2,792 2,833 2,919 2,972 United States 18,473 18,890 19,357 18,470 19,090 19,286 19,296 South America/Caribbean: Argentina 1,200 1,320 1,435 1,500 1,680 1,770 1,936 Brazil 9,708 10,763 11,498 11,489 12,797 13,352 13,155 Chile 517 480 504 508 499 556 586 Colombia 850 925 1,011 1,020 1,067 1,075 1,098 Cuba 31 31 25 27 29 30 30
Venezuela 707 740 695 680 650 625 655 Europe: European Union 9,598 10,110 10,424 10,551 11,148 11,270 11,530 Russia 1,196 1,440 1,719 2,091 2,380 2,665 2,930 Turkey 946 1,012 1,170 1,250 1,430 1,614 1,687
Ukraine 372 475 570 650 733 767 821 Asia: China 10,354 11,296 11,845 12,105 12,556 13,206 13,706 Hong Kong 29 26 18 10 10 12 11 India 2,000 2,240 2,490 2,550 2,650 2,900 3,160 Indonesia 1,260 1,295 1,350 1,409 1,465 1,515 1,540 Japan 1,258 1,250 1,255 1,283 1,295 1,251 1,332 Korea, South 523 570 565 613 653 685 726 Malaysia 922 931 945 945 945 950 955 Philippines 645 650 695 725 750 760 790 Taiwan 570 553 522 542 558 589 578 Thailand 1,100 1,050 1,170 1,200 1,280 1,350 1,550 Vietnam 344 359 417 467 616 708 743 Middle East: Iran 691 710 722 745 765 785 805 Iraq 50 95 95 110 160 150 150 Kuwait 37 37 37 38 46 46 46 Saudi Arabia 548 490 427 476 426 509 590 United Arab Emirates 29 26 36 40 40 40 40 Africa: Angola 8 8 8 8 8 8 8 South Africa 1,118 1,166 1,247 1,258 1,308 1,378 1,403 Other: Australia 758 772 765 787 888 962 990
World 70,510 74,590 78,138 78,630 83,105 86,119 88,272 Source: USDA, FAS, PSD database (accessed August 20, 2013).
A-3
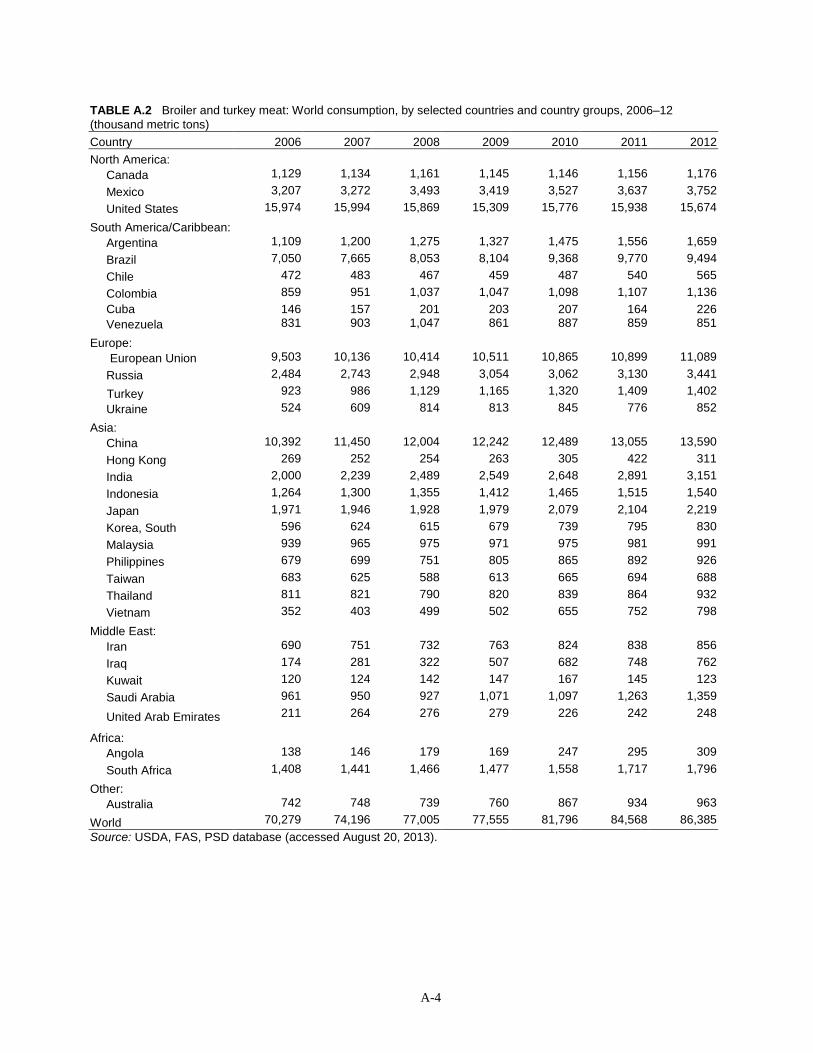
TABLE A.2 Broiler and turkey meat: World consumption, by selected countries and country groups, 2006–12 (thousand metric tons) Country 2006 2007 2008 2009 2010 2011 2012 North America: Canada 1,129 1,134 1,161 1,145 1,146 1,156 1,176 Mexico 3,207 3,272 3,493 3,419 3,527 3,637 3,752 United States 15,974 15,994 15,869 15,309 15,776 15,938 15,674
South America/Caribbean: Argentina 1,109 1,200 1,275 1,327 1,475 1,556 1,659 Brazil 7,050 7,665 8,053 8,104 9,368 9,770 9,494 Chile 472 483 467 459 487 540 565 Colombia 859 951 1,037 1,047 1,098 1,107 1,136 Cuba 146 157 201 203 207 164 226
Venezuela 831 903 1,047 861 887 859 851
Europe: European Union 9,503 10,136 10,414 10,511 10,865 10,899 11,089 Russia 2,484 2,743 2,948 3,054 3,062 3,130 3,441
Turkey 923 986 1,129 1,165 1,320 1,409 1,402 Ukraine 524 609 814 813 845 776 852
Asia: China 10,392 11,450 12,004 12,242 12,489 13,055 13,590 Hong Kong 269 252 254 263 305 422 311 India 2,000 2,239 2,489 2,549 2,648 2,891 3,151 Indonesia 1,264 1,300 1,355 1,412 1,465 1,515 1,540 Japan 1,971 1,946 1,928 1,979 2,079 2,104 2,219 Korea, South 596 624 615 679 739 795 830 Malaysia 939 965 975 971 975 981 991 Philippines 679 699 751 805 865 892 926 Taiwan 683 625 588 613 665 694 688 Thailand 811 821 790 820 839 864 932 Vietnam 352 403 499 502 655 752 798
Middle East: Iran 690 751 732 763 824 838 856 Iraq 174 281 322 507 682 748 762 Kuwait 120 124 142 147 167 145 123 Saudi Arabia 961 950 927 1,071 1,097 1,263 1,359
United Arab Emirates 211 264 276 279 226 242 248
Africa: Angola 138 146 179 169 247 295 309 South Africa 1,408 1,441 1,466 1,477 1,558 1,717 1,796
Other: Australia 742 748 739 760 867 934 963
World 70,279 74,196 77,005 77,555 81,796 84,568 86,385 Source: USDA, FAS, PSD database (accessed August 20, 2013).
A-4
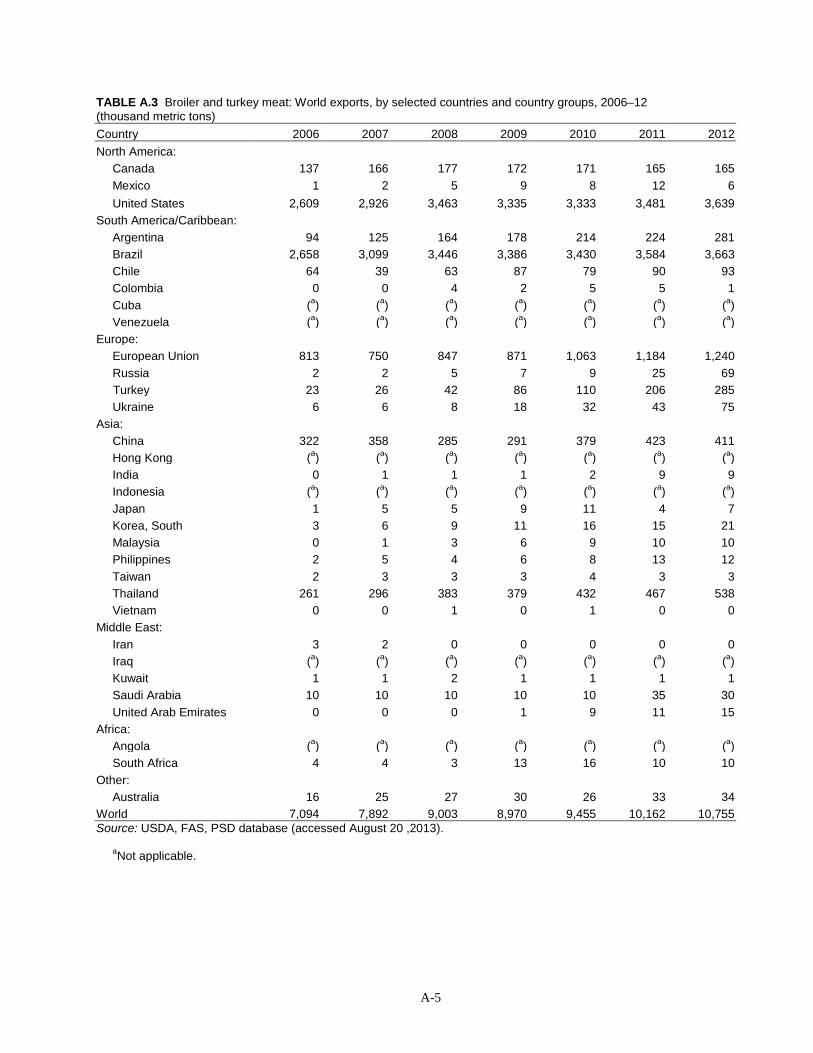
TABLE A.3 Broiler and turkey meat: World exports, by selected countries and country groups, 2006–12 (thousand metric tons)
Country 2006 2007 2008 2009 2010 2011 2012 North America:
Canada 137 166 177 172 171 165 165 Mexico 1 2 5 9 8 12 6 United States 2,609 2,926 3,463 3,335 3,333 3,481 3,639 South America/Caribbean: Argentina 94 125 164 178 214 224 281 Brazil 2,658 3,099 3,446 3,386 3,430 3,584 3,663 Chile 64 39 63 87 79 90 93 Colombia 0 0 4 2 5 5 1 Cuba (a) (a) (a) (a) (a) (a) (a)
Venezuela (a) (a) (a) (a) (a) (a) (a) Europe: European Union 813 750 847 871 1,063 1,184 1,240 Russia 2 2 5 7 9 25 69 Turkey 23 26 42 86 110 206 285 Ukraine 6 6 8 18 32 43 75 Asia: China 322 358 285 291 379 423 411 Hong Kong (a) (a) (a) (a) (a) (a) (a) India 0 1 1 1 2 9 9 Indonesia (a) (a) (a) (a) (a) (a) (a) Japan 1 5 5 9 11 4 7 Korea, South 3 6 9 11 16 15 21 Malaysia 0 1 3 6 9 10 10 Philippines 2 5 4 6 8 13 12 Taiwan 2 3 3 3 4 3 3 Thailand 261 296 383 379 432 467 538 Vietnam 0 0 1 0 1 0 0 Middle East: Iran 3 2 0 0 0 0 0 Iraq (a) (a) (a) (a) (a) (a) (a) Kuwait 1 1 2 1 1 1 1 Saudi Arabia 10 10 10 10 10 35 30 United Arab Emirates 0 0 0 1 9 11 15 Africa: Angola (a) (a) (a) (a) (a) (a) (a) South Africa 4 4 3 13 16 10 10 Other: Australia 16 25 27 30 26 33 34 World 7,094 7,892 9,003 8,970 9,455 10,162 10,755 Source: USDA, FAS, PSD database (accessed August 20 ,2013). aNot applicable.
A-5
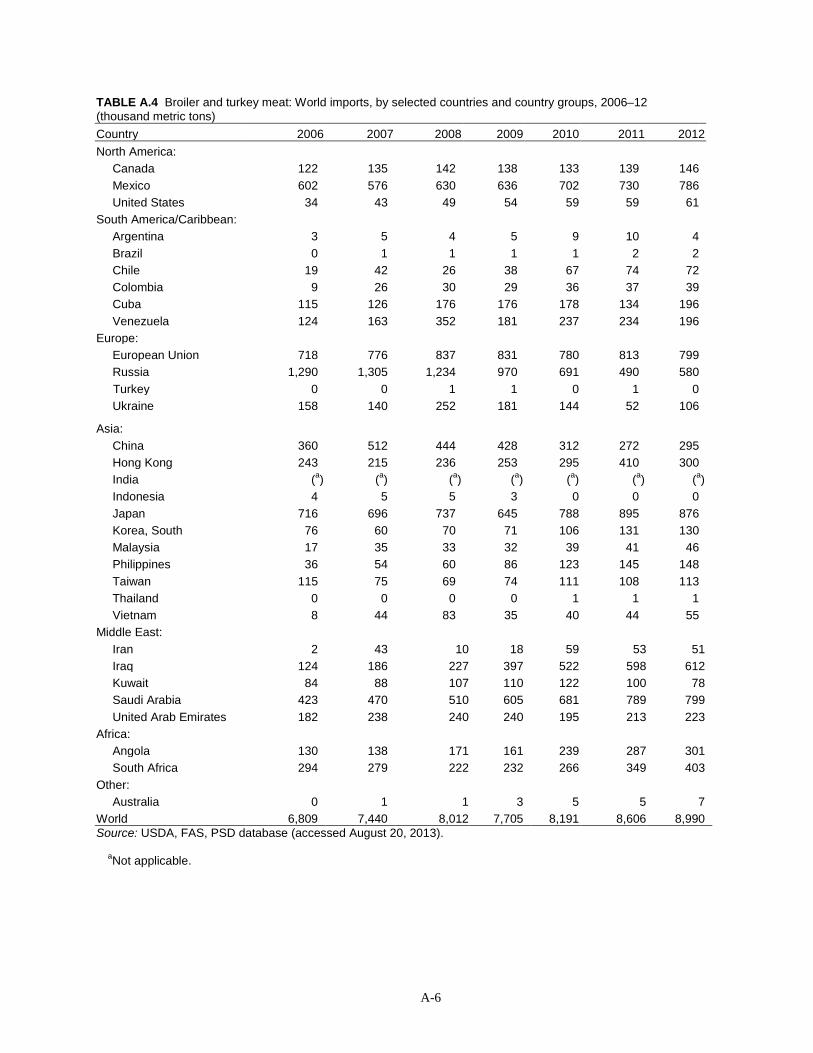
TABLE A.4 Broiler and turkey meat: World imports, by selected countries and country groups, 2006–12 (thousand metric tons) Country 2006 2007 2008 2009 2010 2011 2012 North America: Canada 122 135 142 138 133 139 146 Mexico 602 576 630 636 702 730 786 United States 34 43 49 54 59 59 61 South America/Caribbean: Argentina 3 5 4 5 9 10 4 Brazil 0 1 1 1 1 2 2 Chile 19 42 26 38 67 74 72 Colombia 9 26 30 29 36 37 39 Cuba 115 126 176 176 178 134 196
Venezuela 124 163 352 181 237 234 196 Europe: European Union 718 776 837 831 780 813 799 Russia 1,290 1,305 1,234 970 691 490 580 Turkey 0 0 1 1 0 1 0 Ukraine 158 140 252 181 144 52 106
Asia: China 360 512 444 428 312 272 295 Hong Kong 243 215 236 253 295 410 300 India (a) (a) (a) (a) (a) (a) (a) Indonesia 4 5 5 3 0 0 0 Japan 716 696 737 645 788 895 876 Korea, South 76 60 70 71 106 131 130 Malaysia 17 35 33 32 39 41 46 Philippines 36 54 60 86 123 145 148 Taiwan 115 75 69 74 111 108 113 Thailand 0 0 0 0 1 1 1 Vietnam 8 44 83 35 40 44 55 Middle East: Iran 2 43 10 18 59 53 51 Iraq 124 186 227 397 522 598 612 Kuwait 84 88 107 110 122 100 78 Saudi Arabia 423 470 510 605 681 789 799 United Arab Emirates 182 238 240 240 195 213 223 Africa: Angola 130 138 171 161 239 287 301 South Africa 294 279 222 232 266 349 403 Other: Australia 0 1 1 3 5 5 7 World 6,809 7,440 8,012 7,705 8,191 8,606 8,990 Source: USDA, FAS, PSD database (accessed August 20, 2013).
aNot applicable.
A-6
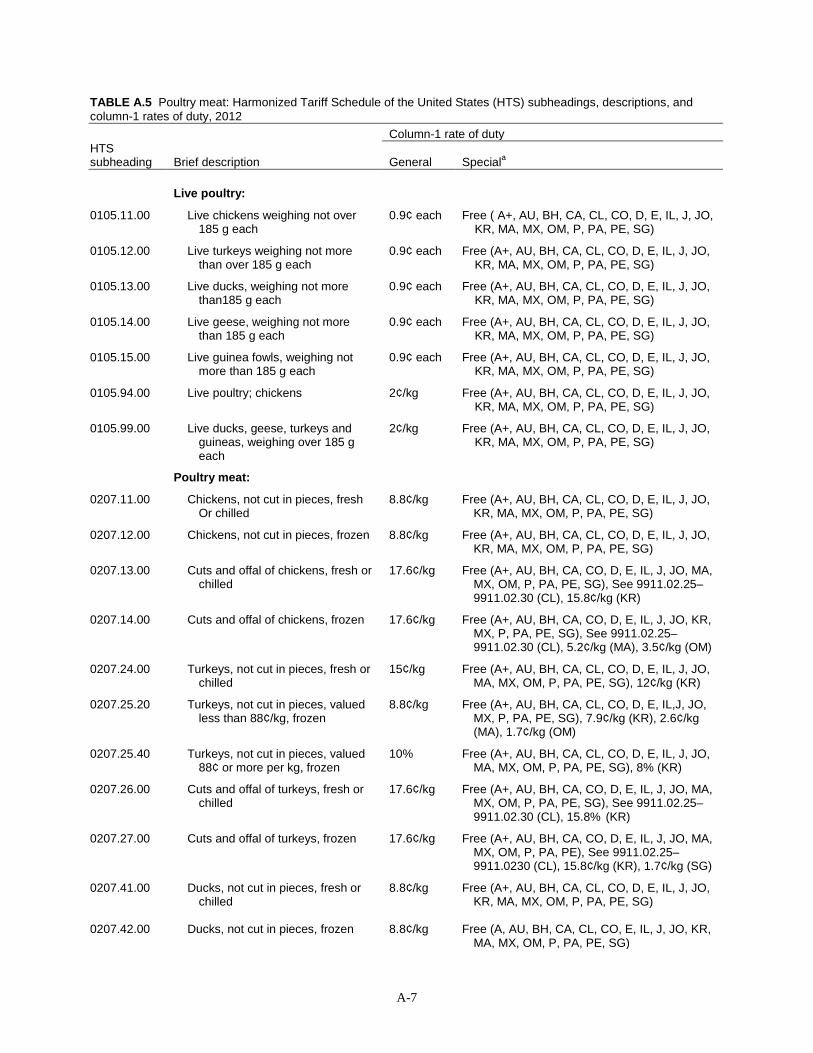
TABLE A.5 Poultry meat: Harmonized Tariff Schedule of the United States (HTS) subheadings, descriptions, and column-1 rates of duty, 2012
Column-1 rate of duty
HTS subheading Brief description General Speciala
Live poultry:
0105.11.00
Live chickens weighing not over 185 g each
0.9¢ each
Free ( A+, AU, BH, CA, CL, CO, D, E, IL, J, JO, KR, MA, MX, OM, P, PA, PE, SG)
0105.12.00
Live turkeys weighing not more than over 185 g each
0.9¢ each Free (A+, AU, BH, CA, CL, CO, D, E, IL, J, JO, KR, MA, MX, OM, P, PA, PE, SG)
0105.13.00
Live ducks, weighing not more than185 g each
0.9¢ each Free (A+, AU, BH, CA, CL, CO, D, E, IL, J, JO, KR, MA, MX, OM, P, PA, PE, SG)
0105.14.00
Live geese, weighing not more than 185 g each
0.9¢ each Free (A+, AU, BH, CA, CL, CO, D, E, IL, J, JO, KR, MA, MX, OM, P, PA, PE, SG)
0105.15.00
Live guinea fowls, weighing not more than 185 g each
0.9¢ each Free (A+, AU, BH, CA, CL, CO, D, E, IL, J, JO, KR, MA, MX, OM, P, PA, PE, SG)
0105.94.00
Live poultry; chickens 2¢/kg Free (A+, AU, BH, CA, CL, CO, D, E, IL, J, JO, KR, MA, MX, OM, P, PA, PE, SG)
0105.99.00
Live ducks, geese, turkeys and guineas, weighing over 185 g each
2¢/kg Free (A+, AU, BH, CA, CL, CO, D, E, IL, J, JO, KR, MA, MX, OM, P, PA, PE, SG)
Poultry meat:
0207.11.00 Chickens, not cut in pieces, fresh Or chilled
8.8¢/kg Free (A+, AU, BH, CA, CL, CO, D, E, IL, J, JO, KR, MA, MX, OM, P, PA, PE, SG)
0207.12.00 Chickens, not cut in pieces, frozen 8.8¢/kg Free (A+, AU, BH, CA, CL, CO, D, E, IL, J, JO, KR, MA, MX, OM, P, PA, PE, SG)
0207.13.00 Cuts and offal of chickens, fresh or chilled
17.6¢/kg Free (A+, AU, BH, CA, CO, D, E, IL, J, JO, MA, MX, OM, P, PA, PE, SG), See 9911.02.25– 9911.02.30 (CL), 15.8¢/kg (KR)
0207.14.00 Cuts and offal of chickens, frozen 17.6¢/kg Free (A+, AU, BH, CA, CO, D, E, IL, J, JO, KR, MX, P, PA, PE, SG), See 9911.02.25– 9911.02.30 (CL), 5.2¢/kg (MA), 3.5¢/kg (OM)
0207.24.00 Turkeys, not cut in pieces, fresh or chilled
15¢/kg Free (A+, AU, BH, CA, CL, CO, D, E, IL, J, JO, MA, MX, OM, P, PA, PE, SG), 12¢/kg (KR)
0207.25.20 Turkeys, not cut in pieces, valued less than 88¢/kg, frozen
8.8¢/kg Free (A+, AU, BH, CA, CL, CO, D, E, IL,J, JO, MX, P, PA, PE, SG), 7.9¢/kg (KR), 2.6¢/kg (MA), 1.7¢/kg (OM)
0207.25.40 Turkeys, not cut in pieces, valued 88¢ or more per kg, frozen
10% Free (A+, AU, BH, CA, CL, CO, D, E, IL, J, JO, MA, MX, OM, P, PA, PE, SG), 8% (KR)
0207.26.00 Cuts and offal of turkeys, fresh or chilled
17.6¢/kg Free (A+, AU, BH, CA, CO, D, E, IL, J, JO, MA, MX, OM, P, PA, PE, SG), See 9911.02.25– 9911.02.30 (CL), 15.8% (KR)
0207.27.00 Cuts and offal of turkeys, frozen 17.6¢/kg Free (A+, AU, BH, CA, CO, D, E, IL, J, JO, MA, MX, OM, P, PA, PE), See 9911.02.25– 9911.0230 (CL), 15.8¢/kg (KR), 1.7¢/kg (SG)
0207.41.00
Ducks, not cut in pieces, fresh or chilled
8.8¢/kg
Free (A+, AU, BH, CA, CL, CO, D, E, IL, J, JO, KR, MA, MX, OM, P, PA, PE, SG)
0207.42.00
Ducks, not cut in pieces, frozen
8.8¢/kg
Free (A, AU, BH, CA, CL, CO, E, IL, J, JO, KR, MA, MX, OM, P, PA, PE, SG)
A-7
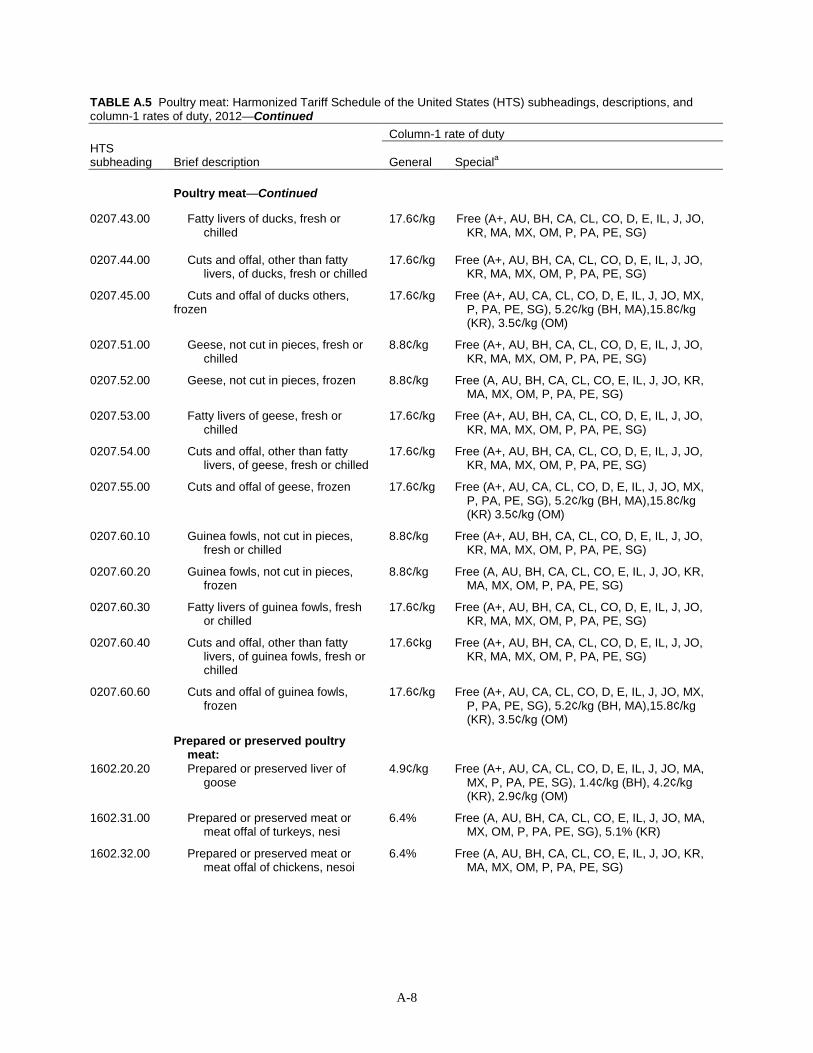
TABLE A.5 Poultry meat: Harmonized Tariff Schedule of the United States (HTS) subheadings, descriptions, and column-1 rates of duty, 2012—Continued
Column-1 rate of duty
HTS subheading Brief description General Speciala
Poultry meat—Continued
0207.43.00
Fatty livers of ducks, fresh or chilled
17.6¢/kg
Free (A+, AU, BH, CA, CL, CO, D, E, IL, J, JO, KR, MA, MX, OM, P, PA, PE, SG)
0207.44.00 Cuts and offal, other than fatty livers, of ducks, fresh or chilled
17.6¢/kg Free (A+, AU, BH, CA, CL, CO, D, E, IL, J, JO, KR, MA, MX, OM, P, PA, PE, SG)
0207.45.00 Cuts and offal of ducks others, frozen
17.6¢/kg Free (A+, AU, CA, CL, CO, D, E, IL, J, JO, MX, P, PA, PE, SG), 5.2¢/kg (BH, MA),15.8¢/kg (KR), 3.5¢/kg (OM)
0207.51.00 Geese, not cut in pieces, fresh or chilled
8.8¢/kg Free (A+, AU, BH, CA, CL, CO, D, E, IL, J, JO, KR, MA, MX, OM, P, PA, PE, SG)
0207.52.00 Geese, not cut in pieces, frozen 8.8¢/kg Free (A, AU, BH, CA, CL, CO, E, IL, J, JO, KR, MA, MX, OM, P, PA, PE, SG)
0207.53.00 Fatty livers of geese, fresh or chilled
17.6¢/kg Free (A+, AU, BH, CA, CL, CO, D, E, IL, J, JO, KR, MA, MX, OM, P, PA, PE, SG)
0207.54.00 Cuts and offal, other than fatty livers, of geese, fresh or chilled
17.6¢/kg Free (A+, AU, BH, CA, CL, CO, D, E, IL, J, JO, KR, MA, MX, OM, P, PA, PE, SG)
0207.55.00 Cuts and offal of geese, frozen 17.6¢/kg Free (A+, AU, CA, CL, CO, D, E, IL, J, JO, MX, P, PA, PE, SG), 5.2¢/kg (BH, MA),15.8¢/kg (KR) 3.5¢/kg (OM)
0207.60.10 Guinea fowls, not cut in pieces, fresh or chilled
8.8¢/kg Free (A+, AU, BH, CA, CL, CO, D, E, IL, J, JO, KR, MA, MX, OM, P, PA, PE, SG)
0207.60.2 0 Guinea fowls, not cut in pieces, frozen
8.8¢/kg Free (A, AU, BH, CA, CL, CO, E, IL, J, JO, KR, MA, MX, OM, P, PA, PE, SG)
0207.60.30 Fatty livers of guinea fowls, fresh or chilled
17.6¢/kg Free (A+, AU, BH, CA, CL, CO, D, E, IL, J, JO, KR, MA, MX, OM, P, PA, PE, SG)
0207.60.40 Cuts and offal, other than fatty livers, of guinea fowls, fresh or chilled
17.6¢kg Free (A+, AU, BH, CA, CL, CO, D, E, IL, J, JO, KR, MA, MX, OM, P, PA, PE, SG)
0207.60.60 Cuts and offal of guinea fowls, frozen
17.6¢/kg Free (A+, AU, CA, CL, CO, D, E, IL, J, JO, MX, P, PA, PE, SG), 5.2¢/kg (BH, MA),15.8¢/kg (KR), 3.5¢/kg (OM)
Prepared or preserved poultry meat:
1602.20.20 Prepared or preserved liver of goose
4.9¢/kg Free (A+, AU, CA, CL, CO, D, E, IL, J, JO, MA, MX, P, PA, PE, SG), 1.4¢/kg (BH), 4.2¢/kg (KR), 2.9¢/kg (OM)
1602.31.00 Prepared or preserved meat or meat offal of turkeys, nesi
6.4% Free (A, AU, BH, CA, CL, CO, E, IL, J, JO, MA, MX, OM, P, PA, PE, SG), 5.1% (KR)
1602.32.00 Prepared or preserved meat or meat offal of chickens, nesoi
6.4% Free (A, AU, BH, CA, CL, CO, E, IL, J, JO, KR, MA, MX, OM, P, PA, PE, SG)
A-8
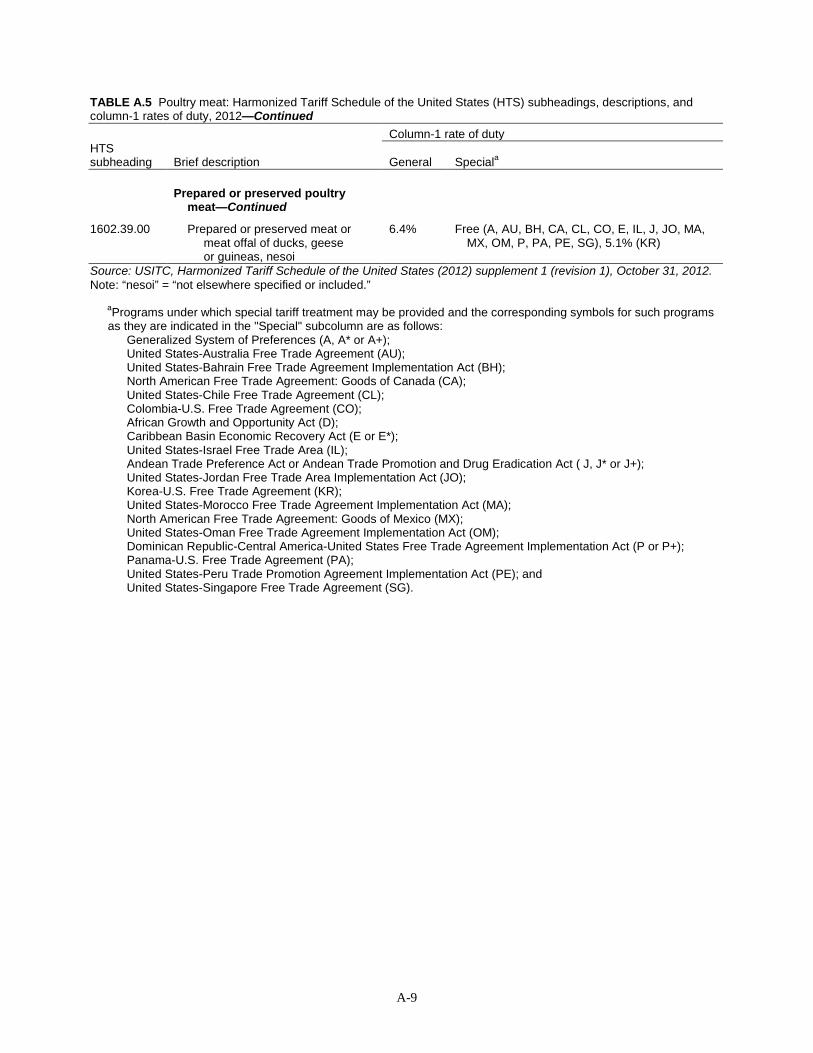
TABLE A.5 Poultry meat: Harmonized Tariff Schedule of the United States (HTS) subheadings, descriptions, and column-1 rates of duty, 2012—Continued
Column-1 rate of duty
HTS subheading Brief description General Speciala
Prepared or preserved poultry meat—Continued
1602.39.00 Prepared or preserved meat or meat offal of ducks, geese or guineas, nesoi
6.4% Free (A, AU, BH, CA, CL, CO, E, IL, J, JO, MA, MX, OM, P, PA, PE, SG), 5.1% (KR)
Source: USITC, Harmonized Tariff Schedule of the United States (2012) supplement 1 (revision 1), October 31, 2012. Note: “nesoi” = “not elsewhere specified or included.”
aPrograms under which special tariff treatment may be provided and the corresponding symbols for such programs as they are indicated in the "Special" subcolumn are as follows: Generalized System of Preferences (A, A* or A+); United States-Australia Free Trade Agreement (AU); United States-Bahrain Free Trade Agreement Implementation Act (BH); North American Free Trade Agreement: Goods of Canada (CA); United States-Chile Free Trade Agreement (CL); Colombia-U.S. Free Trade Agreement (CO); African Growth and Opportunity Act (D); Caribbean Basin Economic Recovery Act (E or E*); United States-Israel Free Trade Area (IL); Andean Trade Preference Act or Andean Trade Promotion and Drug Eradication Act ( J, J* or J+); United States-Jordan Free Trade Area Implementation Act (JO); Korea-U.S. Free Trade Agreement (KR); United States-Morocco Free Trade Agreement Implementation Act (MA); North American Free Trade Agreement: Goods of Mexico (MX); United States-Oman Free Trade Agreement Implementation Act (OM); Dominican Republic-Central America-United States Free Trade Agreement Implementation Act (P or P+); Panama-U.S. Free Trade Agreement (PA); United States-Peru Trade Promotion Agreement Implementation Act (PE); and United States-Singapore Free Trade Agreement (SG).
A-9