Embed Size (px)
Citation preview
September 1983 AE Ext 83middot22
Poultry Farm Business Summary 1982
DL Cunningham
Department of Poultry and Avian Sciences
AC Lowry
Department of Agricultural Economics
New York State College of Agriculture and Life Sciences A Statutory College of Ihe Stale University
Cornell University Ithaca New York 14853
TABLE OF CONTENTS
INTRODUCTION bull bull bull bull bull 1 Good Management is Basic 2 General Sununary of All Farms 3
C1TNMARY_QE_TYlLFCC J IQf)OT]ClTC 13-lT~ 1T1f~~1f~ bull bull bull bull bull bull bull bull bull bull bull bull bull bull bull bull bull bull bull bull bull bull bull bull bull bull bull bull bull 5 Farm income 9 Labor and management income 9 Rate of return on investment bullbullbullbullbullbullbullbullbullbullbullbullbullbullbullbullbullbullbullbullbullbullbullbullbull 10 Net farm cash flow and debt repayment ability bullbullbullbullbullbullbullbullbullbullbullbullbullbullbullbullbull 10
ANALYSIS OF THE EGG PRODUCTION BUSINESSES bullbullbullbullbullbullbullbullbullbullbullbullbullbullbullbullbullbullbullbullbullbullbullbull 11 Size of Business 11 Rates of Production 12 Labor Efficiency 13 Cost Control 14
Labor and machinery costs bullbullbullbullbullbullbullbullbullbullbullbullbullbullbullbullbullbullbullbullbullbullbullbullbullbullbullbullbull 15 Comparison of Recent Sununaries bullbullbullbullbullbullbullbullbullbullbullbullbullbullbullbullbullbull 17 Cost of Producing Eggs bullbullbullbullbullbullbullbullbullbullbullbullbullbullbullbullbullbullbullbullbullbullbull 18
FARM BUSINESS SUMMARY 19 Farms bullbullbullbullbullbullbullbullbullbullbullbullbull 20 Averages Per Hen 26 Farms bullbullbullbullbullbullbullbullbullbullbull 21 26 Farms 22
Progress of the Farm Business bullbullbullbullbullbullbullbullbullbullbullbullbullbullbullbullbullbullbullbullbullbullbullbullbullbullbullbull 23
SUMMARY OF SELECTED POULTRY FARM MANAGEMENT FACTORS bullbullbullbullbullbullbullbullbullbullbull 24
1982 NEW YORK POULTRY FARM BUSINESS SUMMARY
Large nonfarm businesses usually prepare and publish an annual report in which they review and analyze the business for the year This provides a basis for evaluating past operations and for making plans for the future A similar summary and analysis is useful in managing a farm business The Cooperative Extension business management projects provide farm operators an annual business report which can be used much the same as nonfarm business annual reports
Poultry farm business management records have been summarized by the College of Agriculture and Life Sciences at Cornell for a number of years For the 1982 record year 26 poultrymen submitted records for summary and analysis Extension field staff working with poultrymen collected the figures for each farm and the College staff summarized them The summary results are presented in this workbook
Poultry farm businesses vary in organizational makeup The farms included in this report were divided into two groups poultry (egg production) only and poultry and others which include those with other major enterprises such as crops dairy or hogs
The economic climate for poultry producers in 1982 showed little improvement over 1981 The cost of producing eggs in 1982 was 17~ greater than 1981 while egg prices averaged 20~ a dozen lower Many poultrymen again had negative labor incomes in 1982
This workbook is designed to provide a systematic summarization and analysis of a poultry business The group averages can be used in making comparisons Working through this report step by step provides a good checkup for a poultry operation In addition to the persons whose records are in the summary this report should be useful to other poultrymen in the State to teachers of agriculture college farm management instructors agency representatives and to agribusiness persons
Acknowledgements
This summary was prepared by D L Cunningham Department of Poultry amp Avian Sciences and A C Lowry Department of Agricultural Economics New York State College of Agriculture and Life Sciences in cooperation with Cooperative Extension Specialists S E Ackerman and W J To1eman Barbara Wilcox supershyvised the summarization of the records and Barbara Smagner typed this report
-2shy
GOOD MANAGEMENT IS BASIC
HOW DO YOU MEASURE UP
II] 1 Have you developed a systematic approach to
management problems
2 Do you have the facts on your business
3 Are you Improving your managerial skills
Steps in making a management decision
1 Locate the trouble Ipot (problem)
2 What is your obiedive (goal
3 Size up what you have to work with (resource)
4 Look for various ways to solve the the problem (alternatives)
5 Consider probable results of each way (consequences)
6 Compare the expected results (evaluate)
7 Select way best suited to your situation (decision)
8 Put the decision into operation (action)
This workbook can help your
-3shy
General Summary of All Farms
Twenty-six poultry farm records for 1982 were used for this summary The organization of these farms varies widely There were seven poultry with other major enterprises and nineteen layer only operations In this general section all businesses are included For the more detailed analysis in the sections that follow the 19 layer operations and the seven layer with other operations are included
Table 1 FARM BUSINESS FINANCIAL SUMMARY 26 New York Poultry Farms 1982
Average All Farms Item 1982
Average Capital Investment
Total Farm Receipts Total Farm Expenses
Farm Income Interest 9 on Capital
Labor and Management Income Per Farm Number of Operators
LABOR AND MANAGEMENT INCOME PER OPERATOR
$416426
468289 436598
$ 31691 $ 37478
$ -5787 1385
$ -4178
Labor and management income is a measure of the return to the operator for his labor and management It is the most commonly used measure for comshyparing the overall results of farm operations For these 26 poultry farms the average labor and management income per operator was $-4178 In addition to the labor and management income the operator usually has certain privileges such as a house to live in eggs and poultry to use and other miscellaneous items
Labor and management income per operator varied widely There were 17 farms with minus labor incomes and 2 with incomes per operator of over $30000 Twelve of the farms with minus incomes were in the layer group
The average capital investment on these 26 farms was $416426 The receipts averaged $468289 and the expenses $436598 On these farms the receipts were conSiderably more than the capital investment giving a capital turnover (as measured by the number of years for the receipts to equal the capital) of about 09 This is in contrast to dairy businesses where commonly it takes two to three years for receipts to equal capital
Poultry prOducers in 1982 again faced high production costs and low egg prices These factors combined with a 9 interest charge on average capital produced a negative income situation for many poultry producers Poultry farms in our Poultry Business Summaries for the years 1976-1979 have averaged a labor income per operator of $18774 indicating that over the long run egg proshyducers have had positive incomes in New York However for the period 1980-1982 egg producers have averaged a labor income per operator of~19952
-4shy
Table 2 GENERAL FARM BUSINESS FACTORS 26 New York Poultry Farms 1982
Business Factor Average 26 Farms
Worker equivalent 37
Months unpaid labor 33 Months hired labor 25 Total months of labor 449 Percent of labor hired 56 Average cost per month for hired labor $1051
Average number hens for year 28727
Eggs produced per hen 248 Pounds feed per dozen eggs produced 40 Average price per cwt layer feed $ 828
Average price received per dozen eggs 586cent
Poultry farm operations differ a great deal in their organization Poultry only versus poultry combined with other enterprises is another while contract versus independent operations is still another The range in the capital investment is a reflection of these factors The low capital investshyment was $61000 while the high was nearly 13 million Similarly the lowest expense reported was $75000 while the high was 14 million The wide range indicates that one should recognize limitations in the averages when they are used
The labor force on these farms ranged from 13 to 85 worker equivalent with an average of 37 For all 26 farms 56 of the labor was hired and the rest was furnished by the operator and his family The average labor expense per month of hired labor was $1051 Unpaid family labor was valued at $500 per month
Number of hens is a common measure of size for a laying operation The numbers varied from 6600 to 102000 These figures reflect the average number of layers for the year The number of eggs produced per hen averaged 248 but with a range of 187 to 286
Marketing arrangements differ with some selling all eggs wholesale while other sell at retail The average price received per dozen sold by the 26 farms during 1982 was 586 cents A number of poultry producers in the summary had premium markets
Feed is the major cost item on poultry farms Efficiency of feed conshyversion is an important factor affecting incomes It is not easy to arrive at this figure on many farms but efforts were made to calculate this factor The average for the 26 farms was 40 pounds per dozen eggs Layer feed costs per hundredweight averaged $828
-5shy
SUMMARY OF THE EGG PRODUCING BUSINESSES
The first step in examining any business operation is a systematic summary of the business In this section we will examine the physical resources business practices capital investment receipts expenses and the financial summary for the year
Physical Resources and Business Practices
Below is a summary of the physical resources and business practices used by the 19 farms with poultry only and the 7 farms with poultry and other for the year 1982
Table 3 LABOR FORCE LIVESTOCK CROPS GROWN AND BUSINESS PRACTICES 26 New York Poultry Farms 1982
Aver Per Farm amp Numbers Reporting My 19 Farms with 7 Farms with
Item Farm Poultry Only Poultry amp Other
Labor Months of Operators (19 farms) 145 (7 farms) 223 Family--unpaid (10 farms) 35 (4 farms) 26 Hired (17 farms) 235 (7 farms) 292
Total 415 541
Worker equivalent 34 45 Number of operators 121 1858 Percent of labor hired 57 54
Livestock (number) Laying hens 27205 32856 Pullets raised (7 farms) 34219 (2 farms) 39500
Business Practices Percent of eggs marketed Wholesale 41 37 Premium outlet 51 51 Retail 8 12
Percent of replacement pullets Raised 65 67 Bought 35 33
Percent of layer feed Purchased 98 89 Homegrown 2 11
Average of number reporting
-6shy
Capital Investment
The capital used to operate a poultry business is invested in machinery and equipment poultry feed and supplies and land and buildings )Some of the capital used is owned by the operator and some is borrowed The end-ofshyyear farm inventory is used as a measure of the capital investment in the business It is suggested that the inventory reflect market value
Table 4 FARM INVENTORY VALUES JANUARY 1 1983 26 New York Poultry Farms
Amount Per Farm My 19 Farms with 7 Farms with
Item Farm Poultry Only Poultry 6 Other
Machinery 6 equipment $____________
Poultry
Other livestock
Feed 6 supplies
Land 6 buildings
TOTAL INVESTMENT $_____
$ 87554
44196
447
10820
161931
$304948
$184345
41583
48345
98489
363300
$736062
Total investment on these farms ranged from $61000 to $1354000 Six of the poultry and other farms and seven of the poultry only farms had investments of more than $250000 The inventories of land and buildings machinery and feed and supplies were larger on the farms with other entershyprises
How the capital is used is more important than the amount Below are some measures used in analyzing the efficiency of the use of capital Farms having other enterprises have larger investments because of the added land and machinery used
Table 5 CAPITAL INVESTMENT ANALYSIS
My 19 Farms with 7 Farms with Item Farm Poultry Only Poultry 6 Other
Total investmentworker $ $ 89691 $163569
Total investmenthen $ $ 1121 $ 2240
Machinery investment hen $ $ 322 $ 561
Land 6 buildingshen $ $ 595 $ 1106
Land 6 buildings are of total investment 53 49
Capital turnover (years) 66 154
-7shy
Receipts
The source and amount of receipts tells us about the nature and size of the business The size of many nonfarm businesses often is measured in terms of gross sales However in poultry businesses egg price fluctuations from year to year cause total receipts to fluctuate also
Table 6 FARM RECEIPTS 26 New York Poultry Farms 1982
Item
Egg sales Poultry sales Other livestock sales Crop sales Work off farm Government payments amp refunds Miscellaneous
Total Cash Farm Receipts Increase in Inventory
TOTAL FARM RECEIPTS
My Farm
$_---shy
$___________
$_____
19 Farms with Poultry Only
$445703 4493
-0shy1017
19 25
2612
$453869 10849
$464713
7 Farms with Poultry amp Other
$352850 5483
74173 27128
504 2186 5286
$467610 10386
$477996
Total farm receipts averaged $464713 for the farms with poultry only and $477996 for the farms with poultry and other Egg sales accounted for 95 percent and 75 percent respectively of the cash receipts on the two groups of farms Crop sales accounted for 6 percent of the cash receipts on the farms with other enterprises and the poultry and livestock sales accounted for 17 percent of the cash receipts
Increases in inventory are usually due to expansion or improvements in the business Inventory increases are considered as farm receipts The increases could have been sold and converted to cash therefore they are conshysidered as receipts in summarizing the years business Costs associated with the increases are reported as farm expenses
Table 7 INCOME ANALYSIS
Item My
Farm 19 Farms with Poultry Only
7 Farms with Poultry amp Other
Av pricedoz of eggs sold Total cash receiptsworker Total (cash) receipts per
$1000 average investment
____________cent $---------- shy$
614cent $133491
$ 1510
522cent $103913
$ 640
The 19 farms with poultry only reported an average pricedozen eggs sold of 6l4cent compared to the 522cent price reported for poultry and other farms This difference in price was a reflection of the difference in the percentage of eggs marketed wholesale versus retail for the two types of operations
-8shy
Expenses
Knowing where the money went is important in any business analysis The first step in controlling costs on poultry farms is to know what the expenses are and how they compare with those of other businesses Below is a summary of the average farm expenses for these two groups of poultry farms
Table 8 FARM EXPENSES 26 New York Poultry Farms 1982
My 19 Farms with 7 Farms with Item Farm Poultry Only Poultry amp Other
Chicks purchased $_----(9 farms)
Pullets purchased 13 farms)
Layer feed bought
Other feed
Hired labor
Machine hire
Poultry equip repair
Machinery expense
Gas and oil
Poultry supplies etc
Crop expense
Building expense
Taxes
Insurance
Utilities
Eggs bought for resale (12 farms)
Other livestock
Miscellaneous
TOTAL CASH OPERATING EXPENSE $----- shy
New machinery
Real estate
Unpaid labor
Decrease in inventory
TOTAL FARM EXPENSES $----- shy
$ 4066 $ 9978
25033 32005
175277 154129
12481 17740
25044 29637
3170 1242
1888 663
5371 11724
6181 20955
21422 15049
1525 43857
1940 286
2457 5813
4263 5967
9081 13302
91995 (0 farms) -0shy
2407 14121
7187 9605
$400808 $386073
12961 13339
23657 29729
1512 1111
-0- -0shy
$438938 $430252
Interest paid averaged $19495 for the 19 farms and $32865 for the seven farms Sixteen farms did not report equity capital so in the summary a 9 interest charge on all capital was used and interest paid was omitted from the cash expenses
-9shy
Financial Summary
The financial success of a poultry business can be measured in varied ways There is no one best measure so in this summary several are used
Farm income measures the return from the business to the operator for his labor and management and capital Farm income is the difference between total receipts (including increase in inventory) and total expenses (including decrease in inventory)
Table 9 FARM INCOME AND LABOR AND MANAGEMENT INCOME 26 New York Poultry Farms 1982
My 19 Farms with 7 Farms with Item Farm Poultry Only Poultry amp Other
Total farm receipts $_---shyTotal farm expenses
FARM INCOME $_---shyInterest on Average Capital 9 Labor income per farm $____________ Number of operators
LABOR AND MANAGEMENT INCOME PER OPERATOR $_____
$464713 $477996 438938 430252
$ 25775 $ 47744 27052 65778
$ -1277 $-18034 121 1385
$ -1055 $-13021
Labor and management income is the return to the farm operator for his time and efforts This is the measure most commonly used when studying farm businesses To get labor and management income a 9 interest charge on the operators average capital is subtracted from the farm income The charge on average capital represents an opportunity cost or what could have been earned had this capital been invested in something such as a certificate of deposit
The average labor income per operator for the 19 farms was $-1055 and for the 7 farms $-13021 The 26 poultry farms had farm receipts that exceeded total farm expenses however when the 9 interest on average capital was deducted it resulted in negative returns
The labor and management incomes varied widely as shown below Sixty-five percent of the farms had a minus income while 12 percent had incomes of $20000 or more
Table 10 DISTRIBUTION OF LABOR INCOMES FOR 26 POULTRY OPERATIONS Labor and Management Income Per Operator
Farms Number Percent
Minus o shy
$10000 -$20000 -
$ 9999 $19999 or more
17 5 1 3
65 19
4 12
-10shy
Table 11 RATE OF RETURN ON INVESTMENT 26 New York Poultry Farms 1982
My 19 Farms with 7 Farms with Item Farm Poultry Only Poultry amp Other
Farm income
Minus value of operators labor and management
Return on investment Average capital investment RATE OF RETURN ON INVESTMENT
$_---shy
$_---shy$----shy----_
$ 25775
10200
$ 15575 $300579
52
$ 47744
18000
$ 29744 $730869
41
$10000 per operator - some farms had more than one operator
Rate of return on investment is calculated by subtracting from the farm income a charge for the operators labor and management and then dividing by the average investment for the year In the above calculation $10000 has been used as the value of the operators labor and management This is a modest charge for the operators labor and management
Net farm cash flow reflects the cash available from the years operation of the farm business for family living interest and debt payments and new capital purchases or investments A family may have had additional cash available if some member of the family had a nonfarm income or if money was inherited or borrowed
Debt repayment ability is a measure of the amount of cash available for debt payments It is calculated by deducting family living expenses from the farm cash operating income Since actual living expenses were not available they were estimated at $10000 per operator It is assumed here that new machinery and real estate are purchased with borrowed capital This measure is useful in planning debt repayment schedules
Table 12 NET FARM CASH FLOW AND DEBT REPAYMENT ABILITY 26 New York Poultry Farms 1982
Item My
Farm 19 Farms with Poultry Only
7 Farms with Poultry amp Other
Total cash receipts Total cash operating expense NET FARM CASH FLOW $_---shy
$453869 400808
$ 53061
$467610 386073
$ 81537
Less family living expense DEBT REPAYMENT ABILITY $_----shy
12100 $ 40961
~8~ $ 62937
Estimated at $10000 per operator per year
-11shy
ANALYSIS OF TH~ EGG PRODUCTION BUSINESSES
The summary of a business provides an overall look at the operation It shows what you did The analysis which follows includes a more detailed examination of the different parts of the business The analysis helps to show WHY you did what you did and to find ways to improve the operation Measures have been developed to aid in analyzing farm business strengths and weaknesses
In this section several business factors are examined Among these are size of business rates of production labor efficiency and cost control Since many of the measures are interrelated all of the factors should be examined before arriving at major conclusions A complete analysis of the factors should point up the major strong and weak points of a business
Size of Business
Size is usually the first factor examined when analyzing a business Size affects other factors such as labor efficiency and cost control Prices received and paid by poultrymen are often affected by volume which is a function of the size factor
Farm management research has shown that in general large farm businesses make larger incomes There are two basic reasons for this Larger businesses make possible more efficient use of inputs such as equipment the regular labor force and other fixed cost items Secondly there are more units of production (hens) on which to make a profit However when a business is unprofitable these same factors operate and large farms have larger losses
Table 13 MEASURES OF SIZE OF BUSINESS 26 New York Poultry Farms 1982
My 19 Farms with Measure Farm Poultry Only
Number of hens
Dozens of eggs sold
Dozens of eggs produced
Worker equivalent Total farm receipts
Total investment (end year)
27205
727147
557097
34
$464713
$304948
7 Farms with Poultry [ Other
32856
693103
693103
45
$477996
$736062
Inc1udes eggs bought for resale
-12shy
Rates of Production
Rates of production for both poultry and crops are factors contributing to the success of poultry businesses It is a challenge to find the levels of inputs such as feed and fertilizer which will give rates of production that yield the highest net income This means a consideration of both the physical and economic returns from production
Table 14 MEASURES OF RATES OF PRODUCTION 26 New York Poultry Farms 1982
My 19 Farms with 7 Farms with Measure Farm Poultry Only Poultry amp Other
Eggs producedhen 235 243
Eggs soldhen 261 253
Eggs produced and sold per hen is used in measuring the rate of production on poultry farms Production per hen is calculated by dividing total eggs produced by the average number of hens for the year Some farmers bought eggs for resale For eggs sold per hen the eggs bought have been added to the dozens produced to get the eggs sold per hen
The eggs produced per hen averaged 235 and 243 for the two groups The range for the 26 farms was from 187 to 286 eggs produced per hen This is a range of 99 eggs per hen from the lowest to the highest
The relationship of eggs produced per hen and labor and management income is illustrated below
Table 15 EGGS PRODUCED PER HEN AND LABOR AND MANAGEMENT INCOME 19 New York Poultry Farms 1982
Eggs Produced Number of Average Number Labor amp Management Per Hen Farms of Hens IncomeOnerator
Less than 225 6 20113 $ -9280
225 - 245 6 12987 $-16478
More than 245 7 45471 $ -1517
Farms producing less than 245 eggs per hen had lower labor incomes than those with higher production rates The seven farms ~roducin~ 245 eggs or more per hen had the best labor incomes
-13shy
Labor Efficiency
Labor efficiency is sometimes claimed to be the most important single business factor affecting incomes on farms today This is brought about by the fact that the operatorts labor and management income is a function of the labor output Rising farm wage rates over time have meant that generally more output is required to pay those wages If a poultryman wants top efficiency from his hired workerts time as well as his own he must keep a close watch on the factors which affect labor efficiency
Table 16 MEASURES OF LABOR EFFICIENCY 26 New York Poultry Farms 1982
My 19 Farms with 7 Farms with Measure Farm Poultry Only Poultry amp Other
Dozens eggs soldworker 209966 154023
Dozen eggs producedworker____________ 160864 154023
Number hensworker 7856 7301
Inc1udes eggs bought for resale
The farms with poultry only had higher labor efficiencies than the farms with poultry and other In part the higher dozen eggs sold per man reflects that practice of the poultry only group of buying eggs for resale Also on the poultry and other farms a considerable amount of work is on the crops This means more total time per hen or per dozen of eggs than on a poultry only operation
When analyzing your labor efficiency consider
1 Size of operation - it tends to reduce the overhead time per unit
2 Extent of work performed - ie wholesale vs retail marketing
3 Arrangement of buildings and work areas
4 Work methods - the easy way vs the hard way
5 The human factor or how fast persons work
6 Clarity of directions given to workers
7 Kind of hired workers employed
-----
-14shy
Cost Control
The 19 poultry farms expenses average $1100 per day With expenses of this amount cost control is important As more input items are purchased cost control has a greater effect on incomes Cost control is difficult to measure but an analysis of good records can provide some useful checks and point to possible areas of cutting costs
Feed labor and machinery are big cost items on poultry farms but it is important to watch the other costs too Small leaks can build up into sizable losses The next three pages are provided to help study your costs
Table 17 COST CONTROL MEASURES 26 New York Poultry Farms 1982
My 19 Farms with Item Farm Poultry Only
Value of layer feedhen
Layer feeddoz eggs produced
Lbs feeddoz eggs produced
Total labor cost per hen
Total labor cost per dozen eggs produced
Building repairs per hen
Utilities per hen
Taxes per hen
Insurance per hen
Total farm production expenses hen (total less inventory increase and eggs bought)
Total expenses per $100 receipts
$ 658
35cent
43
$ 134
50cent ----_cent
7lcent ----_cent
334cent
90cent
l57cent ----_cent
$1235
$ $9488
7 Farms with Poultry amp Other
$ 516
36cent
44
$ 130
61cent
09cent
405cent
177cent
l82cent
$1277
$9001
Includes operators labor
For the above measurements it must be kept in mind that the poultry and other farms had other enterprises which affect several cost control measures As a result the total expenses per hen are generally higher for the poultry and other farms
-15shy
Labor and machinery costs are sizeable ona poultry farm It is important to keep these under control Since labor and machinery work as a team it is
My l~ JiHW WJIU
Item Farm Poultry Only Poultry amp Other
Beginning inventory New machinery bought
Total (1)
End inventory Machinery Sold
Total (2)
$
$
$
$
$ 87612 12961
$87554-0shy
$ 100573
$ 87554
$ 197953 13339
$ 211292
$184345-0shy
$184345
Depreciation (1 minus 2) $
Int 9 avo inventory
Gas and oil
Machinery repairs and auto expense
Machine hire
E1ec amp Util (farm share)
Total Power and Machinery Cost
Less Gas tax refund $ Income from machine work
NET POWER AND MACHINERY COST
S
$ 13 019 7882
6181
5371
3170
9081
$ 24
-0shy
S
S
44704
44728
$ 26947 17 203
20955
11724
1242
13302
$ 91373 $-0shy
-oshy$ 92528
Net power and machinery costs
per hen
per worker
per dozen eggs produced
$164
$13155
8l~
$282
$20562
13 3~
Does not include eggs bought and resold
Depreciation is the largest item in the power and machinery cost group This is an indirect item and along with interest is often overlooked Often ntarly half of the cost is represented by these two overhead items
With the jump in fuel prices in recent years the gas and electricity items have taken on added importance Look for ways to save on energy use
-----------------------------------------------------------------------------------
------
------------
-16shy
Farmers sometimes justify high machinery costs on the basis that the machinery saves on high cost labor It is well to examine this justificashytion The combined machinery and labor cost measure gives a good check
Table 19 LABOR AND POWER AND MACHINERY COSTS 26 New York Poultry Farms 1982
My 19 Farms with 7 Farms with Item Farm Poultry Only Poultry amp Other
Value of labor of operator $ 12100 $ 18600$_---shyHired labor 25044 29637 Unpaid family labor 1512 1111
TOTAL LABOR COSTS $ 38656 $ 49348$_---shyNet power amp machinery cost 44728 92528
TOTAL LABOR amp MACHINERY COSTS $_____ $ 83384 $ 141876
Labor cost per hen $ $142 $150 Labor costdozen eggs produced 70lt- 71ltshyLabor and machinery cost
per hen $ $306 $432 per dozen eggs sold cent 115lt- 205cent
Valued at $10000 per operator
For the 19 poultry only farms the labor cost was less than the power and machinery cost For the poultry and other the machinery and power cost was more It is important to watch the combined labor and machinery costs It is easy to spend for additional machinery but neglect to reduce the labor used Below are some measures for use in examining labor costs
Table 20 LABOR USE ANALYSIS
My 19 Farms with Item Farm Poultry Only
Months of hired labor
Hired labor expense
Labor expensemonth hired
Total labor costmonth
Percent of total labor by Operator
Unpaid family
Hired
$
$
$
235
$25044
$ 1066
$ 929
35
8
53
t Farms with Poultry amp Other
292
$29637
$ 1015
$ 827
41
5
52
-17shy
Comparison of Recent Summaries
Businessmen must keep abreast of changes that are taking place The poultry industry has changed more than many types of farm businesses Below is a comparison of selected factors from the last five New York poultry summaries
In comparing these factors keep in mind that the farms included from year to year vary as indicated by the number of farms and there is also some change in individuals each year
Table 21 NEW YORK POULTRY FARM SUMMARIES 1978-1982
Factor 1978 1979 1980 1981 1982
Number of farms 25 24 24 26 26
Worker equivalent 42 46 43 43 37 Number of hens 23115 36350 40390 40719 28727
Investment Land amp buildings $175731 $255515 $267174 $264449 $216146 Machinery 93667 109466 109693 118274 113613 Livestock amp poultry 42189 64601 75833 76863middot 56162 Feed amp other 36654 46562 39712 31538 35096
Total $348241 $476144 $492144 $491124 $421017
ReceiIts Egg sales $342575 $469531 $506927 $561757 $420704 Livestock sales 18724 23762 18832 22501 24730 Other 51068 56586 35040 21263 36865
Total $412367 $549879 $560799 $605521 $457569
EXIenses Feed bought $125147 $220121 $305982 $299047 $183480 Hired labor 24026 33270 30980 30385 26280 Chicks amp pullets 29713 50660 48870 50806 32568 E1ec bull uti1 amp phone 4822 6951 8490 9497 10218 Other 200894 190095 193296 181984 144294
Total $384602 $501097 $587618 $571719 $396840
Business Factors Av pricedoz eggs 588cent 556cent 548cent 633cent 586cent Eggs per hen 228 240 240 231 237 Hens per worker 5500 7900 9400 9383 7956 Lbs feeddoz eggs 46 40 40 43 40
Labor incomeoperator $ 8635 $ 13216 $-47536 $ -8278 $ -4178
Inc1udes only layer operations omits the contract pullet operations
-18shy
Cost of Producing Eggs
Table 22 AVERAGE FARM COST OF PRODUCING EGGS 19 New York Poultry Farms 1982
My 19 Farms with Item Farm Poultry Only
Total farm expenses
Interest on ave capital 9 $_---shy $~J8 938
27052
Operators labor and Management 12100
Total Cost
Total receipts
Less egg sales $_---shy $464713
445703
Other Income
Cost of Producing Eggs (Total Cost Less Other Income)
Dozen eggs sold
Cost per dozen eggs sold
Average price received
$478090
19010
$459080
727147
63lcent
6l3cent
Figured at $10000 per operator
By adding to the total farm expenses an estimate of the value of the operators labor and management and an interest charge on the capital used the farm cost of producing eggs can be calculated The value of the operators labor and management was estimated at $10000 per year This was based on estimates made by dairymen Receipts for items other than eggs are credited against the total cost on the assumption that these items were proshyduced at cost
Farm expenses include costs for eggs purchased for resale This tends to impose some egg market values in the calculation of production costs
This farm unit method of calculating the cost of producing eggs has limitations but it does give a general indication of the overall costs This method was applied to the farms with poultry only
-19shy
Table 23 COST ITEMS IN PRODUCING A DOZEN EGGS 26 New York Poultry Farms 1982
Item My
Farm Amount Cost Per Dozen
Percent
Feed for layers Replacements
Chicks amp pullets bought Grower feed
Total Less sale of birds
---_cent
---_cent
52 22 74cent
8
321cent
82 35
117 13
509
Net Replacement Cost Labor Power amp machinery (without interest) Interest on capital Poultry supplies etc Taxes amp insurance All other
66cent 69 66 49 39 12
9
104 109 105
78 62 19 14
Total cent 631cent 1000
Cost per doz eggs sold Another approach to the cost of producing eggs is to examine individual cost
items This has been done above for the 20 poultry only farms Some items have been calculated in earlier sections and the total cost per dozen was calculated by the farm unit method on page 21
The feed cost of321cent is the total layer feed expense divided by the dozen of eggs produced Feed for layers accounted for 509 percent of the total cost of producing a dozen eggs
Replacement costs include the expense for chick and pullets bought and grower feed Fuel and other direct costs involved in rearing are not included here but are in other items listed Hence this replacement cost is on the low size Receipts from birds sold are subtracted to get a net replacement cost Replaceshyments accounted for about one-eighth of the total cost
The labor item includes a value for the operators work but not his manageshyment The interest charge in power and machinery costs shown on page 18 was taken out since it is included in interest on capital Building repairs and depreciation would be an item in the all other
Table 24 COMPARISON OF COSTS OF PRODUCING EGGS IN RECENT YEARS
Av Price Farm Unit Poultry Feed ~osts7Doz Labor Cost Year Received Cost Per Doz Ration Cents Total Per Doz
1972 326cent 344cent (cwf)$450 l73cent 50 46cent
1973 548 525 675 303 58 51 1974 524 542 709 320 59 39 1975 571 579 702 322 56 46 1976 593 576 689 314 55 55 1977 537 511 656 285 56 47 1978 528 531 567 258 49 55 1979 565 546 756 286 52 47 1980 550 639 873 400 63 43 1981 633 614 840 350 57 45 1982 614 631 828 321 51 69 For Poultry Only farms in business summaries
-20 shy
FARM BUSINESS SUMMARY 19 New York Poultry Farms 1982
CAPITAL INVESTMENT 1182
Machinery amp equip $ 87612 Livestock 54937 Feed amp supplies 10410 Land amp bujldings 143250
TOTAL INVESTMENT $296209
EXPENSES
Replacements Chicks bought Pullets bought
Feed Layer feed bought Other feed
Labor Hired Unpaid
Power and ~achinery Machine hire Machinery repair Gas and oil Uti
Poultry Eggs bought for resale Livestock expense Supplies
Crop Crop expense
Real Estate Land bldg amp fence repair Taxes Insurance
Capi tal Items New machinery New real estate
Other Advertising amp promotion Miscellaneous Decrease in inventory
TOTAL FARM EXPENSES
1183
$ 87554 44937 10820
161931
$304948
$ 4066 25033
$175277 12481
25044 1512
3170 5371 6181 9081
91 995 2407
21422
1545
1940 2457 4263
12961 23657
-0shy9075
-0shy
$438938
RECEIPTS
Egg sales Livestock sold Crop sales Miscellaneous
Total Cash Receipts Increase in Inventory
TOTAL FARM RECEIPTS
FINANCIAL SUNMARY Total Farm Receipts Total Farm Expenses
Farm Income
Interest on capital 9
Farm Labor Income
Number of operators
LABOR INCOMEOPERATOR
BUSINESS FACTORS
Worker equivalent Number of hens Number of pullets raised
(7 farms) Dozen of eggs (produced)
Eggs produced per hen
Dozens of eggs producedworker Hens per worker
Lbs feeddoz eggs produced Av pricecwt feed bought
Av pricedoz eggs (all)
$445703 4493 1017 2656
$453869
$464713
$464713 438 1 938
$ 25775
27 2052
$ -1277
121
$ -1055
34 27205 12607
557097
235
165068 11 335
39 $ 828
6lt~cent
-21
FARM BUSINESS SUMMARY - AVERAGES PER HEN 26 New York Poultry Farms 1982
CAPITAL INVESTMENT 1182 1183 RECEIPTS
Machinery amp equip Livestock Feed amp supplies Land amp buildings
$ 322 202
38 52]
$ 322 164
40 595
Egg sales Livestock sold Crop sales Miscellaneous
$ 1638 17 04 10
TOTAL INVESTMENT
EXPENSES
$ 1089 $ 11 21 Total Cash Receipts Increase in Inventory
TOTAL FARM RECEIPTS
$ 1668 40
$ 1708
Replacements Chicks bought Pullets bought
Feed Layer feed bought Other feed
$ 15 92
644 46
FINANCIAL SUMMARY
Total Farm Receipts Total Farm Expenses
Farm Income
$ 1708 1613
$ 95 Labor
Hired Unpaid
Power and Machinery Machine hire Machinery repair Gas and oil
92
06
12
20
23
Interest on capital 9
Farm Labor Income
LABOR INCOMEOPERATORHEN
99
$ -04
$ -03
Util 33 Poultry
Eggs bought for resale Livestock expense Supplies
338 09 79
Crop Crop expense
Real Estate 06
Land bldg Taxes
amp fence repair 07 09
Insurance 16 Capital Items
New machinery New real estate
48
87 Other
Advertising amp promotion Miscellaneous
-0shy33
Decrease in inventory -0shy
TOTAL FARM EXPENSES $ 1613
-22shy
FARM BUSINESS SUMMARY 26 New York Poultry Farms 1982
CAPITAL INVESTMENT 1182
Machinery amp equip $117320 Poultry 53094 Other livestock l3420 Feed amp supplies 33466 Land amp buildings 194535
TOTAL INVESTMENT $411835
EXPENSES
Replacements Chicks bought Pullets bought Other livestock
Feed Layer feed bought Other feed
Labor Hired Unpaid
Power and Machinery Machine hire Machinery repair Gas and oil UtH
Poultry Eggs bought for resale Livestock expense Supplies
Crop Crop expense
Real Estate Land bldg amp fence repair Taxes Insurance
Capital Items New machinery New real estate
Other Decrease in inventory Miscellaneous
TOTAL FARM EXPENSES
-----------------_
1183 $1136l3
43492 l3343 34423
216146
$421017
$ 5658 26910
3062
169583 13897
26280 1404
2651 8639
10158 10218
67227 2499
19706
12937
1495 3360 4722
l3063 25291
-0shy7~838
$436598
RECEIPTS
Egg sales Poultry sold Other livestock Crop sales Miscellaneous
Total Cash Receipts Increase in Inventory
TOTAL FARM RECEIPTS
FINANCIAL SUMMARY
Total Farm Receipts Total Farm Expenses
Farm Income
Interest on average capital 9
Farm Labor Income
Number of operators (36)
LABOR INCOMEOPERATOR
BUSINESS FACTORS
Worker equivalent Number of hens Number of pullets raised
( 9 farms) Doz of eggs (produced)
Eggs producedhen
Doz of egzs producedworker Hens per worker
Lbs feeddoz eggs produced Av pricecwt feed bought
Av pricedoz eggs (all)
$420704 4760
19970 8047 4088
$457569 10720
$468289
$468289 436 1 598
$ 31691
37478
$ -5787
1385
$ -4187
37 28727
12251 593714
237
164127 7956
40 1020
589cent
----
-23shy
Progress of the Farm Business
There are two kinds of comparisons used in analyzing a farm business On~ iQ tht nf ~nmnlno 111 hua-f1oCC Irfh t-hdlf n-F nt-ho ftl1 +=- ___ r(I1
Your business analysis on the preceding pages provide the factors for 1982 You will need to refer to earlier summaries for the 1980 and 1981 factors
Target 1980 1981 1982 1983
Size of Business Average number of layers Value of egg sales $---- $_-- $_-- $_--shyWorker equivalent
Rate of Production Eggs produced per hen
Labor Efficiency Hens per worker Dozen eggs sold per worker
CaEita1 Efficiency Total inventory value $ $ $ $_-shyTotal investmenthen $ $ $ $_-shyFarm receipts per $100
investment $ $_--shy
Cost Control Layer feed bought per hen $ $ $ $_---Lbs feed per dozen eggs Labor cost per hen $ $_-shyMachinery cost per hen $ $_--shyTotal expense per $100
receipts $ $ $ $_-shy
Prices Average price per dozen $ $ $ $_-shy
Financial Summary Total Farm Receipts $ $ $ $_-shyTotal Farm Expenses $ $ $ $_--shyLabor amp management income
per operator $ $
Total debt outstanding $ Debt per hen $
Net Worth $ $ $_--shy
-24shy
SUMMARY OF SELECTED POULTRY FARM MANAGEMENT FACTORS
NAME
Item Your Farm 1982
Avg Number of Layers
Eggs ProducedHen
Pounds of FeedDozen
Feed CostTon ($)
Feed CostDozen ($)
Cash CostDozen ($)
Price ReceivedDozen Sold
Total Cash Receipts ($)
Total Cash Expense ($)
Net Cash Flow ($)
(cent)
Debt Repayment Ability ($)
Ending Farm Inventory ($)
Labor Income ($)
28727
237
40
165
321
551
614
$457567
396840
60727
40961
421017
-4178
1
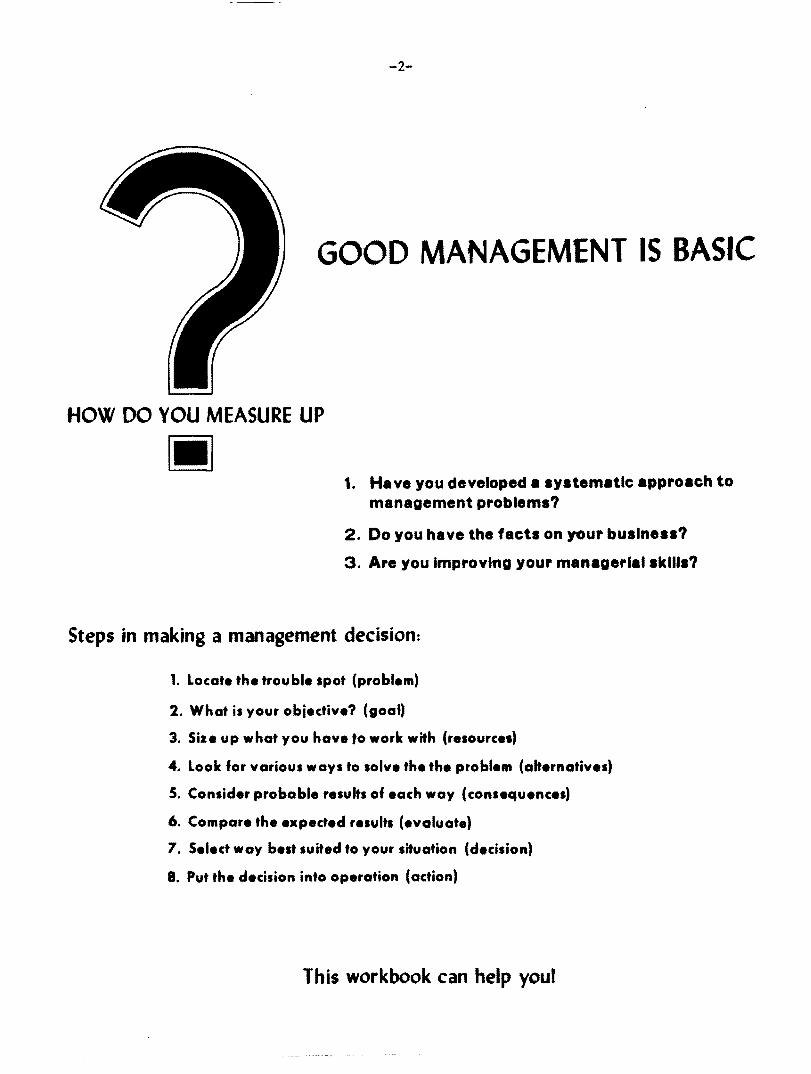
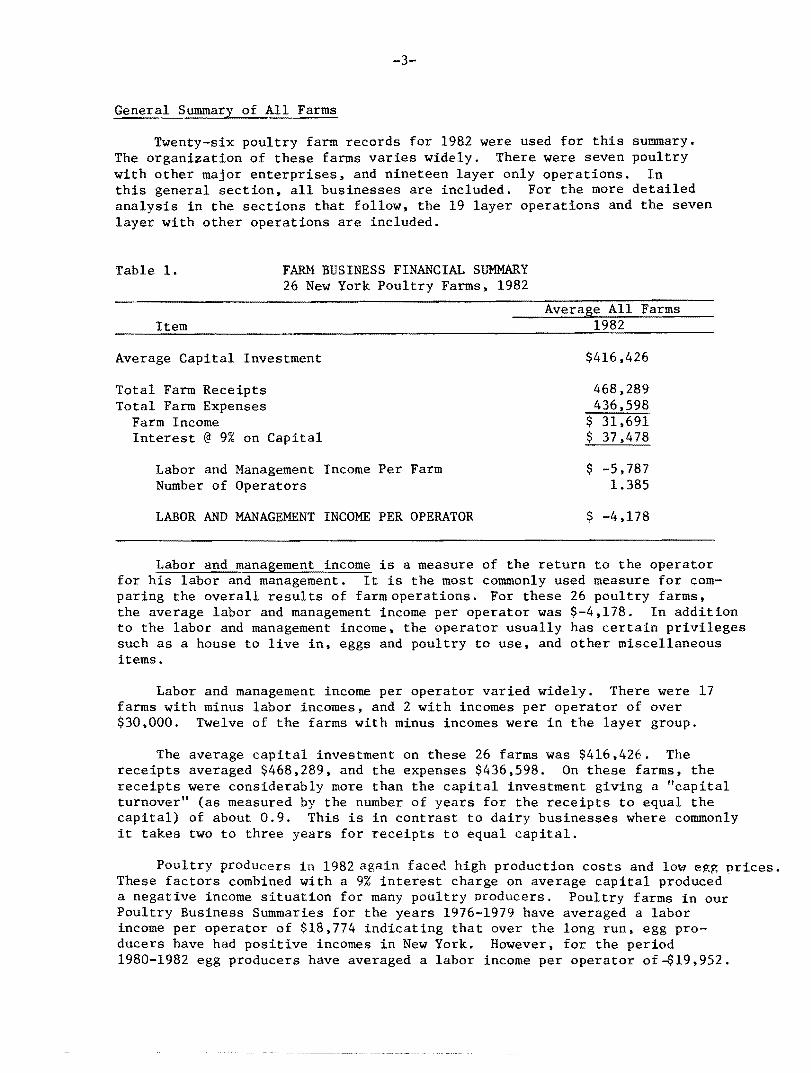
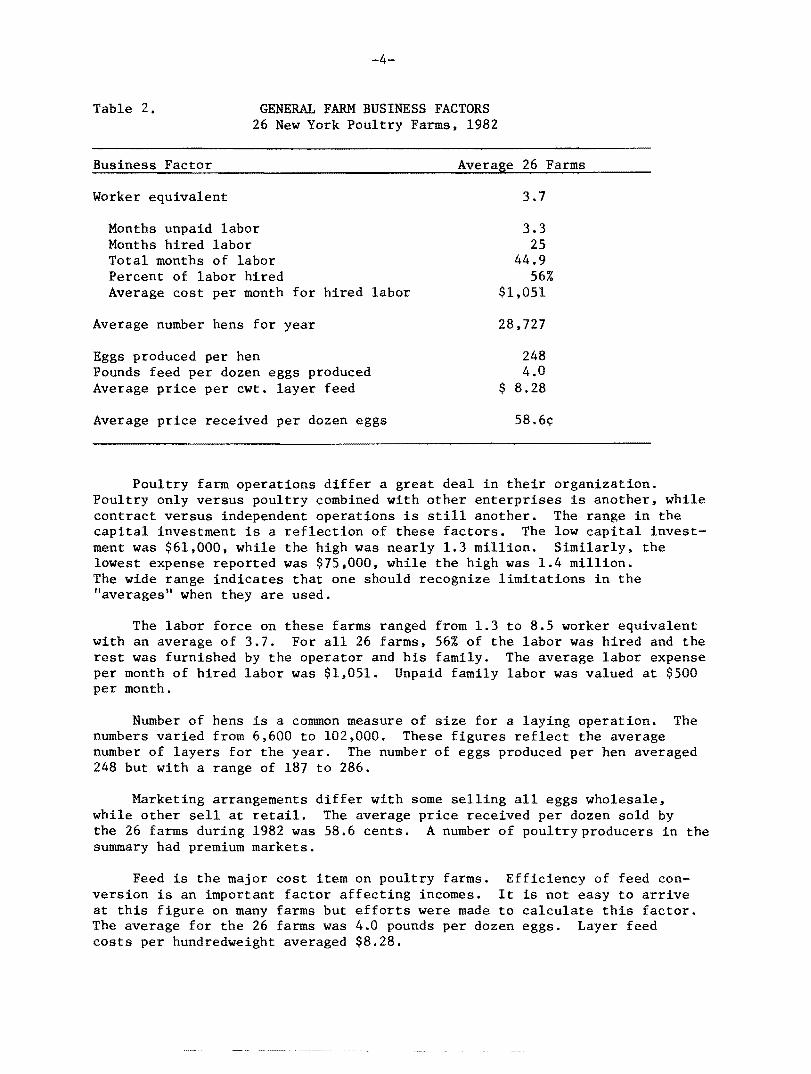
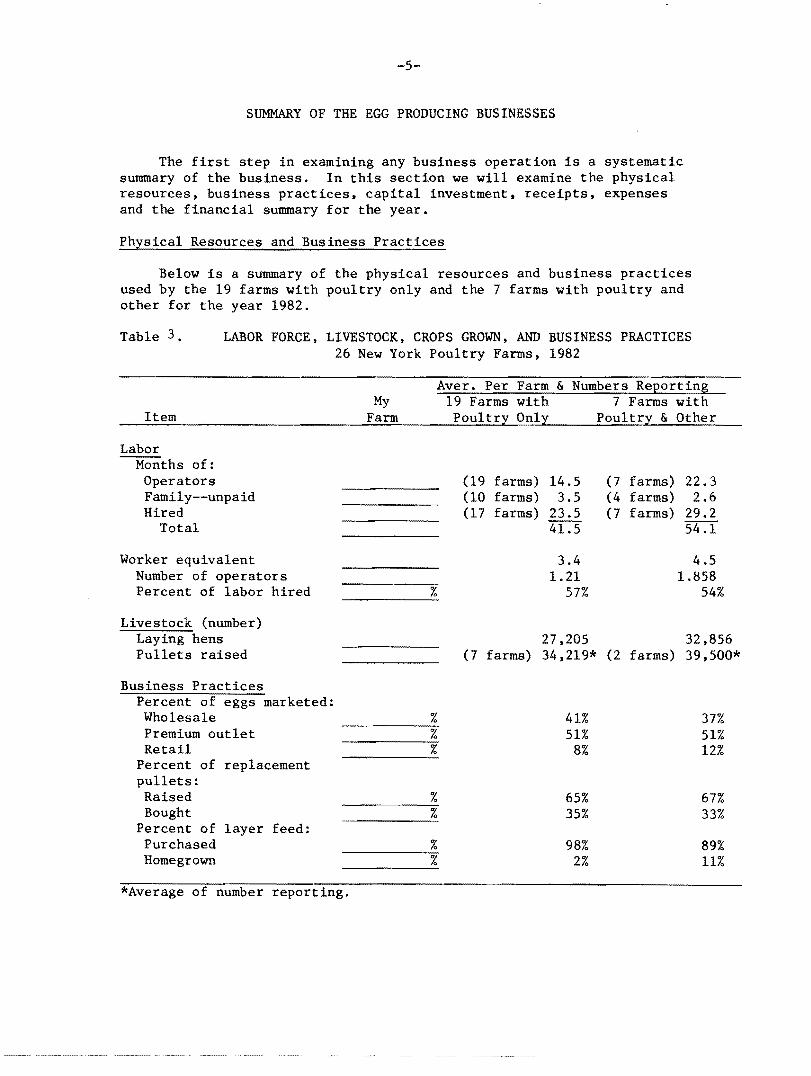
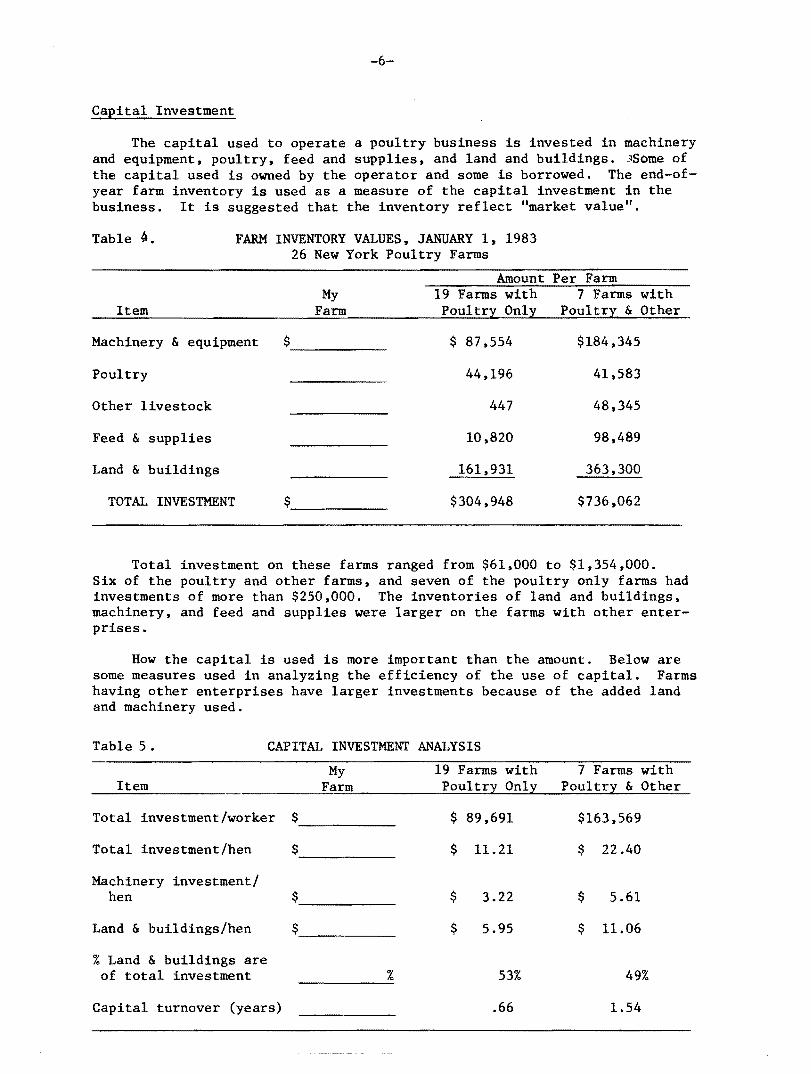
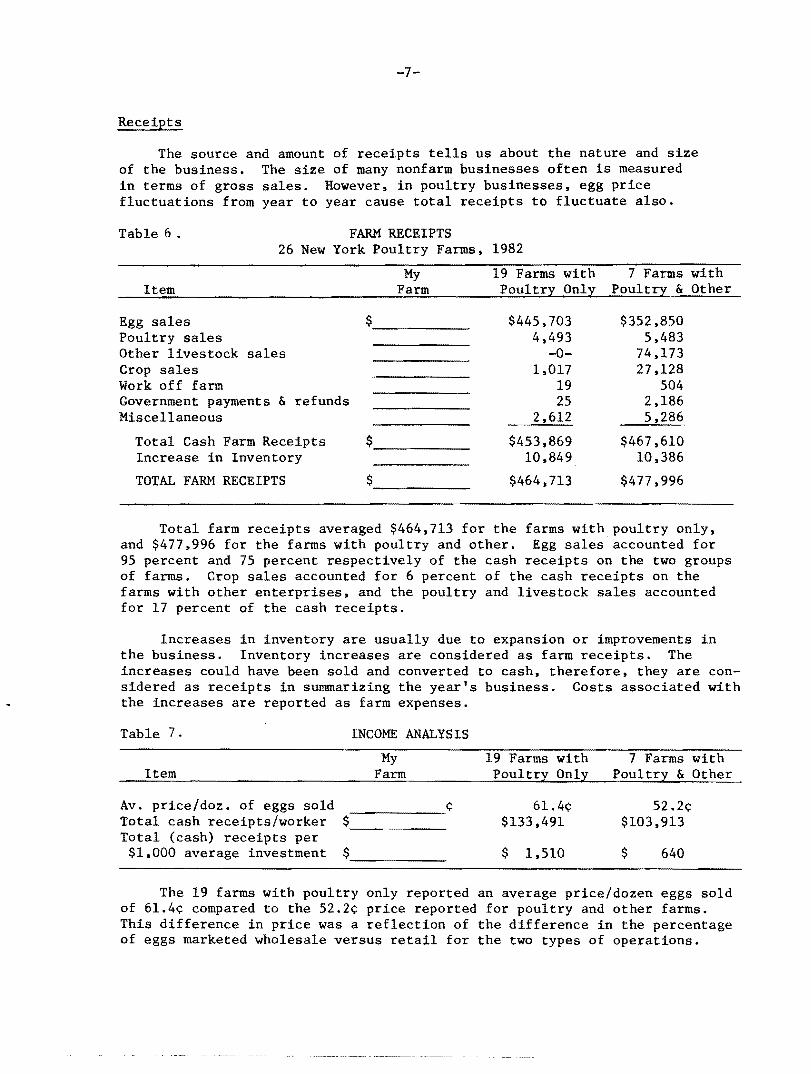
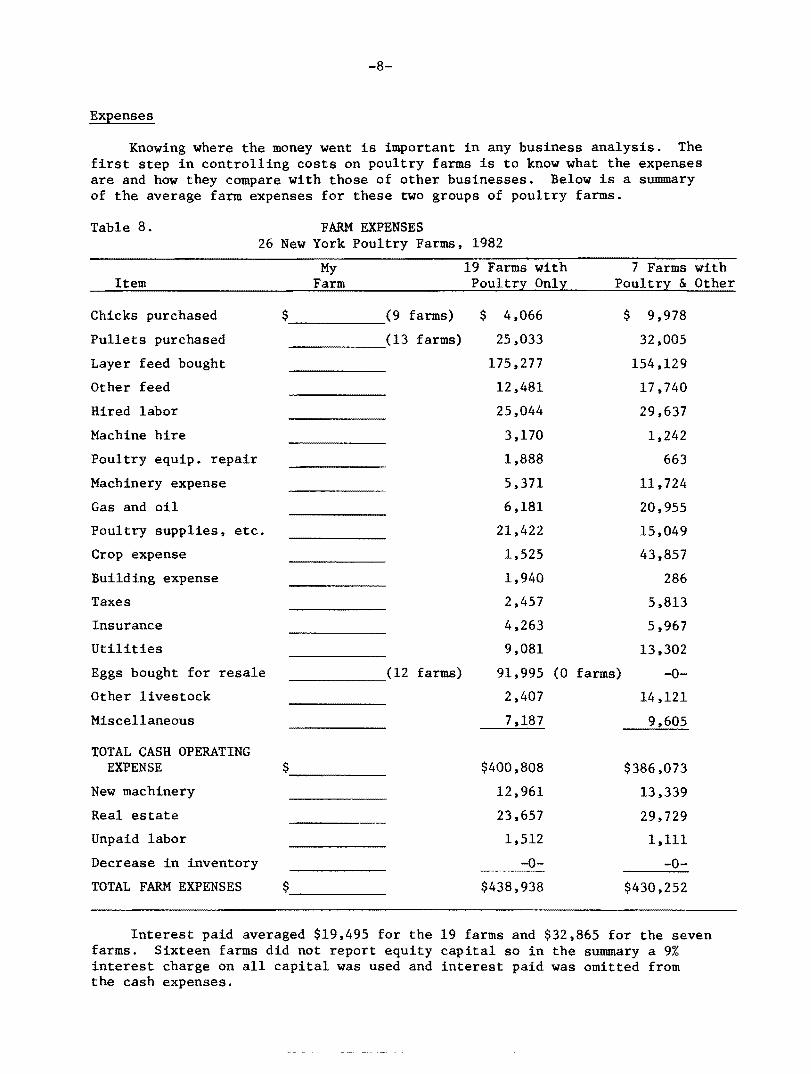
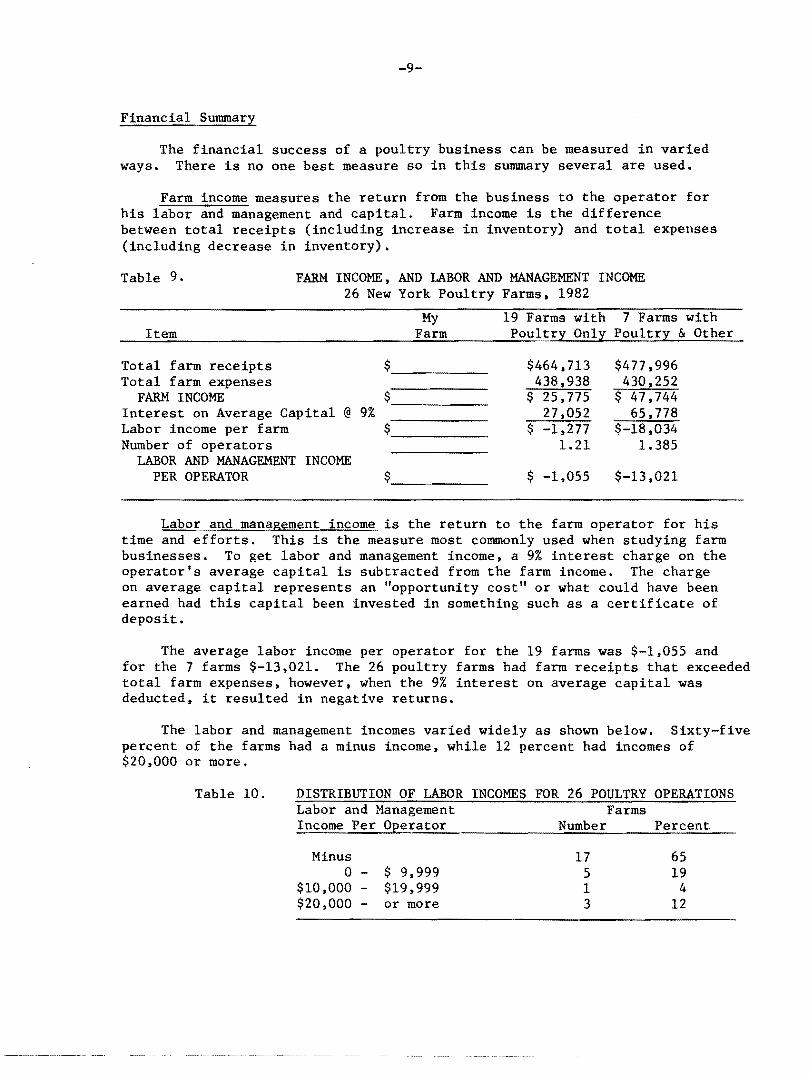
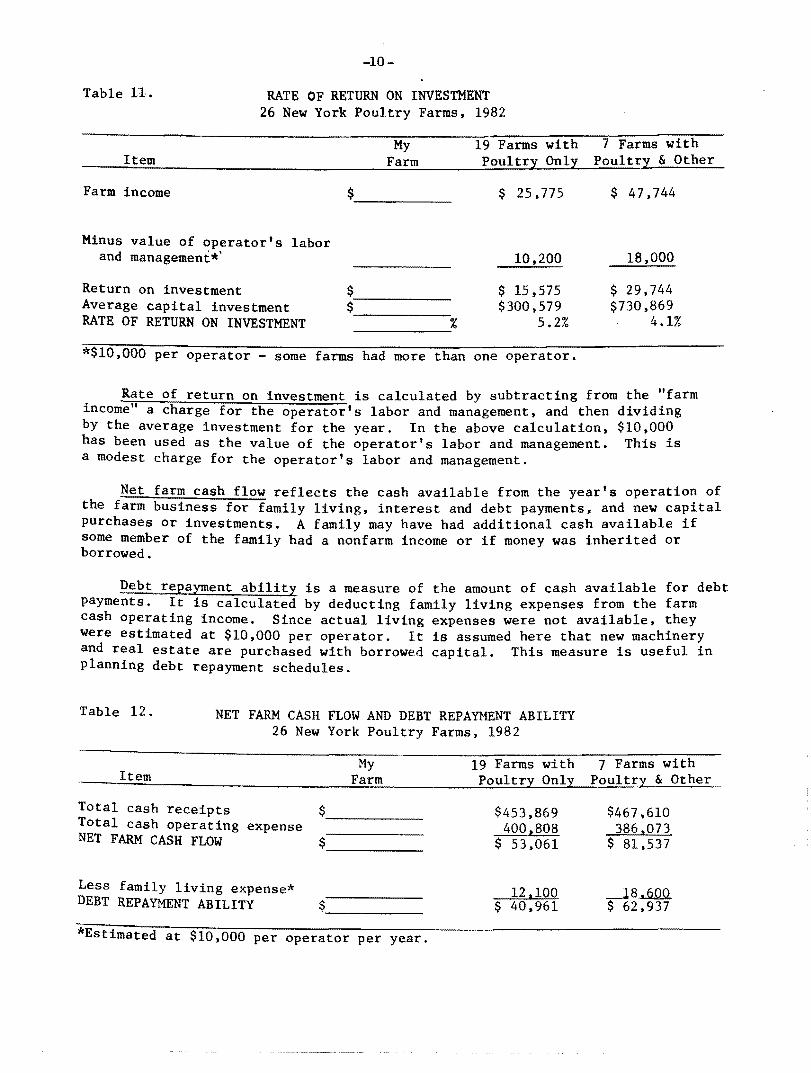
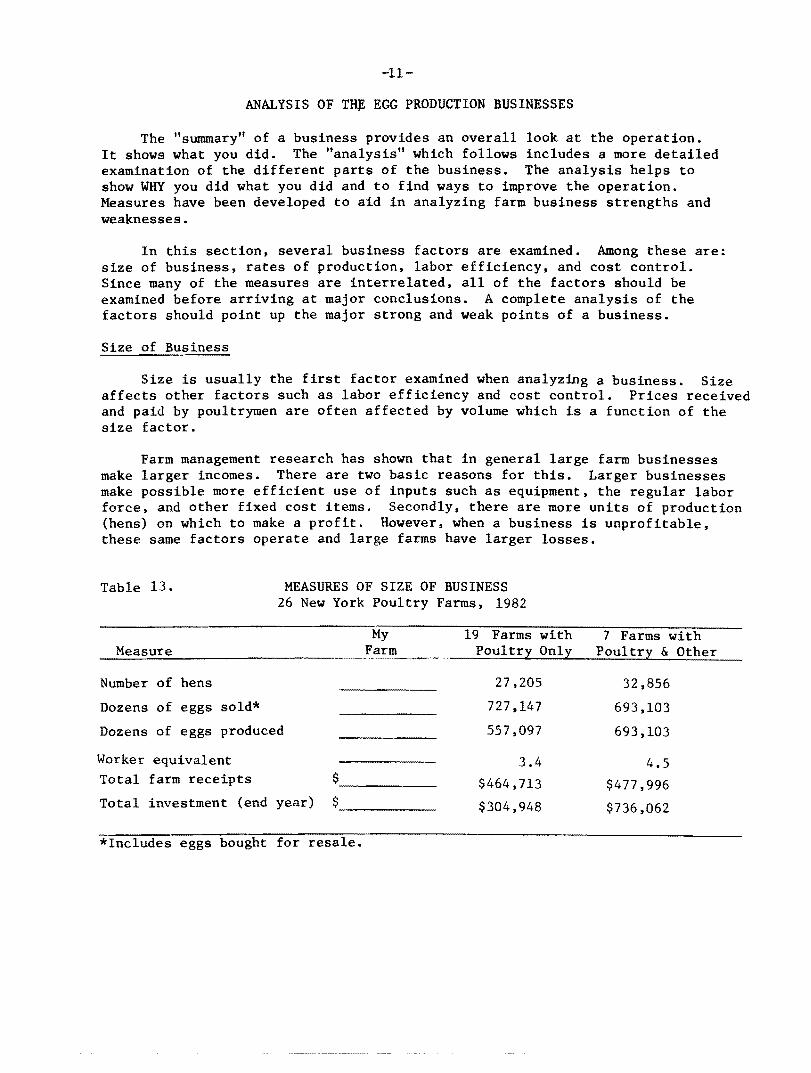
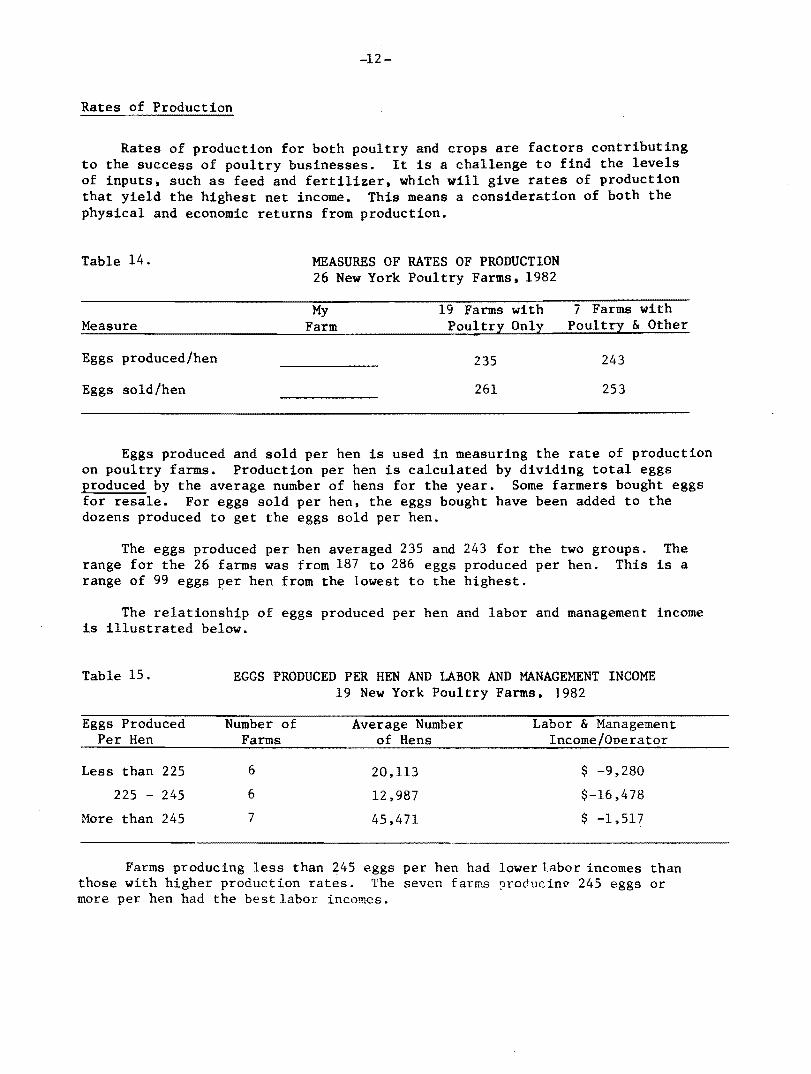
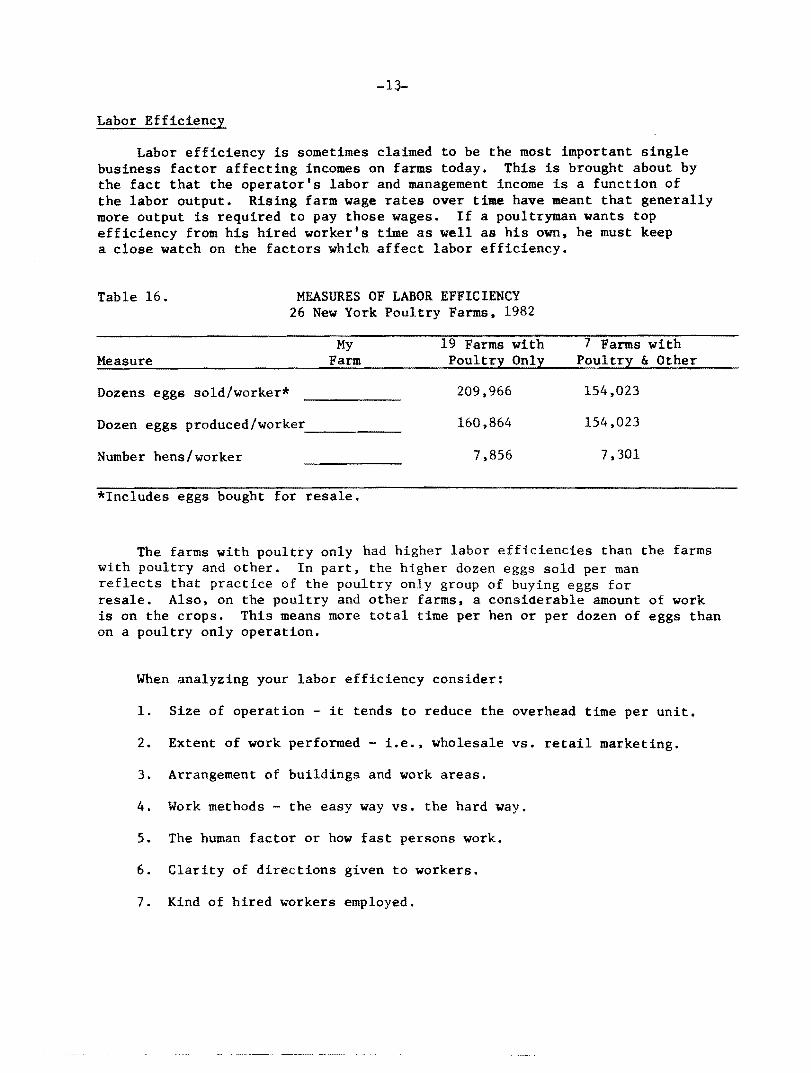
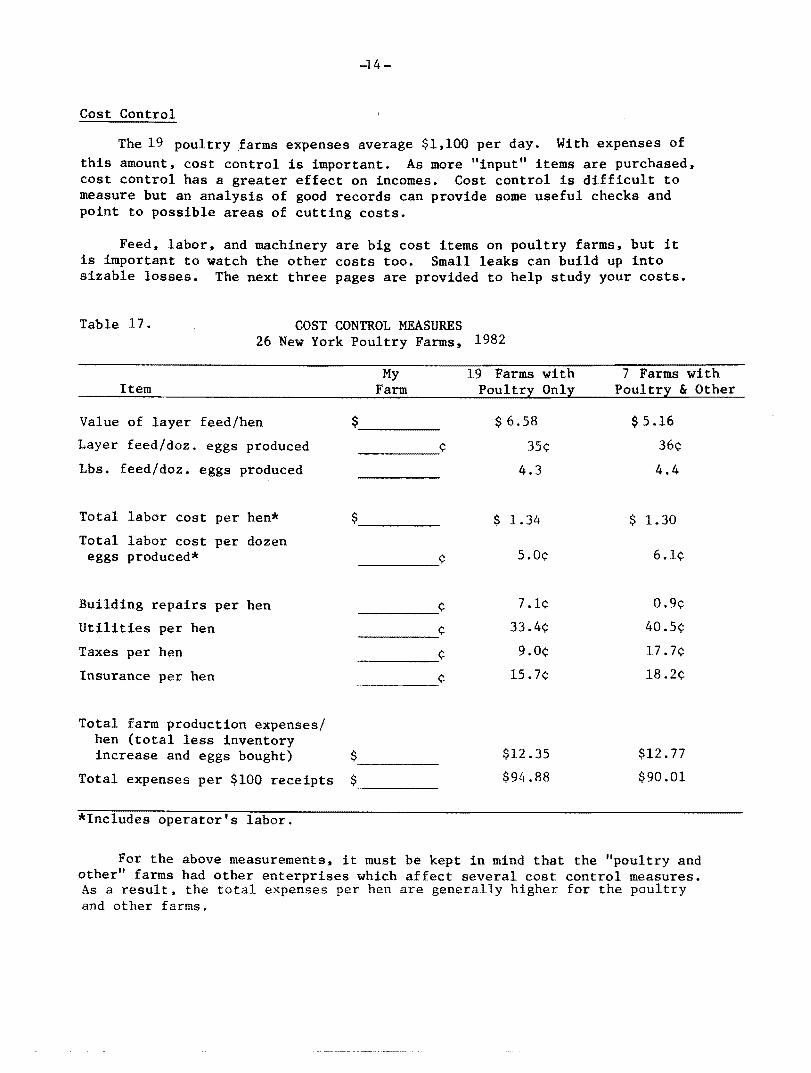
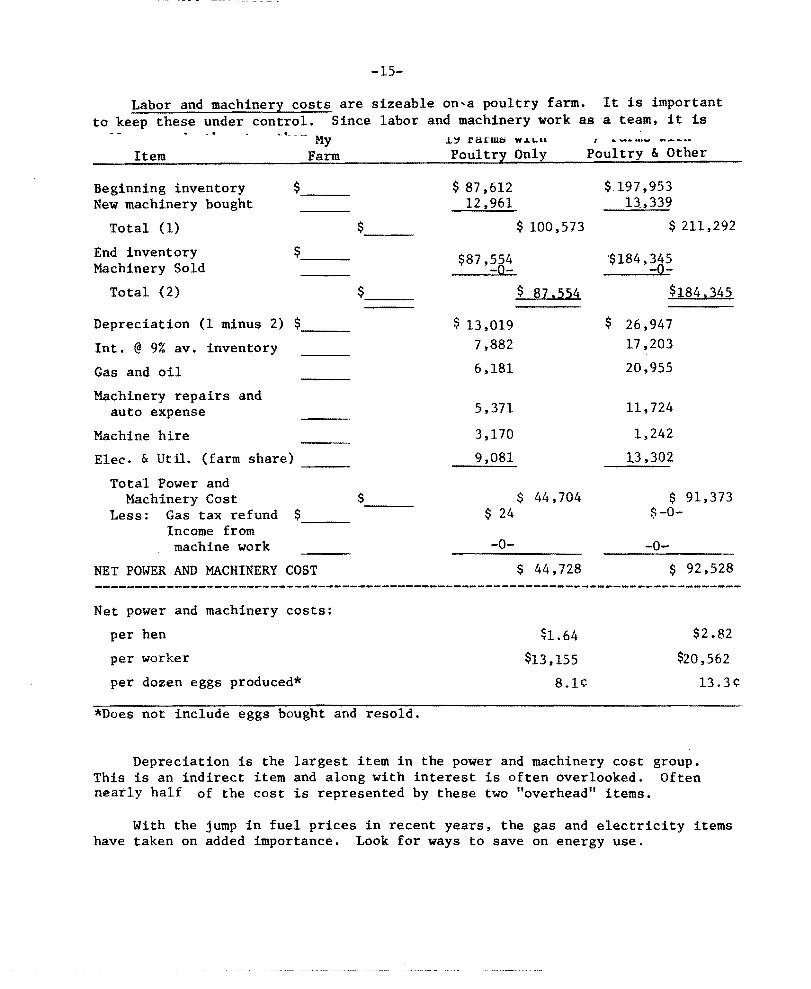
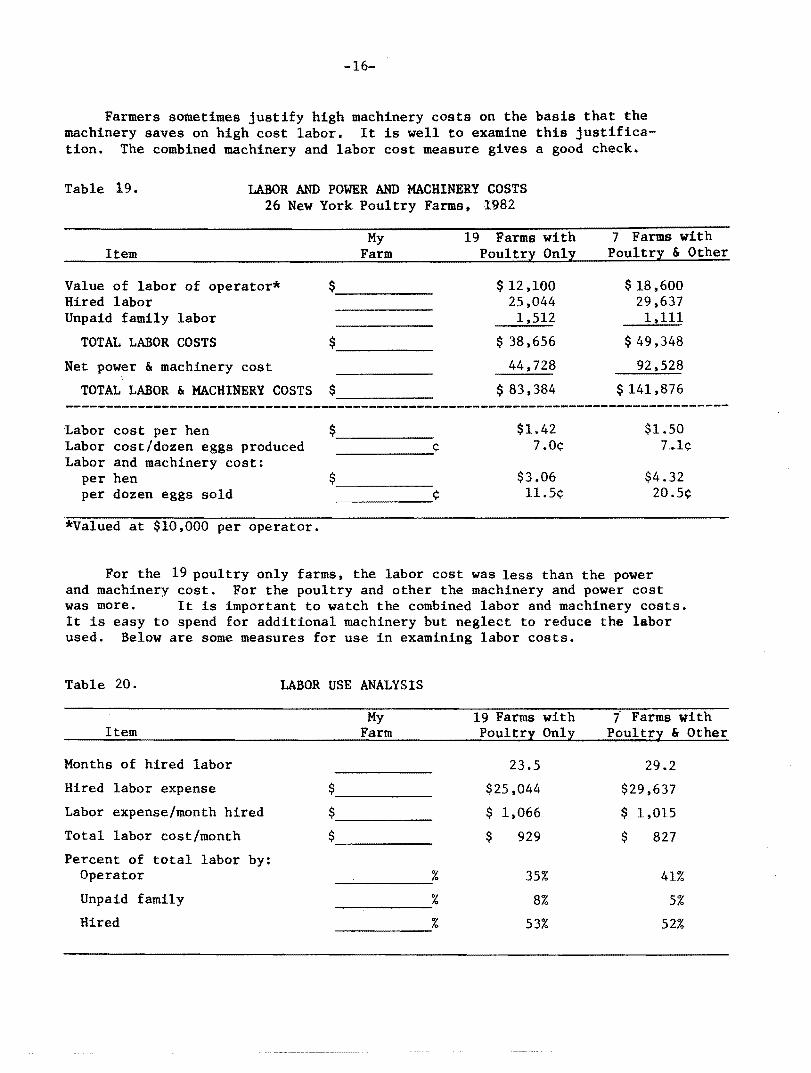
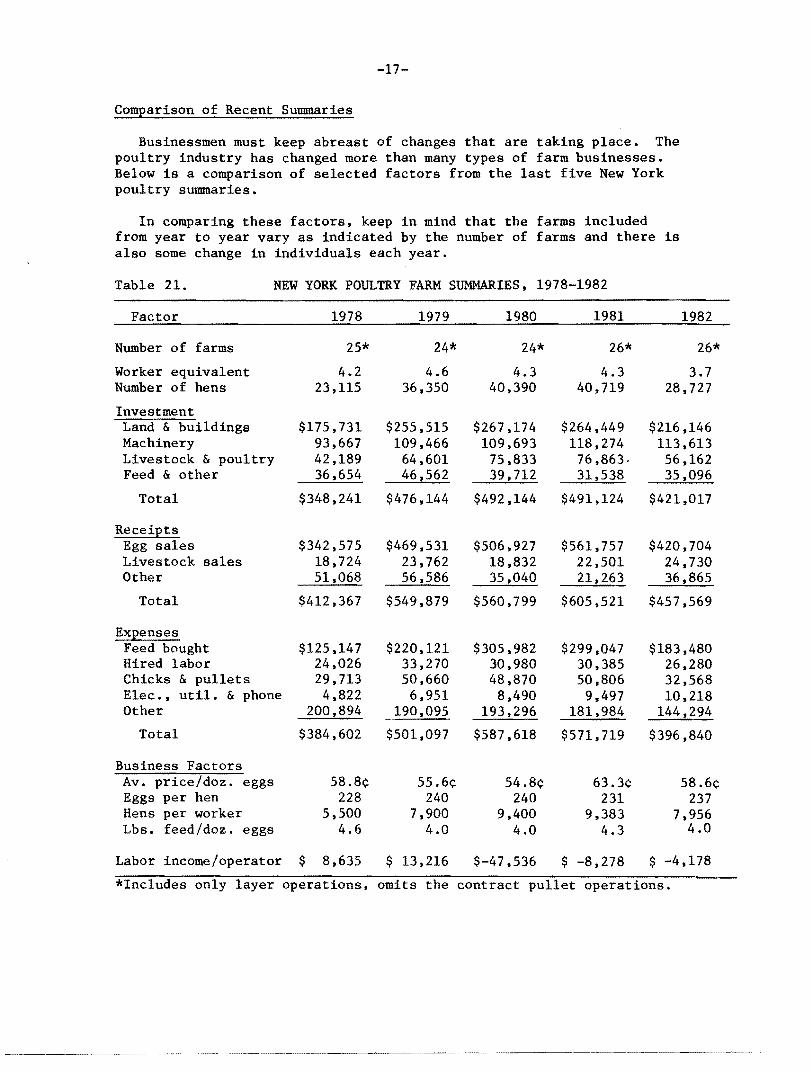
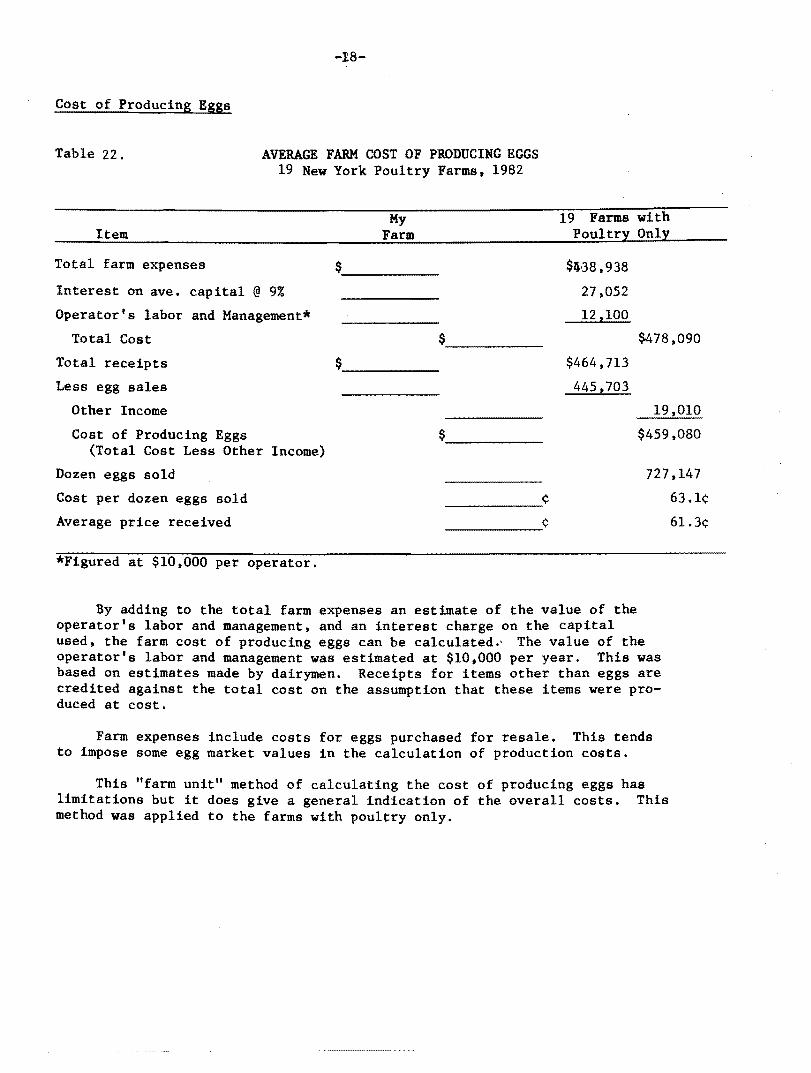
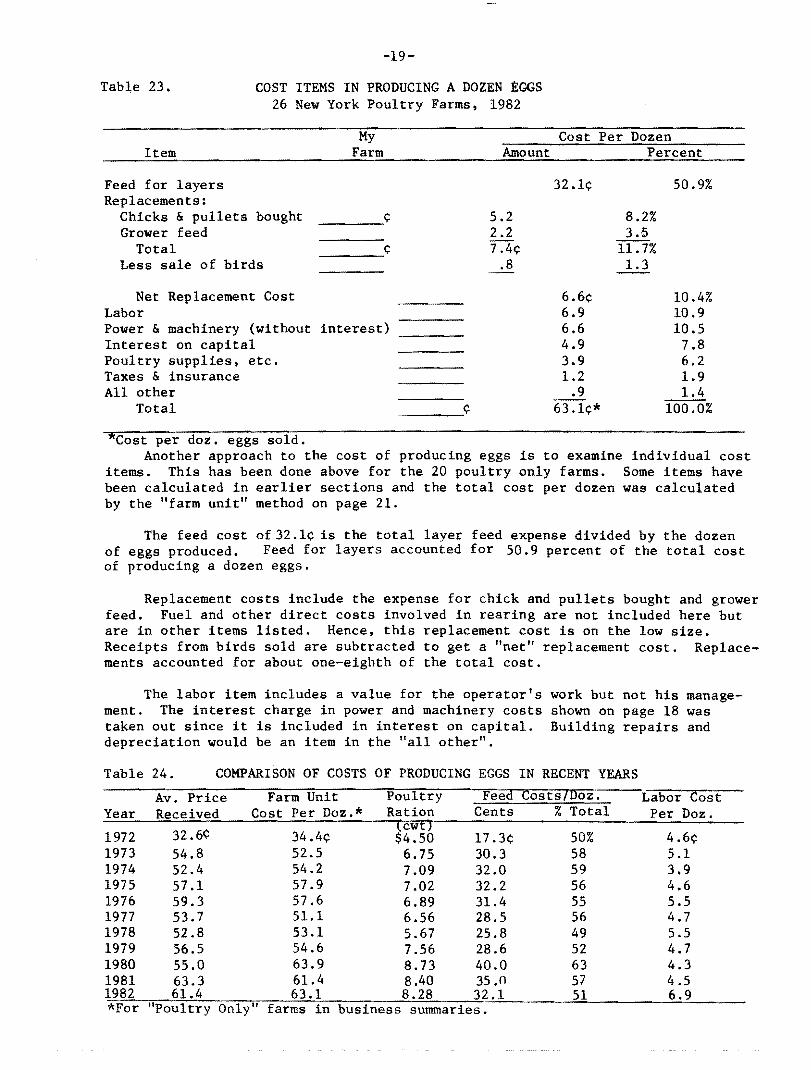
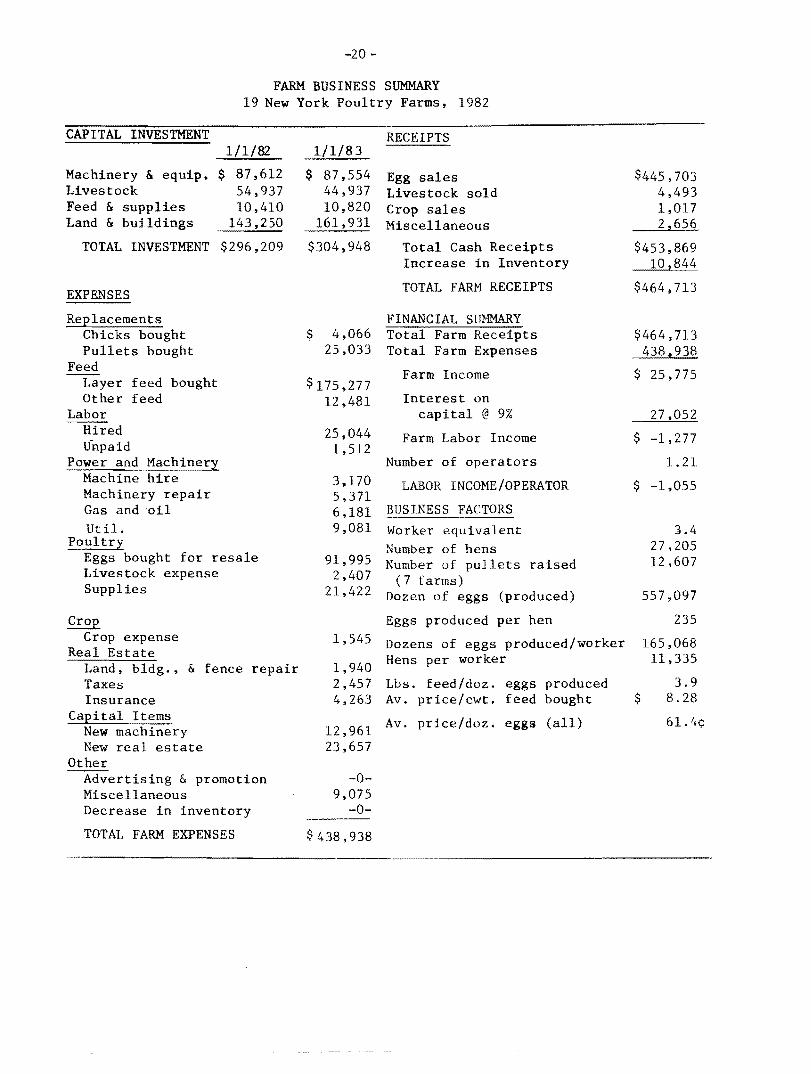
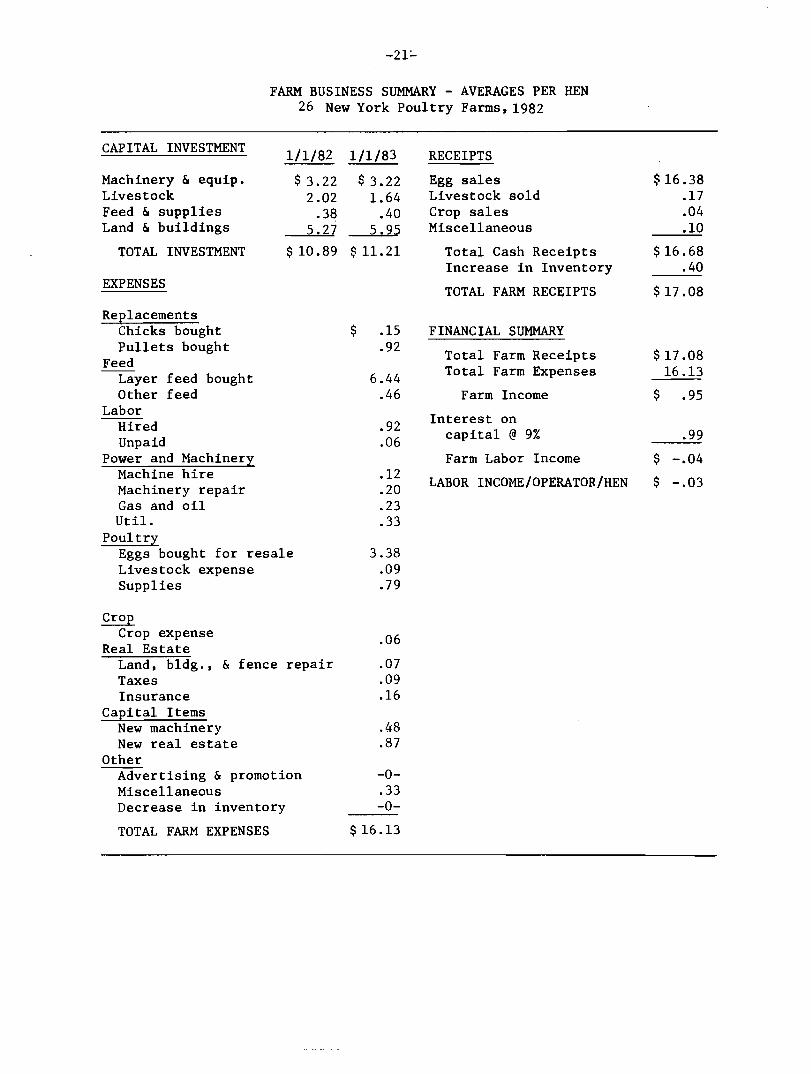
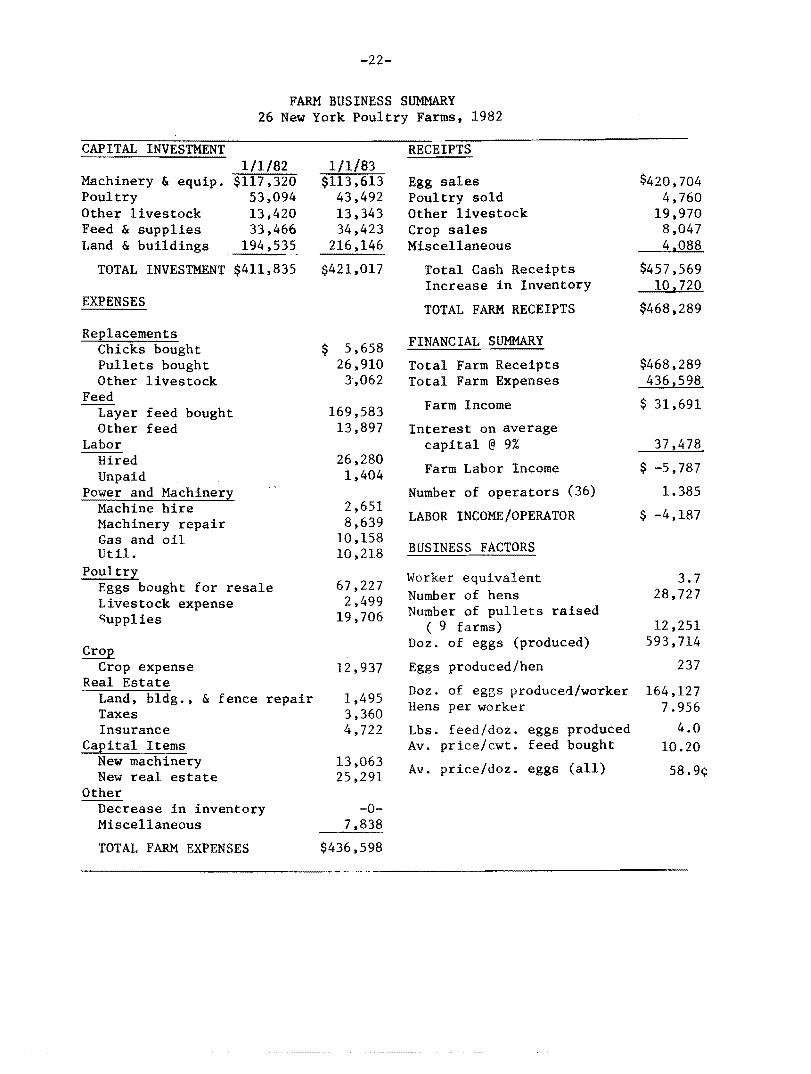
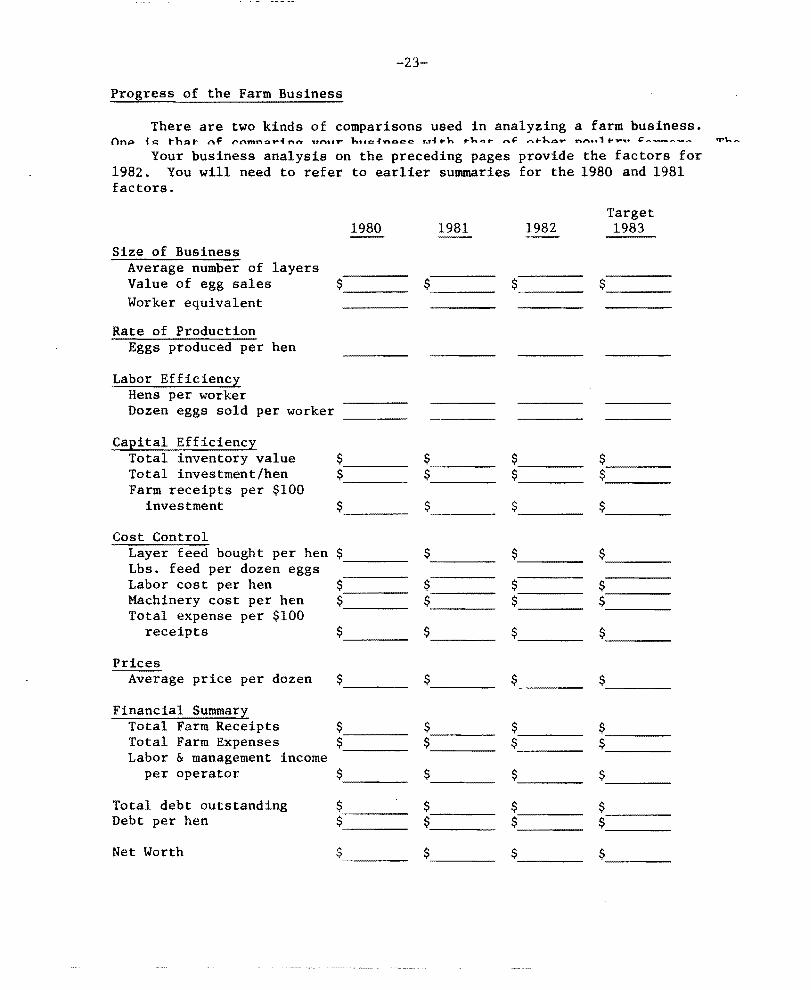
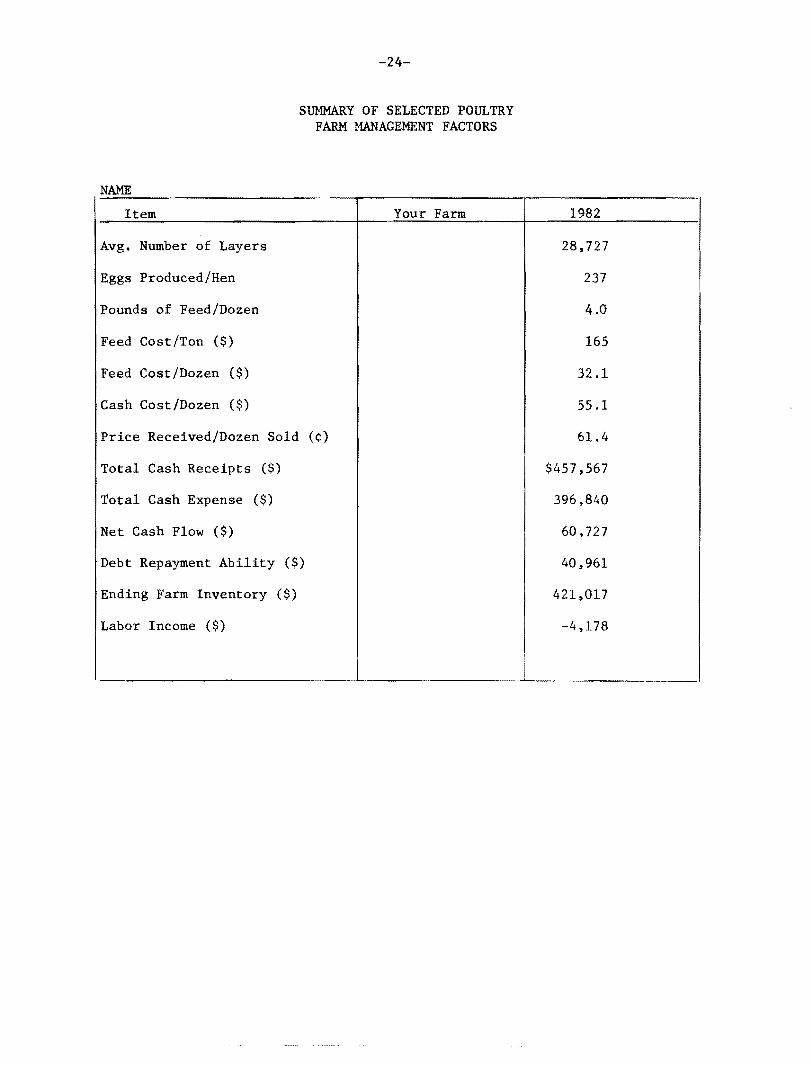


![POULTRY FARM MANUAL of Poultry...[POULTRY FARM MANUAL] Infrastructure Plan 10 SECTION - 2 INFRASTRUCTURE PLAN The demand for modern poultry infrastructure in India is fuelled by an](https://img.pdfslide.us/doc/110x75/5e24cb871b313832201e2d41/poultry-farm-of-poultry-poultry-farm-manual-infrastructure-plan-10-section.jpg)