Embed Size (px)
Citation preview
DOI 10.1393/ncr/i2006-10005-5
RIVISTA DEL NUOVO CIMENTO Vol. 28, N. 7 2005
Potentialities of ion implantation for the synthesis and
modification of metal nanoclusters
P. Mazzoldi and G. Mattei(∗)
Dipartimento di Fisica, Universita di Pavia - via Marzolo 8, I-35131 Padova, Italy
(ricevuto il 22 Marzo 2006)
Summary. — This work reviews the basic features of ion implantation as a tool forsynthesizing and manipulating nanostructured materials with particular emphasisto nanocomposites made by dielectric matrices embedding metallic nanoparticles.After a brief introduction on the physics of ion implantation, two operating modesof ion implantation will be presented: the first is related to the direct synthesis ofnanoclusters as resulting from the precipitation of the supersaturated solid solutionproduced by the implanted ions; the second is related to the modification inducedby the ion beam on already formed nanostructures and is therefore referred to asindirect synthesis. Throughout the paper also various possible technological appli-cations of the different kind of nanoclusters (mono-elemental or bimetallic) obtainedby both approaches are presented: examples are given in the field of nonlinear optics,nanophotonics, magnetism and gas sensing.
PACS 61.72.Ww – Ion implantation.PACS 61.46.Df – Nanoparticles.PACS 81.05.Pj – Glass composites.
2 1. A brief history of ion implantation3 2. The basic physics of ion implantation3 2
.1. Energy loss and stopping power
8 2.2. Defects produced during implantation
9 2.3. Simulating ion implantation
11 2.4. Chemical and physical interaction: models for predicting the cluster for-
mation13 3. A survey on nanocluster-based glassy composited materials16 4. Ion beam direct synthesis: monoatomic clusters17 4
.1. Basic equations of clustering
17 4.1.1. Nucleation
17 4.1.2. Diffusion-limited growth
18 4.1.3. Coarsening
(∗) E-mail: [email protected]
c© Societa Italiana di Fisica 1
2 P. MAZZOLDI and G. MATTEI
19 4.2. Linear absorption of embedded metal clusters: the Mie theory
21 4.3. Experimental
22 4.4. Au cluster growth during isochronal annealing
24 4.5. Clustering of Au atoms under correlated diffusion
25 4.6. Au nucleation as a function of the annealing time
29 4.7. Au implantation in polymers
32 5. Ion beam direct synthesis: bimetallic clusters
34 5.1. Au-Cu alloy
37 5.2. Au-Ag alloy
40 5.3. Nonlinear optical properties of Au-based alloys
44 5.4. Pd-Ag and Pd-Cu alloys
49 5.5. Co-Ni alloy
49 5.6. Ag-S core-shell system
50 5.7. Cu-Ni alloy
51 5.8. Co-Cu alloy
52 5.9. Conclusions
52 6. Ion beam processing
52 6.1. Ion-beam–induced cluster precipitation
55 6.2. Ion-beam–induced cluster modification
56 6.2.1. Au-Cu alloy clusters
60 6.2.2. Au-Ag alloy clusters
63 7. General conclusions
1. – A brief history of ion implantation
Ion implantation is nowadays a well-established technique to modify the near-surfaceregion of a material by the introduction of energetic ions accelerated through a potentialdifference in the keV–MeV region. Its use is today widespread in different areas, spanningfrom the microelectronic industrial production to the synthesis of new materials to endup with academic and fundamental investigations on ion-solid interaction. In particular,the first experimental studies on this last topic trace back to the 1960s following thetheoretical ones aimed at the calculation of the energy lost by the bombarding ionsthrough elastic and inelastic processes. After that in the 1970s ion implantation became astandard in the microelectronic industry, for instance, to selectively dope semiconductorssubstrates in a non-thermal way, therefore avoiding all those by-products like diffusionof dopants which are detrimental for a proper operation of the devices. The requiredamount of dopants in the semiconductor industry is quite low being in the range of 1018–1019 atoms/cm3. On the other hand, much higher ion doses were required as soon as,in the 1980s, the interest in a more aggressive modification of the materials switchedthe focus of the research also on insulating or metallic substrates: the amount of ionsto form alloys or extended new phases in the implanted substrate should be comparablewith the atomic concentration of the host atoms (1021–1022 atoms/cm3, i.e. reaching theatomic percent). A prototypical example of this activity is for instance the modificationof the surface of surgically implanted parts in the human body, so as to avoid possibledelamination characteristic of surface coatings.
Beside modifying the composition of the materials, ion implantation has been alsoused to modify the mechanical properties of their near-surface region, such as theirtribological behavior or their wettability.
POTENTIALITIES OF ION IMPLANTATION FOR THE SYNTHESIS AND MODIFICATION ETC. 3
Since its first developments, ion implantation showed besides great potentialities likepatterning or selective areal doping of materials, also intrinsic limitations like the max-imum thickness which can be modified or the simple planar geometry allowed to homo-geneously modify the target. These prompted for an active development and research inthe scientific community which led to new tools for materials modification. For instance,to overcome the obvious limitation of ion implantation to modify only simple geometrieslike planar surface, a new mode of implantation achieved by a pulsed plasma ion sourcewas developed extending the range of applicability of ion implantation also to complexshapes. On the other side, hybrid deposition techniques were developed to reduce thedrawback of the thickness involved, like ion beam assisted deposition (IBAD), whichcombined vapor deposition with ion implantation to growth and simultaneously dopethe substrates without thickness limitations.
The aim of this review is to present the main features of ion implantation as a toolfor modifying and enhancing in a very controlled way the surface-related properties ofmaterials. Particular emphasis will be given to the most advanced applications of ionimplantation in the emerging field of nanomaterials, for which some practical exampleswill be presented, keeping in mind that the huge amount of possible developments inthe contemporary nanotechnological world make an exhaustive presentation of the topica very demanding task. For this reason we will focus on a specific class of nanomate-rials for which ion implantation revealed a very powerful tool for the synthesis and themodification of the materials [1-3]. In particular we will focus on the nucleation, growthand modification of nanoclusters inside dielectric matrices like silica or silica glasses withinteresting aspects in photonics, magnetism and sensors.
2. – The basic physics of ion implantation
The passage of energetic charged particles in matter has attracted enormous theoret-ical and experimental research for almost a century. The ion beam applications involveeither modifications /engineering of the material surface or its analysis and are correlatedto the interactions of the energetic ions with the electrons or nuclei of the target mate-rial. The interaction processes occur on a time scale of picoseconds and length scales aslow as nanometers. In the following, some of the basic physical concepts involved in ionimplantation are briefly recalled.
2.1. Energy loss and stopping power . – Energetic particles lose their energy as they
traverse the medium, via two energy loss mechanisms:
– nuclear energy loss: it is due to the elastic collisions with the nuclei of the targetatoms. It increases with higher mass projectile/substrate combinations and is thedominant energy loss mechanism at low energies.
– Electronic energy loss: it is due to the inelastic collisions with the electrons oftarget atoms. It involves excitation and ionization of target electrons and increaseswith increasing ion velocity (i.e. with higher energy and lower mass projectiles).
Therefore one can define a rate of energy loss inside the target as
dE
dx≡ dE
dx
∣
∣
∣
∣
n
+dE
dx
∣
∣
∣
∣
e
,(1)
4 P. MAZZOLDI and G. MATTEI
M2M1
p0,E0
M1
p1,E1
p2,E2
θ
ϕM2M2M1
p0,E0
M1
p1,E1
p2,E2
θ
ϕ σσ σ
σ σdx
σσσσ σσ
σσ σσdx
(a) (b)
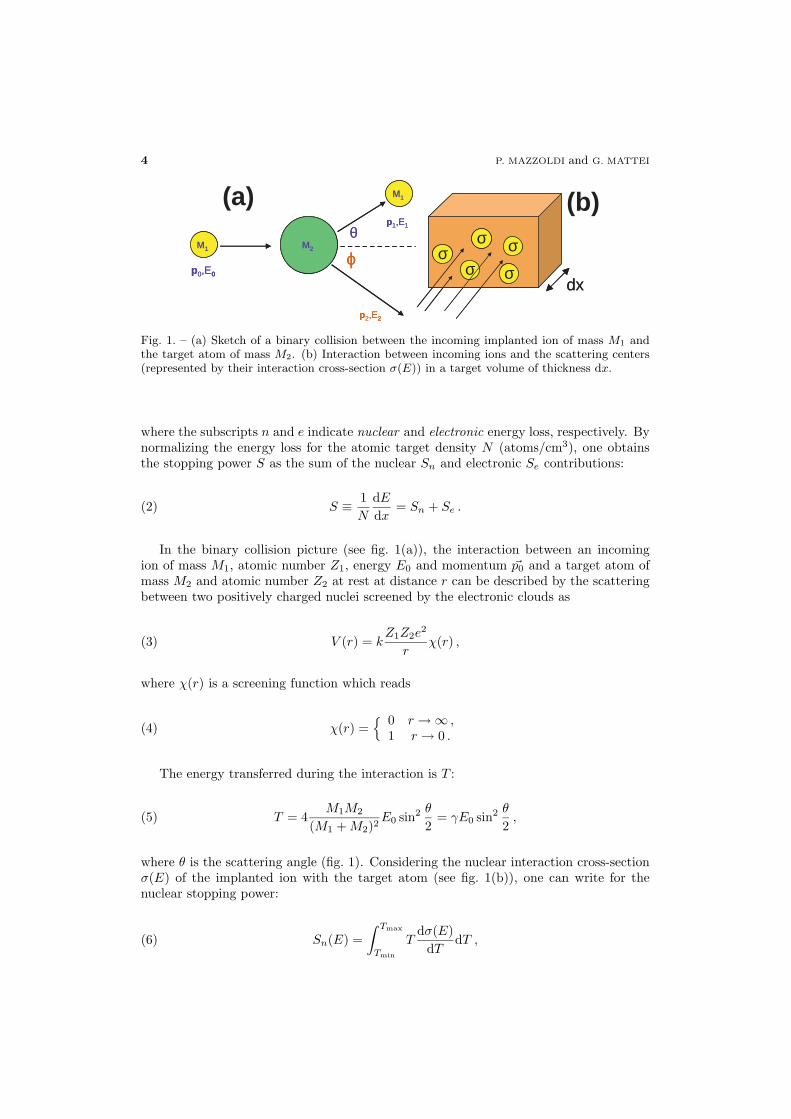
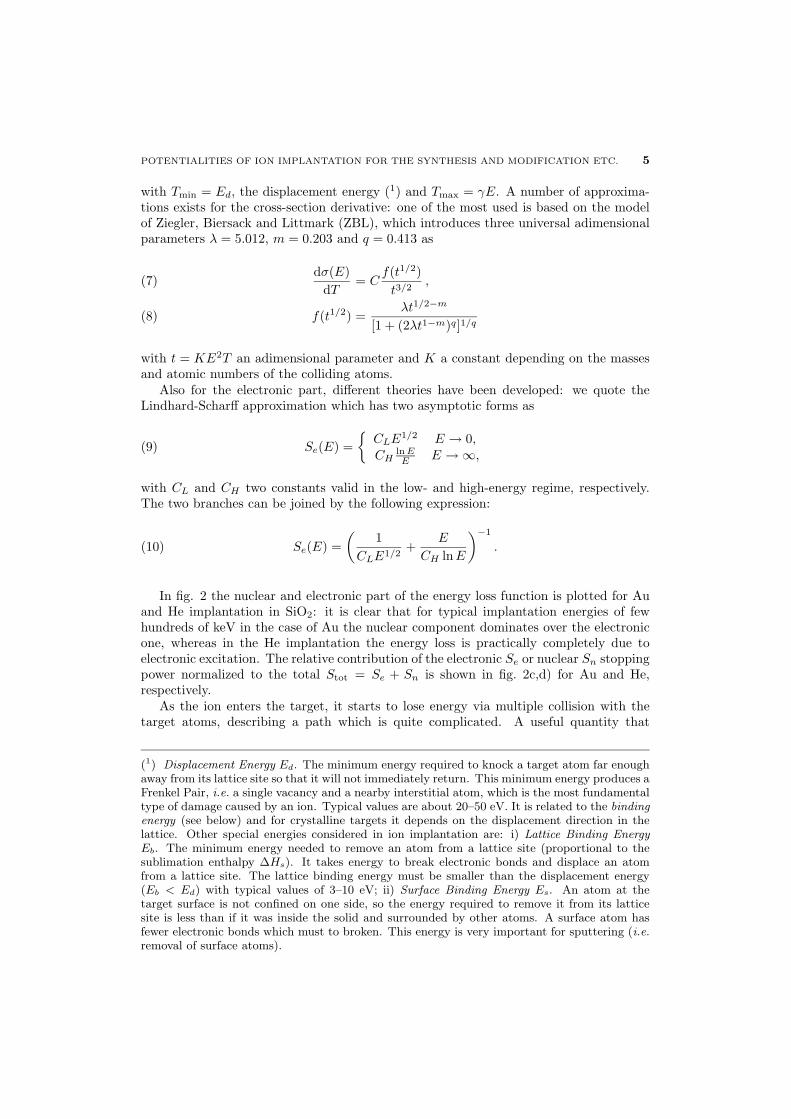
Fig. 1. – (a) Sketch of a binary collision between the incoming implanted ion of mass M1 andthe target atom of mass M2. (b) Interaction between incoming ions and the scattering centers(represented by their interaction cross-section σ(E)) in a target volume of thickness dx.
where the subscripts n and e indicate nuclear and electronic energy loss, respectively. Bynormalizing the energy loss for the atomic target density N (atoms/cm3), one obtainsthe stopping power S as the sum of the nuclear Sn and electronic Se contributions:
S ≡ 1
N
dE
dx= Sn + Se .(2)
In the binary collision picture (see fig. 1(a)), the interaction between an incomingion of mass M1, atomic number Z1, energy E0 and momentum �p0 and a target atom ofmass M2 and atomic number Z2 at rest at distance r can be described by the scatteringbetween two positively charged nuclei screened by the electronic clouds as
V (r) = kZ1Z2e
2
rχ(r) ,(3)
where χ(r) is a screening function which reads
χ(r) ={
0 r → ∞ ,1 r → 0 .
(4)
The energy transferred during the interaction is T :
T = 4M1M2
(M1 +M2)2E0 sin2 θ
2= γE0 sin2 θ
2,(5)
where θ is the scattering angle (fig. 1). Considering the nuclear interaction cross-sectionσ(E) of the implanted ion with the target atom (see fig. 1(b)), one can write for thenuclear stopping power:
Sn(E) =
∫ Tmax
Tmin
Tdσ(E)
dTdT ,(6)
POTENTIALITIES OF ION IMPLANTATION FOR THE SYNTHESIS AND MODIFICATION ETC. 5
with Tmin = Ed, the displacement energy (1) and Tmax = γE. A number of approxima-tions exists for the cross-section derivative: one of the most used is based on the modelof Ziegler, Biersack and Littmark (ZBL), which introduces three universal adimensionalparameters λ = 5.012, m = 0.203 and q = 0.413 as
dσ(E)
dT= C
f(t1/2)
t3/2,(7)
f(t1/2) =λt1/2−m
[1 + (2λt1−m)q]1/q(8)
with t = KE2T an adimensional parameter and K a constant depending on the massesand atomic numbers of the colliding atoms.
Also for the electronic part, different theories have been developed: we quote theLindhard-Scharff approximation which has two asymptotic forms as
Se(E) =
{
CLE1/2 E → 0,
CHln EE E → ∞,(9)
with CL and CH two constants valid in the low- and high-energy regime, respectively.The two branches can be joined by the following expression:
Se(E) =
(
1
CLE1/2+
E
CH lnE
)
−1
.(10)
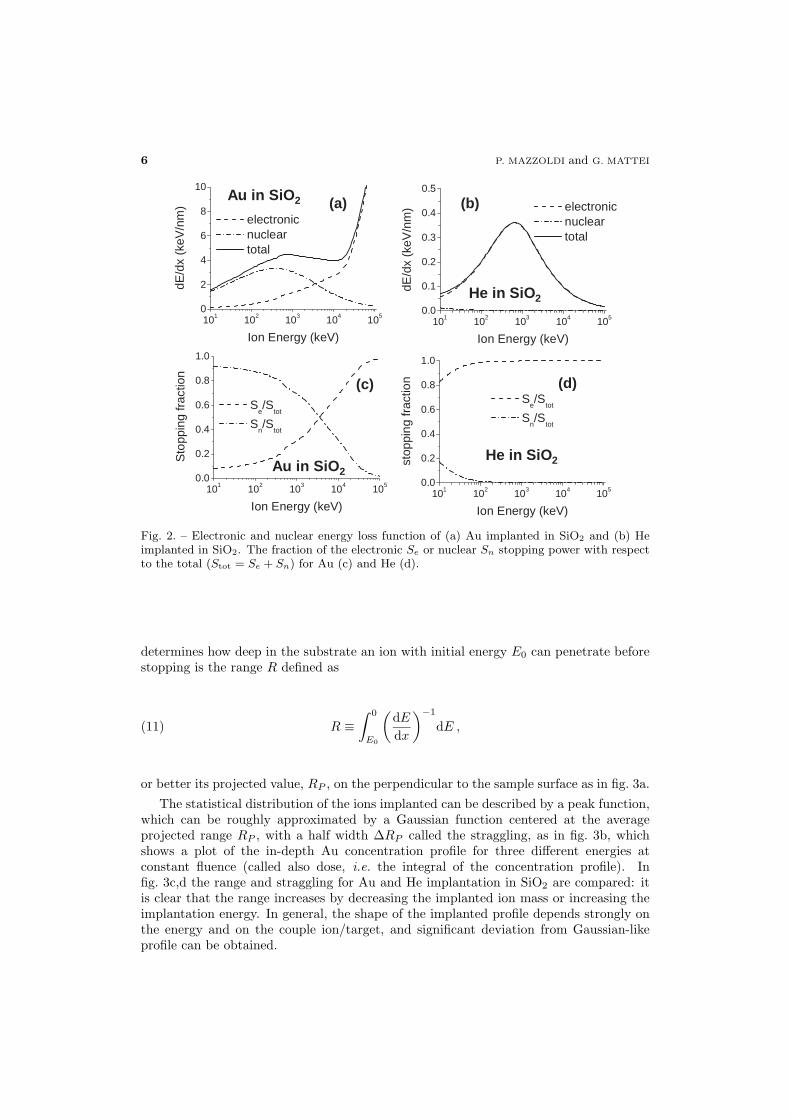
In fig. 2 the nuclear and electronic part of the energy loss function is plotted for Auand He implantation in SiO2: it is clear that for typical implantation energies of fewhundreds of keV in the case of Au the nuclear component dominates over the electronicone, whereas in the He implantation the energy loss is practically completely due toelectronic excitation. The relative contribution of the electronic Se or nuclear Sn stoppingpower normalized to the total Stot = Se + Sn is shown in fig. 2c,d) for Au and He,respectively.
As the ion enters the target, it starts to lose energy via multiple collision with thetarget atoms, describing a path which is quite complicated. A useful quantity that
(1) Displacement Energy Ed. The minimum energy required to knock a target atom far enoughaway from its lattice site so that it will not immediately return. This minimum energy produces aFrenkel Pair, i.e. a single vacancy and a nearby interstitial atom, which is the most fundamentaltype of damage caused by an ion. Typical values are about 20–50 eV. It is related to the bindingenergy (see below) and for crystalline targets it depends on the displacement direction in thelattice. Other special energies considered in ion implantation are: i) Lattice Binding EnergyEb. The minimum energy needed to remove an atom from a lattice site (proportional to thesublimation enthalpy ∆Hs). It takes energy to break electronic bonds and displace an atomfrom a lattice site. The lattice binding energy must be smaller than the displacement energy(Eb < Ed) with typical values of 3–10 eV; ii) Surface Binding Energy Es. An atom at thetarget surface is not confined on one side, so the energy required to remove it from its latticesite is less than if it was inside the solid and surrounded by other atoms. A surface atom hasfewer electronic bonds which must to broken. This energy is very important for sputtering (i.e.removal of surface atoms).
6 P. MAZZOLDI and G. MATTEI
101 102 103 104 1050
2
4
6
8
10
electronicnucleartotal
dE/d
x(k
eV/n
m)
Ion Energy (keV)101 102 103 104 105
0.0
0.1
0.2
0.3
0.4
0.5
electronicnucleartotal
dE/d
x(k
eV/n
m)
Ion Energy (keV)
(a) (b)Au in SiO 2
He in SiO 2
101 102 103 104 1050.0
0.2
0.4
0.6
0.8
1.0
Se/S
tot
Sn/S
tot
stop
ping
frac
tion
Ion Energy (keV)
101 102 103 104 1050.0
0.2
0.4
0.6
0.8
1.0
Se/S
tot
Sn/S
tot
Sto
ppin
gfr
actio
n
Ion Energy (keV)
Au in SiO 2He in SiO 2
(c) (d)
Fig. 2. – Electronic and nuclear energy loss function of (a) Au implanted in SiO2 and (b) Heimplanted in SiO2. The fraction of the electronic Se or nuclear Sn stopping power with respectto the total (Stot = Se + Sn) for Au (c) and He (d).
determines how deep in the substrate an ion with initial energy E0 can penetrate beforestopping is the range R defined as
R ≡∫ 0
E0
(
dE
dx
)
−1
dE ,(11)
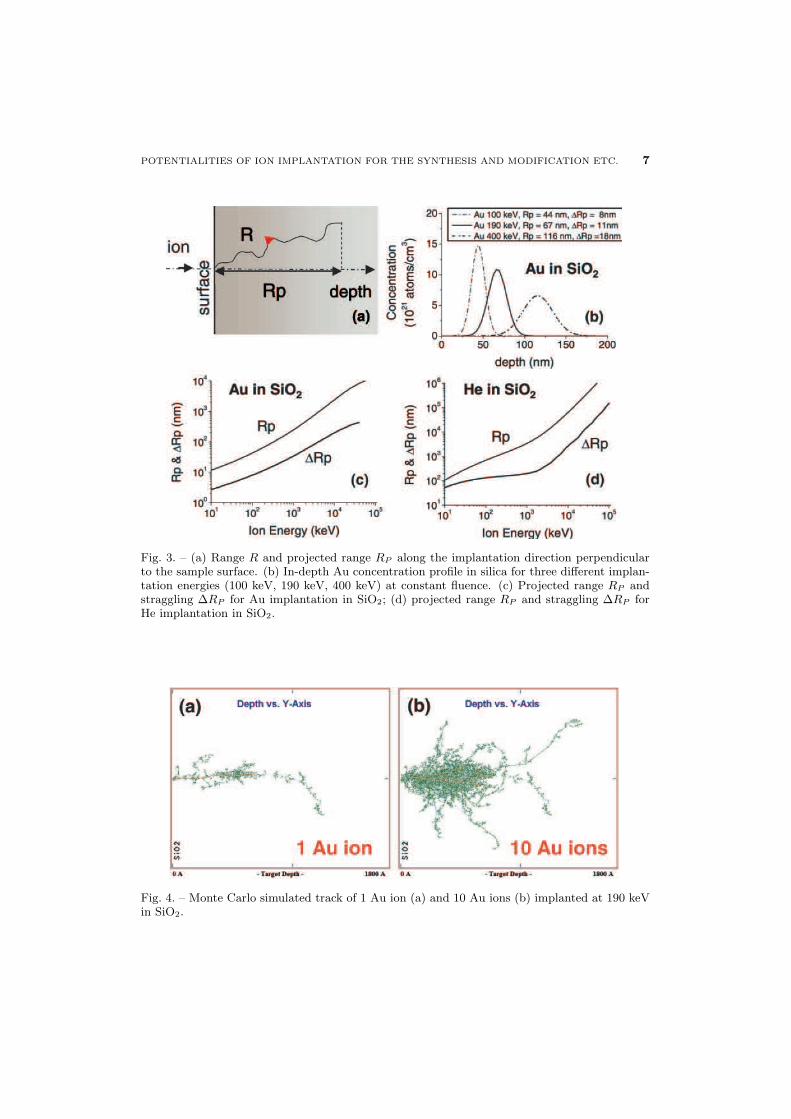
or better its projected value, RP , on the perpendicular to the sample surface as in fig. 3a.
The statistical distribution of the ions implanted can be described by a peak function,which can be roughly approximated by a Gaussian function centered at the averageprojected range RP , with a half width ∆RP called the straggling, as in fig. 3b, whichshows a plot of the in-depth Au concentration profile for three different energies atconstant fluence (called also dose, i.e. the integral of the concentration profile). Infig. 3c,d the range and straggling for Au and He implantation in SiO2 are compared: itis clear that the range increases by decreasing the implanted ion mass or increasing theimplantation energy. In general, the shape of the implanted profile depends strongly onthe energy and on the couple ion/target, and significant deviation from Gaussian-likeprofile can be obtained.
POTENTIALITIES OF ION IMPLANTATION FOR THE SYNTHESIS AND MODIFICATION ETC. 7
Fig. 3. – (a) Range R and projected range RP along the implantation direction perpendicularto the sample surface. (b) In-depth Au concentration profile in silica for three different implan-tation energies (100 keV, 190 keV, 400 keV) at constant fluence. (c) Projected range RP andstraggling ∆RP for Au implantation in SiO2; (d) projected range RP and straggling ∆RP forHe implantation in SiO2.
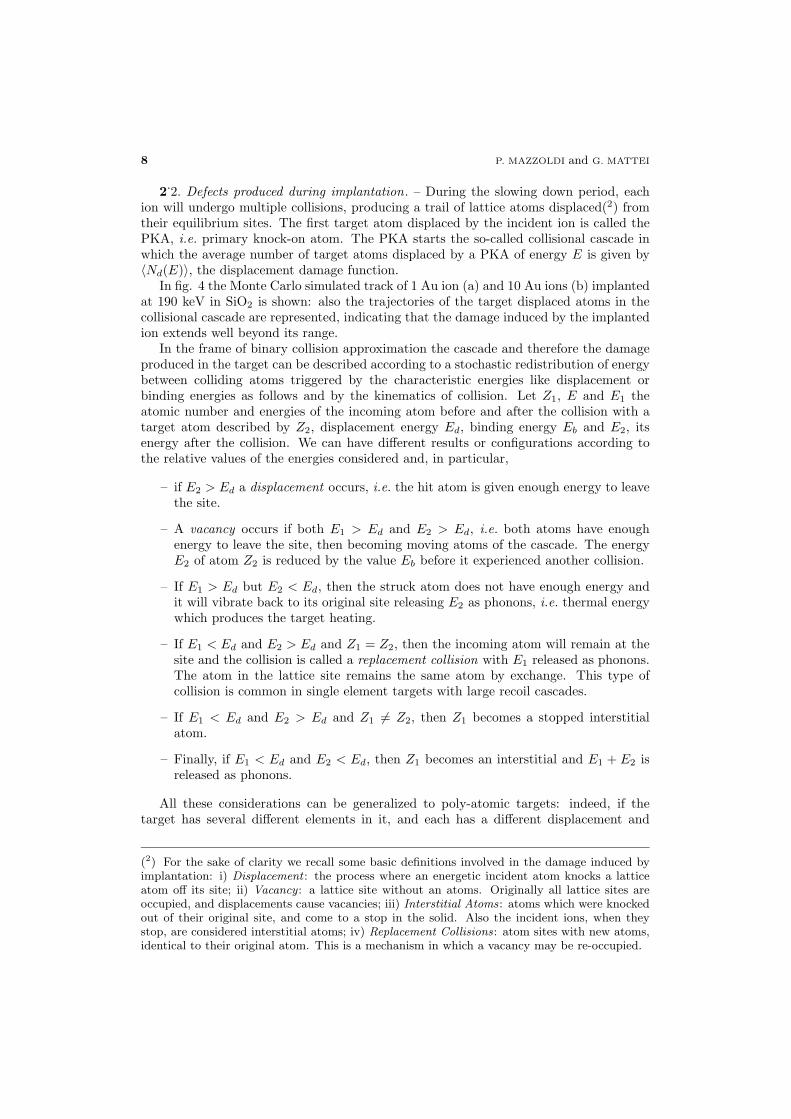
Fig. 4. – Monte Carlo simulated track of 1 Au ion (a) and 10 Au ions (b) implanted at 190 keVin SiO2.
8 P. MAZZOLDI and G. MATTEI
2.2. Defects produced during implantation. – During the slowing down period, each
ion will undergo multiple collisions, producing a trail of lattice atoms displaced(2) fromtheir equilibrium sites. The first target atom displaced by the incident ion is called thePKA, i.e. primary knock-on atom. The PKA starts the so-called collisional cascade inwhich the average number of target atoms displaced by a PKA of energy E is given by〈Nd(E)〉, the displacement damage function.
In fig. 4 the Monte Carlo simulated track of 1 Au ion (a) and 10 Au ions (b) implantedat 190 keV in SiO2 is shown: also the trajectories of the target displaced atoms in thecollisional cascade are represented, indicating that the damage induced by the implantedion extends well beyond its range.
In the frame of binary collision approximation the cascade and therefore the damageproduced in the target can be described according to a stochastic redistribution of energybetween colliding atoms triggered by the characteristic energies like displacement orbinding energies as follows and by the kinematics of collision. Let Z1, E and E1 theatomic number and energies of the incoming atom before and after the collision with atarget atom described by Z2, displacement energy Ed, binding energy Eb and E2, itsenergy after the collision. We can have different results or configurations according tothe relative values of the energies considered and, in particular,
– if E2 > Ed a displacement occurs, i.e. the hit atom is given enough energy to leavethe site.
– A vacancy occurs if both E1 > Ed and E2 > Ed, i.e. both atoms have enoughenergy to leave the site, then becoming moving atoms of the cascade. The energyE2 of atom Z2 is reduced by the value Eb before it experienced another collision.
– If E1 > Ed but E2 < Ed, then the struck atom does not have enough energy andit will vibrate back to its original site releasing E2 as phonons, i.e. thermal energywhich produces the target heating.
– If E1 < Ed and E2 > Ed and Z1 = Z2, then the incoming atom will remain at thesite and the collision is called a replacement collision with E1 released as phonons.The atom in the lattice site remains the same atom by exchange. This type ofcollision is common in single element targets with large recoil cascades.
– If E1 < Ed and E2 > Ed and Z1 �= Z2, then Z1 becomes a stopped interstitialatom.
– Finally, if E1 < Ed and E2 < Ed, then Z1 becomes an interstitial and E1 + E2 isreleased as phonons.
All these considerations can be generalized to poly-atomic targets: indeed, if thetarget has several different elements in it, and each has a different displacement and
(2) For the sake of clarity we recall some basic definitions involved in the damage induced byimplantation: i) Displacement : the process where an energetic incident atom knocks a latticeatom off its site; ii) Vacancy : a lattice site without an atoms. Originally all lattice sites areoccupied, and displacements cause vacancies; iii) Interstitial Atoms: atoms which were knockedout of their original site, and come to a stop in the solid. Also the incident ions, when theystop, are considered interstitial atoms; iv) Replacement Collisions: atom sites with new atoms,identical to their original atom. This is a mechanism in which a vacancy may be re-occupied.
POTENTIALITIES OF ION IMPLANTATION FOR THE SYNTHESIS AND MODIFICATION ETC. 9
surf
ace
ion
depth
E=E0
Rp0
E=0
Sn
Se
Damage
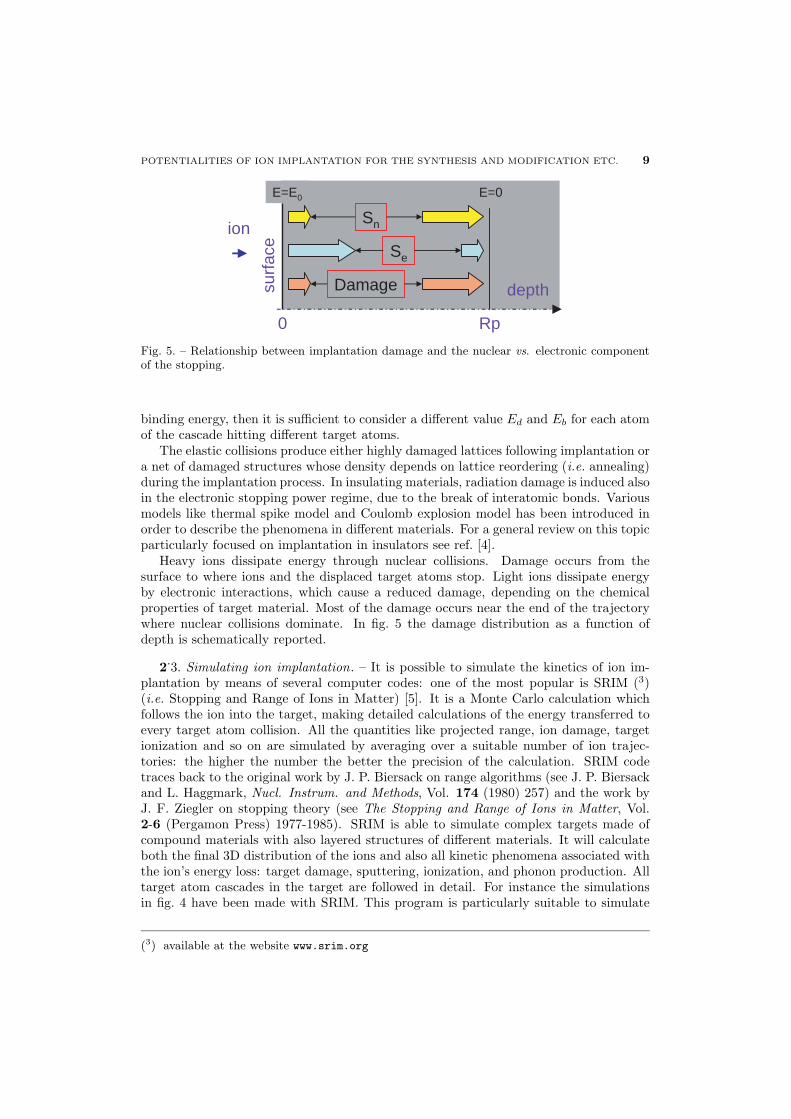
Fig. 5. – Relationship between implantation damage and the nuclear vs. electronic componentof the stopping.
binding energy, then it is sufficient to consider a different value Ed and Eb for each atomof the cascade hitting different target atoms.
The elastic collisions produce either highly damaged lattices following implantation ora net of damaged structures whose density depends on lattice reordering (i.e. annealing)during the implantation process. In insulating materials, radiation damage is induced alsoin the electronic stopping power regime, due to the break of interatomic bonds. Variousmodels like thermal spike model and Coulomb explosion model has been introduced inorder to describe the phenomena in different materials. For a general review on this topicparticularly focused on implantation in insulators see ref. [4].
Heavy ions dissipate energy through nuclear collisions. Damage occurs from thesurface to where ions and the displaced target atoms stop. Light ions dissipate energyby electronic interactions, which cause a reduced damage, depending on the chemicalproperties of target material. Most of the damage occurs near the end of the trajectorywhere nuclear collisions dominate. In fig. 5 the damage distribution as a function ofdepth is schematically reported.
2.3. Simulating ion implantation. – It is possible to simulate the kinetics of ion im-
plantation by means of several computer codes: one of the most popular is SRIM (3)(i.e. Stopping and Range of Ions in Matter) [5]. It is a Monte Carlo calculation whichfollows the ion into the target, making detailed calculations of the energy transferred toevery target atom collision. All the quantities like projected range, ion damage, targetionization and so on are simulated by averaging over a suitable number of ion trajec-tories: the higher the number the better the precision of the calculation. SRIM codetraces back to the original work by J. P. Biersack on range algorithms (see J. P. Biersackand L. Haggmark, Nucl. Instrum. and Methods, Vol. 174 (1980) 257) and the work byJ. F. Ziegler on stopping theory (see The Stopping and Range of Ions in Matter, Vol.2-6 (Pergamon Press) 1977-1985). SRIM is able to simulate complex targets made ofcompound materials with also layered structures of different materials. It will calculateboth the final 3D distribution of the ions and also all kinetic phenomena associated withthe ion’s energy loss: target damage, sputtering, ionization, and phonon production. Alltarget atom cascades in the target are followed in detail. For instance the simulationsin fig. 4 have been made with SRIM. This program is particularly suitable to simulate
(3) available at the website www.srim.org
10 P. MAZZOLDI and G. MATTEI
ion implantation in amorphous matrices as it does not take into account crystallographicdirection which are required for simulating other technologically relevant implantationconditions like channelling in which ions are implanted along one high symmetry crystaldirection so as the penetration depth of the ions is greatly increased due to the reducedscattering inside the crystal channels. One main limitation of SRIM calculation is thatit does not take into account the accumulated damage, i.e. each simulated ion travelsinside an undamaged target. This implies that phenomena like radiation enhanced dif-fusion (RED) which can play a role during high-dose ion implantation (like those forsynthesizing nanoclusters in the present work) cannot be simulated. Other Monte Carlocodes which are able to a good level of approximation to follow the accumulated damage(i.e. to make a so-called dynamical calculation) have been developed, like for instancethe TRIDYN [6] or DYNA codes [7, 8].
When setting up an actual ion implantation in a target, after choosing the ion andthe target, the most important parameters which have to be optimized are
– implantation energy : it controls the penetration depth inside the target. Typicalvalues are in the keV–MeV energy range.
– Implantation dose or fluence: it controls the amount of dopant (its local concentra-tion) introduced in the target. It is measured in ions/cm2 and it is the integral overthe depth of the concentration profile. Typical values in the nanocluster synthesisare 1015–1017 ions/cm2.
– Current density or flux : is the number of ions introduced per unit time and unitsurface area of the target. It is generally measured in µA/cm2 and it affects thepower density released to the target. Therefore, when dealing with insulating tar-gets like glasses, the flux is of paramount importance to avoid (or to control) thesample heating during implantation. Typical fluxes used in high-fluence implan-tations are 0.1–10 µA/cm2, taking into account that above 2–5 µA/cm2 thermalheating in insulators should be considered.
– Target temperature: it can affect the dynamics of damage self-recovery or of thedamage formation. Implantation at cryogen temperatures can be used to freeze thedamage by reducing the diffusion of the atoms. On the other hand, by increasingthe temperature, the amorphized regions of the target can be recrystallized or inthe case of insulators, by implanting at high temperature (400–900 ◦C) the recoveryof the network can be favored together with the diffusivity of the implanted species.
Among these four parameters, SRIM calculations obviously consider only the implan-tation energy, as the last three quantities deal with the dynamics of the damage, whichis beyond the capabilities of the code.
By ion implantation, very large dopant concentration values can be obtained in theion irradiated region, with a modification of chemical and physical material proper-ties. A proper choice of implantation energies and fluencies allows the implanted ionsto predetermine the composition, the depth and the spatial shape of the modified layer.A fundamental feature of ion implantation is that the implantation process is not athermodynamic equilibrium process. Consequently the usual solubility limits of the im-planted ions in the host can be largely overcome, achieving impurity local concentrationsinaccessible by conventional synthesis routes. The ion distribution is controlled by theexperimental parameters of the implantation process (energy, current, fluence), but alsoby the diffusion coefficients of the different species (implanted ions and displaced matrix
POTENTIALITIES OF ION IMPLANTATION FOR THE SYNTHESIS AND MODIFICATION ETC. 11
atoms), enhanced by the production of defects due to irradiation. The change of diffusionrates into the solid can favor either the aggregation of the dopant or their diffusion insidethe target. Depending on the choice of the implanted atom and the dielectric target,implantation of “metal” ions in dielectric substrate gives rise to the formation of newcompounds and/or metallic nanoparticles.
2.4. Chemical and physical interaction: models for predicting the cluster formation.
– The processes governing the chemical and physical interaction between the implantedions and the host matrix atoms, very crucial for the final system configuration, are notcompletely understood in particular in terms of the relative roles of electronic and nuclearenergy release [9]. Some models have been so far developed. Perez et al. [10, 11] firststudied the state of implanted atoms using a simple statistical model and describing therole of a crystalline host matrix structure in the determination of the final compoundsupon ion irradiation. Yet useful for getting a rough picture, Perez’s statistical modelis actually reliable only (and not always [12]) for ion implantation in crystalline sub-strates. Hosono [13] proposed a criterion to predict the formation of small clusters byion implantation in SiO2 glass, based on physical and chemical considerations. The maindefects produced during ion implantation in silica are oxygen-deficient centers, namely,Si-Si homobonds and neutral oxygen monovacancies. The concentration of Si-Si bondsresults highly ion-specific, i.e. critically depending on the chemical interaction amongthe implanted element and the silicon and oxygen atoms of the glass matrix. In the caseof strong chemical interaction, implanted ions (M) tend to form M-O bonds, so leav-ing Si-Si bonds, whereas, for weak chemical interaction, a large part of the implantedatoms do not react with oxygen atoms, with a very low resulting concentration of Si-Sibonds. Implanted metal (M) and silicon ions compete for bonding oxygen, and clusterformation will occur when the chemical affinity of M ions for oxygen is smaller than thatof Si4+. Hosono model takes the free energy for the oxide formation as the quantitygiving the measure of the chemical interaction. Clustering is expected to occur wheneverthe Gibbs free energy for an oxide formation with the implanted element M is greaterthan that for SiO2. The chemistry considered here is the formation of the MxO2 oxidestarting from the element M in the metallic form and the molecular gaseous oxygen, atthe estimated effective temperature of T = 3000 K, as a consequence of the thermalspike phenomenon. A more general approach accounting for the different compoundsobserved to form in silica upon ion implantation is found in refs. [14, 15]. It starts fromconsidering the concentration of the main implantation-induced defects in silica, point-ing out the importance of the chemical interaction among implanted and host matrixatoms as a determining factor that gives rise to the observed defects. In particular, itis assumed that the primary factor controlling the chemical interaction of the implantedions M with the matrix structure is the electronegativity (EN) of the implanted element.Three different categories are so defined, depending on the behavior of the element whenimplanted in fused silica. For elements with EN< 2.5, the extraction of oxygen atomsfrom the silica network and the formation of M-O bond take place, while implants of ele-ments for which EN> 3.5 give rise to knock-on of oxygen atoms from the silica network,so forming Si-M bonds. The third kind of implants is that of noble metals, which do notexhibit significant chemical reactions.
Research Groups from Universities of Padova and Venice have proposed a model [16],originating from the investigation of Kelly [17] on the compositional modification inducedby ion implantation on alloys, oxides and other substances. He first pointed out theimportant role of the chemistry in the ion-beam mixing process, even though, during
12 P. MAZZOLDI and G. MATTEI
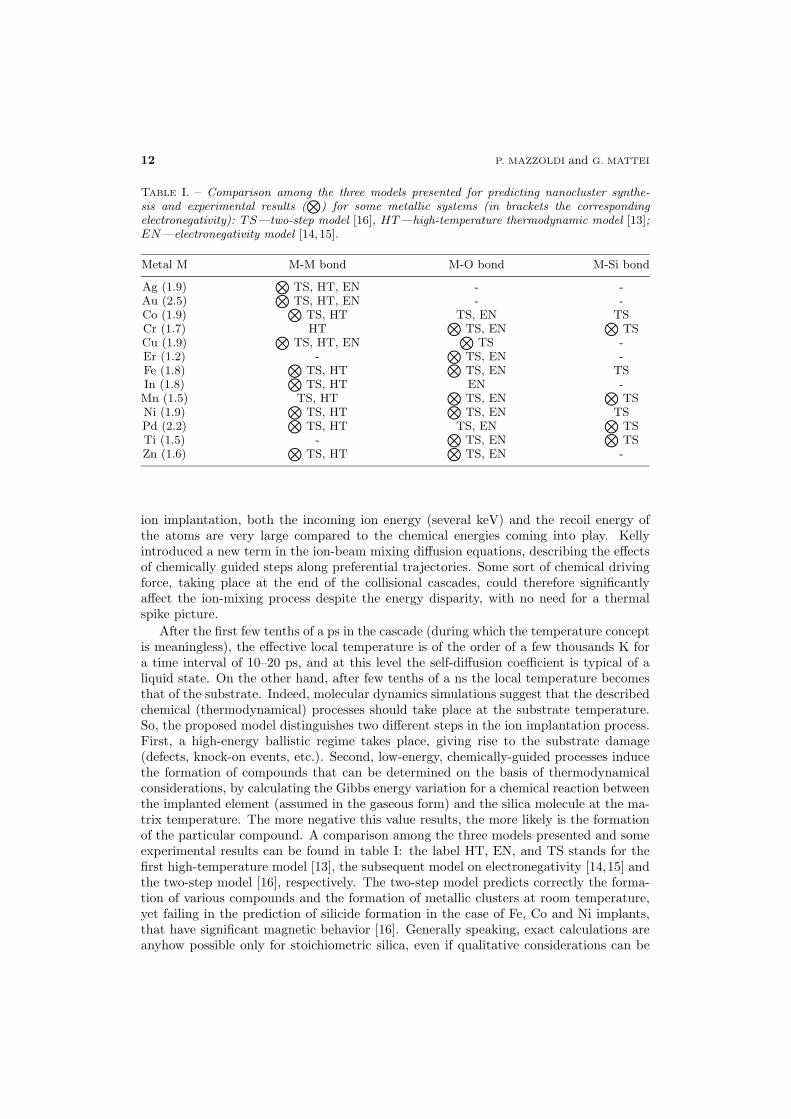
Table I. – Comparison among the three models presented for predicting nanocluster synthe-sis and experimental results (
⊗
) for some metallic systems (in brackets the correspondingelectronegativity): TS—two-step model [16], HT—high-temperature thermodynamic model [13];EN—electronegativity model [14, 15].
Metal M M-M bond M-O bond M-Si bond
Ag (1.9)⊗
TS, HT, EN - -Au (2.5)
⊗
TS, HT, EN - -Co (1.9)
⊗
TS, HT TS, EN TSCr (1.7) HT
⊗
TS, EN⊗
TSCu (1.9)
⊗
TS, HT, EN⊗
TS -Er (1.2) -
⊗
TS, EN -Fe (1.8)
⊗
TS, HT⊗
TS, EN TSIn (1.8)
⊗
TS, HT EN -Mn (1.5) TS, HT
⊗
TS, EN⊗
TSNi (1.9)
⊗
TS, HT⊗
TS, EN TSPd (2.2)
⊗
TS, HT TS, EN⊗
TSTi (1.5) -
⊗
TS, EN⊗
TSZn (1.6)
⊗
TS, HT⊗
TS, EN -
ion implantation, both the incoming ion energy (several keV) and the recoil energy ofthe atoms are very large compared to the chemical energies coming into play. Kellyintroduced a new term in the ion-beam mixing diffusion equations, describing the effectsof chemically guided steps along preferential trajectories. Some sort of chemical drivingforce, taking place at the end of the collisional cascades, could therefore significantlyaffect the ion-mixing process despite the energy disparity, with no need for a thermalspike picture.
After the first few tenths of a ps in the cascade (during which the temperature conceptis meaningless), the effective local temperature is of the order of a few thousands K fora time interval of 10–20 ps, and at this level the self-diffusion coefficient is typical of aliquid state. On the other hand, after few tenths of a ns the local temperature becomesthat of the substrate. Indeed, molecular dynamics simulations suggest that the describedchemical (thermodynamical) processes should take place at the substrate temperature.So, the proposed model distinguishes two different steps in the ion implantation process.First, a high-energy ballistic regime takes place, giving rise to the substrate damage(defects, knock-on events, etc.). Second, low-energy, chemically-guided processes inducethe formation of compounds that can be determined on the basis of thermodynamicalconsiderations, by calculating the Gibbs energy variation for a chemical reaction betweenthe implanted element (assumed in the gaseous form) and the silica molecule at the ma-trix temperature. The more negative this value results, the more likely is the formationof the particular compound. A comparison among the three models presented and someexperimental results can be found in table I: the label HT, EN, and TS stands for thefirst high-temperature model [13], the subsequent model on electronegativity [14,15] andthe two-step model [16], respectively. The two-step model predicts correctly the forma-tion of various compounds and the formation of metallic clusters at room temperature,yet failing in the prediction of silicide formation in the case of Fe, Co and Ni implants,that have significant magnetic behavior [16]. Generally speaking, exact calculations areanyhow possible only for stoichiometric silica, even if qualitative considerations can be
POTENTIALITIES OF ION IMPLANTATION FOR THE SYNTHESIS AND MODIFICATION ETC. 13
put forward as well. Indeed, thermodynamical concepts are limited by the uncertaintyon the evaluation of the local temperature, as well as on the assumption that chemicalinteractions take place between the implanted atoms and the substrate compounds (notthe separate atomic species). The possibility of such modelization for the cluster forma-tion upon ion implantation is further complicated when dealing with sequential doubleimplantation of two different elements.
The ion beam applications involving material analysis require that the ions lose theirenergy predominantly by colliding with the electrons of the solid so that the lattice is notdisturbed (low mass ions and high energy). On the other hand, the applications involvingengineering of materials require either displacements of atoms (nuclear energy loss) fromthe lattice sites or a large amount of energy deposited in the electronic system whichlater is coupled to the lattice via phonon generation. The advent of microstructured andnanostructured materials has extended the potential applications of ion implantationthat are attractive because of the comparable dimensions length scales of componentdimensions and the penetration distances associated with implantation.
3. – A survey on nanocluster-based glassy composited materials
Metal nanoclusters (NCs) embedded in insulating matrices have received in the lastdecade an increasing interest due to their peculiar optical, magnetic and catalytic prop-erties when the size becomes comparable to or less than the electronic mean free path [3,18,2, 19,20,16,21-25].
In nanophotonics, nanometer-sized metal clusters embedded in glass matrices ex-hibit striking nonlinear optical effects, particularly interesting for application in the fieldof nonlinear integrated optics, as part of all-optical devices. Recently, also sensitizingeffects for rare-earth ions luminescence have been reported as due to energy transferbetween metallic nanoclusters and Er or Eu ions in silica glass [26]. Moreover, nanoclus-ters dispersed in dielectric matrices may exhibit superparamagnetic properties, enhancedcoercivity, shift of the hysteresis loop and large magnetotransport properties [27]. Nano-structured materials are also used in catalysis, where high surface-to-volume ratios arerequired [28].
Glass-based composites are in general expected to play an important role as mate-rials for various nanotechnology applications, due to the low cost, ease of processing,high durability, resistance and high transparency, with the possibility of tailoring thebehavior of the glass-based structures. M. Faraday made the first attempt to explain thenature of the color induced in glasses by small metal precipitates [29]. Further attemptsto describe the optical behaviour of clusters embedded in a matrix as a homogeneousmedium with an effective dielectric function were made by Maxwell-Garnett [30, 31]. Acomplete analytical solution to the scattering of an electromagnetic wave by a sphericalisolated cluster embedded in a non-absorbing medium was given in the same years by G.Mie [32]. After that, many studies have been dedicated to the properties of Metal Nano-cluster Composite Glass (MNCG). In general, the physical properties of these systemschange dramatically in the transition from atom to molecule to cluster to solid, where thecluster regime is characterized by the confinement effects that make MNCGs peculiarlyinteresting. For example, experiments which showed the transition from atomic overmolecular to bulk plasmon absorption features have been performed with Ag clusters inphotosensitive glasses during the last four decades. Updated review articles dealing withMNGCs are currently published, each one covering one or more particular aspects, rang-ing from preparation techniques to properties and characterization. A general treatmentof quantum dot materials including MNCGs is presented in ref. [33], while glasses for
14 P. MAZZOLDI and G. MATTEI
optoelectronic devices, particularly MNCGs, are treated in refs. [3, 34, 35]. The theoret-ical aspects of MNCG properties are approached in the literature under a great varietyof viewpoints, for example, by treating the electronic properties of metal clusters [36], orfocusing on the quantum size effect [37]. Nonlinear optical properties of small metal par-ticles are treated in details in refs. [38,39], while refs. [40,41] present extended reviews ontheoretical and experimental aspects of the optical response of metal clusters. Recent as-pects concerning the interface properties of MNCGs are in ref. [42], and ref. [43] presentsa review of all-optical switching via nonlinear optical materials. The present work dealswith metal nanocluster composites formed by clusters of binary transition metals al-loy embedded in silicate glasses, in which cluster concentration is below the percolationlimit (dispersed clusters). The scale regime has characteristic lengths, such as correlationlengths among clusters or electron mean free paths of the bulk, that are larger than thecluster size. On the other hand, the clusters are considered to be large enough to exhibithowever electronic behavior features of the metal (usually, larger than 1 nm diameter),even being small enough to exhibit strong confinement effects (up to tens of nm diameter).
Ion implantation of metal or semiconductor ions into glass has been explored sincethe last decade as a useful technique to produce nanocomposite materials in whichnanometer sized metal or semiconductor particles are embedded in dielectric matrices[16,3,25,20,44-47]. Furthermore, ion implantation has been used as the first step of com-bined methodologies that involve other treatments such as thermal annealing in controlledatmosphere, laser or ion irradiation [48,24,49]. In general, ion implantation is well estab-lished as a suitable technique for improve mechanical, optical and structural near-surfaceproperties of glasses. It has several advantages, such as low-temperature processing, con-trol of distribution and concentration of dopants, availability of chemical states whichcannot be realized via conventional techniques, overcoming of solubility limits. Moreover,ion implantation can be exploited for designing waveguiding structures along prescribedpatterns. The implantation of ions (of typical energies in the range from keV to MeV)into materials results in various modifications which depend on the glass composition,the ion species, the fluence, the implantation energy, and, in some cases, the interactionwith the external atmosphere, when implanted glasses are removed from the implantationchamber. These modifications are here treated in the case of dielectric matrices, mostlyfused silica and soda-lime glass, both of which are used for the synthesis of quantumdot materials, with interesting technological applications. Energetic ions loose their en-ergy in implanted dielectrics by either interaction with the electronic system or by directhard-sphere collisions with the nuclei. The partition of the ion energy into electronic andcollisional processes, as well as the projected ion range and the straggling, are usually ob-tained by the SRIM code [5]. Both nuclear and electronic stopping give rise to structuralchanges in materials, and in several cases the process of ion implantation gives rise to theclusterization of implanted metal ions (for comprehensive reviews, see refs. [1,16,3,20]).
The preparation of “mixed” colloidal structures, containing clusters of either differentmetals or formed by metal alloys, has recently attracted a great attention. With respectto the monoelemental case, binary metal nanoclusters offer further degrees of freedom forthe control of the material features, namely, cluster composition and crystal structure.On the other hand, the suitability of MNCGs containing binary nanoclusters for actualdevices requires a more detailed knowledge of the conditions for clusterization occurring,in order to control the parameters that may induce separation instead of alloying ofthe implanted species.
Sequential ion implantation of two different metal species may give rise to variousdifferent nanocluster structures, with the presence of separated families of pure metal
POTENTIALITIES OF ION IMPLANTATION FOR THE SYNTHESIS AND MODIFICATION ETC. 15
(c)
alloy AB
(a) (b)
elem. A elem. B
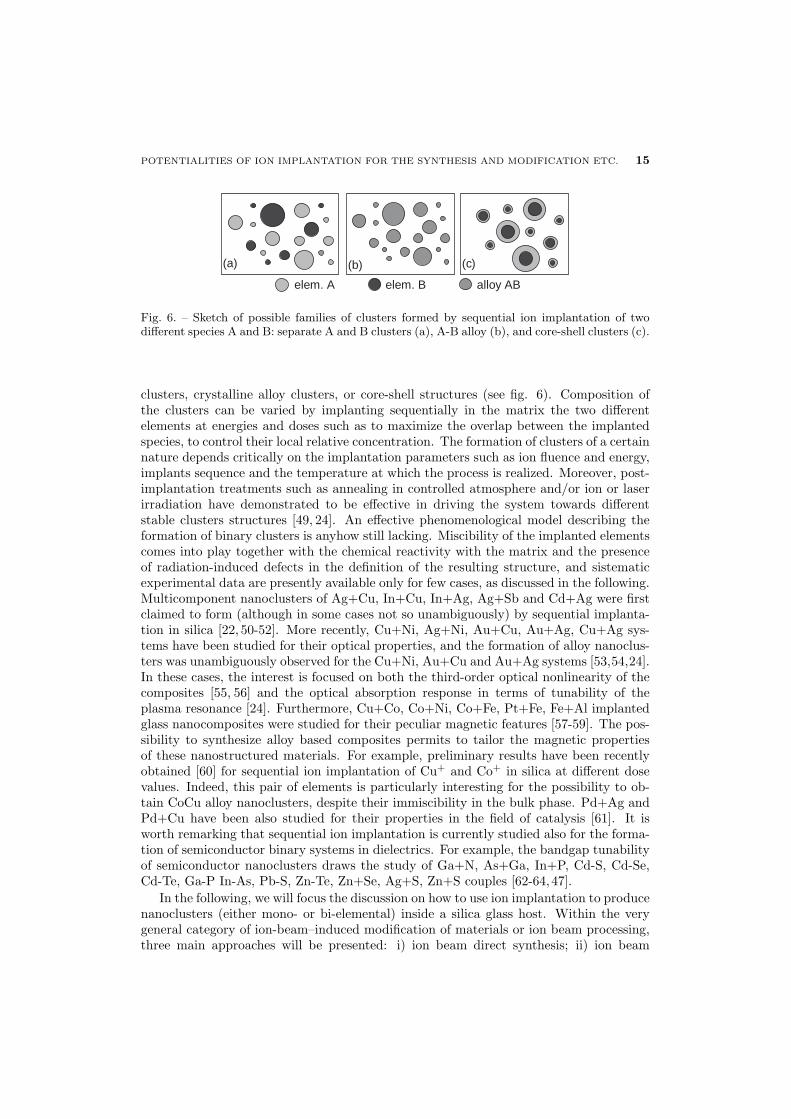
Fig. 6. – Sketch of possible families of clusters formed by sequential ion implantation of twodifferent species A and B: separate A and B clusters (a), A-B alloy (b), and core-shell clusters (c).
clusters, crystalline alloy clusters, or core-shell structures (see fig. 6). Composition ofthe clusters can be varied by implanting sequentially in the matrix the two differentelements at energies and doses such as to maximize the overlap between the implantedspecies, to control their local relative concentration. The formation of clusters of a certainnature depends critically on the implantation parameters such as ion fluence and energy,implants sequence and the temperature at which the process is realized. Moreover, post-implantation treatments such as annealing in controlled atmosphere and/or ion or laserirradiation have demonstrated to be effective in driving the system towards differentstable clusters structures [49, 24]. An effective phenomenological model describing theformation of binary clusters is anyhow still lacking. Miscibility of the implanted elementscomes into play together with the chemical reactivity with the matrix and the presenceof radiation-induced defects in the definition of the resulting structure, and sistematicexperimental data are presently available only for few cases, as discussed in the following.Multicomponent nanoclusters of Ag+Cu, In+Cu, In+Ag, Ag+Sb and Cd+Ag were firstclaimed to form (although in some cases not so unambiguously) by sequential implanta-tion in silica [22, 50-52]. More recently, Cu+Ni, Ag+Ni, Au+Cu, Au+Ag, Cu+Ag sys-tems have been studied for their optical properties, and the formation of alloy nanoclus-ters was unambiguously observed for the Cu+Ni, Au+Cu and Au+Ag systems [53,54,24].In these cases, the interest is focused on both the third-order optical nonlinearity of thecomposites [55, 56] and the optical absorption response in terms of tunability of theplasma resonance [24]. Furthermore, Cu+Co, Co+Ni, Co+Fe, Pt+Fe, Fe+Al implantedglass nanocomposites were studied for their peculiar magnetic features [57-59]. The pos-sibility to synthesize alloy based composites permits to tailor the magnetic propertiesof these nanostructured materials. For example, preliminary results have been recentlyobtained [60] for sequential ion implantation of Cu+ and Co+ in silica at different dosevalues. Indeed, this pair of elements is particularly interesting for the possibility to ob-tain CoCu alloy nanoclusters, despite their immiscibility in the bulk phase. Pd+Ag andPd+Cu have been also studied for their properties in the field of catalysis [61]. It isworth remarking that sequential ion implantation is currently studied also for the forma-tion of semiconductor binary systems in dielectrics. For example, the bandgap tunabilityof semiconductor nanoclusters draws the study of Ga+N, As+Ga, In+P, Cd-S, Cd-Se,Cd-Te, Ga-P In-As, Pb-S, Zn-Te, Zn+Se, Ag+S, Zn+S couples [62-64,47].
In the following, we will focus the discussion on how to use ion implantation to producenanoclusters (either mono- or bi-elemental) inside a silica glass host. Within the verygeneral category of ion-beam–induced modification of materials or ion beam processing,three main approaches will be presented: i) ion beam direct synthesis; ii) ion beam
16 P. MAZZOLDI and G. MATTEI
indirect synthesis; iii) ion beam modification. This nomenclature is somehow arbitrarybecause strictly speaking the three categories can all be defined “ion beam processing”.To be more precise, therefore, we will adopt the following definitions:
– ion beam direct synthesis: the direct synthesis of mono- or bi-elemental nanoclus-ters by single or sequential ion implantation of the ions constituting the clustersinside the host matrix. This is the most intuitive approach and generally it canbe coupled to suitable post-implantation thermal annealing of the samples in con-trolled atmosphere. In this approach ion beam is used to create a supersaturatedsolid solution of the implanted ions inside the matrix. The solution, either duringimplantation itself or after thermal treatments, starts to nucleate and well-definednanoclusters can be obtained.
– Ion beam indirect synthesis: the ion beam in this case is used to tailor the energydeposited in the target (nuclear vs. electronic, in-depth distribution, etc.) so as topromote nucleation of clusters made of atoms already present in the host matrix.This synthesis route is somehow hybrid in the sense that it is normally coupled toa previous step involving doping of the matrix host by auxiliary techniques like forinstance ion-exchange.
– Ion beam modification: the energy released by the implanted ions is used to modifyalready formed clusters by changing their size, shape, composition and topology.In particular we will see that this last mode can be conveniently applied to modifythe electromagnetic environment around a nanocluster by the formation of pecu-liar cluster-satellite topology or to promote a selective de-alloying in bimetallicnanoclusters.
4. – Ion beam direct synthesis: monoatomic clusters
The most obvious way to synthesize nanoclusters inside a matrix is to implant ionsM at a concentration which is above the solubility limit of M in the host to promoteprecipitation of a new phase from a supersaturated solid solution. We refer to thisprocess as to “ion beam direct synthesis”. To this respect, ion implantation is a veryefficient technique as it can introduce any desired amount of the foreign phase in thehost, without thermodynamic limitations typical of other synthesis techniques: we stressthat this is due to the fact the ion implantation is a non-equilibrium technique.
The control of cluster size with dimensions in the nanometer range either during thesynthesis process or after subsequent thermal annealing is one of the challenging issues ofnanocluster technology, as the electronic properties of the nanoparticles depend stronglyon their dimensions. In fact, ion implantation is usually coupled to post-implantationthermal treatments which have a twofold meaning: i) annealing of the implantation-induced defects; ii) growth of the nucleated embryos by means of suitable combination ofannealing atmosphere, temperature and time. In silica, for instance, annealing of the im-plantation damage requires temperature near or above 600 ◦C: at these temperatures thethermal diffusion of the implanted species can be quite effective in modifying the post-implantation dopant distribution promoting either redistribution of implanted species orclustering around nucleated embryos. Therefore a precise understanding of the micro-scopic mechanisms influencing the evolution of cluster size during thermal annealing isof paramount importance [9, 65,66].
POTENTIALITIES OF ION IMPLANTATION FOR THE SYNTHESIS AND MODIFICATION ETC. 17
We investigate this crucial problem by presenting a systematic study of the kineticsof gold atom clustering during annealing of gold implanted silica. The use of gold is dueto its reduced chemical interaction with the elements constituting the matrix, thereforeallowing to focus just on the clustering and growth phenomena, without possible inter-ferences due to formation of bonds with Si or O atoms of the matrix. Moreover, goldhas a low diffusivity [67] in comparison to other noble metals like silver for example: thisminimizes the role of diffusion controlled processes, which occur in post implantationthermal annealings and, consequently, one has the possibility to vary the size and den-sity nanoparticle distribution by means of the atmosphere in which post implantationannealings take place.
4.1. Basic equations of clustering . – The precipitation processes that occur during
either implantation or annealing of ion-implanted materials may be schematically dividedin three steps not necessarily strictly separated: i) nucleation, ii) non-competitive ordiffusion-limited growth, iii) competitive growth (i.e. coarsening or Ostwald ripening)regime.
Impurity implantation at fluences exceeding the solubility threshold in the matrix [68,69] (fluences ≥ 1016 Au+/cm2 in the case of gold in silica, in our experimental condi-tions) results, in the first stage of the precipitation process, in a system of new phaseprecipitates, i.e. gold particles with radius exceeding the critical one, Rc. It is naturalto assume that the radiation-induced defects, both point and extended defects, may actas nucleating centers in implanted materials and that heterogeneous nucleation takesplace [68].
4.1.1. Nucleation. Assuming the embryos as spherical particles of radiusR the variation
of the Gibbs ∆G(R) free energy can be written as
∆G(R) = −4π
3R3∆gV + 4πR2σ(12)
with ∆gV and σ are the bulk free energy per unit volume and the surface energy. Themaximum of ∆G(R) with respect to the radius defines the critical radius Rc as
Rc =2σ
∆gV.(13)
During the initial stage of annealing, the particles (already formed after implantation)with radius exceeding the critical one, grow directly by solute depletion of the surroundingmatrix, without competing with the growth of any others.
4.1.2. Diffusion-limited growth. To analyze the evolution of cluster growth in our ex-
perimental conditions, we briefly recall here the basic equations governing the clusteringprocess in supersaturated solid solutions. The problem of diffusive decomposition ofsupersaturated solid solutions was addressed by a number of authors [70-72]. They gen-erally agree on the point that analytical solutions of a given diffusion-controlled phasetransformation problem are not easily obtainable. However, approximate analytical so-lutions are reported in literature for the relevant quantities of the precipitation processthat is mainly characterized by the growth of spherical or planar precipitates. In the caseof spherical precipitates, the analytical expression for R(t), the radius of the precipitates
18 P. MAZZOLDI and G. MATTEI
at time t is
R2(t) = R20 + 2
Cs − Ce
Cp − CeDt ,(14)
where R0 is the value of R at t = 0 (which accounts for the radius of the already formedprecipitates by implantation). The volume diffusion coefficient D of the dopant in thematrix is assumed independent of composition. Cp is the concentration of the solutein the precipitates and Cs and Ce are the concentration in the matrix just before thegrowth, and the equilibrium concentration in the matrix, respectively. The differenceCs − Ce defines the degree of supersaturation that decreases during the precipitationstage.
Equation (14) stems from the solute flux balance at cluster-matrix interface:
CpdR
dt= D
∂C
∂r
∣
∣
∣
∣
r=R
+ CedR
dt.(15)
Here, C = C(r, t) is the concentration field in the matrix surrounding the precipitate,where the concentration gradient is linearized. Indeed, to obtain eq. (14) starting fromeq. (15), a linearized gradient approximation must be adopted and “interaction” betweengrowing grains must be disregarded as far as the grain size is small in comparison withthe intergranular spacing [70]. In the following, we will apply eq. (14) to describe theexperimental results obtained in the early stage of cluster growth. Moreover in eq. (14)we will assume that the Ce value is a vanishing quantity in comparison with Cs. In fact,the former corresponds to the equilibrium Au concentration in the SiO2 matrix (i.e. thethreshold for spontaneous precipitation), that is one order of magnitude less than Cs, asobserved in our experiments.
4.1.3. Coarsening. In the later stage, when the cluster size is fairly large and the
supersaturation degree becomes extremely small, coarsening, i.e. Ostwald ripening, takesplace. In this process, the particle transfer from the matrix to the cluster is controlledby the Gibbs-Thomson effect. For a spherical isotropic cluster of radius R the Gibbs-Thomson relation is
C(R) = C∞ exp
[
2σVa
RkT
]
≃ C∞
(
1 +α
R
)
,(16)
where C∞ is the equilibrium solute concentration at planar interface, α is the capillaritylength associated to the surface tension σ and Va the atomic volume [73]. We identifythe concentration C(R) with the equilibrium concentration in the immediate vicinity ofthe cluster of radius R in the matrix. The cluster size distribution determines an equilib-rium concentration C(R), where R is the mean value of the cluster radius distribution.Since smaller clusters have a higher solute concentration than larger ones, the diffusionalbalance promotes matter transfer from smaller to larger precipitates, i.e. Ostwald ripen-ing. Consequently the R value increases and the diffusional process maintains the mattertransfer. The equation governing the cluster growth is
d
dt
(
4
3πR3
)
= 4πR2Va(−D)∂C
∂r
∣
∣
∣
∣
r=R
(17)
POTENTIALITIES OF ION IMPLANTATION FOR THE SYNTHESIS AND MODIFICATION ETC. 19
whose integration, performed by Lifshitz and Slezof in the linearized gradient approxi-mation [70], leads to
R3(t) −R30 =
8
9
σV 2a C∞
kTDt .(18)
Therefore the solution (18) holds in the later stage of the precipitation process when sizeeffects become relevant in connection to the C(R) values [73].
In conclusion, we distinguish two different kinetic regimes of cluster growth: i) adiffusional one (occurring at the earlier stage of growth) which is characterized by a timedependence of cluster radius scaling as (Dt)1/2, where D is the diffusion coefficient andt the diffusion time; ii) a coarsening regime (occurring at longer annealing times) with aradius scaling as (Dt)1/3.
Before concluding this subsection, it is worth mentioning that in ion implantation-induced nucleation the diffusion coefficient D in the previous equations is not simply thepurely thermal one: indeed, other effects contribute to D, i.e. the radiation enhanceddiffusion (RED) and a correlated diffusion triggered by the correlation of dopant withthe diffusing atoms coming from the annealing atmosphere, as envisaged in ref. [68].
However, disregarding the complicate form of the flux equations which include cor-relation processes or the microscopic mechanism of RED, one can account for all theseeffects by empirically introducing an effective diffusion coefficient, in the equations forprecipitation and coarsening. Note that, when we will evaluate the surface tension σ, thediffusion parameter D does not enter in the calculation and so, the result is not affectedby the choice of D.
4.2. Linear absorption of embedded metal clusters: the Mie theory . – One of the fin-
gerprints of noble-metal cluster formation is the development of a well-defined absorptionband in the visible or near UV spectrum which is called the surface plasma resonance(SPR) absorption. It is typical of s-type metals like noble and alkali metals and it isdue to a collective excitation of the delocalized conduction electrons confined within thecluster volume [40]. To better understand the meaning of the SPR absorption for spher-ical clusters we recall that, according to the theory developed by G. Mie in 1908 [32], theextinction cross-section σ(ω,R) due to non-interacting nanoparticles of radius R embed-ded in a non-absorbing medium with dielectric constant εm (i.e. with a refractive indexn =
√εm) can be written in the dipolar approximation as
σ(ω,R) = 9ω
cε3/2
m V0ε2(ω,R)
(ε1(ω,R) + 2εm)2 + ε22(ω,R),(19)
where V0 is the cluster volume, c is the speed of light in vacuum and ε(ω,R) ≡ ε1(ω,R)+iε2(ω,R) is the size-dependent complex dielectric function of the cluster. The SPR ab-sorption resonance holds when the denominator in eq. (19) is vanishingly small. Thisapproximation is valid for isolated clusters when the radius is much less than the wave-length λ = c(2π/ω): when this is not the case retardation effects inside the cluster makethe electrons oscillate not all with the same phase of the local field and high-order mul-tipolar expansion should be taken into account in the general Mie formula [40]. Onerelevant point concerns the size dependence of the cluster dielectric function. Follow-ing ref. [40], the size correction is obtained by modifying the Drude-like part due to
20 P. MAZZOLDI and G. MATTEI
delocalized free s-electrons introducing a size-dependent damping frequency Γ(R) whichaccounts for the increased scattering at the cluster surface as follows:
Γ(R) = Γ∞ +AvFR,(20)
where Γ∞ is the bulk damping frequency, vF is the bulk Fermi velocity and A a geomet-rical adimensional constant usually assumed to be 1.
Considering a matrix with N clusters in the volume V , the absorption coefficientα of the composite is defined through the Lambert-Beer absorption law: I = I0e
−αx,where I0, I are the intensity before and after the sample of thickness x. Let f(R) be thenormalized cluster size distribution function with
∫
∞
0
dR f(R) = 1 ;(21)
the absorption coefficient α(ω) can be written as
α(ω) =N
V
∫
∞
0
dR f(R) σ(ω,R) .(22)
In the case of monodisperse distribution (i.e. f(R) = δ(R−R0)) all the clusters have thesame radius R0, then
α(ω) =N
Vσ(ω,R0) =
NV0V
σ(ω,R0)
V0= p
σ(ω,R0)
V0.(23)
With p the nanocluster filling factor. Therefore, if we measure the optical density OD(ω)defined as
OD(ω) = log10
(
I0I
)
= log10(e) α(ω) x ,(24)
we have
OD(ω) = log10(e) xN
V
∫
∞
0
dR f(R) σ(ω,R) .(25)
The above formalism has been applied to the calculation of the size distribution of Auclusters upon thermal annealing to complement the transmission electron microscopyanalysis, as will be shown later.
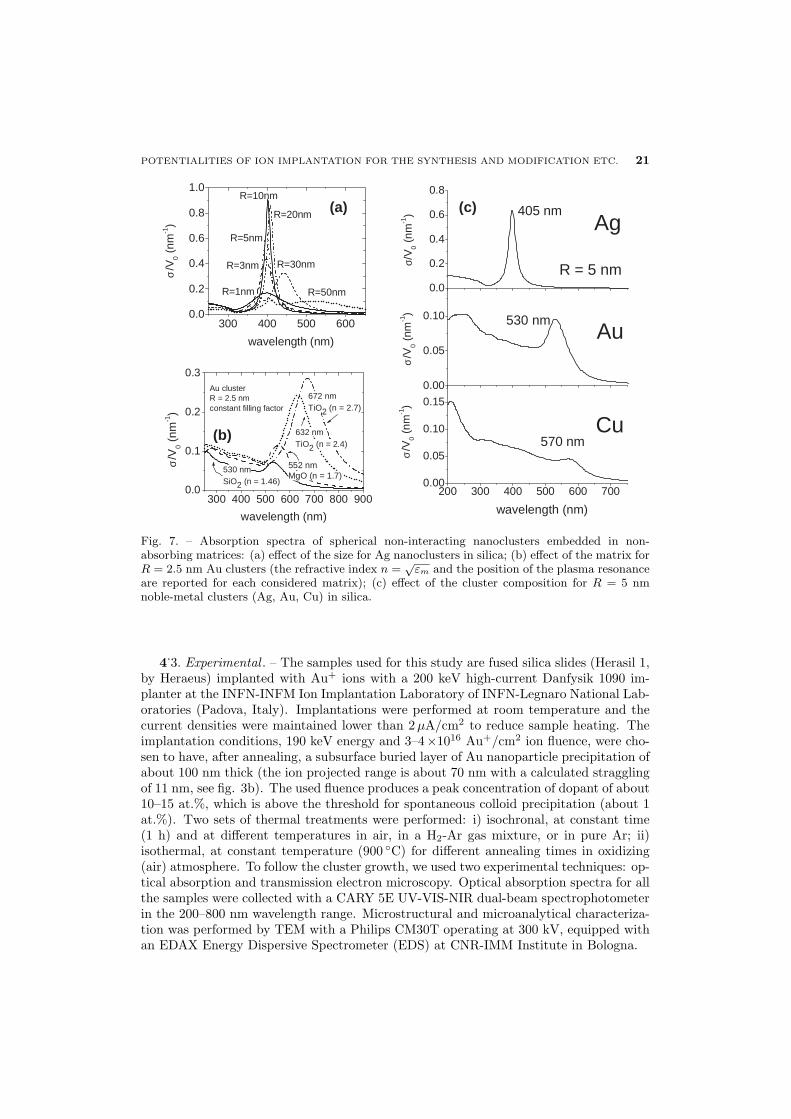
To better illustrate the main factors influencing the position and the shape of the SPRabsorption band, in fig. 7a) the effect of the cluster radius is shown for Ag nanoclustersin silica: when the size is no longer negligible with respect to the wavelength there is ared-shift of the SPR position with the appearance of multipolar peaks in the UV-blueregion. The effect of the matrix for a fixed cluster size is described for R = 2.5 nm Auclusters in fig. 7b): the higher the matrix dielectric constant the more red-shifted is theSPR. Finally, the effect of the composition is shown in fig. 7c) for R = 5 nm clusters ofAg, Au and Cu in silica.
POTENTIALITIES OF ION IMPLANTATION FOR THE SYNTHESIS AND MODIFICATION ETC. 21
300 400 500 600 700 800 9000.0
0.1
0.2
0.3
672 nmTiO2 (n = 2.7)
632 nmTiO2 (n = 2.4)
552 nmMgO (n = 1.7)
σ/V
0(n
m-1)
wavelength (nm)
Au clusterR = 2.5 nmconstant filling factor
530 nmSiO2 (n = 1.46)
200 300 400 500 600 7000.00
0.05
0.10
0.15
570 nm
σ/V
0(n
m-1)
wavelength (nm)
0.00
0.05
0.10
Au530 nm
σ/V
0(n
m-1)
0.0
0.2
0.4
0.6
0.8
R = 5 nm
Cu
Ag405 nm
σ/V
0(n
m-1)
300 400 500 6000.0
0.2
0.4
0.6
0.8
1.0
R=50nm
R=30nm
R=20nm
R=10nm
R=5nm
R=3nm
R=1nm
σ/V
0(n
m-1)
wavelength (nm)
(a)
(b)
(c)
Fig. 7. – Absorption spectra of spherical non-interacting nanoclusters embedded in non-absorbing matrices: (a) effect of the size for Ag nanoclusters in silica; (b) effect of the matrix forR = 2.5 nm Au clusters (the refractive index n =
√εm and the position of the plasma resonance
are reported for each considered matrix); (c) effect of the cluster composition for R = 5 nmnoble-metal clusters (Ag, Au, Cu) in silica.
4.3. Experimental . – The samples used for this study are fused silica slides (Herasil 1,
by Heraeus) implanted with Au+ ions with a 200 keV high-current Danfysik 1090 im-planter at the INFN-INFM Ion Implantation Laboratory of INFN-Legnaro National Lab-oratories (Padova, Italy). Implantations were performed at room temperature and thecurrent densities were maintained lower than 2µA/cm2 to reduce sample heating. Theimplantation conditions, 190 keV energy and 3–4×10¹⁶ Au+/cm2 ion fluence, were cho-sen to have, after annealing, a subsurface buried layer of Au nanoparticle precipitation ofabout 100 nm thick (the ion projected range is about 70 nm with a calculated stragglingof 11 nm, see fig. 3b). The used fluence produces a peak concentration of dopant of about10–15 at.%, which is above the threshold for spontaneous colloid precipitation (about 1at.%). Two sets of thermal treatments were performed: i) isochronal, at constant time(1 h) and at different temperatures in air, in a H2-Ar gas mixture, or in pure Ar; ii)isothermal, at constant temperature (900 ◦C) for different annealing times in oxidizing(air) atmosphere. To follow the cluster growth, we used two experimental techniques: op-tical absorption and transmission electron microscopy. Optical absorption spectra for allthe samples were collected with a CARY 5E UV-VIS-NIR dual-beam spectrophotometerin the 200–800 nm wavelength range. Microstructural and microanalytical characteriza-tion was performed by TEM with a Philips CM30T operating at 300 kV, equipped withan EDAX Energy Dispersive Spectrometer (EDS) at CNR-IMM Institute in Bologna.
22 P. MAZZOLDI and G. MATTEI
400 500 600wavelength (nm)
0.1
0.2
0.3
0.4
Opt
ical
Den
sity
400 500 600wavelength (nm)
air Ar900oC
880oC
850oC
800oC
700oC
500oC
as-implanted
900oC
800oC
700oC
500oC
as-implanted
300 400 500 600 700 800wavelength (nm)
0.1
0.2
0.3
0.4
Opt
ical
den
sity
meas.Mie fit
<D>TEM = 5.3 nm
<D>fit = 5.2 nm
(a) (b)
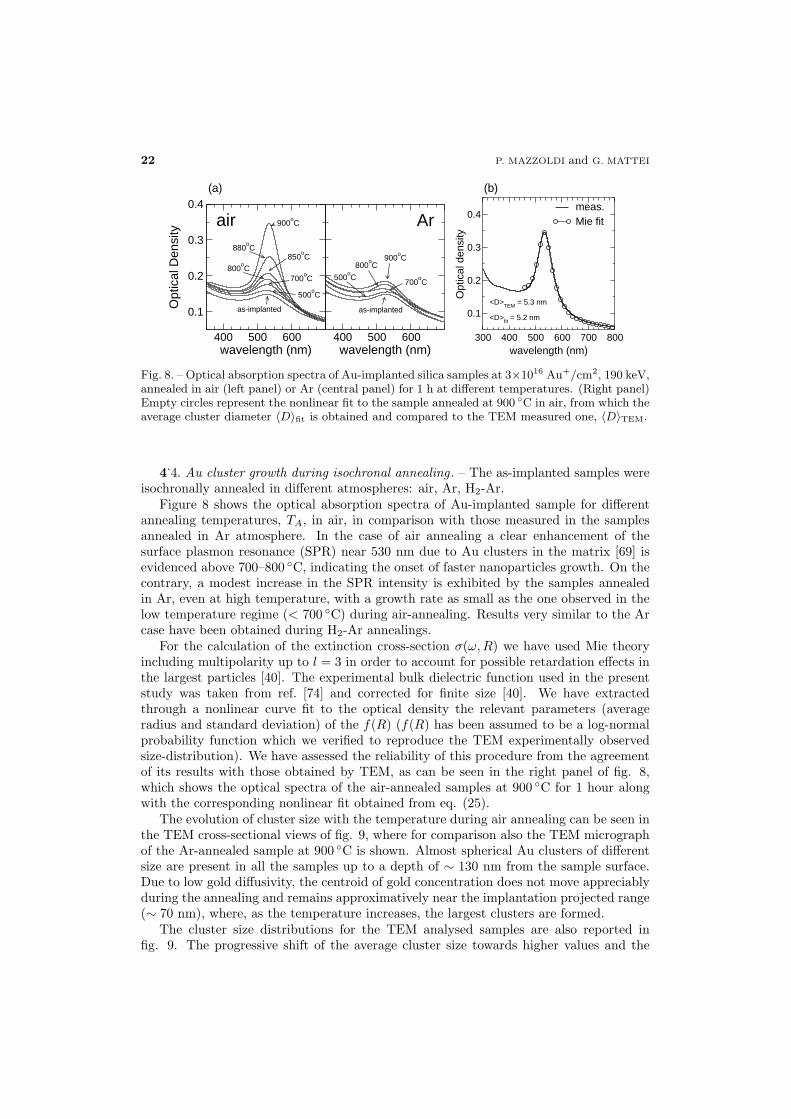
Fig. 8. – Optical absorption spectra of Au-implanted silica samples at 3×10¹⁶ Au+/cm2, 190 keV,annealed in air (left panel) or Ar (central panel) for 1 h at different temperatures. (Right panel)Empty circles represent the nonlinear fit to the sample annealed at 900 ◦C in air, from which theaverage cluster diameter 〈D〉fit is obtained and compared to the TEM measured one, 〈D〉TEM.
4.4. Au cluster growth during isochronal annealing . – The as-implanted samples were
isochronally annealed in different atmospheres: air, Ar, H2-Ar.Figure 8 shows the optical absorption spectra of Au-implanted sample for different
annealing temperatures, TA, in air, in comparison with those measured in the samplesannealed in Ar atmosphere. In the case of air annealing a clear enhancement of thesurface plasmon resonance (SPR) near 530 nm due to Au clusters in the matrix [69] isevidenced above 700–800 ◦C, indicating the onset of faster nanoparticles growth. On thecontrary, a modest increase in the SPR intensity is exhibited by the samples annealedin Ar, even at high temperature, with a growth rate as small as the one observed in thelow temperature regime (< 700 ◦C) during air-annealing. Results very similar to the Arcase have been obtained during H2-Ar annealings.
For the calculation of the extinction cross-section σ(ω,R) we have used Mie theoryincluding multipolarity up to l = 3 in order to account for possible retardation effects inthe largest particles [40]. The experimental bulk dielectric function used in the presentstudy was taken from ref. [74] and corrected for finite size [40]. We have extractedthrough a nonlinear curve fit to the optical density the relevant parameters (averageradius and standard deviation) of the f(R) (f(R) has been assumed to be a log-normalprobability function which we verified to reproduce the TEM experimentally observedsize-distribution). We have assessed the reliability of this procedure from the agreementof its results with those obtained by TEM, as can be seen in the right panel of fig. 8,which shows the optical spectra of the air-annealed samples at 900 ◦C for 1 hour alongwith the corresponding nonlinear fit obtained from eq. (25).
The evolution of cluster size with the temperature during air annealing can be seen inthe TEM cross-sectional views of fig. 9, where for comparison also the TEM micrographof the Ar-annealed sample at 900 ◦C is shown. Almost spherical Au clusters of differentsize are present in all the samples up to a depth of ∼ 130 nm from the sample surface.Due to low gold diffusivity, the centroid of gold concentration does not move appreciablyduring the annealing and remains approximatively near the implantation projected range(∼ 70 nm), where, as the temperature increases, the largest clusters are formed.
The cluster size distributions for the TEM analysed samples are also reported infig. 9. The progressive shift of the average cluster size towards higher values and the
POTENTIALITIES OF ION IMPLANTATION FOR THE SYNTHESIS AND MODIFICATION ETC. 23
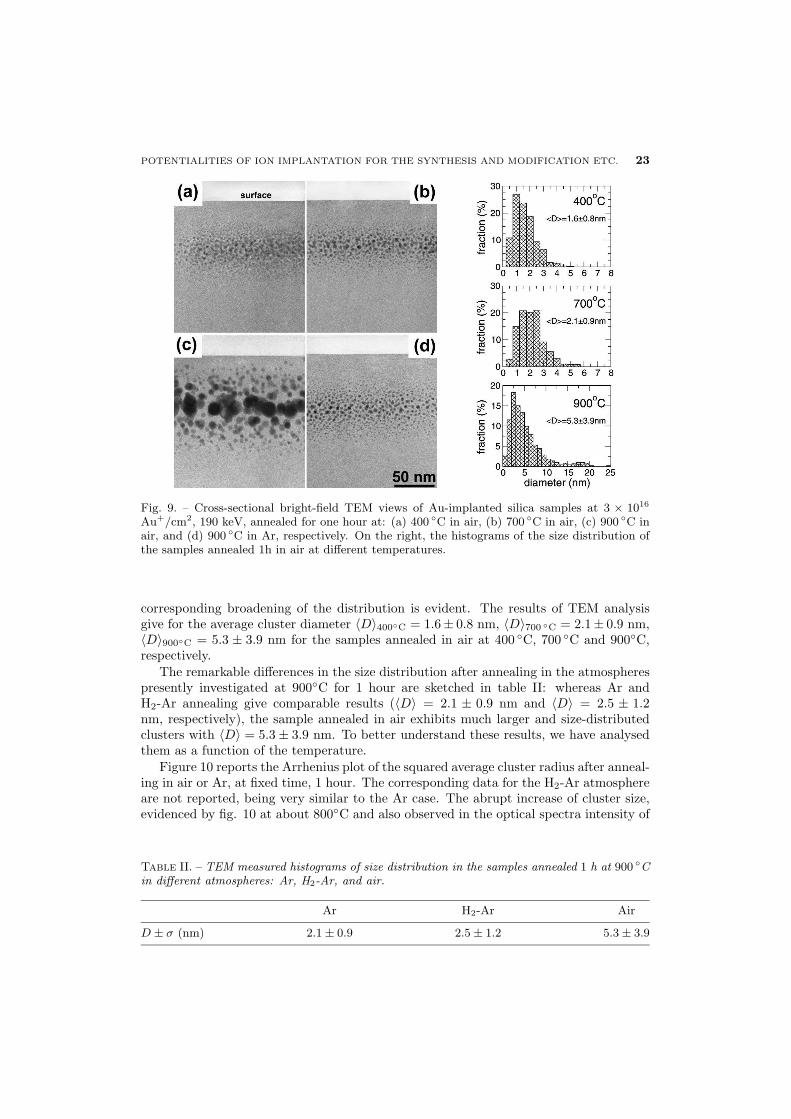
Fig. 9. – Cross-sectional bright-field TEM views of Au-implanted silica samples at 3 × 10¹⁶
Au+/cm2, 190 keV, annealed for one hour at: (a) 400 ◦C in air, (b) 700 ◦C in air, (c) 900 ◦C inair, and (d) 900 ◦C in Ar, respectively. On the right, the histograms of the size distribution ofthe samples annealed 1h in air at different temperatures.
corresponding broadening of the distribution is evident. The results of TEM analysisgive for the average cluster diameter 〈D〉400◦C = 1.6± 0.8 nm, 〈D〉700 ◦C = 2.1± 0.9 nm,〈D〉900◦C = 5.3 ± 3.9 nm for the samples annealed in air at 400 ◦C, 700 ◦C and 900◦C,respectively.
The remarkable differences in the size distribution after annealing in the atmospherespresently investigated at 900◦C for 1 hour are sketched in table II: whereas Ar andH2-Ar annealing give comparable results (〈D〉 = 2.1 ± 0.9 nm and 〈D〉 = 2.5 ± 1.2nm, respectively), the sample annealed in air exhibits much larger and size-distributedclusters with 〈D〉 = 5.3 ± 3.9 nm. To better understand these results, we have analysedthem as a function of the temperature.
Figure 10 reports the Arrhenius plot of the squared average cluster radius after anneal-ing in air or Ar, at fixed time, 1 hour. The corresponding data for the H2-Ar atmosphereare not reported, being very similar to the Ar case. The abrupt increase of cluster size,evidenced by fig. 10 at about 800◦C and also observed in the optical spectra intensity of
Table II. – TEM measured histograms of size distribution in the samples annealed 1 h at 900 ◦Cin different atmospheres: Ar, H2-Ar, and air.
Ar H2-Ar Air
D ± σ (nm) 2.1± 0.9 2.5± 1.2 5.3± 3.9
24 P. MAZZOLDI and G. MATTEI
8 10 12 14 16 18
1/kT (eV-1
)
-0.5
0.0
0.5
1.0
1.5
2.0
2.5
ln(R
2 )airAr
450 600 750 900
T (oC)
1.0
2.0
3.0
4.0
5.0
6.0
aver
age
diam
eter
(nm
)
1h air
(a) (b)
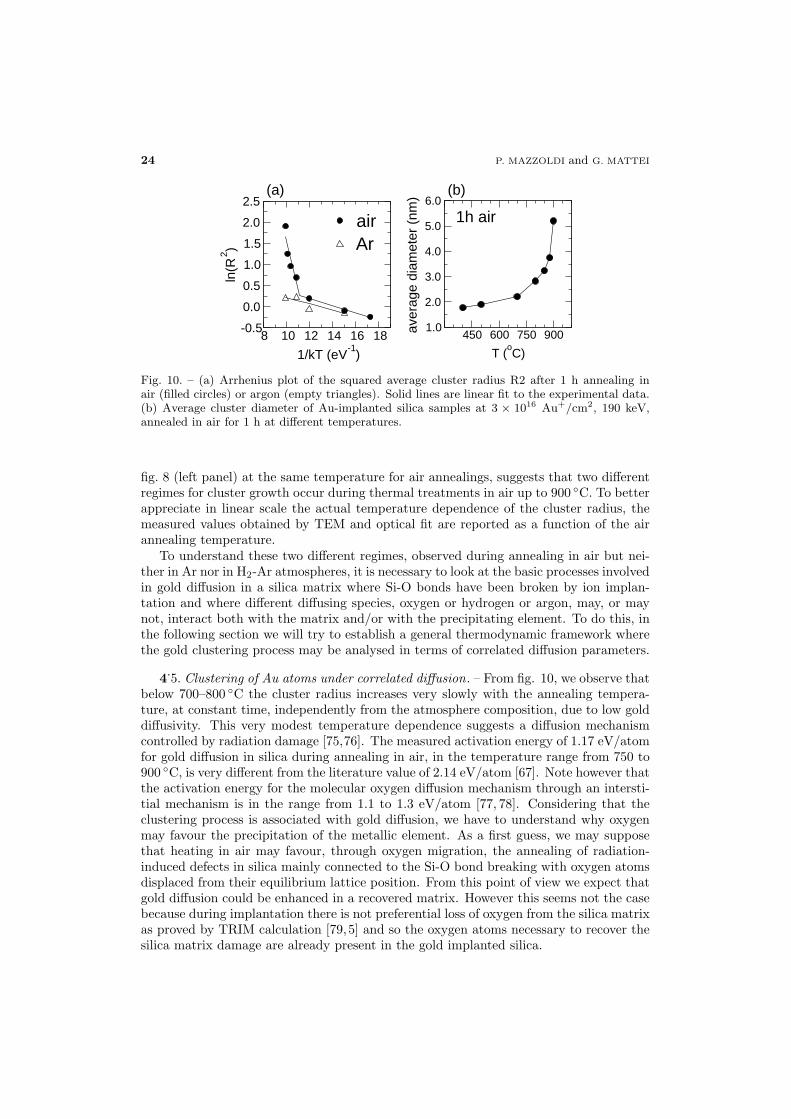
Fig. 10. – (a) Arrhenius plot of the squared average cluster radius R2 after 1 h annealing inair (filled circles) or argon (empty triangles). Solid lines are linear fit to the experimental data.(b) Average cluster diameter of Au-implanted silica samples at 3 × 10¹⁶ Au+/cm2, 190 keV,annealed in air for 1 h at different temperatures.
fig. 8 (left panel) at the same temperature for air annealings, suggests that two differentregimes for cluster growth occur during thermal treatments in air up to 900 ◦C. To betterappreciate in linear scale the actual temperature dependence of the cluster radius, themeasured values obtained by TEM and optical fit are reported as a function of the airannealing temperature.
To understand these two different regimes, observed during annealing in air but nei-ther in Ar nor in H2-Ar atmospheres, it is necessary to look at the basic processes involvedin gold diffusion in a silica matrix where Si-O bonds have been broken by ion implan-tation and where different diffusing species, oxygen or hydrogen or argon, may, or maynot, interact both with the matrix and/or with the precipitating element. To do this, inthe following section we will try to establish a general thermodynamic framework wherethe gold clustering process may be analysed in terms of correlated diffusion parameters.
4.5. Clustering of Au atoms under correlated diffusion. – From fig. 10, we observe that
below 700–800 ◦C the cluster radius increases very slowly with the annealing tempera-ture, at constant time, independently from the atmosphere composition, due to low golddiffusivity. This very modest temperature dependence suggests a diffusion mechanismcontrolled by radiation damage [75,76]. The measured activation energy of 1.17 eV/atomfor gold diffusion in silica during annealing in air, in the temperature range from 750 to900 ◦C, is very different from the literature value of 2.14 eV/atom [67]. Note however thatthe activation energy for the molecular oxygen diffusion mechanism through an intersti-tial mechanism is in the range from 1.1 to 1.3 eV/atom [77, 78]. Considering that theclustering process is associated with gold diffusion, we have to understand why oxygenmay favour the precipitation of the metallic element. As a first guess, we may supposethat heating in air may favour, through oxygen migration, the annealing of radiation-induced defects in silica mainly connected to the Si-O bond breaking with oxygen atomsdisplaced from their equilibrium lattice position. From this point of view we expect thatgold diffusion could be enhanced in a recovered matrix. However this seems not the casebecause during implantation there is not preferential loss of oxygen from the silica matrixas proved by TRIM calculation [79,5] and so the oxygen atoms necessary to recover thesilica matrix damage are already present in the gold implanted silica.
POTENTIALITIES OF ION IMPLANTATION FOR THE SYNTHESIS AND MODIFICATION ETC. 25
Nevertheless, the low Au diffusivity is evidenced in Ar and H2-Ar annealing atmo-spheres also in temperature regime higher than 800 ◦C, where the matrix recovery hasbeen certainly completed [80]: moreover, Rutherford Backscattering Spectrometry (RBS)did not evidence an appreciable modification in the gold concentration profiles. There-fore, to explain the role of oxygen in promoting gold diffusivity we may suggest thatthere is a thermodynamic interaction between oxygen and gold. In the framework ofthe thermodynamics of irreversible process one may say that the chemical potential ofoxygen in the silica matrix depends on both the matrix as well as gold concentration.
The continuity equations for the excess O2 and Au atomic concentration ni and nj
are
∂ni
∂t= Dii
∂2ni
∂x2+Dij
∂2nj
∂x2,(26)
∂nj
∂t= Djj
∂2nj
∂x2+Dji
∂2ni
∂x2,
where subscripts i and j stand for O2 and Au, respectively, D’s are the “diffusion coeffi-cients” which are considered independent of concentration (dilute impurity limit), relatedto the Kelvin-Onsager phenomenological coefficients [68].
Considering now the continuity equation governing the Au0 transport we see that,even if the Djj coefficient is small in low-medium temperature regime (700–900 ◦C),the Dji coefficient may have significant values in the same interval temperature: thisimplies that just the motion of the permeating oxygen drives the Au0 diffusion. In otherwords, the precipitation of the metallic element is induced by the oxygen flux throughthe correlation coefficient Dji. It is not possible to compare the activation energy of thethermodynamic correlation coefficient Dji with literature data because of the generallack of information in the field of correlation coefficients. However, since the diffusionof the permeating oxygen drives the gold movement, it is not surprising to obtain a Dji
coefficient governed by an activation energy quite similar to the one of the interstitiallydiffusing O2 molecule.
In conclusion, the main results of the investigation of the temperature dependenceof the cluster radius under isochronal annealing (1 h) may be summarized as follows:i) annealing in air is more effective in promoting cluster aggregation with respect toreducing or neutral atmosphere; ii) the squared average cluster radius in an Arrheniusplot shows two different regimes upon air annealing, which can be explained by a generalmodel for gold atom diffusion interacting with excess oxygen coming from the externalambient. The clustering regime characterized by an activation energy of 1.17 eV/atom,very different from that appropriate to gold diffusion in silica (2.14 eV/atom), is thenattributed to the thermodynamic correlation coefficient, Dji.
We have thus extended the analysis of the gold clustering problem for annealing in airconsidering annealing time intervals exceeding 1 hour, when coarsening becomes mostprobably the relevant cluster growth mechanism.
4.6. Au nucleation as a function of the annealing time. – In this section we analyze
the kinetics of gold cluster growth in silica matrix under isothermal annealing, to tryto evidence the two growth regimes (i.e. diffusional and coarsening) as a function of theannealing time. For this purpose, fused silica slides were implanted with gold ions at afluence of 4 × 10¹⁶ Au+/cm2 ion dose, i.e. above the threshold for spontaneous colloidprecipitation and at 190 keV energy to obtain a subsurface buried layer of precipitates.
26 P. MAZZOLDI and G. MATTEI
400 500 600 700
0.1
0.2
0.3
0.4
0.5 7 h5 h
3 h2 h
12 h6 h
1 h
0.5 h
as-implanted
Opt
ical
Den
sity
wavelength (nm)
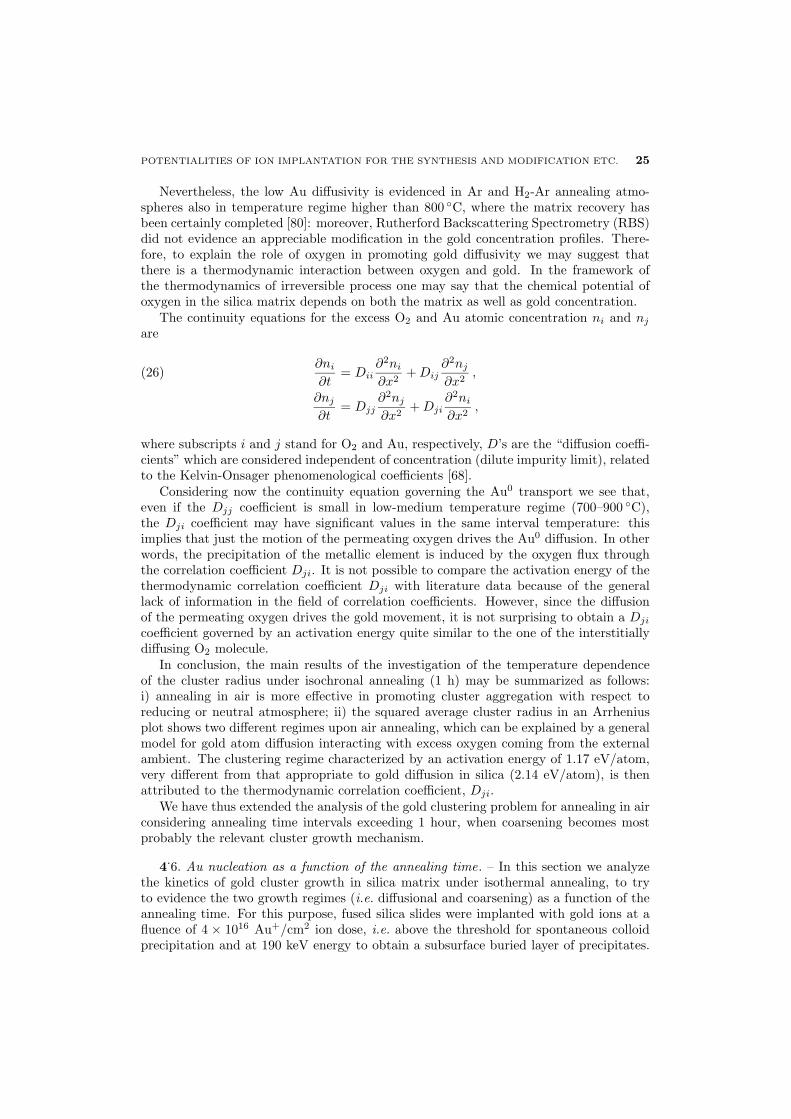
Fig. 11. – Optical absorption spectra of Au-implanted silica samples at 4 × 10¹⁶ Au+/cm2,190 keV, annealed in air at 900 ◦C for different time intervals.
Thus, the implanted samples were annealed in air atmosphere at 900 ◦C for different timeintervals, ranging from 0.5 up to 12 hours. We performed sample annealing in oxidizingatmosphere (air) at 900 ◦C, because these are the most efficient conditions for promotingcluster growth, as demonstrated in the previous subsection. Moreover at 900 ◦C wecan disregard the influence of implantation-induced defects in the matrix which couldinteract both with permeating O2 molecules and with precipitating species, i.e. goldatoms [67,81,82].
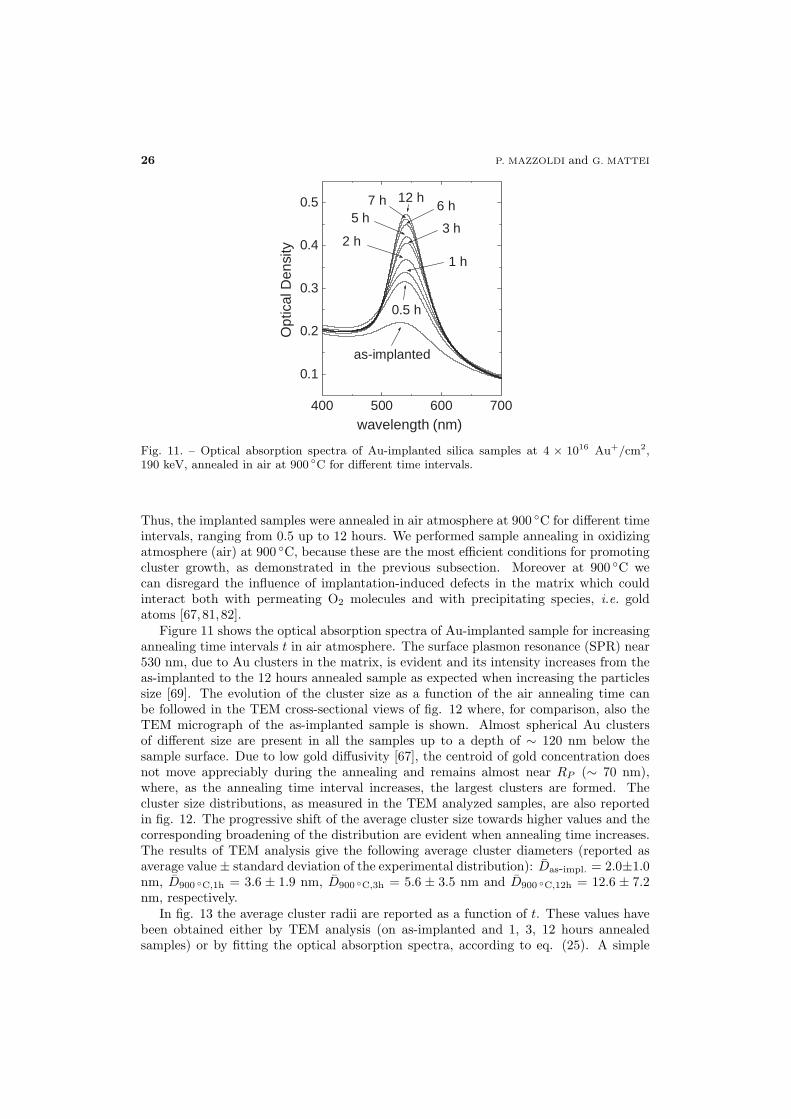
Figure 11 shows the optical absorption spectra of Au-implanted sample for increasingannealing time intervals t in air atmosphere. The surface plasmon resonance (SPR) near530 nm, due to Au clusters in the matrix, is evident and its intensity increases from theas-implanted to the 12 hours annealed sample as expected when increasing the particlessize [69]. The evolution of the cluster size as a function of the air annealing time canbe followed in the TEM cross-sectional views of fig. 12 where, for comparison, also theTEM micrograph of the as-implanted sample is shown. Almost spherical Au clustersof different size are present in all the samples up to a depth of ∼ 120 nm below thesample surface. Due to low gold diffusivity [67], the centroid of gold concentration doesnot move appreciably during the annealing and remains almost near RP (∼ 70 nm),where, as the annealing time interval increases, the largest clusters are formed. Thecluster size distributions, as measured in the TEM analyzed samples, are also reportedin fig. 12. The progressive shift of the average cluster size towards higher values and thecorresponding broadening of the distribution are evident when annealing time increases.The results of TEM analysis give the following average cluster diameters (reported asaverage value ± standard deviation of the experimental distribution): Das-impl. = 2.0±1.0nm, D900 ◦C,1h = 3.6 ± 1.9 nm, D900 ◦C,3h = 5.6 ± 3.5 nm and D900 ◦C,12h = 12.6 ± 7.2nm, respectively.
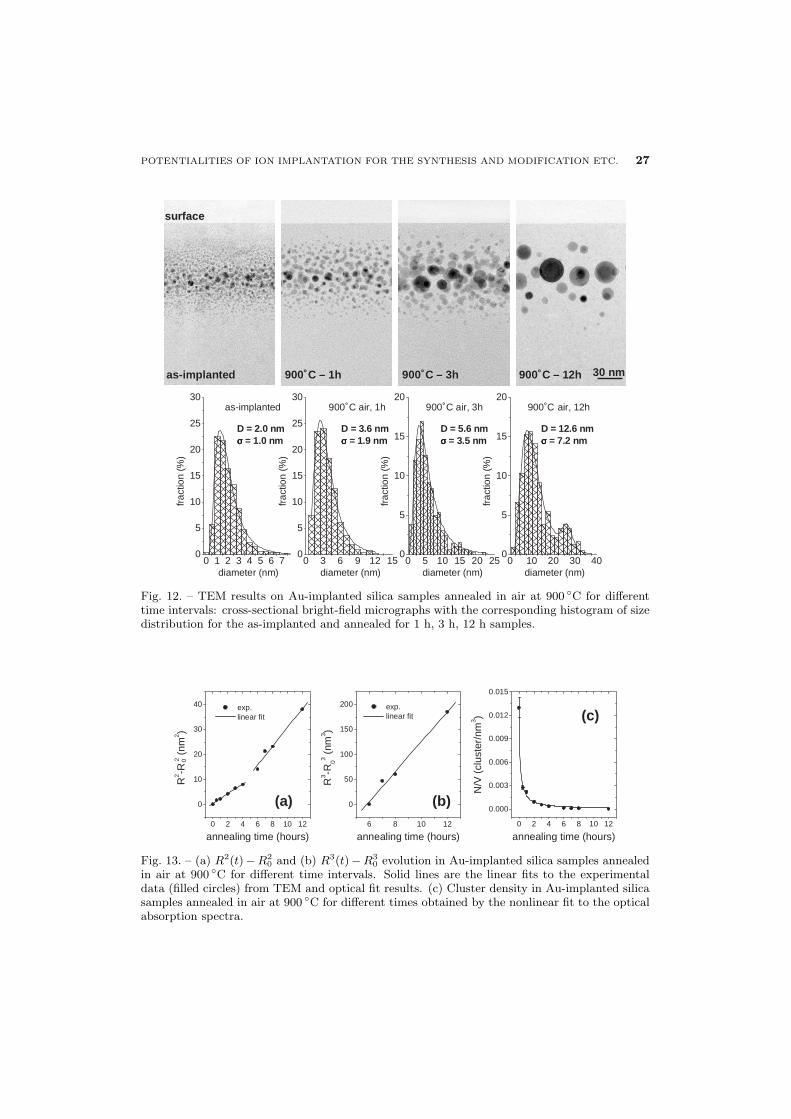
In fig. 13 the average cluster radii are reported as a function of t. These values havebeen obtained either by TEM analysis (on as-implanted and 1, 3, 12 hours annealedsamples) or by fitting the optical absorption spectra, according to eq. (25). A simple
POTENTIALITIES OF ION IMPLANTATION FOR THE SYNTHESIS AND MODIFICATION ETC. 27
0 1 2 3 4 5 6 70
5
10
15
20
25
30as-implanted
D = 2.0 nmσσσσ = 1.0 nm
diameter (nm)
frac
tion
(%)
0 3 6 9 12 150
5
10
15
20
25
30900˚C air, 1h
D = 3.6 nmσσσσ = 1.9 nm
diameter (nm)
frac
tion
(%)
0 5 10 15 20 250
5
10
15
20900˚C air, 3h
D = 5.6 nmσσσσ = 3.5 nm
diameter (nm)
frac
tion
(%)
0 10 20 30 400
5
10
15
20900˚C air, 12h
D = 12.6 nmσσσσ = 7.2 nm
diameter (nm)
frac
tion
(%)
surfacesurface
asas--implantedimplanted 900900˚CC –– 1h1h 900900˚CC –– 3h3h 900900˚CC –– 12h12h 3030 nmnm
Fig. 12. – TEM results on Au-implanted silica samples annealed in air at 900 ◦C for differenttime intervals: cross-sectional bright-field micrographs with the corresponding histogram of sizedistribution for the as-implanted and annealed for 1 h, 3 h, 12 h samples.
0 2 4 6 8 10 12
0
10
20
30
40 exp.linear fit
R2 -R
02(n
m2 )
annealing time (hours)6 8 10 12
0
50
100
150
200 exp.linear fit
R3 -R
03(n
m3 )
annealing time (hours)0 2 4 6 8 10 12
0.000
0.003
0.006
0.009
0.012
0.015
N/V
(clu
ster
/nm
3 )
annealing time (hours)
(a) (b)
(c)
Fig. 13. – (a) R2(t)−R20 and (b) R3(t)−R3
0 evolution in Au-implanted silica samples annealedin air at 900 ◦C for different time intervals. Solid lines are the linear fits to the experimentaldata (filled circles) from TEM and optical fit results. (c) Cluster density in Au-implanted silicasamples annealed in air at 900 ◦C for different times obtained by the nonlinear fit to the opticalabsorption spectra.
28 P. MAZZOLDI and G. MATTEI
inspection of the experimental data reported in fig. 13 suggests that the kinetics ofcluster growth changes with annealing times. To better evidence this point, in fig. 13(a)we report as a function of t the square of the average radius of the growing particles: thereis a linear relation between the two quantities with a change of the slope in the rangebetween 4 and 5 hours. A linear relation between R2 and t is expected when the clustergrowth is only due to the precipitation process of a supersaturated solution. More indetails, the general equation for cluster growth is R2 = R2
0 +KDt , where R(t = 0) = R0,K is the initial degree of supersaturation of the implanted precipitating species, andD thecorresponding diffusion coefficient [83]. The change of the slope in the plot (R2−R2
0) vs.t suggests that the kinetics of cluster growth is modified. Without considering a possiblechange of theD parameter, not easily understandable in long time annealing experiments,the discontinuity may be explained by considering that the coarsening regime occurs, afterthe precipitation stage due to supersaturation, when clustering is permitted over longtimes. In fact, the experimental and calculated (by means of optical absorption spectrumfitting procedure) radius values, corresponding to annealing time intervals of 6, 7, 8, 12hours, well agree with a t1/3 law of growth, as expected in the Ostwald ripening regime:see fig. 13(b). Figure 13(c) shows the cluster density (the number N of Au clusters in thevolume V ) as a function of the annealing times calculated by fitting the optical density(OD) spectra. We observe a strong reduction of the cluster density in the first stage ofthe annealing process, which we attribute to the thermal instability of clusters of smallersize [84]. Such an instability maintains the initial supersaturation condition in the clustergrowth regime, where R ∝ t1/2. At longer annealing time intervals (coarsening regime),the cluster density decreases slowly.
These experimental results prove the occurrence of the transition from a diffusion-limited regime to Ostwald ripening in the kinetics of gold cluster growth. In our experi-mental conditions, the transition occurs for annealing time intervals in the range between4 to 5 hours. The theoretical approach described in subsect. 4
.1, in particular eqs. (14)
and (18), allows to calculate the diffusion coefficient D and the surface tension σ for goldnanoclusters in SiO2 matrix. At this point it must be recalled that no reliable diffusioncoefficient and surface tension data exist in the current literature for Au in SiO2 andthat the former is strongly influenced by the post-implantation annealing atmosphere.Anyway from fig. 13(a), where the quantity R2(t) − R2
0 is plotted as a function of theannealing time interval t, we evaluate, by using eq. (14), D = 2×10⁻¹⁷ cm2/s, at 900 ◦C.We assumed for Cs the average concentration value of Au in the as-implanted sample, asdetermined by Rutherford backscattering, i.e. Cs = 8×10²¹ atoms/cm3. The Ce value isneglected while Cp = 5.9×10²² atoms/cm3, i.e. the atomic density of Au nanoclusters isassumed equal to that of Au bulk. To evaluate σ, the last parameter required is C∞, theequilibrium solute concentration at a plane interface, i.e. the gold concentration at theinterface between a gold flat surface and a flat silica surface. We suggest that in such aboundary interphase, where the gold atoms may interact with the gold surface, the C∞
value should not be too much different from Cp. Here we assume C∞ = Cp, being awarethat this is obviously an upper limit for C∞.
The slopes of the linear fit in figs. 13(a,b) (numerical values of 2 × 10⁻¹⁴ cm2/h and28×10−21 cm3/h, respectively), together with eqs. (14) and (18), allow us to estimatethe gold cluster surface tension σ. The obtained value, 4× 10⁻⁴ J/cm2, is slightly largerthan the literature data for gold surface tension [84].
Before concluding this section, we have to critically examine the numerical valuesattributed to the Cs parameter. Here we must underline that not all the implanted atomstake part to the clustering process at the same time for at least two reasons: first of all,
POTENTIALITIES OF ION IMPLANTATION FOR THE SYNTHESIS AND MODIFICATION ETC. 29
the initial gold distribution is not uniform and, as a second point, a fraction of atoms arealready trapped in small clusters, that dissolve at higher temperatures. In other words,the previous evaluation of σ was based on a Cs value that is certainly overestimated by theaverage value of Au implanted concentration. In order to have a better estimate of Cs wemay consider the density of clustered atoms, in the early stage of the process, that may beevaluated on the basis of the mean radius value and cluster density as reported in fig. 13.It is worth stressing that the variation of two orders of magnitude of the cluster density inthe first stage of the process indicates that the supersaturation degree is sustained by thegold atoms released by the smallest clusters, which at 900 ◦C can be thermodynamicallyunstable or even melted well below the bulk melting temperature (1064 ◦C) due to thethermodynamic size effect [84]. This fact determines an almost constant supersaturationdegree, which can be estimated as Cs/Cp = 0.05, to be compared with a value of 0.13if Cs takes the average value of the Au implanted concentration. This more “realistic”evaluation of the supersaturation concentration degree, that is the crucial parameter ofthe whole process, leads to the values of 5 × 10⁻¹⁷ cm2/s and 1.5 × 10⁻⁴ J/cm2 of Dand σ, respectively. We note that this value of σ is consistent with the measured goldsurface tension value of a “free surface” [84]. Moreover the resulting 3×10⁻⁷ cm valueof the capillarity length α justifies the use of eq. (16) and the integration of eq. (18)in the linearized gradient approximation for R > 3 nm: this is consistent with the datareported in fig. 13, where the transition from a diffusional to a coarsening stage, asdescribed by eq. (17), takes place for annealing times t > 4 h when R > 3 nm. Afinal remark is worth making about the approximation of considering the time evolutionof the “average” cluster radius and not of the whole size distribution in the analysis ofthe clustering process. Indeed, such an approach does not allow to follow the effective,locally developing, growth stage of the clusters and to make a clear distinction betweenthe two regimes in the kinetics of growth. To clarify this point, one may say that whenthe annealing time interval is shorter than 4 h, a fraction of the already formed clustersmay grow following the Ostwald ripening mechanism while, for times exceeding 5 h someof the clusters may grow following the diffusion-limited mechanism.
In conclusion, we have investigated the clustering process of gold atoms, implantedin silica, during annealing at 900 ◦C in air (oxidizing) atmosphere in a time domainbetween 0.5 and 12 hours. By analyzing the growth of the average cluster radius asa function of time, we observed two distinct growth regimes, namely R ∼ t1/2 andR ∼ t1/3, which correspond to growth due to precipitation of supersatured solution andcoarsening, respectively. By looking at the coefficients of the appropriate time scalinglaws (eqs. (14) and (18)), we obtained a value of the surface tension of gold nanoparticlesin silica which agrees with literature data for unsupported gold clusters, giving a checkof internal consistency of the analysis and approximations made.
4.7. Au implantation in polymers. – Nanocomposite materials formed of metal nano-
particles dispersed in polymers are a topic of materials science with increasing interestsince these materials show excellent mechanical, gas sensing, optical, magnetic and trans-port properties [85,86]. As ion implantation is a well-assessed technique for the synthesisof dielectric-based nanocomposites, recently it has been applied to obtain polymer-basednanocomposites [87, 88]. The main drawback of the technique is that ion irradiation in-duces remarkable damage in the polymeric structure with the consequent changes in itsphysical properties [88-91]. This prompted for the use of radiation-resistant polymers,like polyimides [92]. Nevertheless, the issue of nanocluster nucleation in polyimides is notyet completely understood. Indeed, Kobayashi et al. [93] showed the growth of metal-
30 P. MAZZOLDI and G. MATTEI
lic nanoparticles in Ag-, Cu- and Pd-implanted polyimides, whereas in Fe-, W- and K-implanted samples, the nucleation was not attained even at high implantation doses.
With the aim of giving a further contribution to the understanding of this field we haveinvestigated the gold precipitation process induced by ion implantation in a polyimidematrix. We focused on gold for two main reasons: i) its chemical inertness, which allowsto decouple cluster nucleation from the chemical interaction of the implanted species withthe matrix components; ii) the large optical absorption cross-section of gold nanoclus-ters (surface plasmon resonance) in the VIS region at wavelengths larger than the opti-cal absorption edge of the chosen polyimide. We have investigated the nanostructural,compositional and optical properties of Au- pyromellitic dianhydride-4,4′ oxydianiline(PMDA-ODA) polyimide thin films prepared by implanting different doses of Au+ ionsat the same energy. About 100 nm thick films of PMDA-ODA polyimide were depositedby glow discharge vapour deposition polymerization (GDVDP) on pure silica matrix(Herasil 1 by Haereaus). This is a very recently developed method [94] for the depositionof very thin polyimide coatings, alternative to the other better known deposition methodssuch as spinning, vapour deposition polymerization and ionized cluster beam deposition.The film thickness measured by Atomic Force Microscopy after curing was 100 ± 2 nm.These films were then implanted at different doses (5, 10 and 50 × 1015 Au+/cm2) at abeam energy of 100 keV, which corresponds to a projected range of about 60 nm and astraggling of 9 nm as simulated by SRIM. In order to reduce the heating of the polymerfilms during the implantation, the sample holder was water-cooled and the ion currentdensity was kept at about 0.3 µA/cm2. The nucleation and growth of gold nanoparticlesin the sample implanted with 5×10¹⁶ Au+/cm2 has been investigated by cross-sectionaltransmission electron microscopy (TEM). The bright-field TEM micrograph of the sam-ple, in fig. 14(a), shows spherical Au nanoparticles dispersed in a 40 nm thick layer,embedded between two nanoparticle-free layers: a 10 nm thick surface layer and a bot-tom layer of about 30 nm. The particle size distribution (fig. 14(b)) has an average valueof 2.3 nm and a standard deviation of 1.3 nm. A depth profile composition by energydispersive X-ray microanalysis (EDS) evidenced that the C content of the surface layer ishigher with respect to the rest of the film, according to literature data [95,96]. This resultallows to obtain a more realistic representation of the polymer composition around theclusters: indeed, the actual C:H ratio in this region could be more similar to the nominal2:1 value considering that the C-rich surface layer partially compensates the measured C-excess, which refers to the whole structure. The TEM data have been used to simulate inthe frame of the Mie theory and Maxwell-Garnett effective medium approximation [40],the optical absorption spectra of the sample implanted with 5 × 10¹⁶ Au+/cm2. Theresults are reported in fig. 14(c). In the first model used to describe the nanocompositeabsorption properties spherical Au clusters with size 2.3 nm are surrounded by a matrixwith refractive index of about 1.6, typical of the aromatic polyimides (this assumptioncan be justified by the above analysis on the local polymer composition near the Auclusters). The simulation, in which the experimental bulk dielectric function of gold hasbeen size-corrected according to ref. [40], gives a narrow resonance centered at 550 nminstead of a large band centered at 560 nm. Even considering that the matrix couldhave a larger refraction index due to implantation damage [97], the simulation does notreproduce the measured spectrum because the SPR simply shifts to larger wavelengthswithout any FWHM broadening. We consider a second model in which the Au clusteris surrounded by a very thin carbon layer, forming a core-shell particle dispersed in apolyimide matrix. Similar approach was applied by Stepanov [88] in the study of theoptical properties of Ag/polymethylmethacrylate nanocomposite obtained also by ion
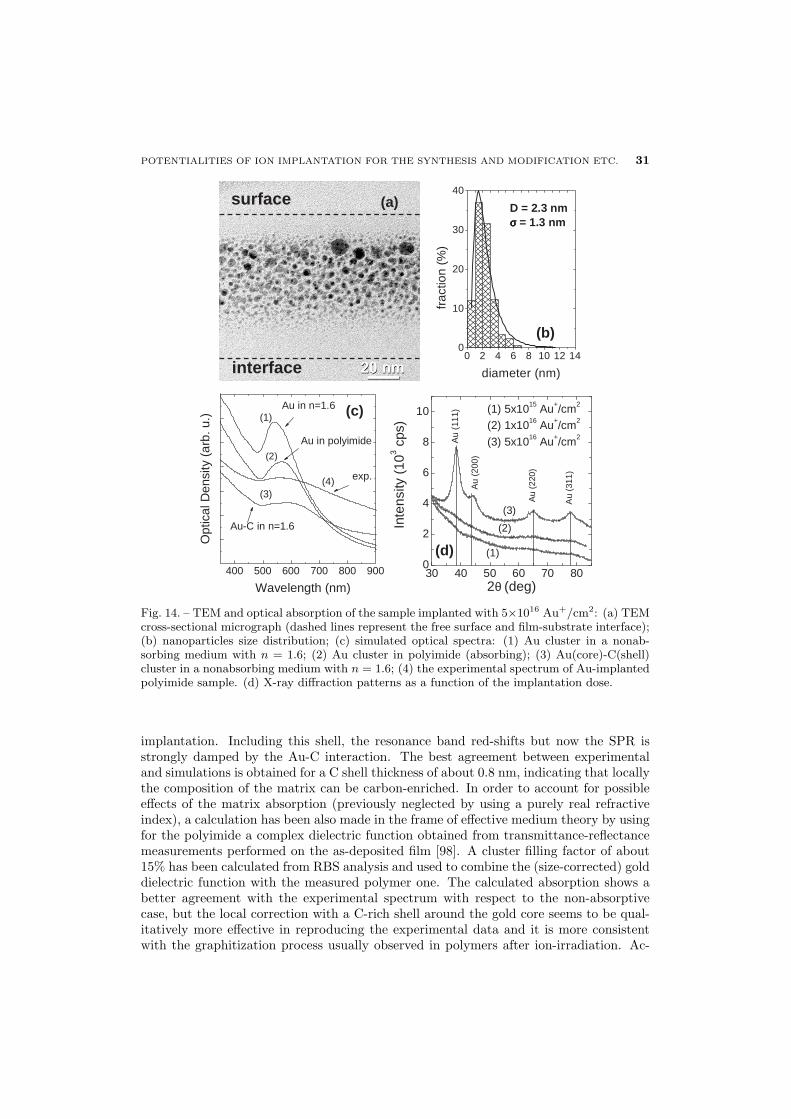
POTENTIALITIES OF ION IMPLANTATION FOR THE SYNTHESIS AND MODIFICATION ETC. 31
400 500 600 700 800 900
Au in polyimide
Au in n=1.6
exp.
Au-C in n=1.6
Opt
ical
Den
sity
(arb
.u.)
Wavelength (nm)
(3)(4)
(2)
(1)
0 2 4 6 8 10 12 140
10
20
30
40
D = 2.3 nmσσσσ = 1.3 nm
frac
tion
(%)
diameter (nm)
(a)
30 40 50 60 70 800
2
4
6
8
10 (1) 5x10¹⁵ Au+/cm2
(2) 1x10¹⁶ Au+/cm2
(3) 5x10¹⁶ Au+/cm2
(1)
(3)
(2)
Au
(200
)
Au
(311
)
Au
(220
)
Inte
nsity
(103
cps)
2θ (deg)
Au
(111
)
surfacesurface
interfaceinterface
(b)
(c)
(d)
Fig. 14. – TEM and optical absorption of the sample implanted with 5×10¹⁶ Au+/cm2: (a) TEMcross-sectional micrograph (dashed lines represent the free surface and film-substrate interface);(b) nanoparticles size distribution; (c) simulated optical spectra: (1) Au cluster in a nonab-sorbing medium with n = 1.6; (2) Au cluster in polyimide (absorbing); (3) Au(core)-C(shell)cluster in a nonabsorbing medium with n = 1.6; (4) the experimental spectrum of Au-implantedpolyimide sample. (d) X-ray diffraction patterns as a function of the implantation dose.
implantation. Including this shell, the resonance band red-shifts but now the SPR isstrongly damped by the Au-C interaction. The best agreement between experimentaland simulations is obtained for a C shell thickness of about 0.8 nm, indicating that locallythe composition of the matrix can be carbon-enriched. In order to account for possibleeffects of the matrix absorption (previously neglected by using a purely real refractiveindex), a calculation has been also made in the frame of effective medium theory by usingfor the polyimide a complex dielectric function obtained from transmittance-reflectancemeasurements performed on the as-deposited film [98]. A cluster filling factor of about15% has been calculated from RBS analysis and used to combine the (size-corrected) golddielectric function with the measured polymer one. The calculated absorption shows abetter agreement with the experimental spectrum with respect to the non-absorptivecase, but the local correction with a C-rich shell around the gold core seems to be qual-itatively more effective in reproducing the experimental data and it is more consistentwith the graphitization process usually observed in polymers after ion-irradiation. Ac-
32 P. MAZZOLDI and G. MATTEI
tually, this carbon shell should be hardly perceptible in the TEM image due to the verylow contrast with the polymer matrix.
In summary, gold-PMDA-ODA nanocomposites have being obtained by ion implan-tation. The threshold implantation dose for nanoparticle growth is around 5 × 10¹⁶
Au+/cm2 for 100 keV Au implantation. The nanostructure of this film consists of a gold-nanoparticle-containing layer sandwiched between two cluster-free layers, the 15 nm toplayer being carbon-richer. Optical absorption spectra simulations suggest that nanoparti-cles are covered by a thin carbon layer forming a core-shell system of particles dispersed ina polyimide-like matrix. The combination of glow discharge vapour deposition polymer-ization technique, that allows depositing nanometric thin films, with ion implantation,suitable for doping materials with a large number of elements, could be a promisingmethod to obtain new polymer-based nanostructured films with magnetic, optical, rhe-ological, sensoring and electronic properties. Indeed, the optical gas sensing features ofvirgin polyimide thin film deposited by glow discharge vapor deposition polymerisationand of gold-implanted films have been recently studied by using optical absorption andsurface plasmon resonance transduction techniques [99].
Optical absorption measurements were carried out in the presence of mixtures con-taining vapors of methanol, ethanol and gases as NH3 in dry air onto virgin and gold-implanted films. Experimental results have shown that the virgin polyimide film doesnot present any variation in the absorption curves in the presence of alcohol vapors butwe found a good response in case of the film implanted with a dose 5× 10¹⁶ ions/cm2 inwhich nanoparticles are present. In this case, the interaction mechanism could be relatedto the modification of the optical properties of the polymer and by change of the opticalabsorption spectrum of the composite by the modification of the surface plasmon reso-nance of the nanoparticles. This hypothesis is strengthened by the shift in the SPR anglereflectivity of the film, obtained in the presence of alcohol vapors that can be related tothe changes of real part of n and/or in the film thickness. But we cannot exclude thatgold nanoparticles contribute strongly to the sensing activity thanks to their catalyticproperties. Further investigations are in progress in order to increase the performance ofthe sensing layer in terms of sensitivity, selectivity and stability.
5. – Ion beam direct synthesis: bimetallic clusters
As a general rule, the criterion valid for bulk systems of miscibility of the two elementsas a constraint for alloy formation is not so stringent in the case of nanoclusters. Thisis due to the incomplete onset of the bulk properties triggered by the large number ofatoms at the surface, that makes a cluster more similar to a molecular than to a massivesystem [100]. This leads to new possible alloy phases, which may be thermodynamicallyunfavoured in the bulk. In the case of noble-metal–based systems (Au-Cu, Au-Ag, Pd-Ag and Pd-Cu) perfect miscibility is expected from the bulk phase diagrams and in factsequentially as-implanted samples exhibit direct alloying [24,101,49]. For a more detaileddescription of the nanostructure obtained by noble-metal sequential ion implantation insilica see ref. [25]. On the contrary, systems like Co-Cu or Au-Fe which are not misciblein the bulk showed nano-alloy formation after sequentially implantation in silica. Wenow briefly review some of the most relevant results obtained by the Padova group onthese systems as summarized in table III.
As shown in the previous sections, in the case of noble-metal clusters the surfaceplasmon resonance (SPR) in the visible range is a clear fingerprint of nanoparticles for-mation [40]. Similarly, for noble-metals alloy the SPR resonance is located in between
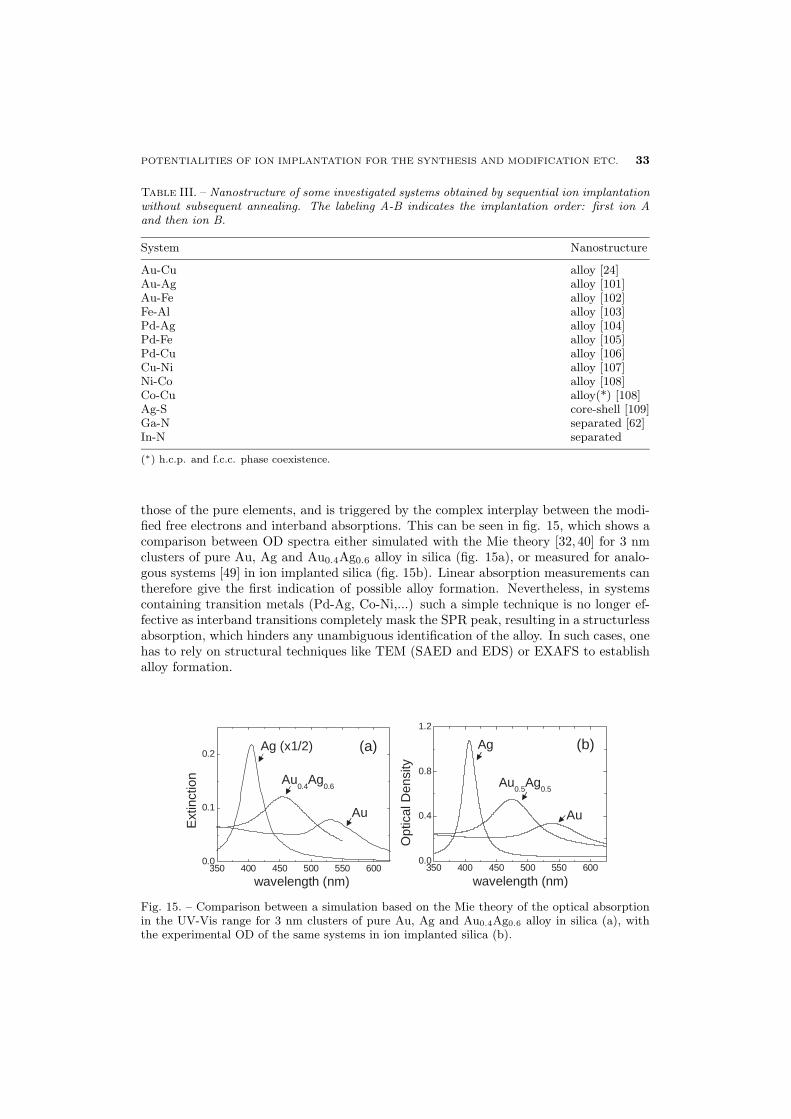
POTENTIALITIES OF ION IMPLANTATION FOR THE SYNTHESIS AND MODIFICATION ETC. 33
Table III. – Nanostructure of some investigated systems obtained by sequential ion implantationwithout subsequent annealing. The labeling A-B indicates the implantation order: first ion Aand then ion B.
System Nanostructure
Au-Cu alloy [24]Au-Ag alloy [101]Au-Fe alloy [102]Fe-Al alloy [103]Pd-Ag alloy [104]Pd-Fe alloy [105]Pd-Cu alloy [106]Cu-Ni alloy [107]Ni-Co alloy [108]Co-Cu alloy(*) [108]Ag-S core-shell [109]Ga-N separated [62]In-N separated
(∗) h.c.p. and f.c.c. phase coexistence.
those of the pure elements, and is triggered by the complex interplay between the modi-fied free electrons and interband absorptions. This can be seen in fig. 15, which shows acomparison between OD spectra either simulated with the Mie theory [32, 40] for 3 nmclusters of pure Au, Ag and Au0.4Ag0.6 alloy in silica (fig. 15a), or measured for analo-gous systems [49] in ion implanted silica (fig. 15b). Linear absorption measurements cantherefore give the first indication of possible alloy formation. Nevertheless, in systemscontaining transition metals (Pd-Ag, Co-Ni,...) such a simple technique is no longer ef-fective as interband transitions completely mask the SPR peak, resulting in a structurlessabsorption, which hinders any unambiguous identification of the alloy. In such cases, onehas to rely on structural techniques like TEM (SAED and EDS) or EXAFS to establishalloy formation.
350 400 450 500 550 6000.0
0.4
0.8
1.2
wavelength (nm)
(b)Ag
Au
Au0.5
Ag0.5
Opt
ical
Den
sity
wavelength (nm)350 400 450 500 550 600
0.0
0.1
0.2(a)
Au
Au0.4
Ag0.6
Ag (x1/2)
Ext
inct
ion
Fig. 15. – Comparison between a simulation based on the Mie theory of the optical absorptionin the UV-Vis range for 3 nm clusters of pure Au, Ag and Au0.4Ag0.6 alloy in silica (a), withthe experimental OD of the same systems in ion implanted silica (b).
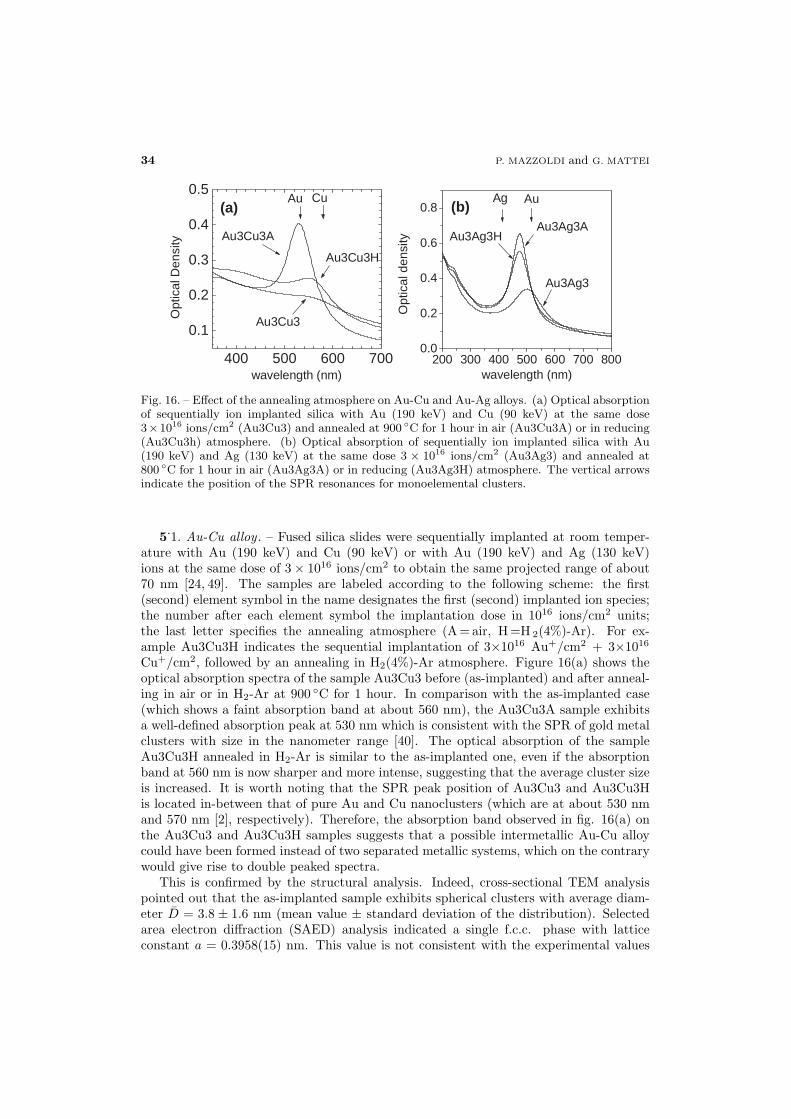
34 P. MAZZOLDI and G. MATTEI
400 500 600 700
0.1
0.2
0.3
0.4
0.5CuAu
Au3Cu3A
Au3Cu3
Au3Cu3H
Opt
ical
Den
sity
wavelength (nm)200 300 400 500 600 700 800
0.0
0.2
0.4
0.6
0.8
Au3Ag3
Au3Ag3HAu3Ag3A
Opt
ical
dens
ity
wavelength (nm)
Ag Au(a) (b)
Fig. 16. – Effect of the annealing atmosphere on Au-Cu and Au-Ag alloys. (a) Optical absorptionof sequentially ion implanted silica with Au (190 keV) and Cu (90 keV) at the same dose3×1016 ions/cm2 (Au3Cu3) and annealed at 900 ◦C for 1 hour in air (Au3Cu3A) or in reducing(Au3Cu3h) atmosphere. (b) Optical absorption of sequentially ion implanted silica with Au(190 keV) and Ag (130 keV) at the same dose 3 × 10¹⁶ ions/cm2 (Au3Ag3) and annealed at800 ◦C for 1 hour in air (Au3Ag3A) or in reducing (Au3Ag3H) atmosphere. The vertical arrowsindicate the position of the SPR resonances for monoelemental clusters.
5.1. Au-Cu alloy . – Fused silica slides were sequentially implanted at room temper-
ature with Au (190 keV) and Cu (90 keV) or with Au (190 keV) and Ag (130 keV)ions at the same dose of 3 × 10¹⁶ ions/cm2 to obtain the same projected range of about70 nm [24, 49]. The samples are labeled according to the following scheme: the first(second) element symbol in the name designates the first (second) implanted ion species;the number after each element symbol the implantation dose in 1016 ions/cm2 units;the last letter specifies the annealing atmosphere (A = air, H =H 2(4%)-Ar). For ex-ample Au3Cu3H indicates the sequential implantation of 3×10¹⁶ Au+/cm2 + 3×10¹⁶
Cu+/cm2, followed by an annealing in H2(4%)-Ar atmosphere. Figure 16(a) shows theoptical absorption spectra of the sample Au3Cu3 before (as-implanted) and after anneal-ing in air or in H2-Ar at 900 ◦C for 1 hour. In comparison with the as-implanted case(which shows a faint absorption band at about 560 nm), the Au3Cu3A sample exhibitsa well-defined absorption peak at 530 nm which is consistent with the SPR of gold metalclusters with size in the nanometer range [40]. The optical absorption of the sampleAu3Cu3H annealed in H2-Ar is similar to the as-implanted one, even if the absorptionband at 560 nm is now sharper and more intense, suggesting that the average cluster sizeis increased. It is worth noting that the SPR peak position of Au3Cu3 and Au3Cu3His located in-between that of pure Au and Cu nanoclusters (which are at about 530 nmand 570 nm [2], respectively). Therefore, the absorption band observed in fig. 16(a) onthe Au3Cu3 and Au3Cu3H samples suggests that a possible intermetallic Au-Cu alloycould have been formed instead of two separated metallic systems, which on the contrarywould give rise to double peaked spectra.
This is confirmed by the structural analysis. Indeed, cross-sectional TEM analysispointed out that the as-implanted sample exhibits spherical clusters with average diam-eter D = 3.8 ± 1.6 nm (mean value ± standard deviation of the distribution). Selectedarea electron diffraction (SAED) analysis indicated a single f.c.c. phase with latticeconstant a = 0.3958(15) nm. This value is not consistent with the experimental values
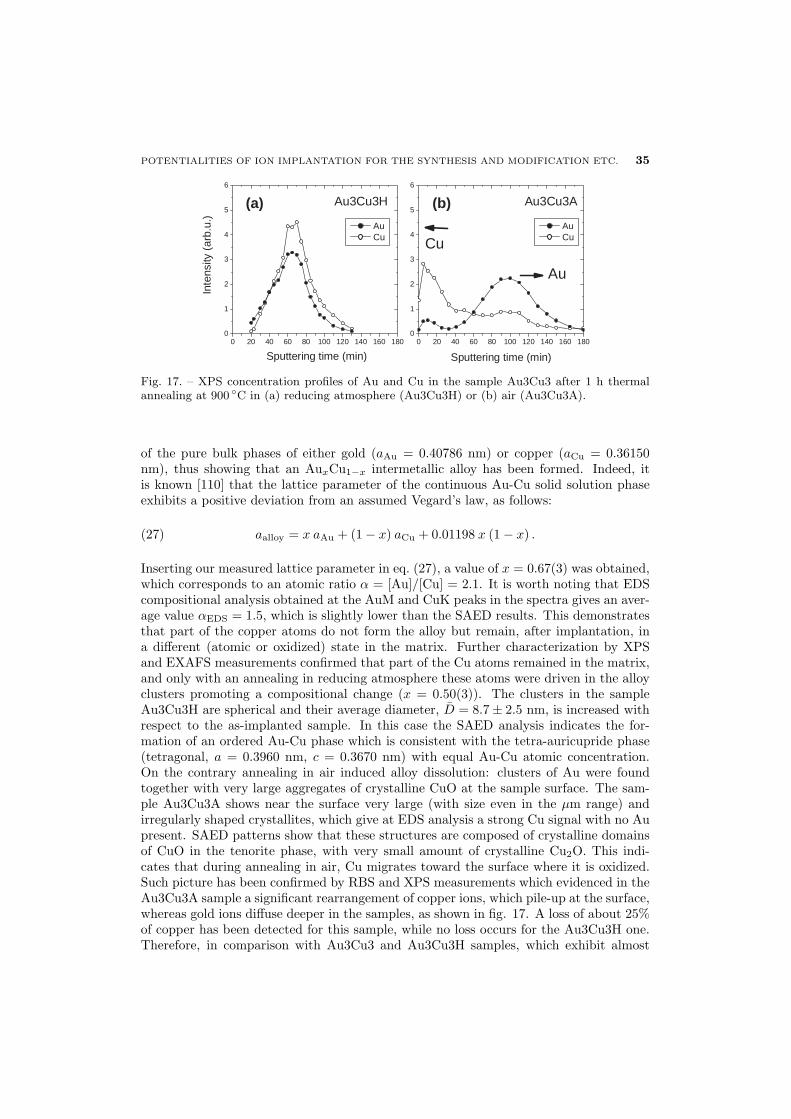
POTENTIALITIES OF ION IMPLANTATION FOR THE SYNTHESIS AND MODIFICATION ETC. 35
0 20 40 60 80 100 120 140 160 1800
1
2
3
4
5
6
0 20 40 60 80 100 120 140 160 1800
1
2
3
4
5
6
Cu
Au
AuCu
Au3Cu3H
Sputtering time (min)
AuCu
Inte
nsity
(arb
.u.)
Au3Cu3A
Sputtering time (min)
(a) (b)
Fig. 17. – XPS concentration profiles of Au and Cu in the sample Au3Cu3 after 1 h thermalannealing at 900 ◦C in (a) reducing atmosphere (Au3Cu3H) or (b) air (Au3Cu3A).
of the pure bulk phases of either gold (aAu = 0.40786 nm) or copper (aCu = 0.36150nm), thus showing that an AuxCu1−x intermetallic alloy has been formed. Indeed, itis known [110] that the lattice parameter of the continuous Au-Cu solid solution phaseexhibits a positive deviation from an assumed Vegard’s law, as follows:
aalloy = x aAu + (1 − x) aCu + 0.01198 x (1 − x) .(27)
Inserting our measured lattice parameter in eq. (27), a value of x = 0.67(3) was obtained,which corresponds to an atomic ratio α = [Au]/[Cu] = 2.1. It is worth noting that EDScompositional analysis obtained at the AuM and CuK peaks in the spectra gives an aver-age value αEDS = 1.5, which is slightly lower than the SAED results. This demonstratesthat part of the copper atoms do not form the alloy but remain, after implantation, ina different (atomic or oxidized) state in the matrix. Further characterization by XPSand EXAFS measurements confirmed that part of the Cu atoms remained in the matrix,and only with an annealing in reducing atmosphere these atoms were driven in the alloyclusters promoting a compositional change (x = 0.50(3)). The clusters in the sampleAu3Cu3H are spherical and their average diameter, D = 8.7 ± 2.5 nm, is increased withrespect to the as-implanted sample. In this case the SAED analysis indicates the for-mation of an ordered Au-Cu phase which is consistent with the tetra-auricupride phase(tetragonal, a = 0.3960 nm, c = 0.3670 nm) with equal Au-Cu atomic concentration.On the contrary annealing in air induced alloy dissolution: clusters of Au were foundtogether with very large aggregates of crystalline CuO at the sample surface. The sam-ple Au3Cu3A shows near the surface very large (with size even in the µm range) andirregularly shaped crystallites, which give at EDS analysis a strong Cu signal with no Aupresent. SAED patterns show that these structures are composed of crystalline domainsof CuO in the tenorite phase, with very small amount of crystalline Cu2O. This indi-cates that during annealing in air, Cu migrates toward the surface where it is oxidized.Such picture has been confirmed by RBS and XPS measurements which evidenced in theAu3Cu3A sample a significant rearrangement of copper ions, which pile-up at the surface,whereas gold ions diffuse deeper in the samples, as shown in fig. 17. A loss of about 25%of copper has been detected for this sample, while no loss occurs for the Au3Cu3H one.Therefore, in comparison with Au3Cu3 and Au3Cu3H samples, which exhibit almost
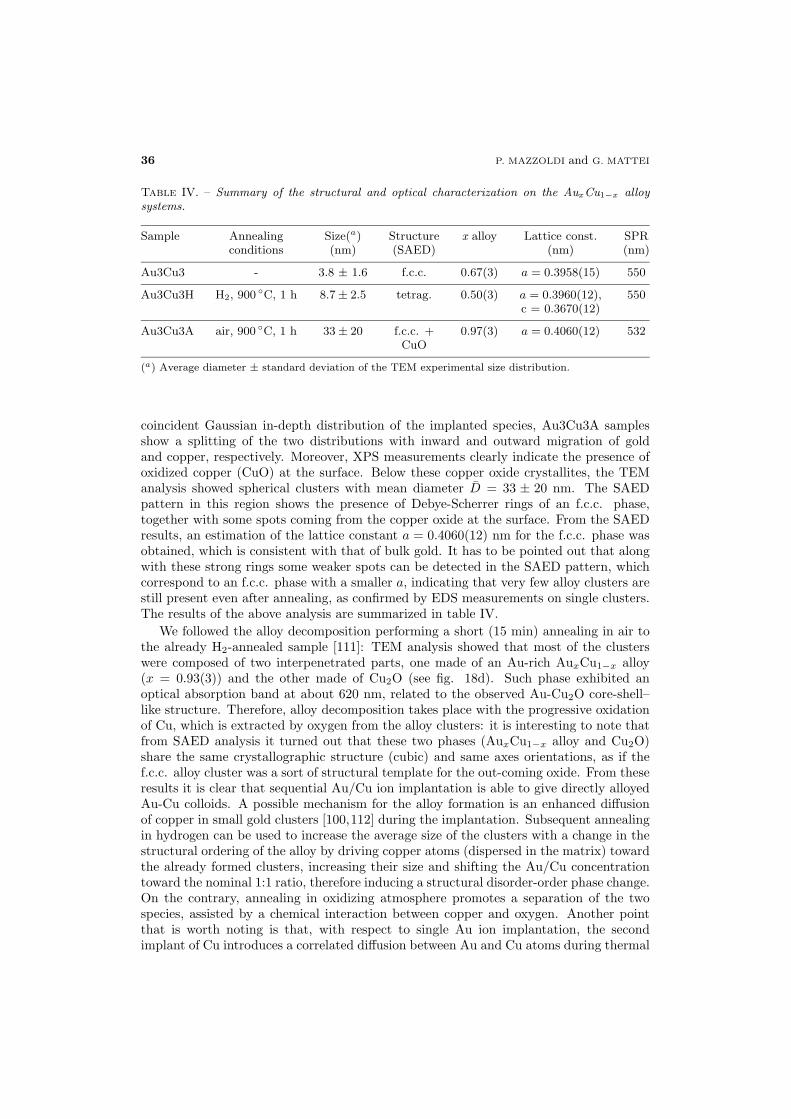
36 P. MAZZOLDI and G. MATTEI
Table IV. – Summary of the structural and optical characterization on the AuxCu1−x alloysystems.
Sample Annealing Size(a) Structure x alloy Lattice const. SPRconditions (nm) (SAED) (nm) (nm)
Au3Cu3 - 3.8 ± 1.6 f.c.c. 0.67(3) a = 0.3958(15) 550
Au3Cu3H H2, 900◦C, 1 h 8.7± 2.5 tetrag. 0.50(3) a = 0.3960(12), 550
c = 0.3670(12)
Au3Cu3A air, 900 ◦C, 1 h 33± 20 f.c.c. + 0.97(3) a = 0.4060(12) 532CuO
(a) Average diameter ± standard deviation of the TEM experimental size distribution.
coincident Gaussian in-depth distribution of the implanted species, Au3Cu3A samplesshow a splitting of the two distributions with inward and outward migration of goldand copper, respectively. Moreover, XPS measurements clearly indicate the presence ofoxidized copper (CuO) at the surface. Below these copper oxide crystallites, the TEManalysis showed spherical clusters with mean diameter D = 33 ± 20 nm. The SAEDpattern in this region shows the presence of Debye-Scherrer rings of an f.c.c. phase,together with some spots coming from the copper oxide at the surface. From the SAEDresults, an estimation of the lattice constant a = 0.4060(12) nm for the f.c.c. phase wasobtained, which is consistent with that of bulk gold. It has to be pointed out that alongwith these strong rings some weaker spots can be detected in the SAED pattern, whichcorrespond to an f.c.c. phase with a smaller a, indicating that very few alloy clusters arestill present even after annealing, as confirmed by EDS measurements on single clusters.The results of the above analysis are summarized in table IV.
We followed the alloy decomposition performing a short (15 min) annealing in air tothe already H2-annealed sample [111]: TEM analysis showed that most of the clusterswere composed of two interpenetrated parts, one made of an Au-rich AuxCu1−x alloy(x = 0.93(3)) and the other made of Cu2O (see fig. 18d). Such phase exhibited anoptical absorption band at about 620 nm, related to the observed Au-Cu2O core-shell–like structure. Therefore, alloy decomposition takes place with the progressive oxidationof Cu, which is extracted by oxygen from the alloy clusters: it is interesting to note thatfrom SAED analysis it turned out that these two phases (AuxCu1−x alloy and Cu2O)share the same crystallographic structure (cubic) and same axes orientations, as if thef.c.c. alloy cluster was a sort of structural template for the out-coming oxide. From theseresults it is clear that sequential Au/Cu ion implantation is able to give directly alloyedAu-Cu colloids. A possible mechanism for the alloy formation is an enhanced diffusionof copper in small gold clusters [100,112] during the implantation. Subsequent annealingin hydrogen can be used to increase the average size of the clusters with a change in thestructural ordering of the alloy by driving copper atoms (dispersed in the matrix) towardthe already formed clusters, increasing their size and shifting the Au/Cu concentrationtoward the nominal 1:1 ratio, therefore inducing a structural disorder-order phase change.On the contrary, annealing in oxidizing atmosphere promotes a separation of the twospecies, assisted by a chemical interaction between copper and oxygen. Another pointthat is worth noting is that, with respect to single Au ion implantation, the secondimplant of Cu introduces a correlated diffusion between Au and Cu atoms during thermal
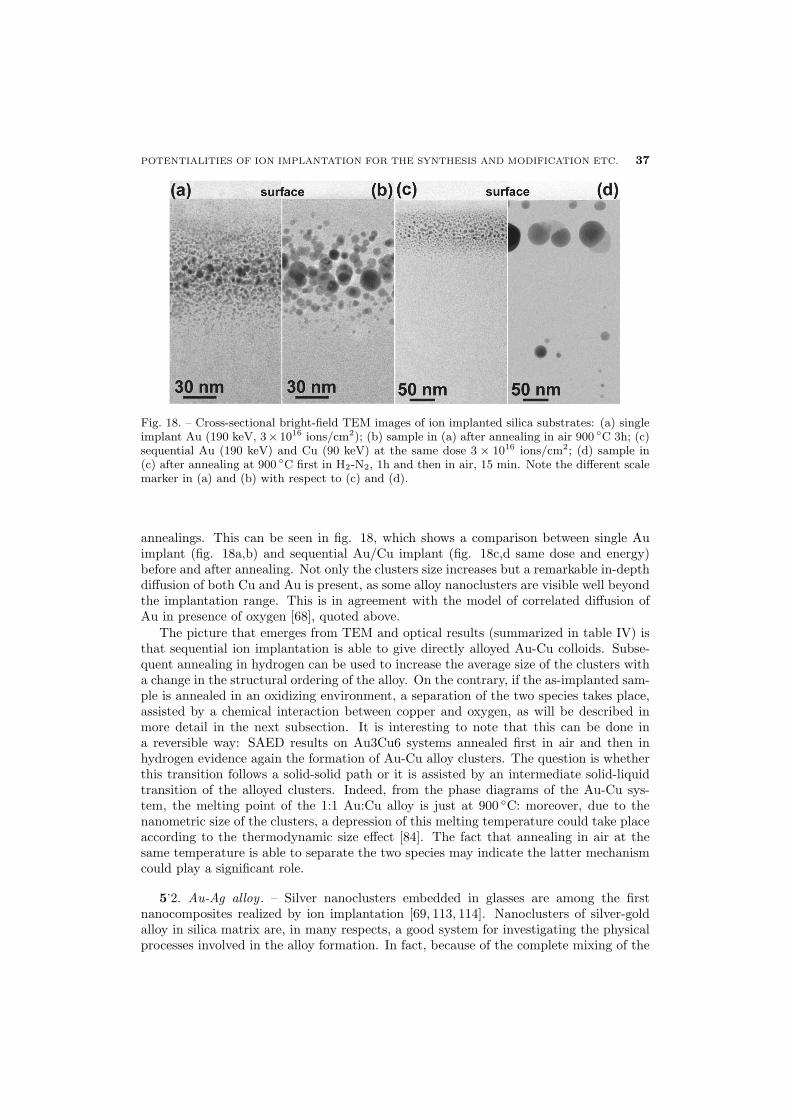
POTENTIALITIES OF ION IMPLANTATION FOR THE SYNTHESIS AND MODIFICATION ETC. 37
Fig. 18. – Cross-sectional bright-field TEM images of ion implanted silica substrates: (a) singleimplant Au (190 keV, 3× 10¹⁶ ions/cm2); (b) sample in (a) after annealing in air 900 ◦C 3h; (c)sequential Au (190 keV) and Cu (90 keV) at the same dose 3 × 10¹⁶ ions/cm2; (d) sample in(c) after annealing at 900 ◦C first in H2-N2, 1h and then in air, 15 min. Note the different scalemarker in (a) and (b) with respect to (c) and (d).
annealings. This can be seen in fig. 18, which shows a comparison between single Auimplant (fig. 18a,b) and sequential Au/Cu implant (fig. 18c,d same dose and energy)before and after annealing. Not only the clusters size increases but a remarkable in-depthdiffusion of both Cu and Au is present, as some alloy nanoclusters are visible well beyondthe implantation range. This is in agreement with the model of correlated diffusion ofAu in presence of oxygen [68], quoted above.
The picture that emerges from TEM and optical results (summarized in table IV) isthat sequential ion implantation is able to give directly alloyed Au-Cu colloids. Subse-quent annealing in hydrogen can be used to increase the average size of the clusters witha change in the structural ordering of the alloy. On the contrary, if the as-implanted sam-ple is annealed in an oxidizing environment, a separation of the two species takes place,assisted by a chemical interaction between copper and oxygen, as will be described inmore detail in the next subsection. It is interesting to note that this can be done ina reversible way: SAED results on Au3Cu6 systems annealed first in air and then inhydrogen evidence again the formation of Au-Cu alloy clusters. The question is whetherthis transition follows a solid-solid path or it is assisted by an intermediate solid-liquidtransition of the alloyed clusters. Indeed, from the phase diagrams of the Au-Cu sys-tem, the melting point of the 1:1 Au:Cu alloy is just at 900 ◦C: moreover, due to thenanometric size of the clusters, a depression of this melting temperature could take placeaccording to the thermodynamic size effect [84]. The fact that annealing in air at thesame temperature is able to separate the two species may indicate the latter mechanismcould play a significant role.
5.2. Au-Ag alloy . – Silver nanoclusters embedded in glasses are among the first
nanocomposites realized by ion implantation [69, 113, 114]. Nanoclusters of silver-goldalloy in silica matrix are, in many respects, a good system for investigating the physicalprocesses involved in the alloy formation. In fact, because of the complete mixing of the
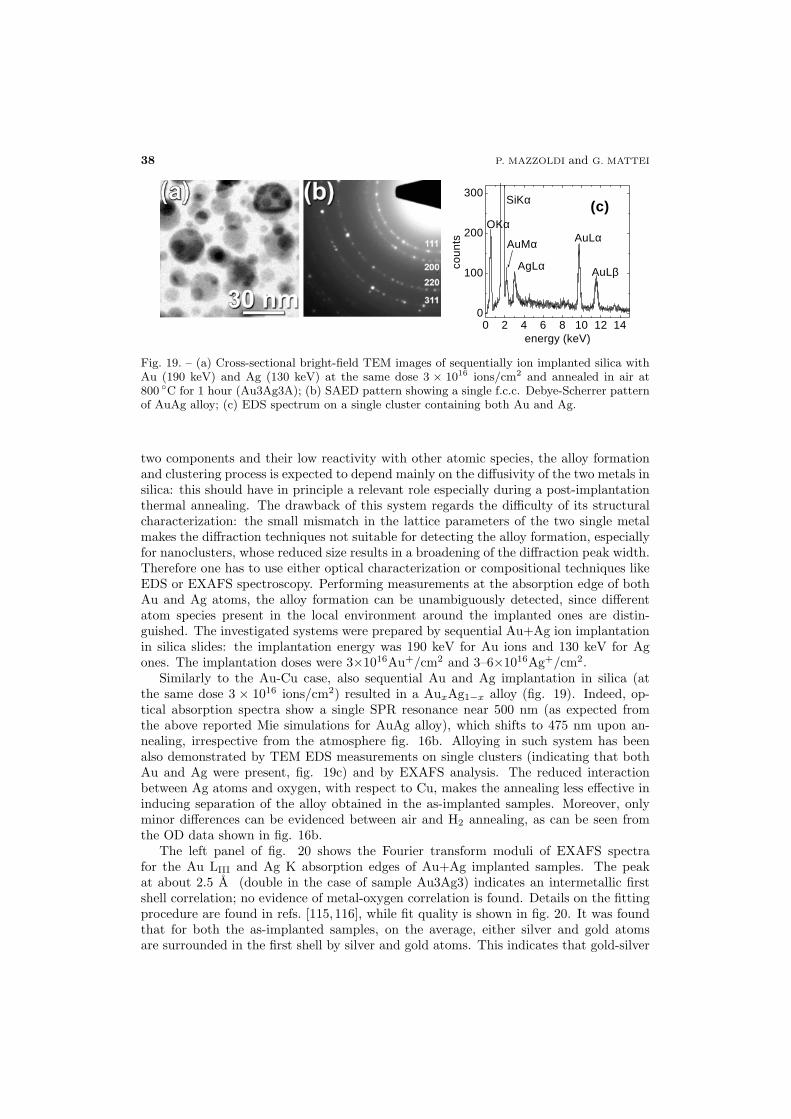
38 P. MAZZOLDI and G. MATTEI
0 2 4 6 8 10 12 140
100
200
300(c)SiKα
OKα
AgLα
AuMα
AuLβ
AuLα
coun
ts
energy (keV)
Fig. 19. – (a) Cross-sectional bright-field TEM images of sequentially ion implanted silica withAu (190 keV) and Ag (130 keV) at the same dose 3 × 10¹⁶ ions/cm2 and annealed in air at800 ◦C for 1 hour (Au3Ag3A); (b) SAED pattern showing a single f.c.c. Debye-Scherrer patternof AuAg alloy; (c) EDS spectrum on a single cluster containing both Au and Ag.
two components and their low reactivity with other atomic species, the alloy formationand clustering process is expected to depend mainly on the diffusivity of the two metals insilica: this should have in principle a relevant role especially during a post-implantationthermal annealing. The drawback of this system regards the difficulty of its structuralcharacterization: the small mismatch in the lattice parameters of the two single metalmakes the diffraction techniques not suitable for detecting the alloy formation, especiallyfor nanoclusters, whose reduced size results in a broadening of the diffraction peak width.Therefore one has to use either optical characterization or compositional techniques likeEDS or EXAFS spectroscopy. Performing measurements at the absorption edge of bothAu and Ag atoms, the alloy formation can be unambiguously detected, since differentatom species present in the local environment around the implanted ones are distin-guished. The investigated systems were prepared by sequential Au+Ag ion implantationin silica slides: the implantation energy was 190 keV for Au ions and 130 keV for Agones. The implantation doses were 3×10¹⁶Au+/cm2 and 3–6×10¹⁶Ag+/cm2.
Similarly to the Au-Cu case, also sequential Au and Ag implantation in silica (atthe same dose 3 × 10¹⁶ ions/cm2) resulted in a AuxAg1−x alloy (fig. 19). Indeed, op-tical absorption spectra show a single SPR resonance near 500 nm (as expected fromthe above reported Mie simulations for AuAg alloy), which shifts to 475 nm upon an-nealing, irrespective from the atmosphere fig. 16b. Alloying in such system has beenalso demonstrated by TEM EDS measurements on single clusters (indicating that bothAu and Ag were present, fig. 19c) and by EXAFS analysis. The reduced interactionbetween Ag atoms and oxygen, with respect to Cu, makes the annealing less effective ininducing separation of the alloy obtained in the as-implanted samples. Moreover, onlyminor differences can be evidenced between air and H2 annealing, as can be seen fromthe OD data shown in fig. 16b.
The left panel of fig. 20 shows the Fourier transform moduli of EXAFS spectrafor the Au LIII and Ag K absorption edges of Au+Ag implanted samples. The peakat about 2.5 A (double in the case of sample Au3Ag3) indicates an intermetallic firstshell correlation; no evidence of metal-oxygen correlation is found. Details on the fittingprocedure are found in refs. [115,116], while fit quality is shown in fig. 20. It was foundthat for both the as-implanted samples, on the average, either silver and gold atomsare surrounded in the first shell by silver and gold atoms. This indicates that gold-silver
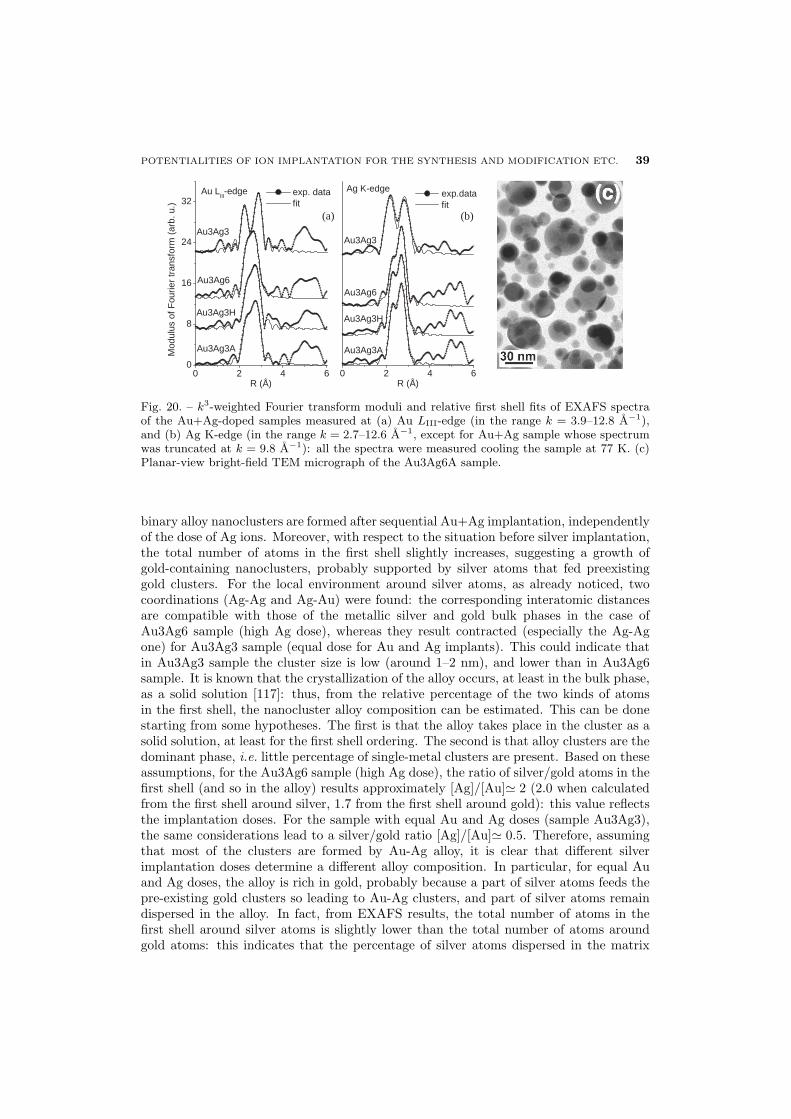
POTENTIALITIES OF ION IMPLANTATION FOR THE SYNTHESIS AND MODIFICATION ETC. 39
0 2 4 6
Au3Ag3
Au3Ag3A
Au3Ag3H
Au3Ag6
Ag K-edge
R (Å)
exp.datafit
(b)
0 2 4 60
8
16
24
32
Au3Ag3
Au LIII-edge
Au3Ag3A
Au3Ag3H
Au3Ag6
Mod
ulus
ofF
ourie
rtr
ansf
orm
(arb
.u.)
R (Å)
exp. datafit
(a)
Fig. 20. – k3-weighted Fourier transform moduli and relative first shell fits of EXAFS spectraof the Au+Ag-doped samples measured at (a) Au LIII-edge (in the range k = 3.9–12.8 A−1),and (b) Ag K-edge (in the range k = 2.7–12.6 A−1, except for Au+Ag sample whose spectrumwas truncated at k = 9.8 A−1): all the spectra were measured cooling the sample at 77 K. (c)Planar-view bright-field TEM micrograph of the Au3Ag6A sample.
binary alloy nanoclusters are formed after sequential Au+Ag implantation, independentlyof the dose of Ag ions. Moreover, with respect to the situation before silver implantation,the total number of atoms in the first shell slightly increases, suggesting a growth ofgold-containing nanoclusters, probably supported by silver atoms that fed preexistinggold clusters. For the local environment around silver atoms, as already noticed, twocoordinations (Ag-Ag and Ag-Au) were found: the corresponding interatomic distancesare compatible with those of the metallic silver and gold bulk phases in the case ofAu3Ag6 sample (high Ag dose), whereas they result contracted (especially the Ag-Agone) for Au3Ag3 sample (equal dose for Au and Ag implants). This could indicate thatin Au3Ag3 sample the cluster size is low (around 1–2 nm), and lower than in Au3Ag6sample. It is known that the crystallization of the alloy occurs, at least in the bulk phase,as a solid solution [117]: thus, from the relative percentage of the two kinds of atomsin the first shell, the nanocluster alloy composition can be estimated. This can be donestarting from some hypotheses. The first is that the alloy takes place in the cluster as asolid solution, at least for the first shell ordering. The second is that alloy clusters are thedominant phase, i.e. little percentage of single-metal clusters are present. Based on theseassumptions, for the Au3Ag6 sample (high Ag dose), the ratio of silver/gold atoms in thefirst shell (and so in the alloy) results approximately [Ag]/[Au]≃ 2 (2.0 when calculatedfrom the first shell around silver, 1.7 from the first shell around gold): this value reflectsthe implantation doses. For the sample with equal Au and Ag doses (sample Au3Ag3),the same considerations lead to a silver/gold ratio [Ag]/[Au]≃ 0.5. Therefore, assumingthat most of the clusters are formed by Au-Ag alloy, it is clear that different silverimplantation doses determine a different alloy composition. In particular, for equal Auand Ag doses, the alloy is rich in gold, probably because a part of silver atoms feeds thepre-existing gold clusters so leading to Au-Ag clusters, and part of silver atoms remaindispersed in the alloy. In fact, from EXAFS results, the total number of atoms in thefirst shell around silver atoms is slightly lower than the total number of atoms aroundgold atoms: this indicates that the percentage of silver atoms dispersed in the matrix
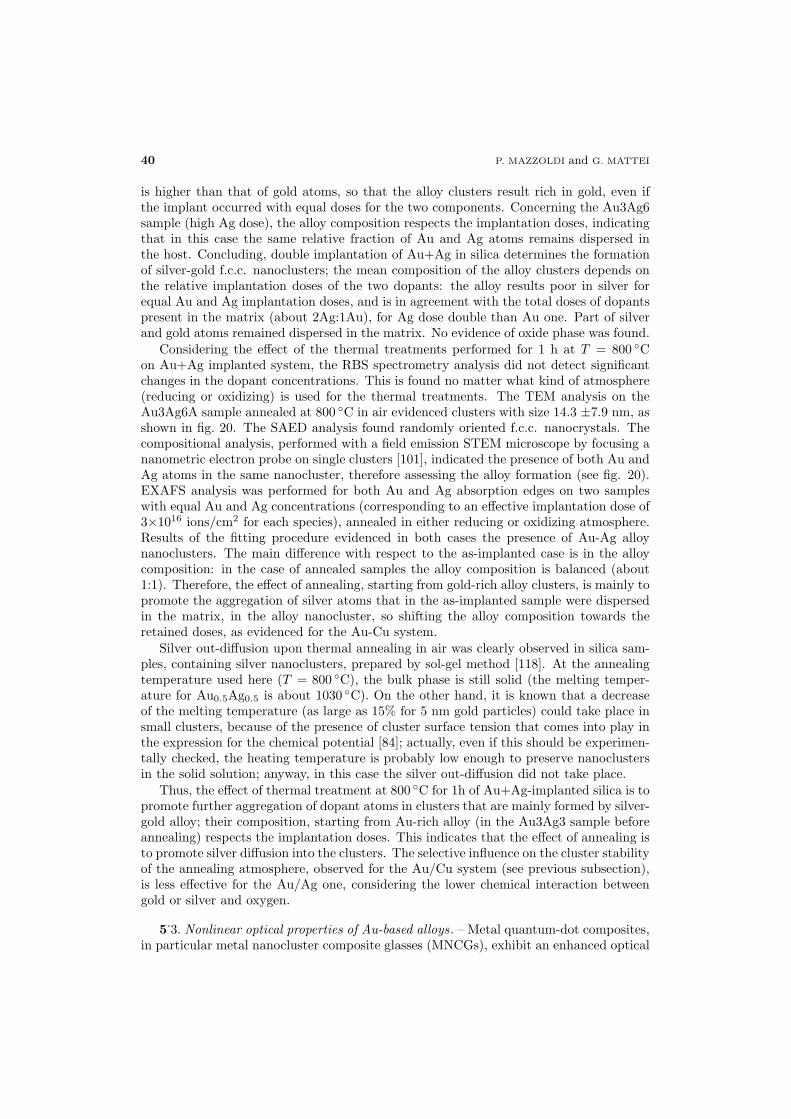
40 P. MAZZOLDI and G. MATTEI
is higher than that of gold atoms, so that the alloy clusters result rich in gold, even ifthe implant occurred with equal doses for the two components. Concerning the Au3Ag6sample (high Ag dose), the alloy composition respects the implantation doses, indicatingthat in this case the same relative fraction of Au and Ag atoms remains dispersed inthe host. Concluding, double implantation of Au+Ag in silica determines the formationof silver-gold f.c.c. nanoclusters; the mean composition of the alloy clusters depends onthe relative implantation doses of the two dopants: the alloy results poor in silver forequal Au and Ag implantation doses, and is in agreement with the total doses of dopantspresent in the matrix (about 2Ag:1Au), for Ag dose double than Au one. Part of silverand gold atoms remained dispersed in the matrix. No evidence of oxide phase was found.
Considering the effect of the thermal treatments performed for 1 h at T = 800 ◦Con Au+Ag implanted system, the RBS spectrometry analysis did not detect significantchanges in the dopant concentrations. This is found no matter what kind of atmosphere(reducing or oxidizing) is used for the thermal treatments. The TEM analysis on theAu3Ag6A sample annealed at 800 ◦C in air evidenced clusters with size 14.3 ±7.9 nm, asshown in fig. 20. The SAED analysis found randomly oriented f.c.c. nanocrystals. Thecompositional analysis, performed with a field emission STEM microscope by focusing ananometric electron probe on single clusters [101], indicated the presence of both Au andAg atoms in the same nanocluster, therefore assessing the alloy formation (see fig. 20).EXAFS analysis was performed for both Au and Ag absorption edges on two sampleswith equal Au and Ag concentrations (corresponding to an effective implantation dose of3×1016 ions/cm2 for each species), annealed in either reducing or oxidizing atmosphere.Results of the fitting procedure evidenced in both cases the presence of Au-Ag alloynanoclusters. The main difference with respect to the as-implanted case is in the alloycomposition: in the case of annealed samples the alloy composition is balanced (about1:1). Therefore, the effect of annealing, starting from gold-rich alloy clusters, is mainly topromote the aggregation of silver atoms that in the as-implanted sample were dispersedin the matrix, in the alloy nanocluster, so shifting the alloy composition towards theretained doses, as evidenced for the Au-Cu system.
Silver out-diffusion upon thermal annealing in air was clearly observed in silica sam-ples, containing silver nanoclusters, prepared by sol-gel method [118]. At the annealingtemperature used here (T = 800 ◦C), the bulk phase is still solid (the melting temper-ature for Au0.5Ag0.5 is about 1030 ◦C). On the other hand, it is known that a decreaseof the melting temperature (as large as 15% for 5 nm gold particles) could take place insmall clusters, because of the presence of cluster surface tension that comes into play inthe expression for the chemical potential [84]; actually, even if this should be experimen-tally checked, the heating temperature is probably low enough to preserve nanoclustersin the solid solution; anyway, in this case the silver out-diffusion did not take place.
Thus, the effect of thermal treatment at 800 ◦C for 1h of Au+Ag-implanted silica is topromote further aggregation of dopant atoms in clusters that are mainly formed by silver-gold alloy; their composition, starting from Au-rich alloy (in the Au3Ag3 sample beforeannealing) respects the implantation doses. This indicates that the effect of annealing isto promote silver diffusion into the clusters. The selective influence on the cluster stabilityof the annealing atmosphere, observed for the Au/Cu system (see previous subsection),is less effective for the Au/Ag one, considering the lower chemical interaction betweengold or silver and oxygen.
5.3. Nonlinear optical properties of Au-based alloys. – Metal quantum-dot composites,
in particular metal nanocluster composite glasses (MNCGs), exhibit an enhanced optical
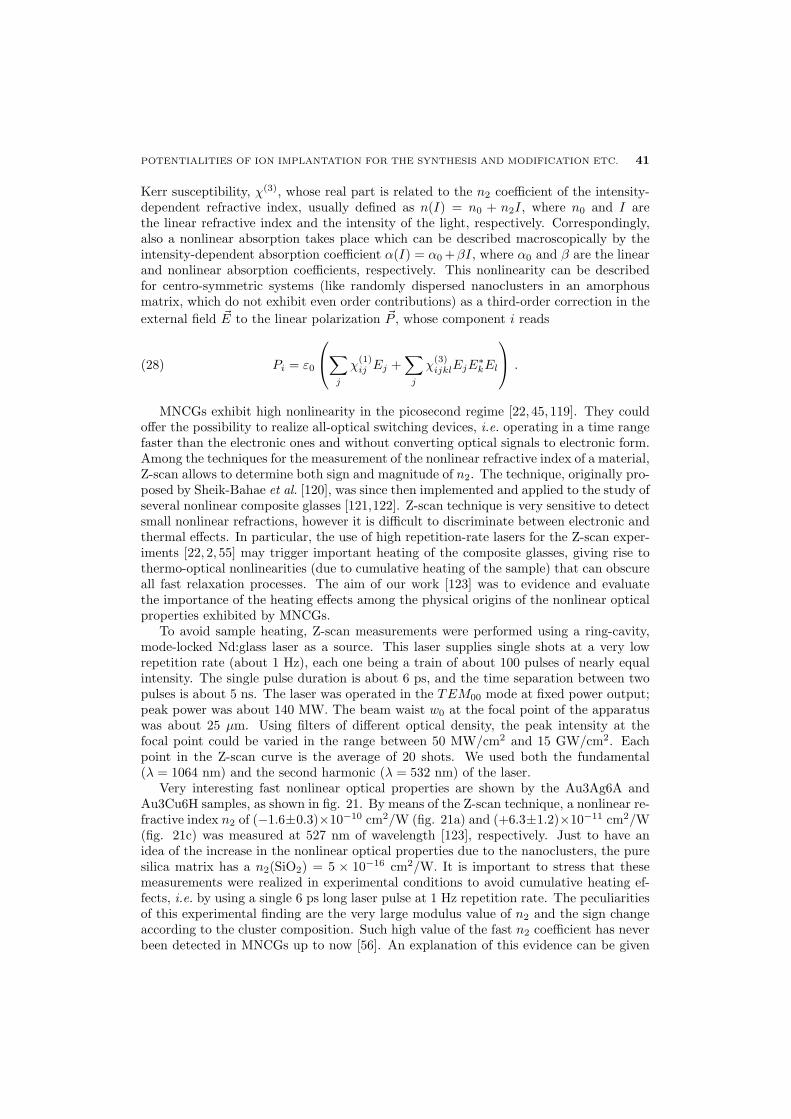
POTENTIALITIES OF ION IMPLANTATION FOR THE SYNTHESIS AND MODIFICATION ETC. 41
Kerr susceptibility, χ(3), whose real part is related to the n2 coefficient of the intensity-dependent refractive index, usually defined as n(I) = n0 + n2I, where n0 and I arethe linear refractive index and the intensity of the light, respectively. Correspondingly,also a nonlinear absorption takes place which can be described macroscopically by theintensity-dependent absorption coefficient α(I) = α0 +βI, where α0 and β are the linearand nonlinear absorption coefficients, respectively. This nonlinearity can be describedfor centro-symmetric systems (like randomly dispersed nanoclusters in an amorphousmatrix, which do not exhibit even order contributions) as a third-order correction in the
external field �E to the linear polarization �P , whose component i reads
Pi = ε0
∑
j
χ(1)ij Ej +
∑
j
χ(3)ijklEjE
∗
kEl
.(28)
MNCGs exhibit high nonlinearity in the picosecond regime [22, 45, 119]. They couldoffer the possibility to realize all-optical switching devices, i.e. operating in a time rangefaster than the electronic ones and without converting optical signals to electronic form.Among the techniques for the measurement of the nonlinear refractive index of a material,Z-scan allows to determine both sign and magnitude of n2. The technique, originally pro-posed by Sheik-Bahae et al. [120], was since then implemented and applied to the study ofseveral nonlinear composite glasses [121,122]. Z-scan technique is very sensitive to detectsmall nonlinear refractions, however it is difficult to discriminate between electronic andthermal effects. In particular, the use of high repetition-rate lasers for the Z-scan exper-iments [22, 2, 55] may trigger important heating of the composite glasses, giving rise tothermo-optical nonlinearities (due to cumulative heating of the sample) that can obscureall fast relaxation processes. The aim of our work [123] was to evidence and evaluatethe importance of the heating effects among the physical origins of the nonlinear opticalproperties exhibited by MNCGs.
To avoid sample heating, Z-scan measurements were performed using a ring-cavity,mode-locked Nd:glass laser as a source. This laser supplies single shots at a very lowrepetition rate (about 1 Hz), each one being a train of about 100 pulses of nearly equalintensity. The single pulse duration is about 6 ps, and the time separation between twopulses is about 5 ns. The laser was operated in the TEM00 mode at fixed power output;peak power was about 140 MW. The beam waist w0 at the focal point of the apparatuswas about 25 µm. Using filters of different optical density, the peak intensity at thefocal point could be varied in the range between 50 MW/cm2 and 15 GW/cm2. Eachpoint in the Z-scan curve is the average of 20 shots. We used both the fundamental(λ = 1064 nm) and the second harmonic (λ = 532 nm) of the laser.
Very interesting fast nonlinear optical properties are shown by the Au3Ag6A andAu3Cu6H samples, as shown in fig. 21. By means of the Z-scan technique, a nonlinear re-fractive index n2 of (−1.6±0.3)×10−10 cm2/W (fig. 21a) and (+6.3±1.2)×10−11 cm2/W(fig. 21c) was measured at 527 nm of wavelength [123], respectively. Just to have anidea of the increase in the nonlinear optical properties due to the nanoclusters, the puresilica matrix has a n2(SiO2) = 5 × 10⁻¹⁶ cm2/W. It is important to stress that thesemeasurements were realized in experimental conditions to avoid cumulative heating ef-fects, i.e. by using a single 6 ps long laser pulse at 1 Hz repetition rate. The peculiaritiesof this experimental finding are the very large modulus value of n2 and the sign changeaccording to the cluster composition. Such high value of the fast n2 coefficient has neverbeen detected in MNCGs up to now [56]. An explanation of this evidence can be given
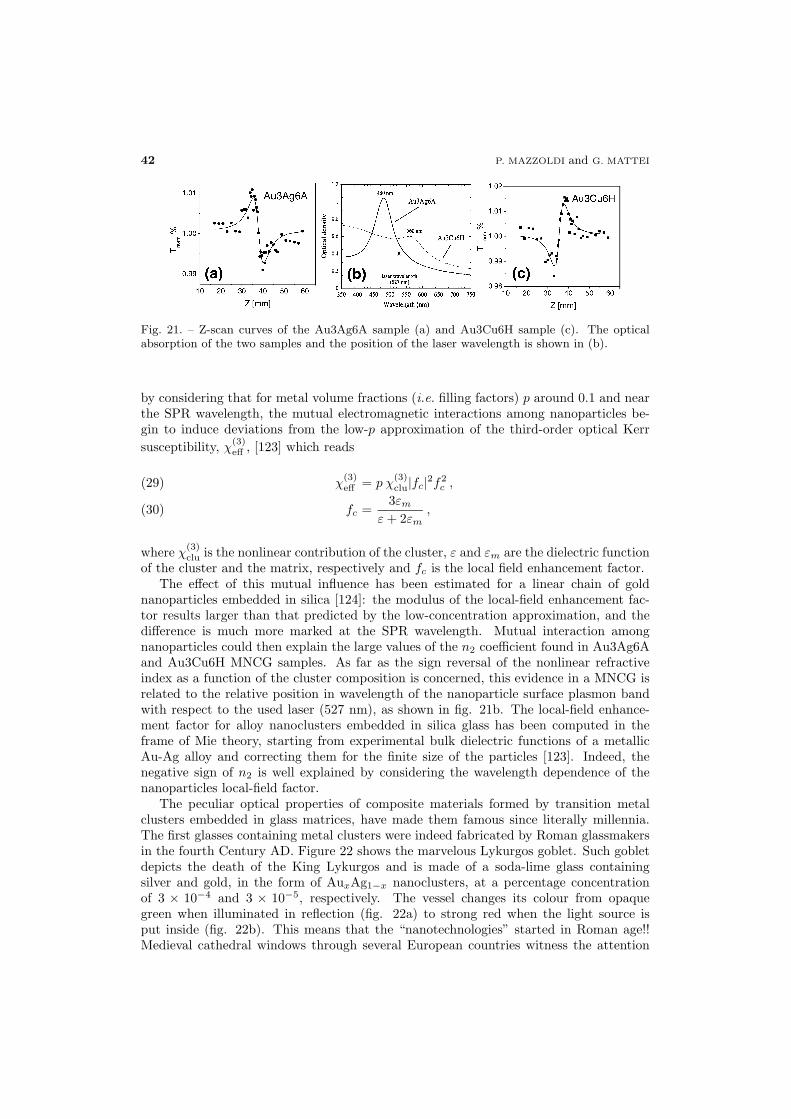
42 P. MAZZOLDI and G. MATTEI
Fig. 21. – Z-scan curves of the Au3Ag6A sample (a) and Au3Cu6H sample (c). The opticalabsorption of the two samples and the position of the laser wavelength is shown in (b).
by considering that for metal volume fractions (i.e. filling factors) p around 0.1 and nearthe SPR wavelength, the mutual electromagnetic interactions among nanoparticles be-gin to induce deviations from the low-p approximation of the third-order optical Kerr
susceptibility, χ(3)eff , [123] which reads
χ(3)eff = p χ
(3)clu|fc|2f2
c ,(29)
fc =3εm
ε+ 2εm,(30)
where χ(3)clu is the nonlinear contribution of the cluster, ε and εm are the dielectric function
of the cluster and the matrix, respectively and fc is the local field enhancement factor.The effect of this mutual influence has been estimated for a linear chain of gold
nanoparticles embedded in silica [124]: the modulus of the local-field enhancement fac-tor results larger than that predicted by the low-concentration approximation, and thedifference is much more marked at the SPR wavelength. Mutual interaction amongnanoparticles could then explain the large values of the n2 coefficient found in Au3Ag6Aand Au3Cu6H MNCG samples. As far as the sign reversal of the nonlinear refractiveindex as a function of the cluster composition is concerned, this evidence in a MNCG isrelated to the relative position in wavelength of the nanoparticle surface plasmon bandwith respect to the used laser (527 nm), as shown in fig. 21b. The local-field enhance-ment factor for alloy nanoclusters embedded in silica glass has been computed in theframe of Mie theory, starting from experimental bulk dielectric functions of a metallicAu-Ag alloy and correcting them for the finite size of the particles [123]. Indeed, thenegative sign of n2 is well explained by considering the wavelength dependence of thenanoparticles local-field factor.
The peculiar optical properties of composite materials formed by transition metalclusters embedded in glass matrices, have made them famous since literally millennia.The first glasses containing metal clusters were indeed fabricated by Roman glassmakersin the fourth Century AD. Figure 22 shows the marvelous Lykurgos goblet. Such gobletdepicts the death of the King Lykurgos and is made of a soda-lime glass containingsilver and gold, in the form of AuxAg1−x nanoclusters, at a percentage concentrationof 3 × 10⁻⁴ and 3 × 10⁻⁵, respectively. The vessel changes its colour from opaquegreen when illuminated in reflection (fig. 22a) to strong red when the light source isput inside (fig. 22b). This means that the “nanotechnologies” started in Roman age!!Medieval cathedral windows through several European countries witness the attention
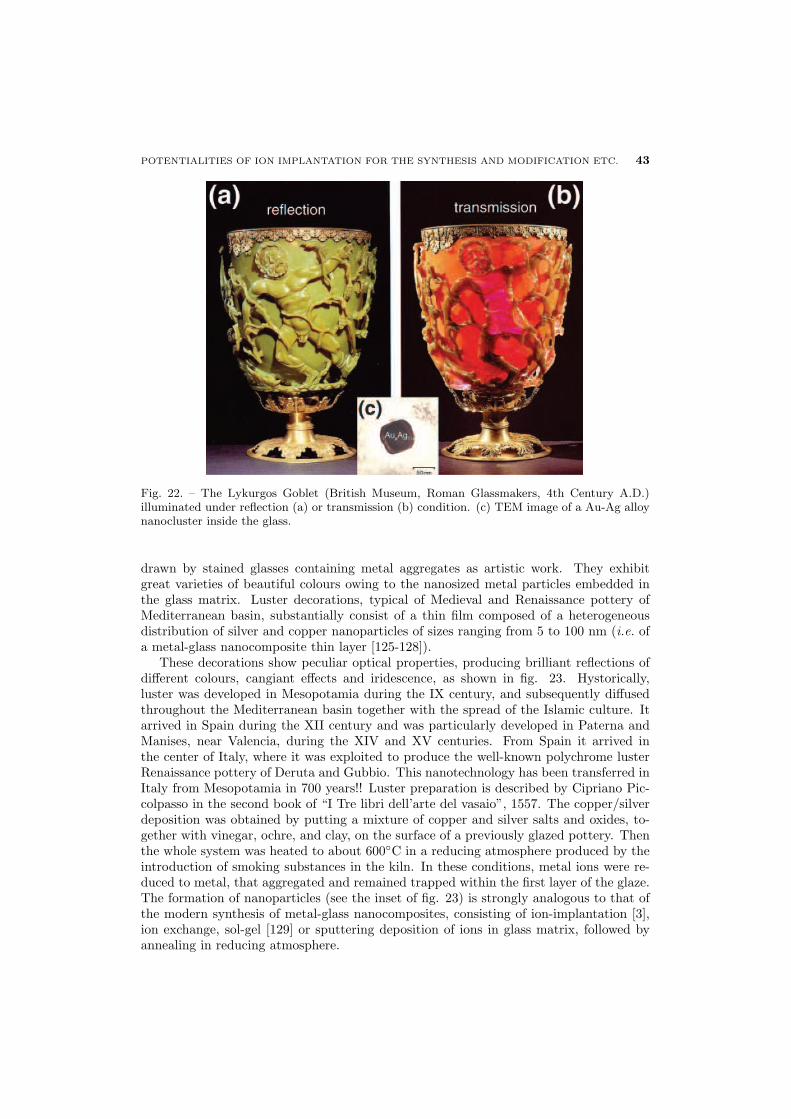
POTENTIALITIES OF ION IMPLANTATION FOR THE SYNTHESIS AND MODIFICATION ETC. 43
Fig. 22. – The Lykurgos Goblet (British Museum, Roman Glassmakers, 4th Century A.D.)illuminated under reflection (a) or transmission (b) condition. (c) TEM image of a Au-Ag alloynanocluster inside the glass.
drawn by stained glasses containing metal aggregates as artistic work. They exhibitgreat varieties of beautiful colours owing to the nanosized metal particles embedded inthe glass matrix. Luster decorations, typical of Medieval and Renaissance pottery ofMediterranean basin, substantially consist of a thin film composed of a heterogeneousdistribution of silver and copper nanoparticles of sizes ranging from 5 to 100 nm (i.e. ofa metal-glass nanocomposite thin layer [125-128]).
These decorations show peculiar optical properties, producing brilliant reflections ofdifferent colours, cangiant effects and iridescence, as shown in fig. 23. Hystorically,luster was developed in Mesopotamia during the IX century, and subsequently diffusedthroughout the Mediterranean basin together with the spread of the Islamic culture. Itarrived in Spain during the XII century and was particularly developed in Paterna andManises, near Valencia, during the XIV and XV centuries. From Spain it arrived inthe center of Italy, where it was exploited to produce the well-known polychrome lusterRenaissance pottery of Deruta and Gubbio. This nanotechnology has been transferred inItaly from Mesopotamia in 700 years!! Luster preparation is described by Cipriano Pic-colpasso in the second book of “I Tre libri dell’arte del vasaio”, 1557. The copper/silverdeposition was obtained by putting a mixture of copper and silver salts and oxides, to-gether with vinegar, ochre, and clay, on the surface of a previously glazed pottery. Thenthe whole system was heated to about 600◦C in a reducing atmosphere produced by theintroduction of smoking substances in the kiln. In these conditions, metal ions were re-duced to metal, that aggregated and remained trapped within the first layer of the glaze.The formation of nanoparticles (see the inset of fig. 23) is strongly analogous to that ofthe modern synthesis of metal-glass nanocomposites, consisting of ion-implantation [3],ion exchange, sol-gel [129] or sputtering deposition of ions in glass matrix, followed byannealing in reducing atmosphere.
44 P. MAZZOLDI and G. MATTEI
Fig. 23. – Lustre prepared by Mastro Giorgio in Gubbio (Italy, 1528) (Museo Civico dellaCeramica di Gubbio, Italy). The inset is a TEM image of copper nanoclusters in the goldlustre.
5.4. Pd-Ag and Pd-Cu alloys. – After exploring the effect of Cu and Ag in Au-based
alloys, we started a new set of experiments aimed at investigating the role played byAu, substituting it with Pd which, as Au, is not so reactive with either the matrixor oxygen [106]. Fused silica slides were sequentially implanted at room temperaturewith Pd (130 keV) and Ag (130 keV) or with Pd (130 keV) and Cu (90 keV) ionsat the same dose of 3 × 10¹⁶ ions/cm2 to obtain the same projected range as in theAu-based alloys. OD spectra for both systems are shown in fig. 24 do not evidencethe Ag SPR peak at about 400 nm nor the Cu SPR peak at 560 nm, typical of theseparated systems, respectively, suggesting the formation of metal alloy Pd-Ag and Pd-Cu nanoclusters. In this case the partially filled d-band of Pd promotes charge transferwith noble metals, with a subsequent damping of the collective plasma oscillation typicalof free electrons like metals. The conclusion of actual alloy formation is supported byTEM analysis. The cross-section micrographs of the as-implanted and annealed Pd-Agsamples are shown in fig. 25. Selected area electron diffraction (SAED) indicates adominant f.c.c. phase with a lattice constant a = 0.3987(10) nm, consistent with theformation of an intermetallic alloy (experimental values for bulk f.c.c. Pd and Ag areaPd = 0.38898 nm and aAg = 0.40862 nm, respectively). After annealing in air at 800 ◦C
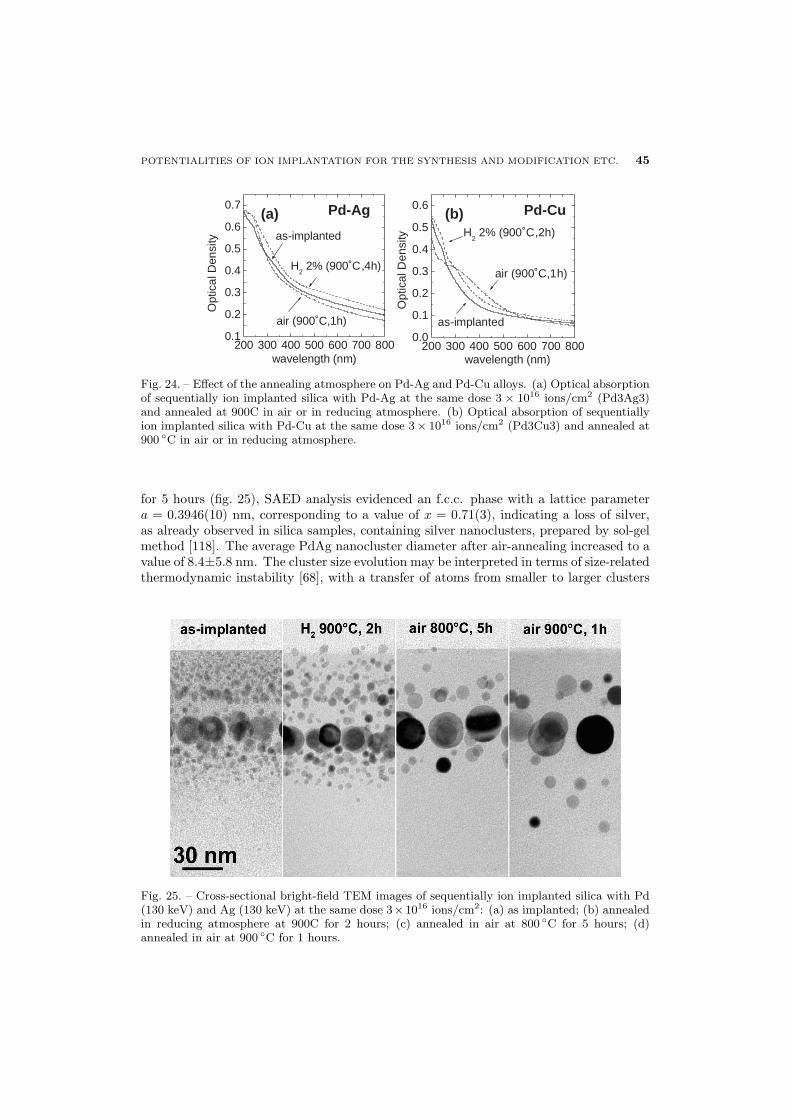
POTENTIALITIES OF ION IMPLANTATION FOR THE SYNTHESIS AND MODIFICATION ETC. 45
200 300 400 500 600 700 8000.1
0.2
0.3
0.4
0.5
0.6
0.7
H2
2% (900˚C,4h)
air (900˚C,1h)
as-implanted
Opt
ical
Den
sity
wavelength (nm)200 300 400 500 600 700 800
0.0
0.1
0.2
0.3
0.4
0.5
0.6
H2
2% (900˚C,2h)
as-implanted
air (900˚C,1h)
Opt
ical
Den
sity
wavelength (nm)
(a) (b)Pd-Ag Pd-Cu
Fig. 24. – Effect of the annealing atmosphere on Pd-Ag and Pd-Cu alloys. (a) Optical absorptionof sequentially ion implanted silica with Pd-Ag at the same dose 3 × 10¹⁶ ions/cm2 (Pd3Ag3)and annealed at 900C in air or in reducing atmosphere. (b) Optical absorption of sequentiallyion implanted silica with Pd-Cu at the same dose 3× 10¹⁶ ions/cm2 (Pd3Cu3) and annealed at900 ◦C in air or in reducing atmosphere.
for 5 hours (fig. 25), SAED analysis evidenced an f.c.c. phase with a lattice parametera = 0.3946(10) nm, corresponding to a value of x = 0.71(3), indicating a loss of silver,as already observed in silica samples, containing silver nanoclusters, prepared by sol-gelmethod [118]. The average PdAg nanocluster diameter after air-annealing increased to avalue of 8.4±5.8 nm. The cluster size evolution may be interpreted in terms of size-relatedthermodynamic instability [68], with a transfer of atoms from smaller to larger clusters
Fig. 25. – Cross-sectional bright-field TEM images of sequentially ion implanted silica with Pd(130 keV) and Ag (130 keV) at the same dose 3×10¹⁶ ions/cm2: (a) as implanted; (b) annealedin reducing atmosphere at 900C for 2 hours; (c) annealed in air at 800 ◦C for 5 hours; (d)annealed in air at 900 ◦C for 1 hours.
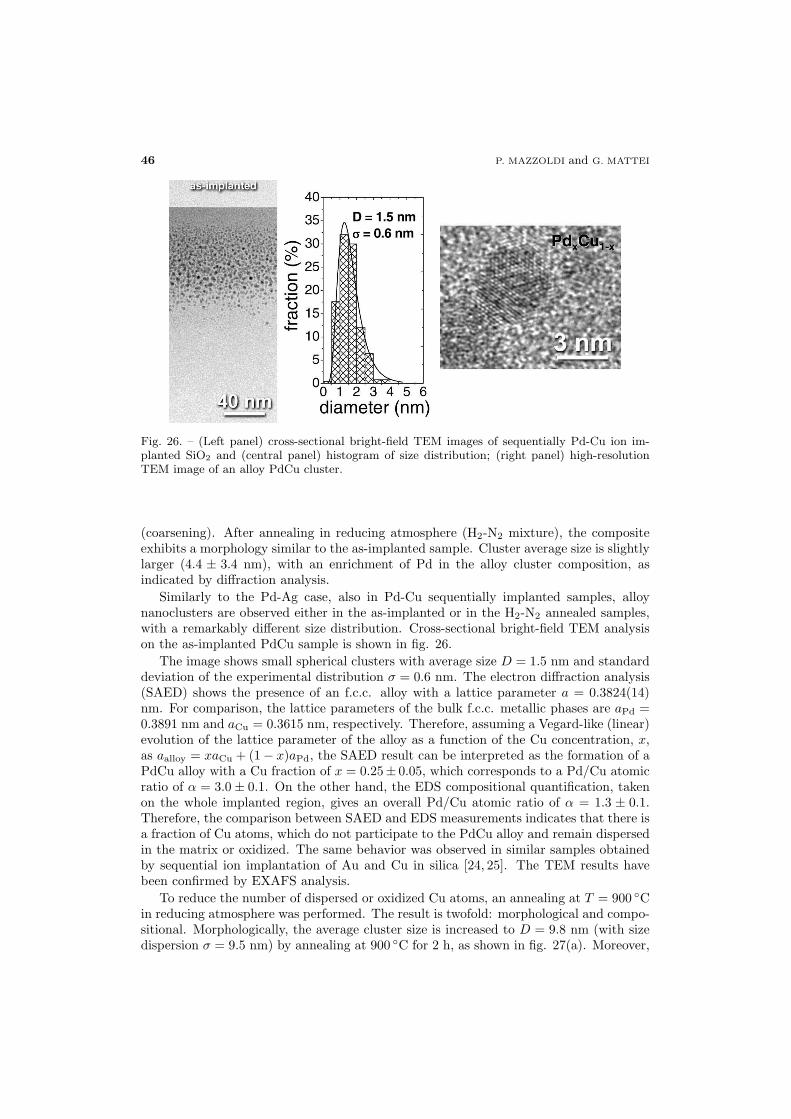
46 P. MAZZOLDI and G. MATTEI
Fig. 26. – (Left panel) cross-sectional bright-field TEM images of sequentially Pd-Cu ion im-planted SiO2 and (central panel) histogram of size distribution; (right panel) high-resolutionTEM image of an alloy PdCu cluster.
(coarsening). After annealing in reducing atmosphere (H2-N2 mixture), the compositeexhibits a morphology similar to the as-implanted sample. Cluster average size is slightlylarger (4.4 ± 3.4 nm), with an enrichment of Pd in the alloy cluster composition, asindicated by diffraction analysis.
Similarly to the Pd-Ag case, also in Pd-Cu sequentially implanted samples, alloynanoclusters are observed either in the as-implanted or in the H2-N2 annealed samples,with a remarkably different size distribution. Cross-sectional bright-field TEM analysison the as-implanted PdCu sample is shown in fig. 26.
The image shows small spherical clusters with average size D = 1.5 nm and standarddeviation of the experimental distribution σ = 0.6 nm. The electron diffraction analysis(SAED) shows the presence of an f.c.c. alloy with a lattice parameter a = 0.3824(14)nm. For comparison, the lattice parameters of the bulk f.c.c. metallic phases are aPd =0.3891 nm and aCu = 0.3615 nm, respectively. Therefore, assuming a Vegard-like (linear)evolution of the lattice parameter of the alloy as a function of the Cu concentration, x,as aalloy = xaCu + (1 − x)aPd, the SAED result can be interpreted as the formation of aPdCu alloy with a Cu fraction of x = 0.25± 0.05, which corresponds to a Pd/Cu atomicratio of α = 3.0 ± 0.1. On the other hand, the EDS compositional quantification, takenon the whole implanted region, gives an overall Pd/Cu atomic ratio of α = 1.3 ± 0.1.Therefore, the comparison between SAED and EDS measurements indicates that there isa fraction of Cu atoms, which do not participate to the PdCu alloy and remain dispersedin the matrix or oxidized. The same behavior was observed in similar samples obtainedby sequential ion implantation of Au and Cu in silica [24, 25]. The TEM results havebeen confirmed by EXAFS analysis.
To reduce the number of dispersed or oxidized Cu atoms, an annealing at T = 900 ◦Cin reducing atmosphere was performed. The result is twofold: morphological and compo-sitional. Morphologically, the average cluster size is increased to D = 9.8 nm (with sizedispersion σ = 9.5 nm) by annealing at 900 ◦C for 2 h, as shown in fig. 27(a). Moreover,
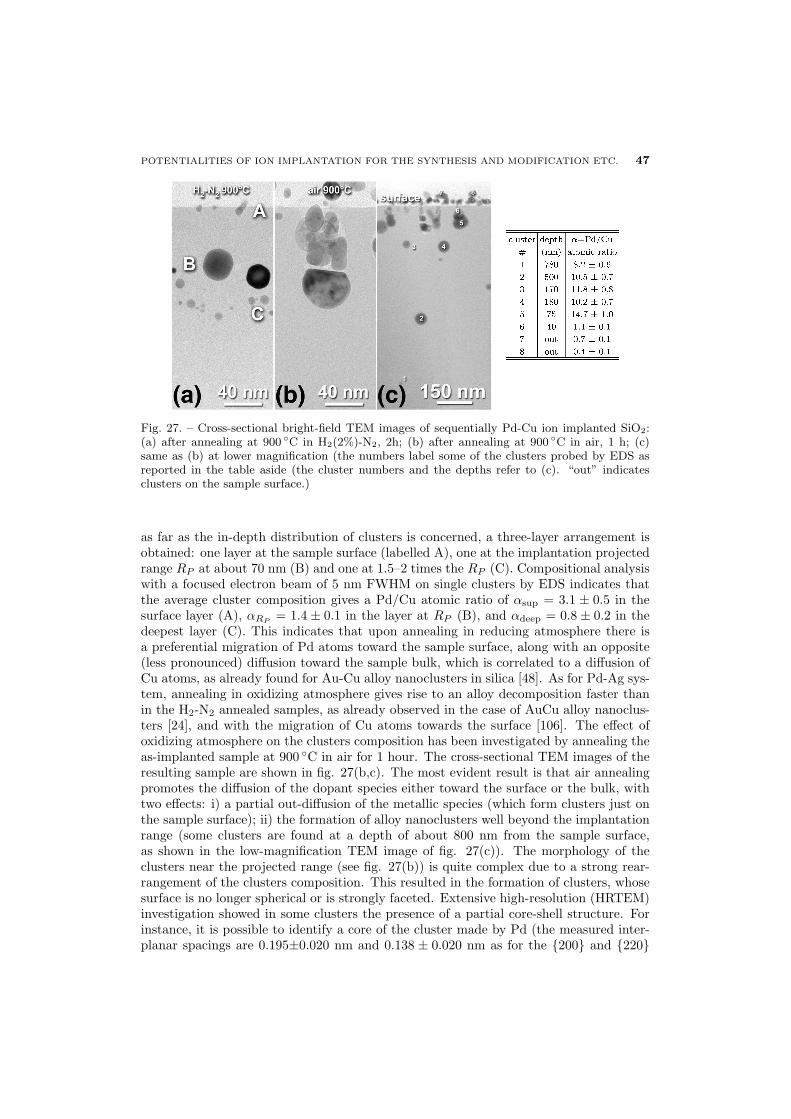
POTENTIALITIES OF ION IMPLANTATION FOR THE SYNTHESIS AND MODIFICATION ETC. 47
Fig. 27. – Cross-sectional bright-field TEM images of sequentially Pd-Cu ion implanted SiO2:(a) after annealing at 900 ◦C in H2(2%)-N2, 2h; (b) after annealing at 900 ◦C in air, 1 h; (c)same as (b) at lower magnification (the numbers label some of the clusters probed by EDS asreported in the table aside (the cluster numbers and the depths refer to (c). “out” indicatesclusters on the sample surface.)
as far as the in-depth distribution of clusters is concerned, a three-layer arrangement isobtained: one layer at the sample surface (labelled A), one at the implantation projectedrange RP at about 70 nm (B) and one at 1.5–2 times the RP (C). Compositional analysiswith a focused electron beam of 5 nm FWHM on single clusters by EDS indicates thatthe average cluster composition gives a Pd/Cu atomic ratio of αsup = 3.1 ± 0.5 in thesurface layer (A), αRP
= 1.4 ± 0.1 in the layer at RP (B), and αdeep = 0.8 ± 0.2 in thedeepest layer (C). This indicates that upon annealing in reducing atmosphere there isa preferential migration of Pd atoms toward the sample surface, along with an opposite(less pronounced) diffusion toward the sample bulk, which is correlated to a diffusion ofCu atoms, as already found for Au-Cu alloy nanoclusters in silica [48]. As for Pd-Ag sys-tem, annealing in oxidizing atmosphere gives rise to an alloy decomposition faster thanin the H2-N2 annealed samples, as already observed in the case of AuCu alloy nanoclus-ters [24], and with the migration of Cu atoms towards the surface [106]. The effect ofoxidizing atmosphere on the clusters composition has been investigated by annealing theas-implanted sample at 900 ◦C in air for 1 hour. The cross-sectional TEM images of theresulting sample are shown in fig. 27(b,c). The most evident result is that air annealingpromotes the diffusion of the dopant species either toward the surface or the bulk, withtwo effects: i) a partial out-diffusion of the metallic species (which form clusters just onthe sample surface); ii) the formation of alloy nanoclusters well beyond the implantationrange (some clusters are found at a depth of about 800 nm from the sample surface,as shown in the low-magnification TEM image of fig. 27(c)). The morphology of theclusters near the projected range (see fig. 27(b)) is quite complex due to a strong rear-rangement of the clusters composition. This resulted in the formation of clusters, whosesurface is no longer spherical or is strongly faceted. Extensive high-resolution (HRTEM)investigation showed in some clusters the presence of a partial core-shell structure. Forinstance, it is possible to identify a core of the cluster made by Pd (the measured inter-planar spacings are 0.195±0.020 nm and 0.138 ± 0.020 nm as for the {200} and {220}
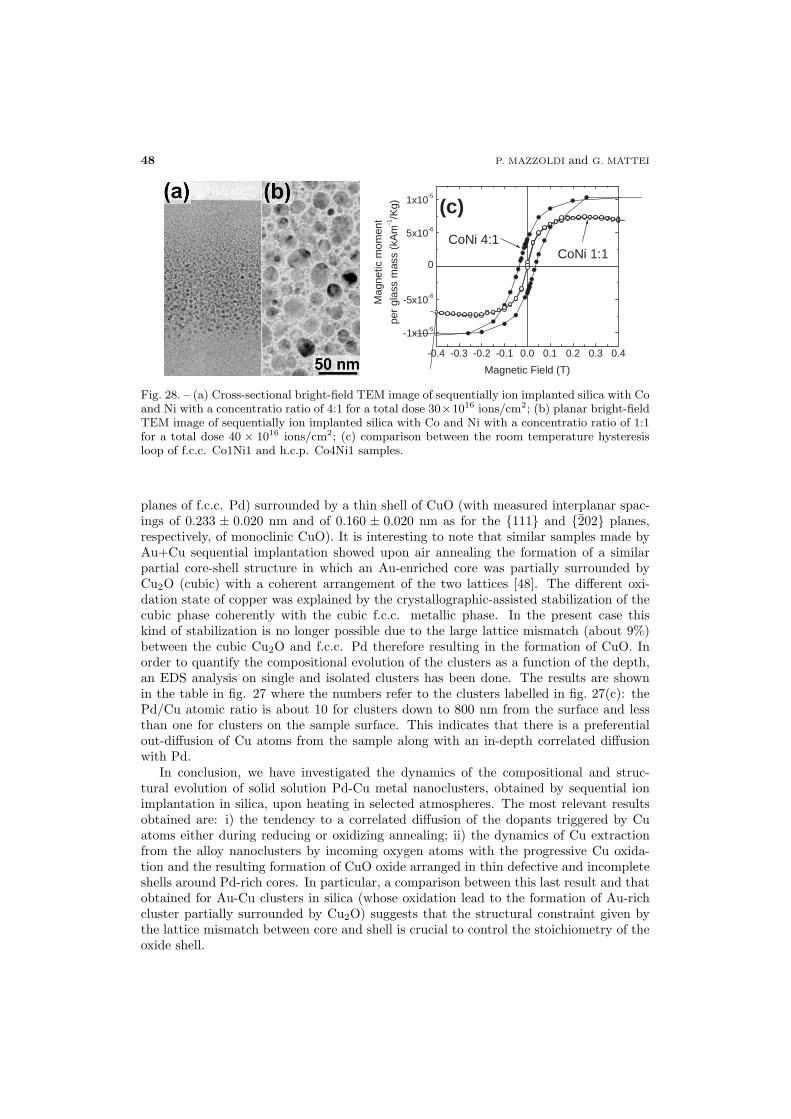
48 P. MAZZOLDI and G. MATTEI
-0.4 -0.3 -0.2 -0.1 0.0 0.1 0.2 0.3 0.4
-1x10⁻⁵
-5x10⁻⁶
0
5x10⁻⁶
1x10⁻⁵
CoNi 1:1CoNi 4:1
Mag
netic
mom
ent
per
glas
sm
ass
(kA
m-1/K
g)
Magnetic Field (T)
(c)
Fig. 28. – (a) Cross-sectional bright-field TEM image of sequentially ion implanted silica with Coand Ni with a concentratio ratio of 4:1 for a total dose 30×1016 ions/cm2; (b) planar bright-fieldTEM image of sequentially ion implanted silica with Co and Ni with a concentratio ratio of 1:1for a total dose 40 × 1016 ions/cm2; (c) comparison between the room temperature hysteresisloop of f.c.c. Co1Ni1 and h.c.p. Co4Ni1 samples.
planes of f.c.c. Pd) surrounded by a thin shell of CuO (with measured interplanar spac-ings of 0.233 ± 0.020 nm and of 0.160 ± 0.020 nm as for the {111} and {202} planes,respectively, of monoclinic CuO). It is interesting to note that similar samples made byAu+Cu sequential implantation showed upon air annealing the formation of a similarpartial core-shell structure in which an Au-enriched core was partially surrounded byCu2O (cubic) with a coherent arrangement of the two lattices [48]. The different oxi-dation state of copper was explained by the crystallographic-assisted stabilization of thecubic phase coherently with the cubic f.c.c. metallic phase. In the present case thiskind of stabilization is no longer possible due to the large lattice mismatch (about 9%)between the cubic Cu2O and f.c.c. Pd therefore resulting in the formation of CuO. Inorder to quantify the compositional evolution of the clusters as a function of the depth,an EDS analysis on single and isolated clusters has been done. The results are shownin the table in fig. 27 where the numbers refer to the clusters labelled in fig. 27(c): thePd/Cu atomic ratio is about 10 for clusters down to 800 nm from the surface and lessthan one for clusters on the sample surface. This indicates that there is a preferentialout-diffusion of Cu atoms from the sample along with an in-depth correlated diffusionwith Pd.
In conclusion, we have investigated the dynamics of the compositional and struc-tural evolution of solid solution Pd-Cu metal nanoclusters, obtained by sequential ionimplantation in silica, upon heating in selected atmospheres. The most relevant resultsobtained are: i) the tendency to a correlated diffusion of the dopants triggered by Cuatoms either during reducing or oxidizing annealing; ii) the dynamics of Cu extractionfrom the alloy nanoclusters by incoming oxygen atoms with the progressive Cu oxida-tion and the resulting formation of CuO oxide arranged in thin defective and incompleteshells around Pd-rich cores. In particular, a comparison between this last result and thatobtained for Au-Cu clusters in silica (whose oxidation lead to the formation of Au-richcluster partially surrounded by Cu2O) suggests that the structural constraint given bythe lattice mismatch between core and shell is crucial to control the stoichiometry of theoxide shell.
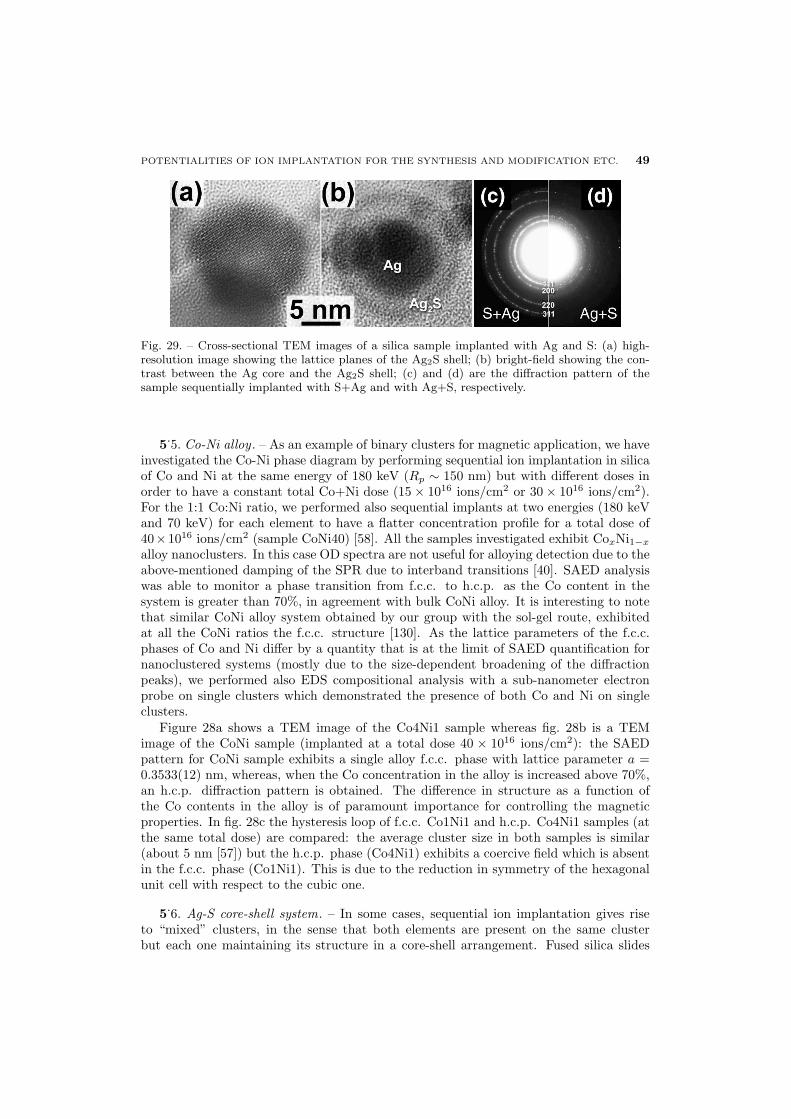
POTENTIALITIES OF ION IMPLANTATION FOR THE SYNTHESIS AND MODIFICATION ETC. 49
Fig. 29. – Cross-sectional TEM images of a silica sample implanted with Ag and S: (a) high-resolution image showing the lattice planes of the Ag2S shell; (b) bright-field showing the con-trast between the Ag core and the Ag2S shell; (c) and (d) are the diffraction pattern of thesample sequentially implanted with S+Ag and with Ag+S, respectively.
5.5. Co-Ni alloy . – As an example of binary clusters for magnetic application, we have
investigated the Co-Ni phase diagram by performing sequential ion implantation in silicaof Co and Ni at the same energy of 180 keV (Rp ∼ 150 nm) but with different doses inorder to have a constant total Co+Ni dose (15 × 1016 ions/cm2 or 30 × 1016 ions/cm2).For the 1:1 Co:Ni ratio, we performed also sequential implants at two energies (180 keVand 70 keV) for each element to have a flatter concentration profile for a total dose of40×1016 ions/cm2 (sample CoNi40) [58]. All the samples investigated exhibit CoxNi1−x
alloy nanoclusters. In this case OD spectra are not useful for alloying detection due to theabove-mentioned damping of the SPR due to interband transitions [40]. SAED analysiswas able to monitor a phase transition from f.c.c. to h.c.p. as the Co content in thesystem is greater than 70%, in agreement with bulk CoNi alloy. It is interesting to notethat similar CoNi alloy system obtained by our group with the sol-gel route, exhibitedat all the CoNi ratios the f.c.c. structure [130]. As the lattice parameters of the f.c.c.phases of Co and Ni differ by a quantity that is at the limit of SAED quantification fornanoclustered systems (mostly due to the size-dependent broadening of the diffractionpeaks), we performed also EDS compositional analysis with a sub-nanometer electronprobe on single clusters which demonstrated the presence of both Co and Ni on singleclusters.
Figure 28a shows a TEM image of the Co4Ni1 sample whereas fig. 28b is a TEMimage of the CoNi sample (implanted at a total dose 40 × 1016 ions/cm2): the SAEDpattern for CoNi sample exhibits a single alloy f.c.c. phase with lattice parameter a =0.3533(12) nm, whereas, when the Co concentration in the alloy is increased above 70%,an h.c.p. diffraction pattern is obtained. The difference in structure as a function ofthe Co contents in the alloy is of paramount importance for controlling the magneticproperties. In fig. 28c the hysteresis loop of f.c.c. Co1Ni1 and h.c.p. Co4Ni1 samples (atthe same total dose) are compared: the average cluster size in both samples is similar(about 5 nm [57]) but the h.c.p. phase (Co4Ni1) exhibits a coercive field which is absentin the f.c.c. phase (Co1Ni1). This is due to the reduction in symmetry of the hexagonalunit cell with respect to the cubic one.
5.6. Ag-S core-shell system. – In some cases, sequential ion implantation gives rise
to “mixed” clusters, in the sense that both elements are present on the same clusterbut each one maintaining its structure in a core-shell arrangement. Fused silica slides
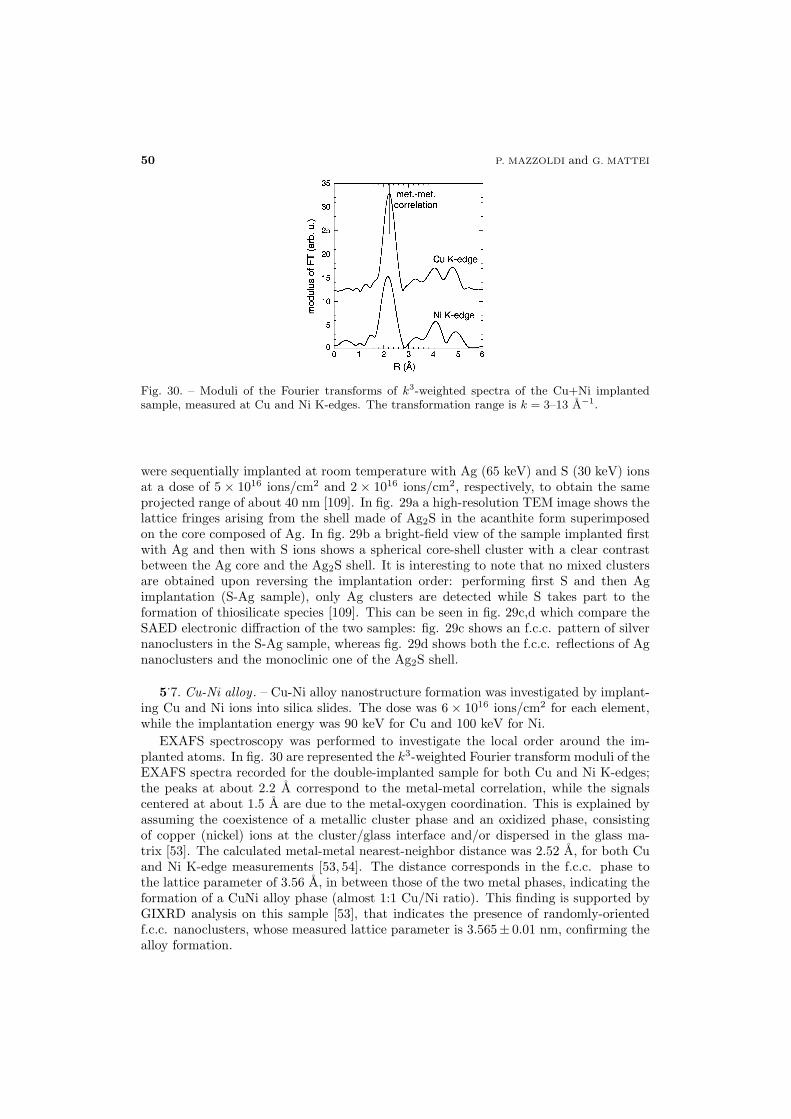
50 P. MAZZOLDI and G. MATTEI
Fig. 30. – Moduli of the Fourier transforms of k3-weighted spectra of the Cu+Ni implantedsample, measured at Cu and Ni K-edges. The transformation range is k = 3–13 A−1.
were sequentially implanted at room temperature with Ag (65 keV) and S (30 keV) ionsat a dose of 5 × 10¹⁶ ions/cm2 and 2 × 10¹⁶ ions/cm2, respectively, to obtain the sameprojected range of about 40 nm [109]. In fig. 29a a high-resolution TEM image shows thelattice fringes arising from the shell made of Ag2S in the acanthite form superimposedon the core composed of Ag. In fig. 29b a bright-field view of the sample implanted firstwith Ag and then with S ions shows a spherical core-shell cluster with a clear contrastbetween the Ag core and the Ag2S shell. It is interesting to note that no mixed clustersare obtained upon reversing the implantation order: performing first S and then Agimplantation (S-Ag sample), only Ag clusters are detected while S takes part to theformation of thiosilicate species [109]. This can be seen in fig. 29c,d which compare theSAED electronic diffraction of the two samples: fig. 29c shows an f.c.c. pattern of silvernanoclusters in the S-Ag sample, whereas fig. 29d shows both the f.c.c. reflections of Agnanoclusters and the monoclinic one of the Ag2S shell.
5.7. Cu-Ni alloy . – Cu-Ni alloy nanostructure formation was investigated by implant-
ing Cu and Ni ions into silica slides. The dose was 6 × 10¹⁶ ions/cm2 for each element,while the implantation energy was 90 keV for Cu and 100 keV for Ni.
EXAFS spectroscopy was performed to investigate the local order around the im-planted atoms. In fig. 30 are represented the k3-weighted Fourier transform moduli of theEXAFS spectra recorded for the double-implanted sample for both Cu and Ni K-edges;the peaks at about 2.2 A correspond to the metal-metal correlation, while the signalscentered at about 1.5 A are due to the metal-oxygen coordination. This is explained byassuming the coexistence of a metallic cluster phase and an oxidized phase, consistingof copper (nickel) ions at the cluster/glass interface and/or dispersed in the glass ma-trix [53]. The calculated metal-metal nearest-neighbor distance was 2.52 A, for both Cuand Ni K-edge measurements [53, 54]. The distance corresponds in the f.c.c. phase tothe lattice parameter of 3.56 A, in between those of the two metal phases, indicating theformation of a CuNi alloy phase (almost 1:1 Cu/Ni ratio). This finding is supported byGIXRD analysis on this sample [53], that indicates the presence of randomly-orientedf.c.c. nanoclusters, whose measured lattice parameter is 3.565± 0.01 nm, confirming thealloy formation.
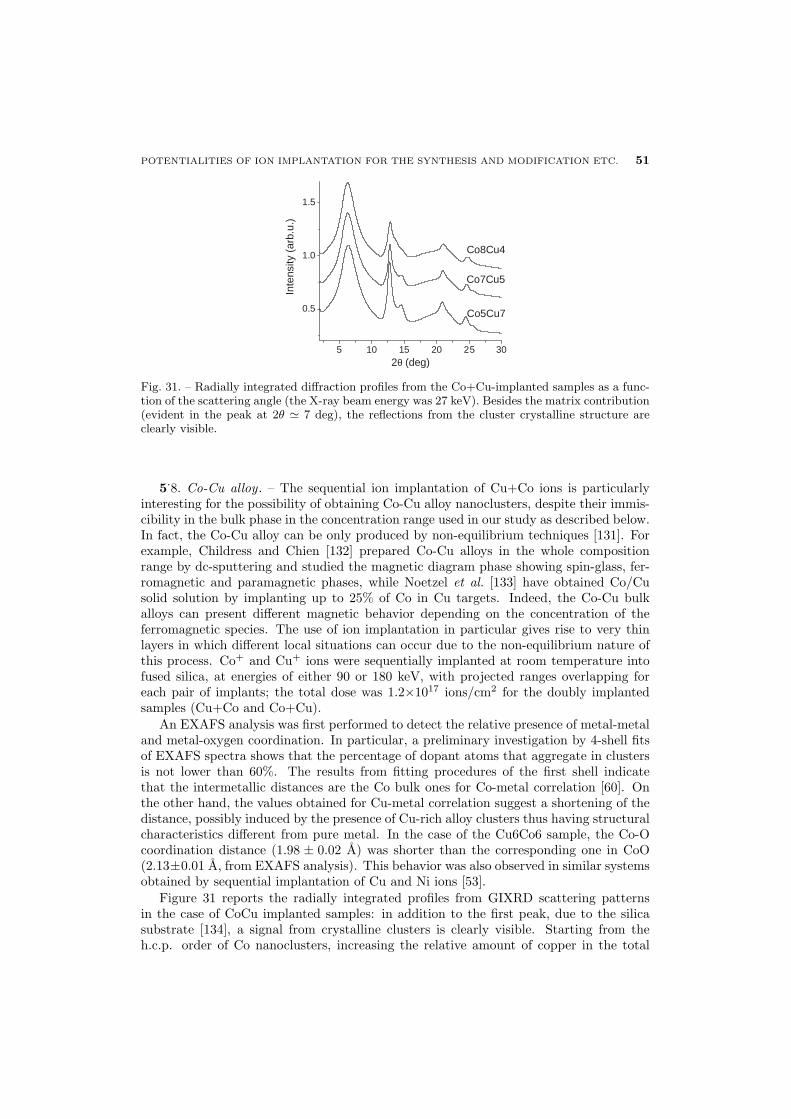
POTENTIALITIES OF ION IMPLANTATION FOR THE SYNTHESIS AND MODIFICATION ETC. 51
5 10 15 20 2 30
0.5
1.0
1.5
Co8Cu4
Co7Cu5
Co5Cu7
Inte
nsity
(arb
.u.)
2θ (deg)5
Fig. 31. – Radially integrated diffraction profiles from the Co+Cu-implanted samples as a func-tion of the scattering angle (the X-ray beam energy was 27 keV). Besides the matrix contribution(evident in the peak at 2θ ≃ 7 deg), the reflections from the cluster crystalline structure areclearly visible.
5.8. Co-Cu alloy . – The sequential ion implantation of Cu+Co ions is particularly
interesting for the possibility of obtaining Co-Cu alloy nanoclusters, despite their immis-cibility in the bulk phase in the concentration range used in our study as described below.In fact, the Co-Cu alloy can be only produced by non-equilibrium techniques [131]. Forexample, Childress and Chien [132] prepared Co-Cu alloys in the whole compositionrange by dc-sputtering and studied the magnetic diagram phase showing spin-glass, fer-romagnetic and paramagnetic phases, while Noetzel et al. [133] have obtained Co/Cusolid solution by implanting up to 25% of Co in Cu targets. Indeed, the Co-Cu bulkalloys can present different magnetic behavior depending on the concentration of theferromagnetic species. The use of ion implantation in particular gives rise to very thinlayers in which different local situations can occur due to the non-equilibrium nature ofthis process. Co+ and Cu+ ions were sequentially implanted at room temperature intofused silica, at energies of either 90 or 180 keV, with projected ranges overlapping foreach pair of implants; the total dose was 1.2×10¹⁷ ions/cm2 for the doubly implantedsamples (Cu+Co and Co+Cu).
An EXAFS analysis was first performed to detect the relative presence of metal-metaland metal-oxygen coordination. In particular, a preliminary investigation by 4-shell fitsof EXAFS spectra shows that the percentage of dopant atoms that aggregate in clustersis not lower than 60%. The results from fitting procedures of the first shell indicatethat the intermetallic distances are the Co bulk ones for Co-metal correlation [60]. Onthe other hand, the values obtained for Cu-metal correlation suggest a shortening of thedistance, possibly induced by the presence of Cu-rich alloy clusters thus having structuralcharacteristics different from pure metal. In the case of the Cu6Co6 sample, the Co-Ocoordination distance (1.98 ± 0.02 A) was shorter than the corresponding one in CoO(2.13±0.01 A, from EXAFS analysis). This behavior was also observed in similar systemsobtained by sequential implantation of Cu and Ni ions [53].
Figure 31 reports the radially integrated profiles from GIXRD scattering patternsin the case of CoCu implanted samples: in addition to the first peak, due to the silicasubstrate [134], a signal from crystalline clusters is clearly visible. Starting from theh.c.p. order of Co nanoclusters, increasing the relative amount of copper in the total
52 P. MAZZOLDI and G. MATTEI
amount of implanted metal (Co+Cu) leads to the progressively increasing peak heightsassociated with an f.c.c. crystalline structure. Cobalt aggregates in h.c.p. nanocrystalsif introduced in the matrix by ion implantation, while Cu does so in f.c.c. structures [53].On the other hand, following ref. [132], a CoCu alloy has an f.c.c. structure at up to80% cobalt. The features observed in fig. 31, supported by EXAFS results, suggestthat by sequential implantation of Co+Cu two family of nanocrystals are formed: one ofCo h.c.p. nanocrystals and the other of Cu-rich crystalline nanoclusters. No oxides aredetected.
5.9. Conclusions. – Sequential ion implantation, as a technique for the synthesis of
“mixed” (alloyed or core-shell) clusters, has been illustrated with some case studies in-volving either metallic or semiconducting systems. This technique is able to give in alarge variety of systems direct alloying: subsequent thermal annealing can be used tomodify either the clusters size distribution or the alloy composition, due to the selec-tive interaction of the annealing atmosphere with the alloy components. In particular,we demonstrated that annealing in oxidising atmosphere is more effective in the alloydecomposition with respect to annealing performed in reducing or inert atmospheres.The rich phenomenology gained in these complex systems will hopefully give a valuablecontribution to the comprehension of the mechanisms responsible for alloy formation andstability. As a last remark we would like to stress the fact that the implantation order ofthe two elements can have a relevant influence in the resulting nanophase mostly whenone of the two elements has a higher chemical affinity with the atoms in the matrix.
6. – Ion beam processing
Ion implantation can be used not only to dope a substrate with the implanted ionsbut also to release energy to the target in a controlled way in order to promote nucleationand growth of elements already present in the implanted substrate. Modification of thesubstrate structure can be done by ion-beam mixing experiments, in which an energeticheavy-mass ion beam (i.e. Au ions in the MeV energy range) promotes modification ofa metallic layered structure embedded in glass up to nanocluster formation [135, 136]in a sort of top-down synthesis approach in which ion beam “sculpture” of a bulk-likestructure is performed until the formation of the nano-building blocks (the nanoclusters)is obtained. In this approach the nuclear component of the energy loss Sn is the domi-nant mechanism to control the final nanostructure. An alternative method is based onirradiation with low-mass ions, in which the inelastic energy transferred by electronicinteraction is responsible for the precipitation of nanostructures.
6.1. Ion-beam–induced cluster precipitation. – A prototype of this last kind of approach
involves a glass containing a metal oxide: irradiating the glass with low-mass ions (He,for instance) or protons, the electronic component of the stopping power Se (which is thedominant mechanism of energy loss in such irradiations, see fig. 2) triggers metal clustersprecipitaton due to the energy inelastically transferred to the system [44,114,137,138,9].The metal oxide can be introduced in the glass either during its thermal synthesis (asin ref. [9] in which 0.08 wt% Cu2O oxide was present inside a soda-lime glass) or itcan be obtained by an intermediate step which involves ion-exchange between alkali ionsinside the glass with the noble-metal ions (as in refs. [114, 137] in which Na+ ⇀↽ Ag+
ion exchange is performed in a soda-lime glass). As regards this last approach, thetechnique of ion-exchange is very effective in doping much thicker layers with respectto ion implantation: few microns thick optical waveguides can, for instance, be easily
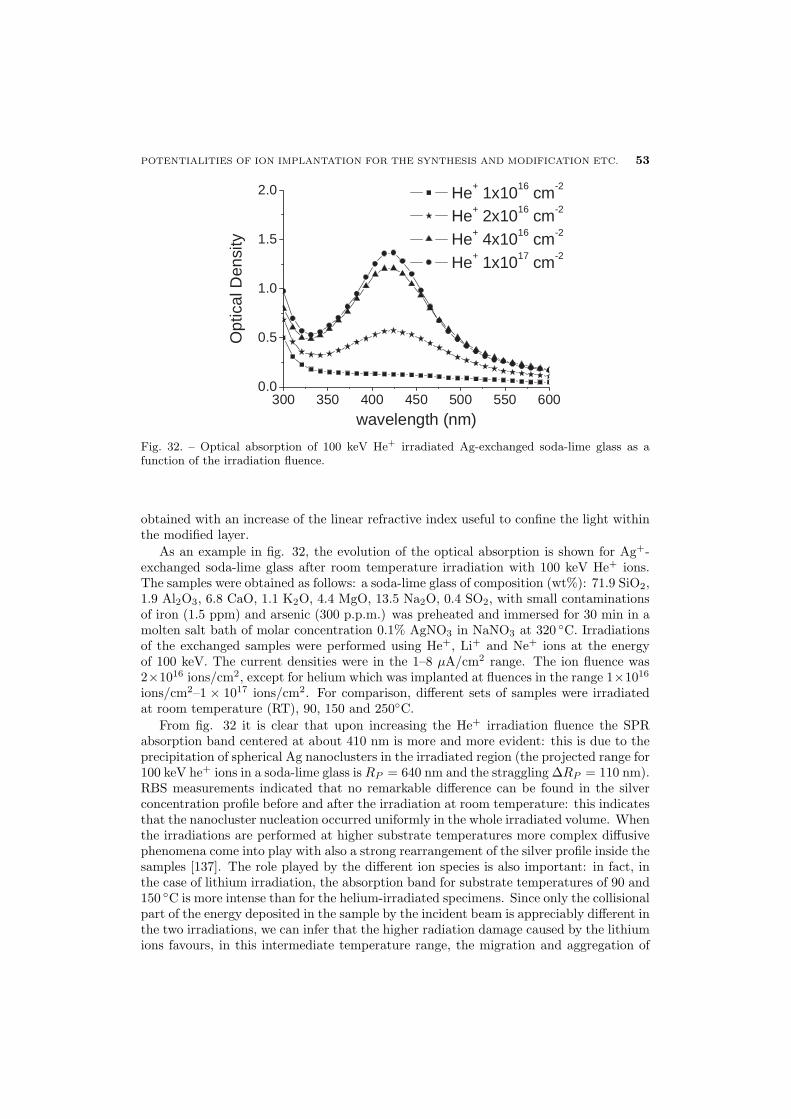
POTENTIALITIES OF ION IMPLANTATION FOR THE SYNTHESIS AND MODIFICATION ETC. 53
300 350 400 450 500 550 6000.0
0.5
1.0
1.5
2.0 He+ 1x1016 cm-2
He+ 2x1016 cm-2
He+ 4x1016 cm-2
He+ 1x1017 cm-2
Opt
ical
Den
sity
wavelength (nm)
Fig. 32. – Optical absorption of 100 keV He+ irradiated Ag-exchanged soda-lime glass as afunction of the irradiation fluence.
obtained with an increase of the linear refractive index useful to confine the light withinthe modified layer.
As an example in fig. 32, the evolution of the optical absorption is shown for Ag+-exchanged soda-lime glass after room temperature irradiation with 100 keV He+ ions.The samples were obtained as follows: a soda-lime glass of composition (wt%): 71.9 SiO2,1.9 Al2O3, 6.8 CaO, 1.1 K2O, 4.4 MgO, 13.5 Na2O, 0.4 SO2, with small contaminationsof iron (1.5 ppm) and arsenic (300 p.p.m.) was preheated and immersed for 30 min in amolten salt bath of molar concentration 0.1% AgNO3 in NaNO3 at 320 ◦C. Irradiationsof the exchanged samples were performed using He+, Li+ and Ne+ ions at the energyof 100 keV. The current densities were in the 1–8 µA/cm2 range. The ion fluence was2×1016 ions/cm2, except for helium which was implanted at fluences in the range 1×10¹⁶
ions/cm2–1 × 1017 ions/cm2. For comparison, different sets of samples were irradiatedat room temperature (RT), 90, 150 and 250◦C.
From fig. 32 it is clear that upon increasing the He+ irradiation fluence the SPRabsorption band centered at about 410 nm is more and more evident: this is due to theprecipitation of spherical Ag nanoclusters in the irradiated region (the projected range for100 keV he+ ions in a soda-lime glass is RP = 640 nm and the straggling ∆RP = 110 nm).RBS measurements indicated that no remarkable difference can be found in the silverconcentration profile before and after the irradiation at room temperature: this indicatesthat the nanocluster nucleation occurred uniformly in the whole irradiated volume. Whenthe irradiations are performed at higher substrate temperatures more complex diffusivephenomena come into play with also a strong rearrangement of the silver profile inside thesamples [137]. The role played by the different ion species is also important: in fact, inthe case of lithium irradiation, the absorption band for substrate temperatures of 90 and150 ◦C is more intense than for the helium-irradiated specimens. Since only the collisionalpart of the energy deposited in the sample by the incident beam is appreciably different inthe two irradiations, we can infer that the higher radiation damage caused by the lithiumions favours, in this intermediate temperature range, the migration and aggregation of
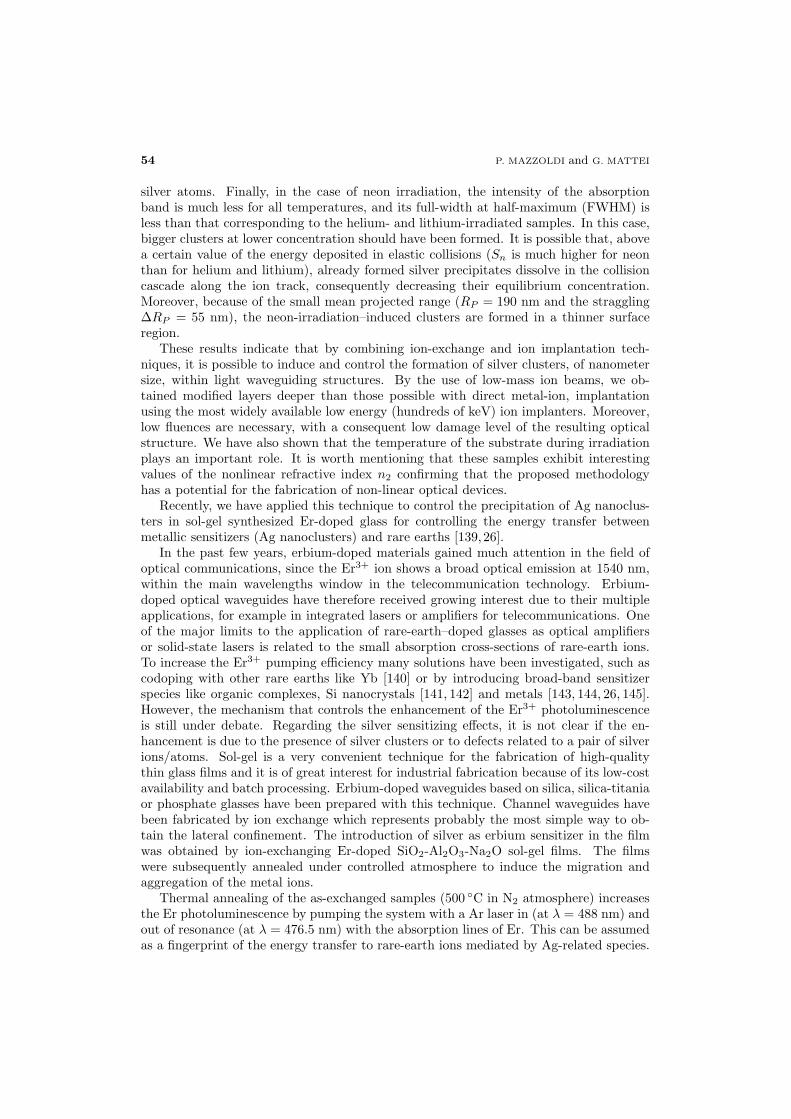
54 P. MAZZOLDI and G. MATTEI
silver atoms. Finally, in the case of neon irradiation, the intensity of the absorptionband is much less for all temperatures, and its full-width at half-maximum (FWHM) isless than that corresponding to the helium- and lithium-irradiated samples. In this case,bigger clusters at lower concentration should have been formed. It is possible that, abovea certain value of the energy deposited in elastic collisions (Sn is much higher for neonthan for helium and lithium), already formed silver precipitates dissolve in the collisioncascade along the ion track, consequently decreasing their equilibrium concentration.Moreover, because of the small mean projected range (RP = 190 nm and the straggling∆RP = 55 nm), the neon-irradiation–induced clusters are formed in a thinner surfaceregion.
These results indicate that by combining ion-exchange and ion implantation tech-niques, it is possible to induce and control the formation of silver clusters, of nanometersize, within light waveguiding structures. By the use of low-mass ion beams, we ob-tained modified layers deeper than those possible with direct metal-ion, implantationusing the most widely available low energy (hundreds of keV) ion implanters. Moreover,low fluences are necessary, with a consequent low damage level of the resulting opticalstructure. We have also shown that the temperature of the substrate during irradiationplays an important role. It is worth mentioning that these samples exhibit interestingvalues of the nonlinear refractive index n2 confirming that the proposed methodologyhas a potential for the fabrication of non-linear optical devices.
Recently, we have applied this technique to control the precipitation of Ag nanoclus-ters in sol-gel synthesized Er-doped glass for controlling the energy transfer betweenmetallic sensitizers (Ag nanoclusters) and rare earths [139,26].
In the past few years, erbium-doped materials gained much attention in the field ofoptical communications, since the Er3+ ion shows a broad optical emission at 1540 nm,within the main wavelengths window in the telecommunication technology. Erbium-doped optical waveguides have therefore received growing interest due to their multipleapplications, for example in integrated lasers or amplifiers for telecommunications. Oneof the major limits to the application of rare-earth–doped glasses as optical amplifiersor solid-state lasers is related to the small absorption cross-sections of rare-earth ions.To increase the Er3+ pumping efficiency many solutions have been investigated, such ascodoping with other rare earths like Yb [140] or by introducing broad-band sensitizerspecies like organic complexes, Si nanocrystals [141, 142] and metals [143, 144, 26, 145].However, the mechanism that controls the enhancement of the Er3+ photoluminescenceis still under debate. Regarding the silver sensitizing effects, it is not clear if the en-hancement is due to the presence of silver clusters or to defects related to a pair of silverions/atoms. Sol-gel is a very convenient technique for the fabrication of high-qualitythin glass films and it is of great interest for industrial fabrication because of its low-costavailability and batch processing. Erbium-doped waveguides based on silica, silica-titaniaor phosphate glasses have been prepared with this technique. Channel waveguides havebeen fabricated by ion exchange which represents probably the most simple way to ob-tain the lateral confinement. The introduction of silver as erbium sensitizer in the filmwas obtained by ion-exchanging Er-doped SiO2-Al2O3-Na2O sol-gel films. The filmswere subsequently annealed under controlled atmosphere to induce the migration andaggregation of the metal ions.
Thermal annealing of the as-exchanged samples (500 ◦C in N2 atmosphere) increasesthe Er photoluminescence by pumping the system with a Ar laser in (at λ = 488 nm) andout of resonance (at λ = 476.5 nm) with the absorption lines of Er. This can be assumedas a fingerprint of the energy transfer to rare-earth ions mediated by Ag-related species.
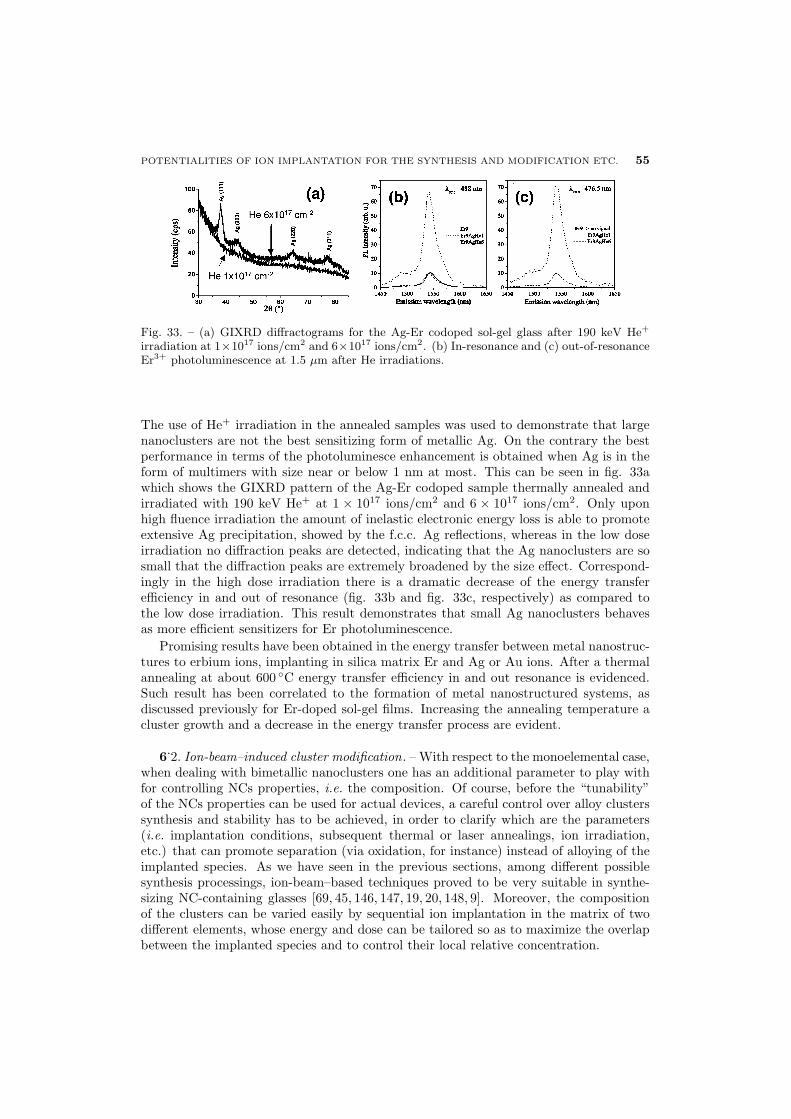
POTENTIALITIES OF ION IMPLANTATION FOR THE SYNTHESIS AND MODIFICATION ETC. 55
Fig. 33. – (a) GIXRD diffractograms for the Ag-Er codoped sol-gel glass after 190 keV He+
irradiation at 1×10¹⁷ ions/cm2 and 6×10¹⁷ ions/cm2. (b) In-resonance and (c) out-of-resonanceEr3+ photoluminescence at 1.5 µm after He irradiations.
The use of He+ irradiation in the annealed samples was used to demonstrate that largenanoclusters are not the best sensitizing form of metallic Ag. On the contrary the bestperformance in terms of the photoluminesce enhancement is obtained when Ag is in theform of multimers with size near or below 1 nm at most. This can be seen in fig. 33awhich shows the GIXRD pattern of the Ag-Er codoped sample thermally annealed andirradiated with 190 keV He+ at 1 × 10¹⁷ ions/cm2 and 6 × 10¹⁷ ions/cm2. Only uponhigh fluence irradiation the amount of inelastic electronic energy loss is able to promoteextensive Ag precipitation, showed by the f.c.c. Ag reflections, whereas in the low doseirradiation no diffraction peaks are detected, indicating that the Ag nanoclusters are sosmall that the diffraction peaks are extremely broadened by the size effect. Correspond-ingly in the high dose irradiation there is a dramatic decrease of the energy transferefficiency in and out of resonance (fig. 33b and fig. 33c, respectively) as compared tothe low dose irradiation. This result demonstrates that small Ag nanoclusters behavesas more efficient sensitizers for Er photoluminescence.
Promising results have been obtained in the energy transfer between metal nanostruc-tures to erbium ions, implanting in silica matrix Er and Ag or Au ions. After a thermalannealing at about 600 ◦C energy transfer efficiency in and out resonance is evidenced.Such result has been correlated to the formation of metal nanostructured systems, asdiscussed previously for Er-doped sol-gel films. Increasing the annealing temperature acluster growth and a decrease in the energy transfer process are evident.
6.2. Ion-beam–induced cluster modification. – With respect to the monoelemental case,
when dealing with bimetallic nanoclusters one has an additional parameter to play withfor controlling NCs properties, i.e. the composition. Of course, before the “tunability”of the NCs properties can be used for actual devices, a careful control over alloy clusterssynthesis and stability has to be achieved, in order to clarify which are the parameters(i.e. implantation conditions, subsequent thermal or laser annealings, ion irradiation,etc.) that can promote separation (via oxidation, for instance) instead of alloying of theimplanted species. As we have seen in the previous sections, among different possiblesynthesis processings, ion-beam–based techniques proved to be very suitable in synthe-sizing NC-containing glasses [69, 45, 146, 147, 19, 20, 148, 9]. Moreover, the compositionof the clusters can be varied easily by sequential ion implantation in the matrix of twodifferent elements, whose energy and dose can be tailored so as to maximize the overlapbetween the implanted species and to control their local relative concentration.
56 P. MAZZOLDI and G. MATTEI
6.2.1. Au-Cu alloy clusters. In this subsection we present two possible paths for pro-
moting an elemental-selective de-alloying in bimetallic AuxCu1−x nanoclusters [48]: thefirst one is controlled by the post-implantation thermal annealing, the latter is triggeredby the nuclear component of the energy released to the cluster by a suitable ion beam.As we will see, both methodologies can be exploited for making an elemental-selectivede-alloying.
De-alloying is usually described in terms of corrosion, as a selective dissolution ofthe most electro-chemically active element of the alloy [149]. This process results inthe formation of a nanoporous structure composed almost entirely of the more noblealloy constituent. As a room temperature (RT) process, dealloying is mainly assistedby the formation and migration of divacancies, which are known to diffuse faster thansingle vacancies at RT [150]. We will show that we can obtain also the inversion ofthis path (which is followed under chemically-driven de-alloying), therefore extractingpreferentially the more noble metal (Au, in our case) from the alloy.
Fused silica (Type II, Heraeus) slides were sequentially implanted with Au+ and Cu+
ions at room temperature at a current density of 2 µA/cm2, ion energies of 190 keV forAu and 90 keV for Cu and doses of 3×10¹⁶ ions/cm2 for both ions. Implanted slideswere then heat-treated in a conventional furnace at 900 ◦C temperature in a H2(4%)-N2
atmosphere. This is the reference sample, in the following labeled as Au3Cu3H. Thermalannealing in air at 900 ◦C in a conventional furnace was performed for increasing timeintervals, from 15 min upto 5 h. The reference samples were also ion-irradiated with190 keV Ne ions at a dose of 1×10¹⁷ ions/cm2 and 2 µA/cm2 of current density (withthese irradiation conditions we measured a temperature increase lower than 50 ◦C in thesample, therefore ruling out a major effect of the temperature).
In subsect. 5.1, we found that upon annealing in reducing atmosphere AuxCu1−x
alloy nanoclusters, formed after sequential ion implantation, change their compositionand grow, because of the Cu atoms (initially oxidized and dispersed in the matrix) re-duced and incorporated in the clusters upon annealing, resulting in a Au0.5Cu0.5 finalcomposition [24]. We used those results to obtain relatively large AuxCu1−x alloy nan-oclusters with negligible amount of oxidized Cu. The size distribution of the clustersin these reference samples exhibits an average diameter 〈D〉 = 13.8 nm and a standarddeviation of the experimental bimodal distribution σ = 11.7 nm. An additional featureof the reference samples is the topological distribution of the clusters. As can be seenin fig. 34(a), three distinct layers of well-separated spherical clusters are present: oneat the surface, one at the projected range of the original sequential implantation (about70 nm), and one at a depth of about 200 nm, i.e. the end of implantation damage [151].
A first attempt of obtaining a selective de-alloying was carried out with thermal an-nealing in oxidising (air) atmosphere. The TEM cross-sectional bright-field micrographsof the sample Au3Cu3H is shown in fig. 34(a) and (b), before and after a thermal an-nealing in air at 900 ◦C for 15 min, respectively. The effect of the annealing is to extractCu as Cu2O (cuprite, cubic, a = 0.4267 nm) as a first step. Cu2O is stabilized by thecrystallographic cubic template of the AuxCu1−x alloy, as can be seen from the selectedarea electron diffraction (SAED) pattern obtained from the area indicated by the dashedcircle in fig. 34(c). In this image couples of “twin spots” aligned in the radial directionindicate two coherent cubic phases with the crystallographic axes aligned, which can beindexed as an Au-rich AuxCu1−x alloy (x ∼ 0.9) and Cu2O (in fig. 34(d) the powderdiffraction spectra of both phases are compared). Further evidence of this interpene-trated structure can be obtained by EDS analysis. Scanning a 8 nm focused electronbeam on different areas of the twofold clusters indicated by arrows in fig. 34(b) a com-
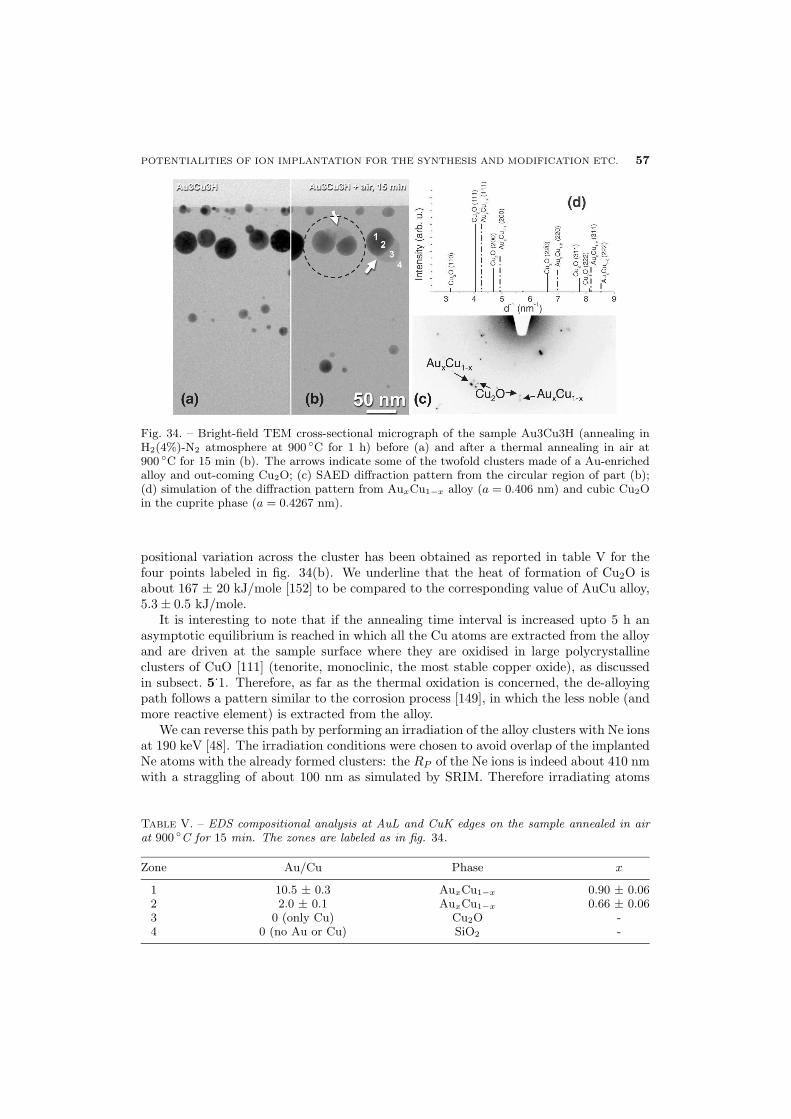
POTENTIALITIES OF ION IMPLANTATION FOR THE SYNTHESIS AND MODIFICATION ETC. 57
Fig. 34. – Bright-field TEM cross-sectional micrograph of the sample Au3Cu3H (annealing inH2(4%)-N2 atmosphere at 900 ◦C for 1 h) before (a) and after a thermal annealing in air at900 ◦C for 15 min (b). The arrows indicate some of the twofold clusters made of a Au-enrichedalloy and out-coming Cu2O; (c) SAED diffraction pattern from the circular region of part (b);(d) simulation of the diffraction pattern from AuxCu1−x alloy (a = 0.406 nm) and cubic Cu2Oin the cuprite phase (a = 0.4267 nm).
positional variation across the cluster has been obtained as reported in table V for thefour points labeled in fig. 34(b). We underline that the heat of formation of Cu2O isabout 167 ± 20 kJ/mole [152] to be compared to the corresponding value of AuCu alloy,5.3 ± 0.5 kJ/mole.
It is interesting to note that if the annealing time interval is increased upto 5 h anasymptotic equilibrium is reached in which all the Cu atoms are extracted from the alloyand are driven at the sample surface where they are oxidised in large polycrystallineclusters of CuO [111] (tenorite, monoclinic, the most stable copper oxide), as discussedin subsect. 5
.1. Therefore, as far as the thermal oxidation is concerned, the de-alloying
path follows a pattern similar to the corrosion process [149], in which the less noble (andmore reactive element) is extracted from the alloy.
We can reverse this path by performing an irradiation of the alloy clusters with Ne ionsat 190 keV [48]. The irradiation conditions were chosen to avoid overlap of the implantedNe atoms with the already formed clusters: the RP of the Ne ions is indeed about 410 nmwith a straggling of about 100 nm as simulated by SRIM. Therefore irradiating atoms
Table V. – EDS compositional analysis at AuL and CuK edges on the sample annealed in airat 900 ◦C for 15 min. The zones are labeled as in fig. 34.
Zone Au/Cu Phase x
1 10.5 ± 0.3 AuxCu1−x 0.90 ± 0.062 2.0 ± 0.1 AuxCu1−x 0.66 ± 0.063 0 (only Cu) Cu2O -4 0 (no Au or Cu) SiO2 -
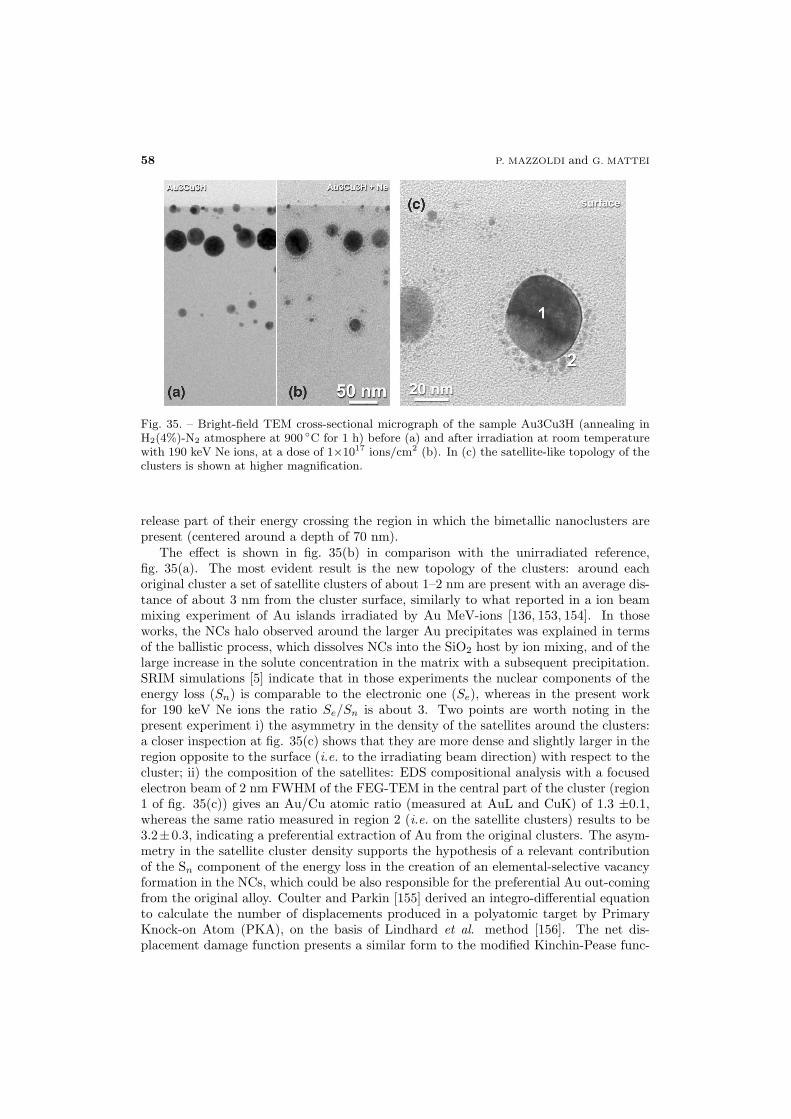
58 P. MAZZOLDI and G. MATTEI
Fig. 35. – Bright-field TEM cross-sectional micrograph of the sample Au3Cu3H (annealing inH2(4%)-N2 atmosphere at 900 ◦C for 1 h) before (a) and after irradiation at room temperaturewith 190 keV Ne ions, at a dose of 1×10¹⁷ ions/cm2 (b). In (c) the satellite-like topology of theclusters is shown at higher magnification.
release part of their energy crossing the region in which the bimetallic nanoclusters arepresent (centered around a depth of 70 nm).
The effect is shown in fig. 35(b) in comparison with the unirradiated reference,fig. 35(a). The most evident result is the new topology of the clusters: around eachoriginal cluster a set of satellite clusters of about 1–2 nm are present with an average dis-tance of about 3 nm from the cluster surface, similarly to what reported in a ion beammixing experiment of Au islands irradiated by Au MeV-ions [136, 153, 154]. In thoseworks, the NCs halo observed around the larger Au precipitates was explained in termsof the ballistic process, which dissolves NCs into the SiO2 host by ion mixing, and of thelarge increase in the solute concentration in the matrix with a subsequent precipitation.SRIM simulations [5] indicate that in those experiments the nuclear components of theenergy loss (Sn) is comparable to the electronic one (Se), whereas in the present workfor 190 keV Ne ions the ratio Se/Sn is about 3. Two points are worth noting in thepresent experiment i) the asymmetry in the density of the satellites around the clusters:a closer inspection at fig. 35(c) shows that they are more dense and slightly larger in theregion opposite to the surface (i.e. to the irradiating beam direction) with respect to thecluster; ii) the composition of the satellites: EDS compositional analysis with a focusedelectron beam of 2 nm FWHM of the FEG-TEM in the central part of the cluster (region1 of fig. 35(c)) gives an Au/Cu atomic ratio (measured at AuL and CuK) of 1.3 ±0.1,whereas the same ratio measured in region 2 (i.e. on the satellite clusters) results to be3.2±0.3, indicating a preferential extraction of Au from the original clusters. The asym-metry in the satellite cluster density supports the hypothesis of a relevant contributionof the Sn component of the energy loss in the creation of an elemental-selective vacancyformation in the NCs, which could be also responsible for the preferential Au out-comingfrom the original alloy. Coulter and Parkin [155] derived an integro-differential equationto calculate the number of displacements produced in a polyatomic target by PrimaryKnock-on Atom (PKA), on the basis of Lindhard et al. method [156]. The net dis-placement damage function presents a similar form to the modified Kinchin-Pease func-
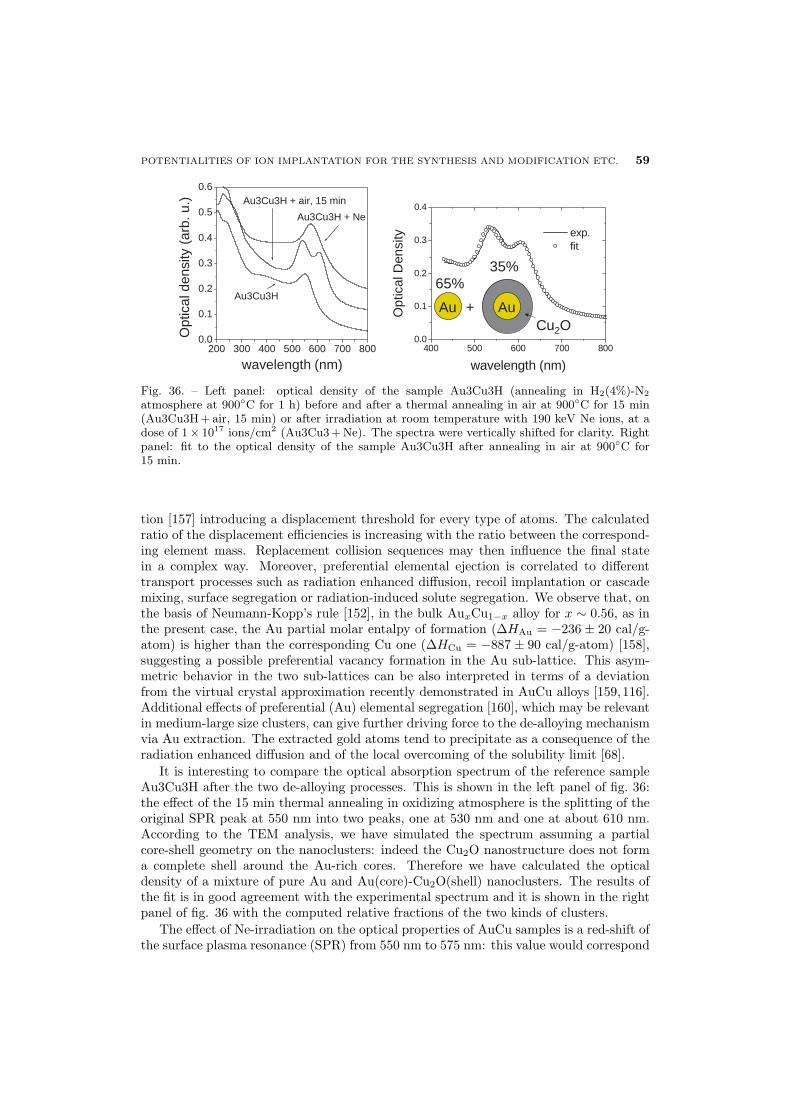
POTENTIALITIES OF ION IMPLANTATION FOR THE SYNTHESIS AND MODIFICATION ETC. 59
200 300 400 500 600 700 8000.0
0.1
0.2
0.3
0.4
0.5
0.6
Au3Cu3H + Ne
Au3Cu3H + air, 15 min
Au3Cu3H
Opt
ical
dens
ity(a
rb.u
.)
wavelength (nm)400 500 600 700 800
0.0
0.1
0.2
0.3
0.4
exp.fit
Opt
ical
Den
sity
wavelength (nm)
Au Au+Cu2O
65%35%
Fig. 36. – Left panel: optical density of the sample Au3Cu3H (annealing in H2(4%)-N2
atmosphere at 900◦C for 1 h) before and after a thermal annealing in air at 900◦C for 15 min(Au3Cu3H+air, 15 min) or after irradiation at room temperature with 190 keV Ne ions, at adose of 1× 10¹⁷ ions/cm2 (Au3Cu3+Ne). The spectra were vertically shifted for clarity. Rightpanel: fit to the optical density of the sample Au3Cu3H after annealing in air at 900◦C for15 min.
tion [157] introducing a displacement threshold for every type of atoms. The calculatedratio of the displacement efficiencies is increasing with the ratio between the correspond-ing element mass. Replacement collision sequences may then influence the final statein a complex way. Moreover, preferential elemental ejection is correlated to differenttransport processes such as radiation enhanced diffusion, recoil implantation or cascademixing, surface segregation or radiation-induced solute segregation. We observe that, onthe basis of Neumann-Kopp’s rule [152], in the bulk AuxCu1−x alloy for x ∼ 0.56, as inthe present case, the Au partial molar entalpy of formation (∆HAu = −236 ± 20 cal/g-atom) is higher than the corresponding Cu one (∆HCu = −887 ± 90 cal/g-atom) [158],suggesting a possible preferential vacancy formation in the Au sub-lattice. This asym-metric behavior in the two sub-lattices can be also interpreted in terms of a deviationfrom the virtual crystal approximation recently demonstrated in AuCu alloys [159,116].Additional effects of preferential (Au) elemental segregation [160], which may be relevantin medium-large size clusters, can give further driving force to the de-alloying mechanismvia Au extraction. The extracted gold atoms tend to precipitate as a consequence of theradiation enhanced diffusion and of the local overcoming of the solubility limit [68].
It is interesting to compare the optical absorption spectrum of the reference sampleAu3Cu3H after the two de-alloying processes. This is shown in the left panel of fig. 36:the effect of the 15 min thermal annealing in oxidizing atmosphere is the splitting of theoriginal SPR peak at 550 nm into two peaks, one at 530 nm and one at about 610 nm.According to the TEM analysis, we have simulated the spectrum assuming a partialcore-shell geometry on the nanoclusters: indeed the Cu2O nanostructure does not forma complete shell around the Au-rich cores. Therefore we have calculated the opticaldensity of a mixture of pure Au and Au(core)-Cu2O(shell) nanoclusters. The results ofthe fit is in good agreement with the experimental spectrum and it is shown in the rightpanel of fig. 36 with the computed relative fractions of the two kinds of clusters.
The effect of Ne-irradiation on the optical properties of AuCu samples is a red-shift ofthe surface plasma resonance (SPR) from 550 nm to 575 nm: this value would correspond
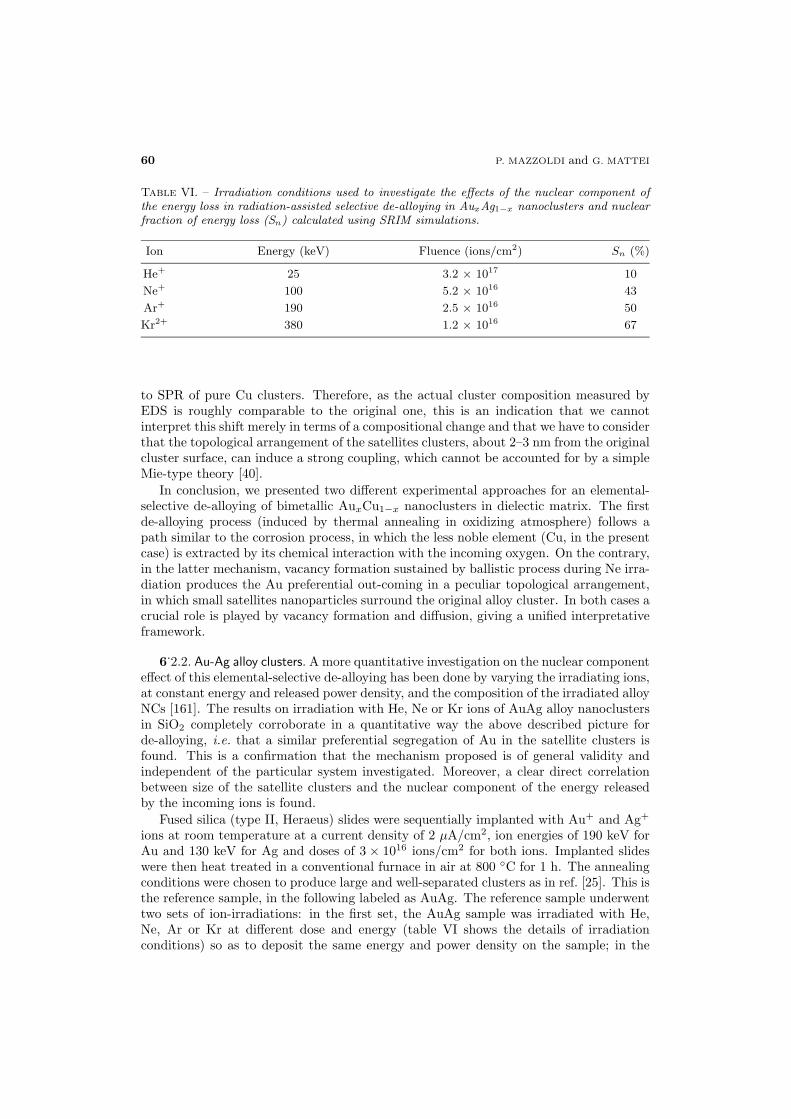
60 P. MAZZOLDI and G. MATTEI
Table VI. – Irradiation conditions used to investigate the effects of the nuclear component ofthe energy loss in radiation-assisted selective de-alloying in AuxAg1−x nanoclusters and nuclearfraction of energy loss (Sn) calculated using SRIM simulations.
Ion Energy (keV) Fluence (ions/cm2) Sn (%)
He+ 25 3.2 × 10¹⁷ 10
Ne+ 100 5.2 × 10¹⁶ 43
Ar+ 190 2.5 × 10¹⁶ 50
Kr2+ 380 1.2 × 10¹⁶ 67
to SPR of pure Cu clusters. Therefore, as the actual cluster composition measured byEDS is roughly comparable to the original one, this is an indication that we cannotinterpret this shift merely in terms of a compositional change and that we have to considerthat the topological arrangement of the satellites clusters, about 2–3 nm from the originalcluster surface, can induce a strong coupling, which cannot be accounted for by a simpleMie-type theory [40].
In conclusion, we presented two different experimental approaches for an elemental-selective de-alloying of bimetallic AuxCu1−x nanoclusters in dielectic matrix. The firstde-alloying process (induced by thermal annealing in oxidizing atmosphere) follows apath similar to the corrosion process, in which the less noble element (Cu, in the presentcase) is extracted by its chemical interaction with the incoming oxygen. On the contrary,in the latter mechanism, vacancy formation sustained by ballistic process during Ne irra-diation produces the Au preferential out-coming in a peculiar topological arrangement,in which small satellites nanoparticles surround the original alloy cluster. In both cases acrucial role is played by vacancy formation and diffusion, giving a unified interpretativeframework.
6.2.2. Au-Ag alloy clusters. A more quantitative investigation on the nuclear component
effect of this elemental-selective de-alloying has been done by varying the irradiating ions,at constant energy and released power density, and the composition of the irradiated alloyNCs [161]. The results on irradiation with He, Ne or Kr ions of AuAg alloy nanoclustersin SiO2 completely corroborate in a quantitative way the above described picture forde-alloying, i.e. that a similar preferential segregation of Au in the satellite clusters isfound. This is a confirmation that the mechanism proposed is of general validity andindependent of the particular system investigated. Moreover, a clear direct correlationbetween size of the satellite clusters and the nuclear component of the energy releasedby the incoming ions is found.
Fused silica (type II, Heraeus) slides were sequentially implanted with Au+ and Ag+
ions at room temperature at a current density of 2 µA/cm2, ion energies of 190 keV forAu and 130 keV for Ag and doses of 3 × 10¹⁶ ions/cm2 for both ions. Implanted slideswere then heat treated in a conventional furnace in air at 800 ◦C for 1 h. The annealingconditions were chosen to produce large and well-separated clusters as in ref. [25]. This isthe reference sample, in the following labeled as AuAg. The reference sample underwenttwo sets of ion-irradiations: in the first set, the AuAg sample was irradiated with He,Ne, Ar or Kr at different dose and energy (table VI shows the details of irradiationconditions) so as to deposit the same energy and power density on the sample; in the
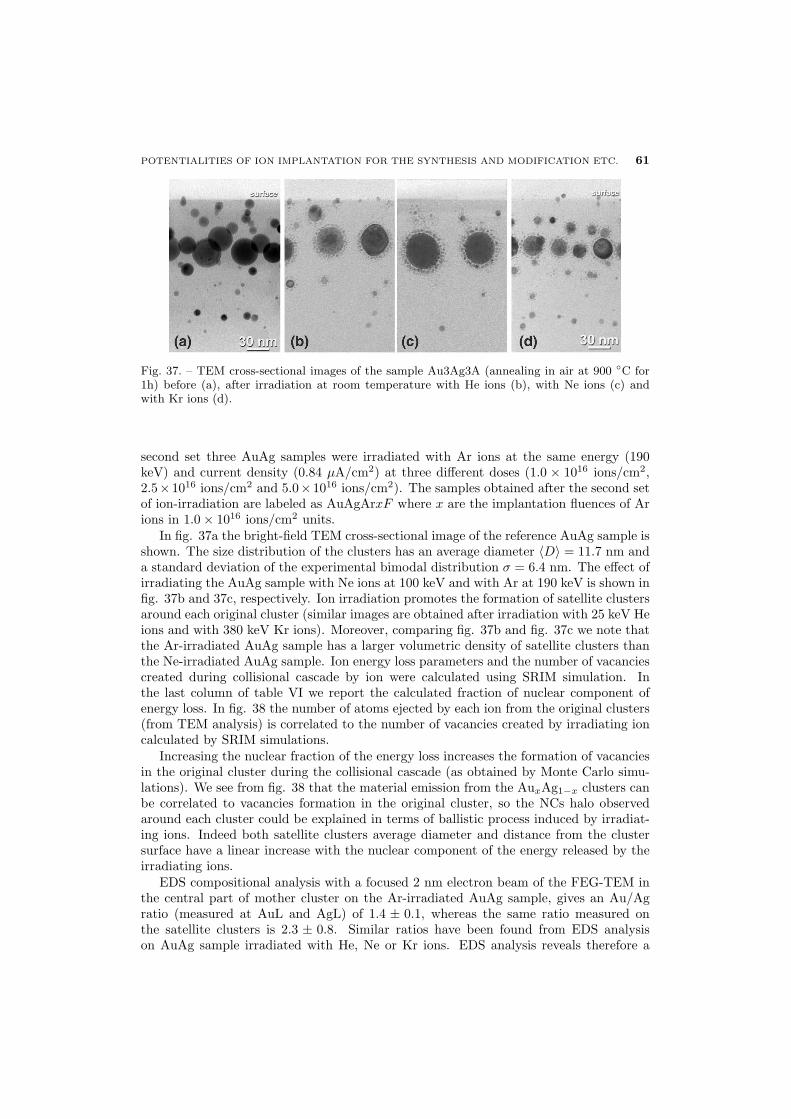
POTENTIALITIES OF ION IMPLANTATION FOR THE SYNTHESIS AND MODIFICATION ETC. 61
Fig. 37. – TEM cross-sectional images of the sample Au3Ag3A (annealing in air at 900 ◦C for1h) before (a), after irradiation at room temperature with He ions (b), with Ne ions (c) andwith Kr ions (d).
second set three AuAg samples were irradiated with Ar ions at the same energy (190keV) and current density (0.84 µA/cm2) at three different doses (1.0 × 10¹⁶ ions/cm2,2.5×1016 ions/cm2 and 5.0×10¹⁶ ions/cm2). The samples obtained after the second setof ion-irradiation are labeled as AuAgArxF where x are the implantation fluences of Arions in 1.0 × 10¹⁶ ions/cm2 units.
In fig. 37a the bright-field TEM cross-sectional image of the reference AuAg sample isshown. The size distribution of the clusters has an average diameter 〈D〉 = 11.7 nm anda standard deviation of the experimental bimodal distribution σ = 6.4 nm. The effect ofirradiating the AuAg sample with Ne ions at 100 keV and with Ar at 190 keV is shown infig. 37b and 37c, respectively. Ion irradiation promotes the formation of satellite clustersaround each original cluster (similar images are obtained after irradiation with 25 keV Heions and with 380 keV Kr ions). Moreover, comparing fig. 37b and fig. 37c we note thatthe Ar-irradiated AuAg sample has a larger volumetric density of satellite clusters thanthe Ne-irradiated AuAg sample. Ion energy loss parameters and the number of vacanciescreated during collisional cascade by ion were calculated using SRIM simulation. Inthe last column of table VI we report the calculated fraction of nuclear component ofenergy loss. In fig. 38 the number of atoms ejected by each ion from the original clusters(from TEM analysis) is correlated to the number of vacancies created by irradiating ioncalculated by SRIM simulations.
Increasing the nuclear fraction of the energy loss increases the formation of vacanciesin the original cluster during the collisional cascade (as obtained by Monte Carlo simu-lations). We see from fig. 38 that the material emission from the AuxAg1−x clusters canbe correlated to vacancies formation in the original cluster, so the NCs halo observedaround each cluster could be explained in terms of ballistic process induced by irradiat-ing ions. Indeed both satellite clusters average diameter and distance from the clustersurface have a linear increase with the nuclear component of the energy released by theirradiating ions.
EDS compositional analysis with a focused 2 nm electron beam of the FEG-TEM inthe central part of mother cluster on the Ar-irradiated AuAg sample, gives an Au/Agratio (measured at AuL and AgL) of 1.4 ± 0.1, whereas the same ratio measured onthe satellite clusters is 2.3 ± 0.8. Similar ratios have been found from EDS analysison AuAg sample irradiated with He, Ne or Kr ions. EDS analysis reveals therefore a
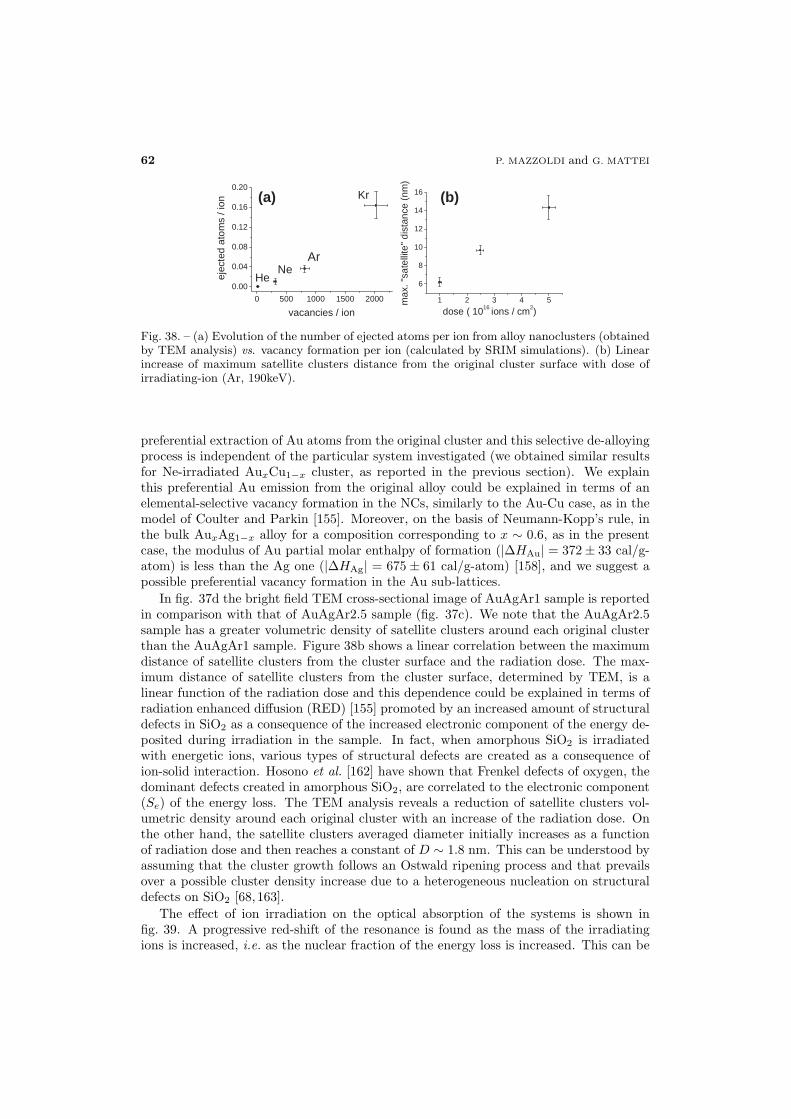
62 P. MAZZOLDI and G. MATTEI
0 500 1000 1500 2000
0.00
0.04
0.08
0.12
0.16
0.20Kr
ArNe
Heejec
ted
atom
s/i
on
vacancies / ion1 2 3 4 5
6
8
10
12
14
16
max
."sa
telli
te"
dist
ance
(nm
)
dose ( 1016 ions / cm2)
(a) (b)
Fig. 38. – (a) Evolution of the number of ejected atoms per ion from alloy nanoclusters (obtainedby TEM analysis) vs. vacancy formation per ion (calculated by SRIM simulations). (b) Linearincrease of maximum satellite clusters distance from the original cluster surface with dose ofirradiating-ion (Ar, 190keV).
preferential extraction of Au atoms from the original cluster and this selective de-alloyingprocess is independent of the particular system investigated (we obtained similar resultsfor Ne-irradiated AuxCu1−x cluster, as reported in the previous section). We explainthis preferential Au emission from the original alloy could be explained in terms of anelemental-selective vacancy formation in the NCs, similarly to the Au-Cu case, as in themodel of Coulter and Parkin [155]. Moreover, on the basis of Neumann-Kopp’s rule, inthe bulk AuxAg1−x alloy for a composition corresponding to x ∼ 0.6, as in the presentcase, the modulus of Au partial molar enthalpy of formation (|∆HAu| = 372 ± 33 cal/g-atom) is less than the Ag one (|∆HAg| = 675 ± 61 cal/g-atom) [158], and we suggest apossible preferential vacancy formation in the Au sub-lattices.
In fig. 37d the bright field TEM cross-sectional image of AuAgAr1 sample is reportedin comparison with that of AuAgAr2.5 sample (fig. 37c). We note that the AuAgAr2.5sample has a greater volumetric density of satellite clusters around each original clusterthan the AuAgAr1 sample. Figure 38b shows a linear correlation between the maximumdistance of satellite clusters from the cluster surface and the radiation dose. The max-imum distance of satellite clusters from the cluster surface, determined by TEM, is alinear function of the radiation dose and this dependence could be explained in terms ofradiation enhanced diffusion (RED) [155] promoted by an increased amount of structuraldefects in SiO2 as a consequence of the increased electronic component of the energy de-posited during irradiation in the sample. In fact, when amorphous SiO2 is irradiatedwith energetic ions, various types of structural defects are created as a consequence ofion-solid interaction. Hosono et al. [162] have shown that Frenkel defects of oxygen, thedominant defects created in amorphous SiO2, are correlated to the electronic component(Se) of the energy loss. The TEM analysis reveals a reduction of satellite clusters vol-umetric density around each original cluster with an increase of the radiation dose. Onthe other hand, the satellite clusters averaged diameter initially increases as a functionof radiation dose and then reaches a constant of D ∼ 1.8 nm. This can be understood byassuming that the cluster growth follows an Ostwald ripening process and that prevailsover a possible cluster density increase due to a heterogeneous nucleation on structuraldefects on SiO2 [68, 163].
The effect of ion irradiation on the optical absorption of the systems is shown infig. 39. A progressive red-shift of the resonance is found as the mass of the irradiatingions is increased, i.e. as the nuclear fraction of the energy loss is increased. This can be
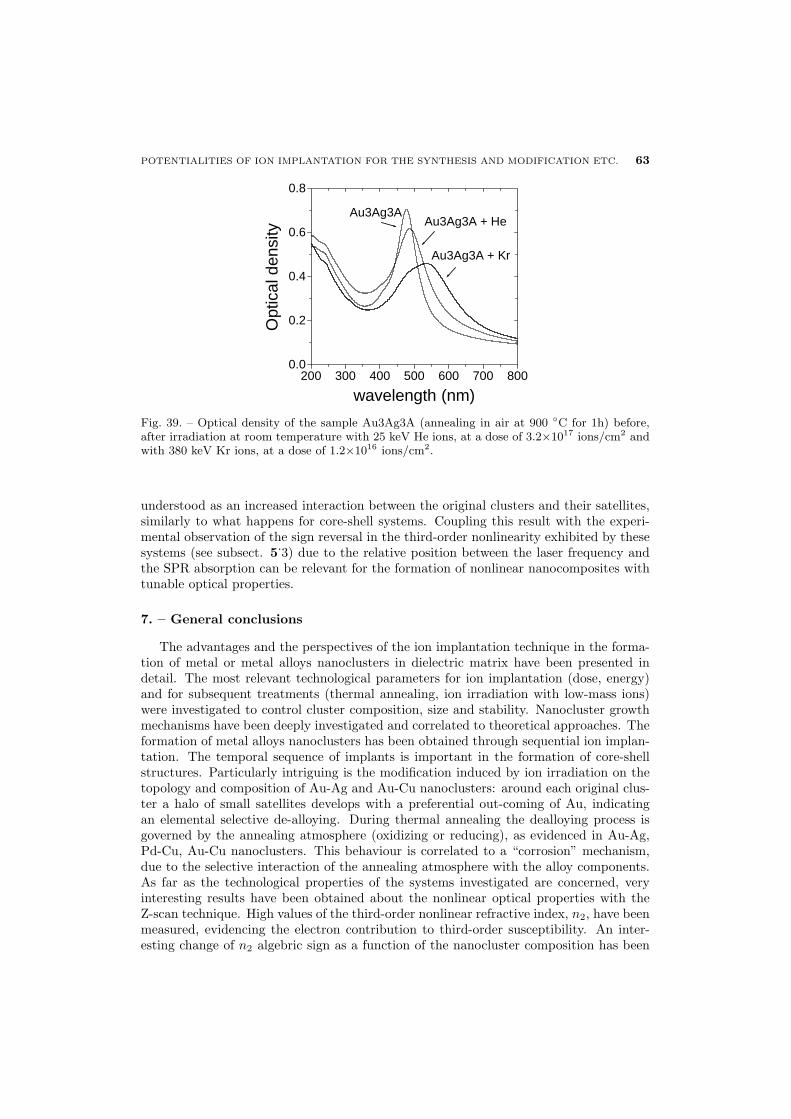
POTENTIALITIES OF ION IMPLANTATION FOR THE SYNTHESIS AND MODIFICATION ETC. 63
200 300 400 500 600 700 8000.0
0.2
0.4
0.6
0.8
Au3Ag3A + Kr
Au3Ag3A + HeAu3Ag3A
Opt
ical
dens
ity
wavelength (nm)
Fig. 39. – Optical density of the sample Au3Ag3A (annealing in air at 900 ◦C for 1h) before,after irradiation at room temperature with 25 keV He ions, at a dose of 3.2×10¹⁷ ions/cm2 andwith 380 keV Kr ions, at a dose of 1.2×10¹⁶ ions/cm2.
understood as an increased interaction between the original clusters and their satellites,similarly to what happens for core-shell systems. Coupling this result with the experi-mental observation of the sign reversal in the third-order nonlinearity exhibited by thesesystems (see subsect. 5
.3) due to the relative position between the laser frequency and
the SPR absorption can be relevant for the formation of nonlinear nanocomposites withtunable optical properties.
7. – General conclusions
The advantages and the perspectives of the ion implantation technique in the forma-tion of metal or metal alloys nanoclusters in dielectric matrix have been presented indetail. The most relevant technological parameters for ion implantation (dose, energy)and for subsequent treatments (thermal annealing, ion irradiation with low-mass ions)were investigated to control cluster composition, size and stability. Nanocluster growthmechanisms have been deeply investigated and correlated to theoretical approaches. Theformation of metal alloys nanoclusters has been obtained through sequential ion implan-tation. The temporal sequence of implants is important in the formation of core-shellstructures. Particularly intriguing is the modification induced by ion irradiation on thetopology and composition of Au-Ag and Au-Cu nanoclusters: around each original clus-ter a halo of small satellites develops with a preferential out-coming of Au, indicatingan elemental selective de-alloying. During thermal annealing the dealloying process isgoverned by the annealing atmosphere (oxidizing or reducing), as evidenced in Au-Ag,Pd-Cu, Au-Cu nanoclusters. This behaviour is correlated to a “corrosion” mechanism,due to the selective interaction of the annealing atmosphere with the alloy components.As far as the technological properties of the systems investigated are concerned, veryinteresting results have been obtained about the nonlinear optical properties with theZ-scan technique. High values of the third-order nonlinear refractive index, n2, have beenmeasured, evidencing the electron contribution to third-order susceptibility. An inter-esting change of n2 algebric sign as a function of the nanocluster composition has been
64 P. MAZZOLDI and G. MATTEI
evidenced. Metal nanoclusters doped glasses represent a new branch of optical materialsand are potentially useful for many applications in digital optical processing, optoelec-tronics, integrated and nano-optics. Much experimental and theoretical effort is focusedon the unique physical properties of these materials, which are quite different from thoseof the bulk matrix materials and depend on the cluster size, shape and packing density.In the huge volume of work in the field of materials science for nano-scale applications,nanocluster-doped glasses have become one of the most promising materials. Interestingperspectives are present for dielectric materials containing magnetic nanoclusters. Ionimplantation technique presents, in this field, peculiar characteristic related to a controlof the composition of nanostructured materials, cluster size and a technological approach,derived by the long activity in microelectronics.
∗ ∗ ∗We would like to gratefully acknowledge the work and the collaboration of the people
at the Department of Physics of the University of Padova (V. Bello, C. de Julian
Fernandez, G. De Marchi, C. Maurizio, C. Sada, C. Scian, E. Trave), Venezia(G. Battaglin, E. Cattaruzza, F. Gonella) and Trento (A. Miotello, A. Qua-
ranta).
REFERENCES
[1] Mazzoldi P., Mattei G., Maurizio C., Cattaruzza E. and Gonella F., MetalAlloy Nanoclusters by Ion Implantation in Silica, in Engineering Thin Films andNanostructures with Ion Beams, Chapt. 7, edited by Emile Knystautas (CRC Press)2005, pp. 81-158.
[2] Mazzoldi P., Arnold G. W., Battaglin G., Gonella F. and Haglund R. Jr., J.Nonlin. Opt. Phys. Mat., 5 (1996) 285.
[3] Gonella F. and Mazzoldi P., Metal Nanocluster Composite Glasses, in Handbook ofNanostructured Materials and Nanotechnology, edited by Nalwa H. S., Vol. 4 (AcademicPress, S. Diego) 2000, pp. 81-158.
[4] Mazzoldi P. and Arnold G. W., Ion Beam Modification of Insulators (Elsevier SciencePublisher B. V.) 1987.
[5] Ziegler J. F., Biersack J. P. and Littmark U. (Pergamon, New York) 1985.[6] Moller W. and Eckstein W., Nucl. Instrum. Methods in Phys. Res. B, 2 (1984) 814.[7] Konoplev V., Radiat. Eff. Lett., 87 (1986) 207.[8] Stepanov A., Zhikharev V., Hole D., Townsend P. and Khaibullin I., Nucl.
Instrum. Methods B, 166-167 (2000) 26.[9] Valentin E., Bernas H., Ricolleau C. and Creuzet F., Phys. Rev. Lett., 86 (2001)
99.[10] Perez A., Marest G., Sawicka B., Sawicki J. and Tyliszczac T., Phys. Rev. B, 28
(1983) 1227.[11] Perez A., Nucl. Instrum. Methods B, 1 (1984) 621.[12] Futagami T., Aoki Y., Yoda O. and Nagai S., Nucl. Instrum. Methods B, 88 (1994)
261.[13] Hosono H., Jpn. J. Appl. Phys., 32 (1993) 3892.[14] Hosono H. and Matsunami N., Phys. Rev. B, 48 (1993) 13469.[15] Hosono H. and Imagawa H., Nucl. Instrum. Methods in Phys. Res. B, 91 (1994) 510.[16] Cattaruzza E., Nucl. Instrum. Methods B, 169 (2000) 141.[17] Kelly R., Mater. Sci. Eng. A, 115 (1989) 11.[18] Hosono H., Phys. Rev. Lett., 74 (1995) 110.[19] Battaglin G., Nucl. Instrum. Methods B, 116 (1996) 102.
POTENTIALITIES OF ION IMPLANTATION FOR THE SYNTHESIS AND MODIFICATION ETC. 65
[20] Gonella F., Nucl. Instrum. Methods B, 166-167 (2000) 831.[21] Magruder III R. H., Wittig J. E. and Zuhr R. A., J. Non-Cryst. Solids, 163 (1993)
162.[22] Magruder III R. H., Osborne Jr. D. H. and Zuhr R. A., J. Non-Cryst. Solids, 176
(1994) 299.[23] Cattaruzza E., Battaglin G., Polloni R., Cesca T., Gonella F., Mattei G.,
Maurizio C., Mazzoldi P., D’Acapito F., Zontone F. and Bertoncello R., Nucl.Instrum. Methods B, 148 (1999) 1007.
[24] Gonella F., Mattei G., Mazzoldi P., Sada C., Battaglin G. and Cattaruzza E.,Appl. Phys. Lett., 75 (1999) 55.
[25] Mattei G., Nucl. Instrum. Methods B, 191 (2002) 323.[26] Martucci A., de Nuntis M., Ribaudo A., Guglielmi M., Padovani S., Enrichi F.,
Mattei G., Mazzoldi P., Sada C., Trave E., Battaglin G., Gonella F., Borsella
E., Falconieri M., Patrini M. and Fick J., Appl. Phys. A, 80 (2005) 557.[27] Respaud M., Broto J. M., Rakoto H., Fert A., Thomas L., Barbara B., Verelst
M., Snoeck E., Lecante P., Mosset A., Osuna J., Ely T. O., Amiens C. andChaudret B., Phys. Rev. B, 57 (1998) 2925.
[28] Tihay F., Pourroy G. M., Roger A. C. and Kienneman A., Appl. Catalysis A, 206(2000) 24.
[29] Faraday M., Philos. Trans. R. Soc., 147 (1857) 145.[30] Maxwell-Garnett J. C., Philos. Trans. R. Soc. A, 203 (1904) 385.[31] Maxwell-Garnett J. C., Philos. Trans. R. Soc. A, 205 (1904) 237.[32] Mie G., Ann. Phys. (Leipzig), 25 (1908) 377.[33] Flytzanis C., Hache F., Klein M., Ricard D. and Roussignol P., Progr. Opt., 29
(1991) 321.[34] Mazzoldi P. and Righini G., Glasses for optoelectronic devices, in Insulating Materials
for Optoelectronics, edited by Agullo-Lopez F. (World Scientific, Singapore) 1995, pp.367-392.
[35] Haglund Jr. R. F., Quantum-dot composites for nonlinear optical applications, inHandbook of Optical Properties II: Optics of Small Particles, Interfaces, and Surfaces,edited by Hummel R. E. and Wissmann P., Vol. 2, p. 191 (CRC Press, New York)1997.
[36] Perenboom J. and Wyder P., Phys. Rep., 78 (1981) 173.[37] Halperin W., Rev. Mod. Phys., 58 (1986) 533.[38] Hache F., Ricard D. and Girard C., Phys. Rev. B, 38 (1988) 7990.[39] Haus J., Kalyaniwalla N., Inguva R., Bloemer M. and Bowden C., J. Opt. Soc.
Am. B, 6 (1988) 797.[40] Kreibig U. and Vollmer M., Optical Properties of Metal Clusters (Springer-Verlag,
Berlin Heidelberg) 1995.[41] Doremus R. H., Glass Science (John Wiley, New York, USA) 1973.[42] Yang L., Osborne D. J., R. F. Haglund Jr., Magruder III R. H., White C. W.,
Zuhr R. A. and Hosono H., Appl. Phys. A, 62 (1996) 403.[43] Ironside C. N., Contemp. Phys., 34 (1993) 1.[44] Haglund Jr. R. F., Yang L., Magruder III R. H., White C. W., Zuhr R. A.,
Yang L., Dorsinville R. and Alfano R. R., Nucl. Instrum. Methods B, 91 (1994)493.
[45] Skelland N. and Townsend P., Nucl. Instrum. Methods B, 93 (1994) 433.[46] Stepanov A. L. and Hole D. E., Recent Res. Devel. Appl. Phys., 5 (2002) 1.[47] Meldrum A., Haglund Jr. R. F., Boatner L. A. and White C. W., Adv. Mater.,
13 (2001) 1431.[48] Mattei G., De Marchi G., Mazzoldi P., Sada C., Bello V. and Battaglin G.,
Phys. Rev. Lett., 90 (2003) 085502/1.[49] Battaglin G., Cattaruzza E., Gonella F., Mattei G., Mazzoldi P., Sada C. and
Zhang X., Nucl. Instrum. Methods B, 166-167 (2000) 857.[50] Magruder III R. H. and Zuhr R. A., J. Appl. Phys., 77 (1995) 3546.
66 P. MAZZOLDI and G. MATTEI
[51] Magruder III R. H., Anderson T. S., Zuhr R. A. and Thomas D. K., Nucl. Instrum.Methods B, 108 (1996) 305.
[52] Anderson T. S., Magruder III R. H., D. L. Kinser, Zuhr R. A. and Thomas D.
K., Nucl. Instrum. Methods. B, 124 (1997) 40.[53] D’Acapito F., Mobilio S., Gonella F., Maurizio C., Mazzoldi P., Battaglin G.,
Cattaruzza E. and Zontone F., Euro. Phys. J. D, 10 (2000) 123.[54] Gonella F., Cattaruzza E., Battaglin G., D’Acapito F., Sada C., Mazzoldi P.,
Maurizio C., Mattei G., Martorana A., Longo A. and Zontone F., J. Non-Cryst.Solids, 280 (2001) 241.
[55] Falconieri M., Salvetti G., Cattaruzza E., Gonella F., Mattei G., Mazzoldi
P., Piovesan M., Battaglin G. and Polloni R., Appl. Phys. Lett., 73 (1998) 288.[56] Cattaruzza E., Battaglin G., Gonella F., Polloni R., Mattei G., Maurizio C.,
Mazzoldi P., Sada C., Tosello C., Montagna M. and Ferrari M., Philos. Mag. B,82 (2002) 735.
[57] de Julian Fernandez C., Sangregorio C., Mattei G., De G., Saber A., Russo S.
L., Battaglin G., Catalano M., Cattaruzza E., Gonella F., Gatteschi D. andMazzoldi P., Mater. Sci. Eng. C, 15 (2001) 59.
[58] de Julian Fernandez C., Sangregorio C., Mattei G., Battaglin G., Cattaruzza
E., Gonella F., Russo S. L., D’Orazio F., Lucari F., De G., Gatteschi D. andMazzoldi P., J. Mag. Mag. Mater., 226-230 (2001) 1912.
[59] White C., Withrow S., Budai J., Boatner L., Sorge K., Thompson J., Beaty K.
and Meldrum A., Nucl. Instrum. Methods B, 191 (2002) 437.[60] Cattaruzza E., D’Acapito F., de Julian Fernandez C., Lorenzi A. D., Gonella
F., Mattei G., Maurizio C., Mazzoldi P., Padovani S., Scremin B. and Zontone
F., Nucl. Instrum. Methods B, 191 (2002) 406.[61] Battaglin G., Cattaruzza E., De Marchi G., Gonella F., Mattei G., Maurizio
C., Mazzoldi P., Parolin A., Sada C. and Calliari I., Nucl. Instrum. Methods B,191 (2002) 392.
[62] Borsella E., Dal Toe S., Mattei G., Maurizio C., Mazzoldi P., Saber A.,Battaglin G., Cattaruzza E., Gonella F., Quaranta A. and D’Acapito F., Mater.Sci. Eng. B, 82 (2001) 148.
[63] Borsella E., Garcia M., Mattei G., Maurizio C., Mazzoldi P., Cattaruzza E.,Gonella F., Battaglin G., Quaranta A. and D’Acapito F., J. Appl. Phys., 90(2001) 4467.
[64] Borsella E., de Julian Fernandez C., M. Garcia, Mattei G., Maurizio C.,Mazzoldi P., Padovani S., Sada C., Battaglin G., Cattaruzza E., Gonella F.,Quaranta A., D’Acapito F., Tagliente M. and Tapfer L., Nucl. Instrum. MethodsB, 191 (2002) 447.
[65] Heinig K. H., Schmidt B., Markwitz A., R. Grotzschel, Strobel M. and Oswald
S., Nucl. Instrum. Methods B, 148 (1999) 969.[66] Ila D., Williams E. K., Sarkisov S., Smith C. C., Poker D. B. and Hensley D.
K., Nucl. Instrum. Methods B, 141 (1998) 289.[67] Collins D. R., Schroder D. K. and Sah C. T., Appl. Phys. Lett., 8 (1966) 323.[68] Miotello A., De Marchi G., Mattei G., Mazzoldi P. and Sada C., Phys. Rev. B,
63 (2001) 075409.[69] Arnold G. W. and Borders J. A., J. Appl. Phys., 48 (1977) 1488.[70] Lifshitz I. M. and Slezof V. V., Zh. Eksp. Teor. Fiz., 35 (1958) 479.[71] Yukselici H., Persans P. D. and Hayes T. M., Phys. Rev. B, 52 (1995) 11763.[72] Gurevich S. A., Ekimov A. I., Kudrayavtsev I. A., Lyublinskaya O. G., Osinnskii
A. V., Usikov A. S. and Faleev N. N., Semicond., 28 (1994) 486.[73] Wagner C., Z. Elektrochem., 65 (1961) 581.[74] Johnson P. B. and Christy R. W., Phys. Rev. B, 6 (1972) 4370.[75] Battaglin G., Della Mea G., De Marchi G., Mazzoldi P. and Miotello A., Nucl.
Instrum. Methods B, 7/8 (1985) 517.
POTENTIALITIES OF ION IMPLANTATION FOR THE SYNTHESIS AND MODIFICATION ETC. 67
[76] Arnold G., Battaglin G., Della Mea G., De Marchi G., Mazzoldi P. andMiotello A., Nucl. Instrum. Methods B, 32 (1988) 315.
[77] Lamkin M. A., Riley F. L. and Fordham R. J., J. Eur. Ceram. Soc., 10 (1992) 347.[78] Norton F., Nature, 191 (1961) 701.[79] Biersack J. P. and Haggmark L. G., Nucl. Instrum. Methods B, 174 (1980) 257.[80] Devine R. A. B., Nucl. Instrum. Methods B, 91 (1994) 378.[81] Dienes G. J. and Damask A. C., J. Appl. Phys., 29 (1958) 1713.[82] Griscom D. L., Nucl. Instrum. Methods B, 1 (1984) 481.[83] Aaron H. B., Fainstein D. and Kotler G. R., J. Appl. Phys., 41 (1970) 4404.[84] Buffat P. and Borel J.-P., Phys. Rev. A, 13 (1976) 2287.[85] Heilmann A., Polymer Films with Embedded Metal Nanoparticles (Springer Ed., Berlin)
2003.[86] Cioffi N., Farella L., Torsi I., Valentini A. and Tafuri A., Sensors and Actuators
B, 84 (2002) 49.[87] Stepanov A. L., Metal-Polymer Nanocomposites, edited by Nicolais L. and
Carotenuto G. (Willey J. Sons, Chichester) 2004, pp. 241-263.[88] Stepanov A. L., Techn. Phys., 49 (2004) 143.[89] Ruk D. M., Schulz J. and Deusch N., Nucl. Instrum. Methods B, 131 (1997) 149.[90] Lee E. A., Nucl. Instrum. Methods B, 151 (1999) 29.[91] Umeda N., Bandourko V. V., Vasilets V. N. and Kishimoto N., Nucl. Instrum.
Methods B, 206 (2003) 657.[92] Hegazy E.-S. A., Sasuga T., Nishii M. and Seguchi T., Polymer, 33 (1992) 2094.[93] Kobayashi T., Iwata T., Doi Y. and Iwaki M., Nucl. Instrum. Methods B, 175-177
(2001) 584.[94] Maggioni G., Carturan S., Rigato V. and Della Mea G., Surf. Coat. Technol.,
142-144 (2001) 156.[95] Kobayashi T., Nakao A. and Iwaki M., Surf. Coat. Technol., 158-159 (2002) 108.[96] Popok V. N., Khaibullin R. I., Toth A., Beshliu V., Hnatowicz V. and Mackova
A., Surf. Sci., 532-535 (2003) 1034.[97] Guenther M., Gerlach G., Suchaneck G., Sahre K., Eichhorn K. J., Wolf B.,
Deineka A. and Jastrabik L., Surf. Coat. Technol, 158-159 (2002) 108.[98] Hernandez J., Lucia M., Martil I., Gonzalez-Diaz G., Santamaria J. and
Sanchez-Quesada F., Appl. Opt., 31 (1992) 1606.[99] de Julian Fernandez C., Manera M. G., Spadavecchia J., Maggioni G.,
Quaranta A., Mattei G., Bazzan M., Cattaruzza E., Bonafini M., Negro E.,Vomiero A., Carturan S., Scian C., Mea G. D., Rella R., Vasanelli L. andMazzoldi P., Sensors and Actuators B, 111 (2005) 225.
[100] Yasuda H. and Mori H., Z. Phys. D, 31 (1994) 131.[101] Battaglin G., Catalano M., Cattaruzza E., D’Acapito F., De Julian Fernandez
C., De Marchi G., Gonella F., Mattei G., Maurizio C., Mazzoldi P., Miotello
A. and Sada C., Nucl. Instrum. Methods B, 178 (2001) 176.[102] de Julian Fernandez C., Mattei G., Battaglin G., Maurizio C., Mazzoldi P. and
Scian C., Nucl. Instrum. Methods B, in press.[103] de Julian Fernandez C., Tagliente M., Mattei G., Sada C., Bello V., Maurizio
C., Battaglin G., Sangregorio C., Gatteschi D., Tapfer L. and Mazzoldi P.,Nucl. Instrum. Methods B, 216 (2004) 245.
[104] Mattei G., Battaglin G., Bello V., Cattaruzza E., Fernandez C. D. J., De
Marchi G., Maurizio C., Mazzoldi P., Parolin M. and Sada C., Nucl. Instrum.Methods B, 218 (2004) 433.
[105] de Julian Fernandez C., Mattei G., Sangregorio C., Tagliente M., Bello V.,Battaglin G., Sada C., Tapfer L., Gatteschi D. and Mazzoldi P., J. Non-Cryst.Solids, 345-346 (2004) 681.
[106] Mattei G., Maurizio C., Mazzoldi P., D’Acapito F., Battaglin G., Cattaruzza
E., de Julian Fernandez C. and Sada C., Phys. Rev. B, 71 (2005) 195418.

68 P. MAZZOLDI and G. MATTEI
[107] Cattaruzza E., D’Acapito F., Gonella F., Longo A., Martorana A., Mattei G.,Maurizio C. and Thiaudiere D., J. Appl. Cryst., 33 (2000) 740.
[108] de Julian Fernandez C., Sangregorio C., Mattei G., Maurizio C., Battaglin G.,Gonella F., Lascialfari A., Lo Russo S., Gatteschi D., Mazzoldi P., Gonzalez
J. and D’Acapito F., Nucl. Instrum. Methods B, 175-177 (2001) 479.[109] Bertoncello R., Gross S., Trivillin F., Caccavale F., Cattaruzza E., Mazzoldi
P., Mattei G., Battaglin G. and Daolio S., J. Mater. Res., 14 (1999) 2449.[110] Okamoto H., Chakrabarti D. J., Laughlin D. E. and Massalski T. B., Phase
Diagrams of Binary Gold Alloys. Monograph Series on Alloy Phase Diagrams (ASMInternational T.M. Metals Park, Ohio 44073) 1987.
[111] Battaglin G., Cattaruzza E., De Julian Fernandez C., De Marchi G., Gonella
F., Mattei G., Maurizio C., Mazzoldi P., Miotello A., Sada C. and D’Acapito
F., Nucl. Instrum. Methods B, 175-177 (2001) 410.[112] Yasuda H., Mitsuishi K. and Mori H., Phys. Rev. B, 64 (2001) 094101.[113] Mazzoldi P., Tramontin L., Boscolo-Boscoletto A., Battaglin G. and Arnold
G. W., Nucl. Instrum. Methods B, 80/81 (1993) 1192.[114] Caccavale F., De Marchi G., Gonella F., Mazzoldi P., Meneghini C., Quaranta
A., Arnold G., Battaglin G. and Mattei G., Nucl. Instrum. Methods B, 96 (1995)382.
[115] Maurizio C., Gonella F., Cattaruzza E., Mazzoldi P. and D’Acapito F., Nucl.Instrum. Methods B, 200 (2003) 126.
[116] Maurizio C., Mattei G., Mazzoldi P., Padovani S., Cattaruzza E., Gonella F.,D’Acapito F. and Zontone F., Nucl. Instrum. Methods B, 200 (2003) 178.
[117] Massalski B., Binary Alloy Phase Diagrams (American Society for Metals, Metals Park,Ohio 44073) 1987.
[118] De G., Gusso M., Tapfer L., Catalano M., Gonella F., Mattei G., Mazzoldi P.
and Battaglin G., J. Appl. Phys., 80 (1996) 6734.[119] Uchida K., Kaneko S., Omi S., Hata C., Tanji H., Asahara Y., Ikushima A.,
Tokizaki T. and Nakamura A., J. Opt. Soc. Am. B, 11 (1994) 1236.[120] Sheik-Bahae M., Said A. A., Wei T. H., Hagen D. and Van Stryland E. W., IEEE
J. Quantum Electron., 26 (1990) 760.[121] Wang J., Sheik-Bahae M., Said A. A., Hagen D. J. and Van Stryland E. W., J.
Opt. Soc. Am. B, 11 (1994) 1009.[122] Van Stryland E. W. and Sheik-Bahae M., Materials Characterization and Optical
Probe Techniques, edited by R. A. Lessard and Franke H., Vol. CR96 (SPIE,Bellingham 1997) 1997.
[123] Cattaruzza E., Battaglin G., Gonella F., Mattei G., Mazzoldi P., Polloni R.
and Scremin B., Appl. Surf. Sci., 247 (2005) 390.[124] Pincon-Roetzinger N., Prot D., Palpant B., Charron E. and Debrus S., Mater.
Sci. Eng. C, 19 (2002) 51.[125] Prez-Arantegui J., Molera J., Larrea A., Pradell T., Vendrell-Saz M., Borgia
I., Brunetti B., Cariati F., Fermo P., Mellini M., Sgamellotti A. and Viti C.,J. Am. Ceram. Soc., 84 (2001) 442.
[126] Borgia L., Brunetti B., Sgamellotti A., Mariani I., Cariati F., Fermo P.,Mellini M. and Viti C., Appl. Surf. Sci., 185 (2002) 206.
[127] Padovani S., Sada C., Mazzoldi P., Brunetti B., Borgia L., Sgamellotti A.,Giulivi A., D’Acapito F. and Battaglin G., J. Appl. Phys., 93 (2003) 10058.
[128] Padovani S., Borgia L., Brunetti B., Sada C., Sgamellotti A., Giulivi A.,D’Acapito F., Mazzoldi P., Sada C. and Battaglin G., Appl. Phys. A, 79 (2004)229.
[129] De G., Mattei G., Mazzoldi P., Sada C. and Battaglin G., Chem. Mater., 75 (1999)55.
[130] Mattei G., de Julin Fernndez C., Mazzoldi P., Sada C., De G., Battaglin G.,Sangregorio C. and Gatteschi D., Chem. Mater., 14 (2002) 3440.
[131] Nishizawa T. and Ishida K., Bull. Phase Diagrams, 5 (1984) 1.
POTENTIALITIES OF ION IMPLANTATION FOR THE SYNTHESIS AND MODIFICATION ETC. 69
[132] Childress J. R. and Chien C. L., Phys. Rev. B, 43 (1991) 8089.[133] Noetzel J., Handstein A., Mucklich A., Prockert F., Reuther H., Thomas J.,
Wieser E. and Moller W., J. Mag. Mag. Mater., 205 (1999) 183.[134] Zontone F., D’Acapito F. and Gonella F., Nucl. Instrum. Methods B, 147 (1999)
421.[135] Garrido F., Dran J.-C., Thorne L., Meneghini C., Gonella F. and Quaranta A.,
Nucl. Instrum. Methods B, 115 (1996) 561.[136] Pivin J. C. and Rizza G., Thin Solid Films, 366 (2000) 284.[137] De Marchi G., Gonella F., Mazzoldi P., Battaglin G., Knystautas E. J. and
Meneghini C., J. Non-Cryst. Solids, 196 (1996) 79.[138] Gonella F., Knystautas E., Mattei G., Mazzoldi P., Meneghini C., Cattaruzza
E., Garrido F. and Osborne D. Jr., Nucl. Instrum. Methods B, 127 (1997) 562.[139] Mazzoldi P., Padovani S., Enrichi F., Mattei G., Sada C., Trave E., Guglielmi
M., Martucci A., Battaglin G., Cattaruzza E., Gonella F. and Maurizio C.,Proc. SPIE, 5451 (2004) 311.
[140] Strohhofer C. and Polman A., J. Appl. Phys., 90 (2001) 4314.[141] Kik P., Brongersma M. and Polman A., Appl. Phys. Lett., 76 (2000) 2325.[142] Franzo G., Iacona F., Vinciguerra V. and Priolo F., Mater. Sci. Eng. B, 69-70
(2000) 335.[143] Borsella E., Gonella F., Mazzoldi P., Quaranta A., Battaglin G. and Polloni
R., Chem. Phys. Lett., 284 (1998) 429.[144] Strohhofer C. and Polman A., Appl. Phys. Lett., 81 (2002) 1414.[145] Managaki M. F. N., Fujii M., Yanagi H. and Hayashi S., J. Appl. Phys., 98 (2005)
024316.[146] Skelland N. and Townsend P., J. Non-Cryst. Solids, 188 (1995) 243.[147] White C., Budai J., Zhu J., Withrow S., Hembree D., Henderson D., Ueda A.,
Tung Y. and Mu R., Mater. Res. Soc. Symp. Proc., 396 (1996) 377.[148] Meldrum A., Boatner L. and White C., Nucl. Instrum. Methods B, 178 (2001) 7.[149] Erlebacher J., Aziz J. M., Karma A., Dimitrov N. and Sieradzki K., Nature, 410
(2001) 450.[150] Cahn R. W., Nature, 389 (1997) 121.[151] Arnold G. W., Battaglin G., Boscolo-Boscoletto A., Caccavale F., De Marchi
G. and Mazzoldi P., Mater. Res. Soc. Symp. Proc., 235 (1992) 407.[152] Smithells C. and Brandes E. (Editors), Metals Reference Book (Butterworths,
London) 1976, 5th ed.[153] Pivin J. C., Mater. Sci. Eng. A, 293 (2000) 30.[154] Rizza G., Strobel M., Heining K. H. and Bernas H., Nucl. Instrum. Methods B, 178
(2001) 78.[155] Nastasi M., Mayer J. W. and Hirvonen J. K. (Editors), Ion-solid Interactions:
Fundamentals and Applications (Cambridge University Press) 1996.[156] Lindhard J., Nielsen V., Scharff M. and Thomsen P., (Notes on Atomic Collisions
III) Mat. Fys. Medd. Dan Vid. Selsk., 33 (1963).[157] Kinchin G. and Pease R., Rep. Prog. Phys., 18 (1955) 1.[158] Hultgren R., Orr R. L., Anderson P. and Kelley K. K., Selected Values of
Thermodynamic Properties of Metals and Alloys (John Wiley and Sons, Inc.) 1963.[159] Frenkel A. I., Machavariani V. S., Rubshtein A., Rosenberg Y., Voronel A. and
Stern E. A., Phys. Rev. B, 62 (2000) 9364.[160] Foiles S. M., Baskes M. I. and Daw M. S., Phys. Rev. B, 33 (1986) 7983.[161] Bello V., Marchi G. D., Maurizio C., Mattei G., Mazzoldi P., Parolin M. and
Sada C., J. Non-Cryst. Solids, 345-346 (2004) 685.[162] Hosono H. and Matsunami N., Nucl. Instrum. Methods B, 141 (1998) 566.[163] De Marchi G., Mattei G., Mazzoldi P., Sada C. and Miotello A., J. Appl. Phys.,
92 (2002) 4249.